Economic Modeling Working Group (EMWG) Activities · 2015-06-05 · 3rd GIF Symposium, Makuhari...
25
Economic Modeling Working Group (EMWG) Activities Ramesh Sadhankar on behalf of GIF EMWG 3rd GIF Symposium, Makuhari Messe, Chiba, Japan, 19 May 2015
Transcript of Economic Modeling Working Group (EMWG) Activities · 2015-06-05 · 3rd GIF Symposium, Makuhari...

Economic Modeling Working Group
(EMWG) Activities
Ramesh Sadhankar on behalf of GIF EMWG
3rd GIF Symposium, Makuhari Messe, Chiba, Japan, 19 May 2015

3rd GIF Symposium, Makuhari Messe, Chiba, Japan, 19 May 2015 Slide 2
Outline of the Presentation
GIF Economic Goals and EMWG methodologies
Recent application of EMWG cost estimation guidelines
Recent example of benchmarking EMWG tool G4-ECONS
with IAEA’s NEST
Path Ahead

3rd GIF Symposium, Makuhari Messe, Chiba, Japan, 19 May 2015 Slide 3
EMWG Mandate
EMWG was established in 2003 to create economic models
and guidelines for assessment of Gen IV systems with respect
to GIF economic goals:
GIF economic goals
To have a life cycle cost advantage over other energy
sources (i.e. to have lower levelized unit cost of energy
on average over the lifetime)
To have a level of financial risk comparable to other
energy projects (i.e., to involve similar total capital
investment and capital at risk)

3rd GIF Symposium, Makuhari Messe, Chiba, Japan, 19 May 2015 Slide 4
EMWG Products
Cost Estimating Guidelines for Generation IV Nuclear Energy
Systems Revision 4.2
Spreadsheet (EXCEL-based) model, i.e., G4-ECONS
(Generation 4-EXCEL Calculation Of Nuclear Systems) Ver 2.0
User’s Manual for G4-ECONS Ver. 2.0
Available on a CD-ROM from the GIF Secretariat, Nuclear Energy
Agency, OECD

3rd GIF Symposium, Makuhari Messe, Chiba, Japan, 19 May 2015 Slide 5
The GIF Economic Figures of Merit
1. Levelized Unit Energy Cost (LUEC)
2. Capital-at-Risk /Total Capital Investment Cost (TCIC)
The Cost Estimating Guidelines define what is to be
included in calculation of TCIC and LUEC
G4-ECONS calculates TCIC and LUEC

3rd GIF Symposium, Makuhari Messe, Chiba, Japan, 19 May 2015 Slide 6
Application of GIF Cost Estimation Guidelines

3rd GIF Symposium, Makuhari Messe, Chiba, Japan, 19 May 2015 Slide 7
GIF Guidelines - Cost Estimation Techniques
“Bottom-Up Approach”
Detailed cost estimating technique for mature designs
“Top-Down Approach”
Cost estimating technique for systems with less advanced
design detail

3rd GIF Symposium, Makuhari Messe, Chiba, Japan, 19 May 2015 Slide 8
Recent Application of Top-down Cost Estimation Technique for Canadian SCWR Concept Grid Power : ~1,200 MWe
Pressure-tube type, heavy
water moderated
Thermodynamic Efficiency:
~47%
Direct cycle SC steam
turbine
Outlet Conditions: 25.0
MPa, 625ºC
Th/Pu or Th/U MOx fuel

3rd GIF Symposium, Makuhari Messe, Chiba, Japan, 19 May 2015 Slide 9
Top Down Cost Estimating Requirements
Requires availability of reference plant cost data and
associated plant characteristics
Uses cost factors for adjusting reference costs
(e.g. containment building M3, pump capacity in kW etc.)
Unique design features may require conceptual designs with a
Bottom-Up approach (e.g. molten salt heat exchanger,
pressure tubes for SCWR )
3rd GIF Symposium, Makuhari Messe, Chiba, Japan, 19 May 2015 Slide 10
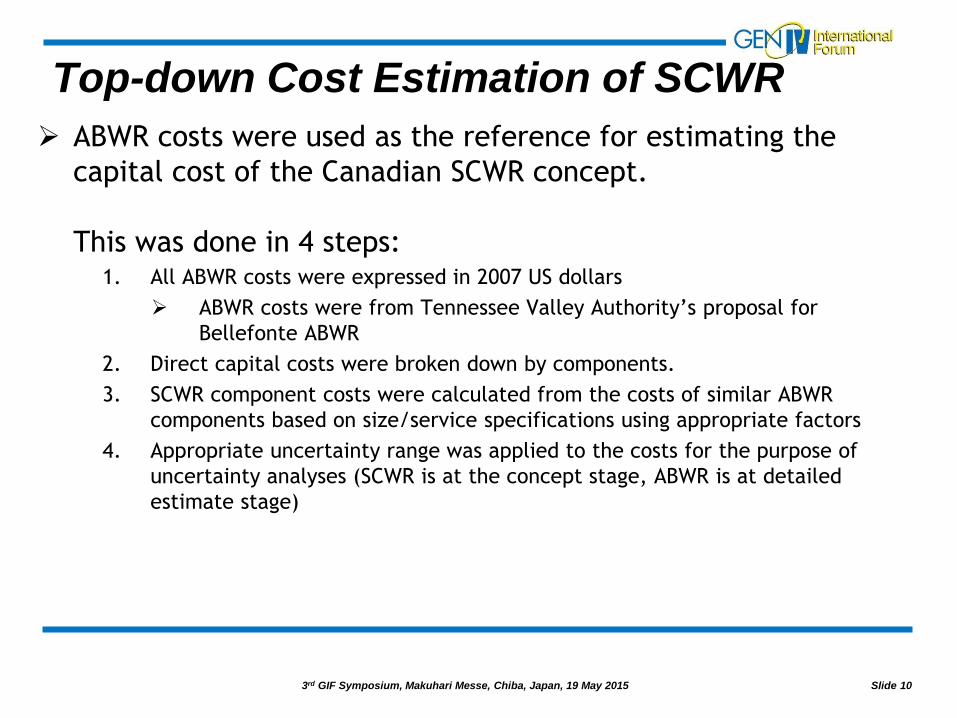
Top-down Cost Estimation of SCWR
ABWR costs were used as the reference for estimating the
capital cost of the Canadian SCWR concept.
This was done in 4 steps: 1. All ABWR costs were expressed in 2007 US dollars
ABWR costs were from Tennessee Valley Authority’s proposal for
Bellefonte ABWR
2. Direct capital costs were broken down by components.
3. SCWR component costs were calculated from the costs of similar ABWR
components based on size/service specifications using appropriate factors
4. Appropriate uncertainty range was applied to the costs for the purpose of
uncertainty analyses (SCWR is at the concept stage, ABWR is at detailed
estimate stage)

3rd GIF Symposium, Makuhari Messe, Chiba, Japan, 19 May 2015 Slide 11
ABWR
Output – 1,371 MWe
(SCWR – 1,177 MWe)
Operating pressure – 7.2
MPa
Feed water – 215⁰ C
Direct cycle steam
turbine
Secondary containment
Toshiba Corp., GE Company, USEC, Bechtel Power Corp, & Global Nuclear Fuel (2005). “ABWR Cost/Schedule/COL Project at TVA’s Bellefonte Site”, Tennessee Valley Authority (TVA), Tennessee US.

3rd GIF Symposium, Makuhari Messe, Chiba, Japan, 19 May 2015 Slide 12
Example: Derivation of SCWR costs from SCWR/ABWR Comparison
ABWR Containment Building:
Reinforced concrete structure.
Contains: reactor, suppression pool,
reactivity control mechanism and
safety systems.
Circular with a volume = 23,800 m3,
29m diameter and 36m high.
Design containment pressure = 3.1
bar.
SCWR Containment Building:
Reinforced concrete structure that is
missile hardened.
Contains: reactor, suppression pool,
reactivity control mechanism and safety
systems.
Circular with a volume = 15,700 m3, 25m
diameter and 32m high.
Design containment pressure = 5 bar.
Result: The SCWR building is 35% smaller than the ABWR, but the walls are 40%
thicker due to higher containment pressure. The result is a 6% ($23 M) more cost for
SCWR compared to ABWR.

3rd GIF Symposium, Makuhari Messe, Chiba, Japan, 19 May 2015 Slide 13
Total Capital Investment Cost
TCIC = Overnight capital Cost + Interest during
construction
Uncertainties Overnight Costs
GIF guidelines recommend minimum contingency range -30%
to +50% for concept stage (-15% to +20% for ABWR)
Includes first fuel load
Real discount rate (3% to 10%)
Construction time (assumed 4 years fixed in this case)

3rd GIF Symposium, Makuhari Messe, Chiba, Japan, 19 May 2015 Slide 14
SCWR TCIC Uncertainty

3rd GIF Symposium, Makuhari Messe, Chiba, Japan, 19 May 2015 Slide 15
Capital Cost Comparison
Capital Costs of Gen IV SCWR and Gen III+ ABWR are comparable
ABWR costs could be higher with post-Fukushima upgrades

3rd GIF Symposium, Makuhari Messe, Chiba, Japan, 19 May 2015 Slide 16
G4-ECONS Benchmarking

3rd GIF Symposium, Makuhari Messe, Chiba, Japan, 19 May 2015 Slide 17
G4-ECONS Assumptions
Capital costs for NOAK – distributed as per S-curve during
construction period
Construction period in multiples of quarters (e.g. 5.25 years),
interest calculated on quarterly basis
The same real (inflation-free)discount rate used for construction
financing, capital amortization and D&D escrow fund accumulation
Amortization life of the plant is the same as the operational life
Annual power production/capacity factor same over the plant life
Fuel cycle:
Only two types of fuel loads – initial core and reload
Unit costs of fuel cycle services constant over plant life
» No material losses in fuel cycle steps
» No lag and lead times

3rd GIF Symposium, Makuhari Messe, Chiba, Japan, 19 May 2015 Slide 18
HPLWR - 1000MWe
Analyzed with G4ECONS
Analysis compared with
NEST model developed
by INPRO-IAEA
HPLWR Economics Benchmarking (European SCWR )
Ref: High Performance Light Water Reactor Design and
Analyses,
Thomas Schulenberg // Jörg Starflinger (eds.), KIT scientific
Publishing, 2012
http://digbib.ubka.uni-karlsruhe.de/voltexte/1000025989

3rd GIF Symposium, Makuhari Messe, Chiba, Japan, 19 May 2015 Slide 19
Sensitivity Analysis: G4-ECONS LUEC
Sensitivity analysis on: operation life, years to construct, real discount
rate, capital costs, and non-fuel operating costs was performed.
80% confidence interval for LUEC was calculated as $42/MWh to $59/MWh
This aligns with the HPLWR estimate of $24/MWh to $62/MWh
3rd GIF Symposium, Makuhari Messe, Chiba, Japan, 19 May 2015 Slide 20
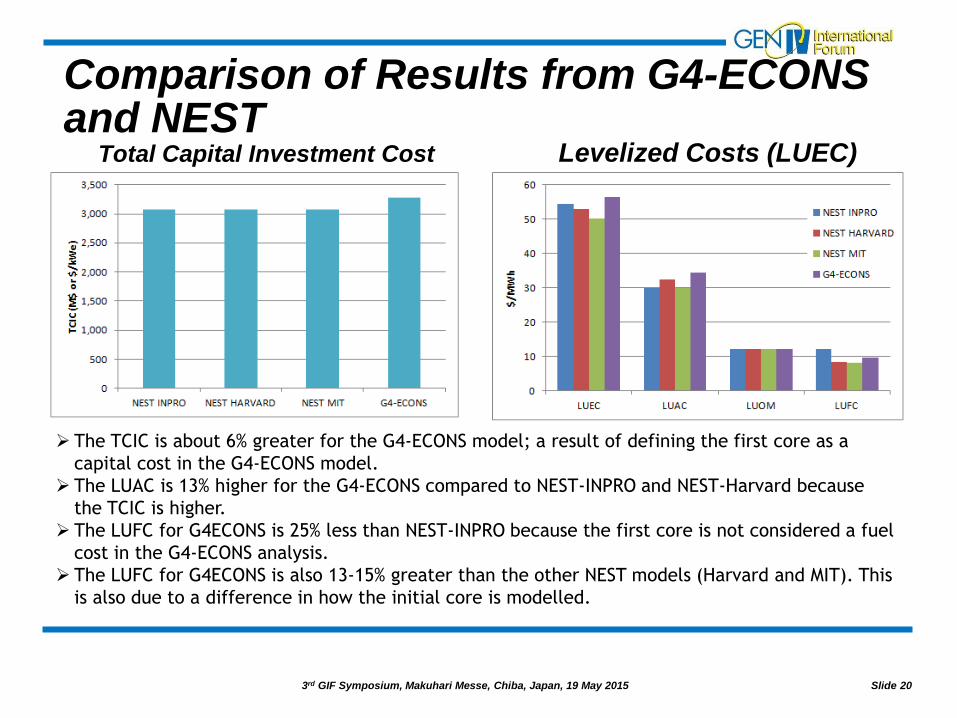
Comparison of Results from G4-ECONS and NEST
Total Capital Investment Cost Levelized Costs (LUEC)
The TCIC is about 6% greater for the G4-ECONS model; a result of defining the first core as a
capital cost in the G4-ECONS model.
The LUAC is 13% higher for the G4-ECONS compared to NEST-INPRO and NEST-Harvard because
the TCIC is higher.
The LUFC for G4ECONS is 25% less than NEST-INPRO because the first core is not considered a fuel
cost in the G4-ECONS analysis.
The LUFC for G4ECONS is also 13-15% greater than the other NEST models (Harvard and MIT). This
is also due to a difference in how the initial core is modelled.

3rd GIF Symposium, Makuhari Messe, Chiba, Japan, 19 May 2015 Slide 21
Conclusion from the first Benchmarking Exercise
For once-through fuel cycles, NEST Version 1 and
G4-ECONS produce very similar results (minor differences
could be explained)
Further economic assessments of fast reactor systems
operating in closed fuel cycles would provide a valuable
bench mark

3rd GIF Symposium, Makuhari Messe, Chiba, Japan, 19 May 2015 Slide 22
Three Modules of G4-ECONS
The “Reactor Cost” Module
Calculates TCIC and LUEC for electricity and/or heat
The “Nuclear Heat Applications” Module
Calculates levelized cost of other products, such as the cost
of hydrogen or desalinated water, based on LUEC
The “Fuel Cycle Facilities” Module
Calculates levelized costs of fuel cycle products and
services; results are used to calculate LUEC
3rd GIF Symposium, Makuhari Messe, Chiba, Japan, 19 May 2015 Slide 23
Extent of G4-ECONS Applications
Over 200 CD-ROMs requested from NEA
Several papers based on G4-ECONS analyses have been
published
G4-ECONS and cost estimation methodologies
demonstrated for
Gen III and Gen III+ systems – HWR, LWR
Gen IV systems – SCWR, Japanese SFR, GT-MHR
Hydrogen and process heat – GT-MHR, PH-MHR
Fuel Cycle Facility costing
3rd GIF Symposium, Makuhari Messe, Chiba, Japan, 19 May 2015 Slide 24
Path Ahead Next Version of G4-ECONS to be released soon for beta-
testing. Improvements include
Uncertainty analysis (uncertainties in multiple inputs of
capital and operating costs)
Streamlined user interface
Simplify data entry
Clarify uncertainty analysis outputs
Continue collaboration with IAEA
Benchmarking of G4-ECONS with INPRO’s NEST for
fast reactors in closed fuel cycle
Outreach – promoting use of G4-ECONS amongst GIF
community and beyond

3rd GIF Symposium, Makuhari Messe, Chiba, Japan, 19 May 2015 Slide 25
Questions ?