Economic impacts of the COVID-19 pandemic: State perspectives
13
1 Contact: Robin Fretwell Wilson, Director, IGPA: (217) 244-1227 Institute of Government and Public Affairs Task Force on the Impact of the COVID-19 Pandemic At the request of President Tim Killeen, IGPA has assembled more than four dozen interdisciplinary faculty experts from all three System universities to assess COVID-19’s effects on the state. Assessments focus on three impact groups: Economic and Fiscal Health, Community and Family Resilience, and the Health Care Workforce. Each group is collaborating on a series of modeling activities, data analyses, and syntheses of impact. This report is the second from the Economic and Fiscal Health Impact Group, drawing on the strength of 26 scholar-signatories. Economic impacts of the COVID-19 pandemic: State perspectives Economic and Fiscal Health Impact Group May 27, 2020 Faculty Leads Geoffrey J.D. Hewings, Scholar Emeritus, Institute of Government and Public Affairs, University of Illinois System; Director Emeritus Regional Economics Applications Laboratory, University of Illinois at Urbana-Champaign Kenneth Kriz, Affiliate, Institute of Government and Public Affairs, University of Illinois System; University Distinguished Professor of Public Administration and Director, Institute for Illinois Public Finance, University of Illinois at Springfield David Merriman, Senior Scholar, Institute of Government and Public Affairs, University of Illinois System; James J. Stukel Presidential Professor of Public Administration, University of Illinois at Chicago EXECUTIVE SUMMARY T he economic disruption associated with the COVID-19 pandemic came on suddenly and is quite severe. Because much economic data lags actual events by weeks or months, it is still too early to have a complete picture of the economic damage from the first wave of the pandemic, but we can begin the analysis. We know that the recession has already caused a nearly unprecedented rise in the lev- el of unemployment and that Illinois experienced an economic shock
Transcript of Economic impacts of the COVID-19 pandemic: State perspectives

1Contact: Robin Fretwell Wilson, Director, IGPA: (217) 244-1227
Institute of Government and Public AffairsTask Force on the Impact of the COVID-19 Pandemic
At the request of President Tim Killeen, IGPA has assembled more than four dozen interdisciplinary faculty experts from all three System universities to assess COVID-19’s effects on the state. Assessments focus on three impact groups: Economic and Fiscal Health, Community and Family Resilience, and the Health Care Workforce. Each group is collaborating on a series of modeling activities, data analyses, and syntheses of impact.
This report is the second from the Economic and Fiscal Health Impact Group, drawing on the strength of 26 scholar-signatories.
Economic impacts of the COVID-19 pandemic: State perspectivesEconomic and Fiscal Health Impact Group May 27, 2020
Faculty Leads
Geoffrey J.D. Hewings, Scholar Emeritus, Institute of Government and Public Affairs, University of Illinois System; Director Emeritus Regional Economics Applications Laboratory, University of Illinois at Urbana-Champaign
Kenneth Kriz, Affiliate, Institute of Government and Public Affairs, University of Illinois System; University Distinguished Professor of Public Administration and Director, Institute for Illinois Public Finance, University of Illinois at Springfield
David Merriman, Senior Scholar, Institute of Government and Public Affairs, University of Illinois System; James J. Stukel Presidential Professor of Public Administration, University of Illinois at Chicago
EXECUTIVE SUMMARY
The economic disruption associated with the COVID-19 pandemic came on suddenly and is quite severe. Because much economic data lags actual events by weeks or months, it is still too early to
have a complete picture of the economic damage from the first wave of the pandemic, but we can begin the analysis. We know that the recession has already caused a nearly unprecedented rise in the lev-el of unemployment and that Illinois experienced an economic shock
2Contact: Robin Fretwell Wilson, Director, IGPA: (217) 244-1227
that parallels the national economic shock. This is unlike the Great Recession of 2007-2009, when the recession evolved slowly and Illinois entered the re-cession after most of the Midwest and the U.S. How-ever, like past recessions, Illinois may see a smaller decline and perhaps even increases in some sectors. For example, it is quite possible that, despite the re-cession, many new businesses will be launched as the newly unemployed find creative ways to start new businesses. Although the economic disruption from the pandemic is highly concentrated in a few key sectors (Trade and Transportation, Professional and Business Services, and Leisure and Hospitality), our economic model forecasts that the disruption will spread through Illinois’ highly interconnected economy. The model estimates that each job lost directly to the recession will trigger about 0.38 additional job losses in connected industries. Recov-ery efforts will be challenged by this economic inter-connectedness. Even if public health conditions allow some businesses to be brought online, they will not be able to succeed unless up-stream suppliers can provide business inputs and downstream customers feel comfortable with engaging in eco-nomic activity.
HOW WILL THE COVID-19 PANDEMIC AFFECT THE ILLINOIS ECONOMY?
The current economic situation was caused by factors totally outside of the normal structure of the economy, making it unique. Past recessions stemmed from a financial crisis following an asset bubble or the Federal Reserve raising interest rates to combat inflation. But this time is truly different, the COVID-19 pandemic was not widely anticipat-ed. The economy seemed to be healthy as late as January of this year. But then the virus began to spread uncontrollably, and the response by deci-sion-makers to issue stay-at-home orders deliber-ately froze large swaths of economic activities. Our struggle to develop both public health and eco-nomic policies to best recover from the COVID-19 pandemic is complicated by the unusual nature of this crisis. The coronavirus is novel. It was previ-ously unknown. Medical experts are struggling to understand how contagious it is, how dangerous it is and to whom, whether and to what extent surviv-ing the disease confers immunity, what therapies may be available, and how long it will take to de-velop a vaccine. Like the disease that caused it, the economic downturn is novel in many dimensions and creates massive uncertainties. In this report, we present some early evidence about what has hap-pened thus far and, based on the best available but
admittedly slim current evidence, what we expect to happen with respect to Illinois’ economic activity over the next 12 months.
HOW IS THIS RECESSION DIFFERENT FROM PAST RECESSIONS? WHAT WE KNOW THUS FAR
Like the virus, the economic downturn arrived with astounding speed. Recent economic slides have taken months or even years to evolve. In the Great Depression, economic output and employment started to fall in 1929, but the economy did not hit bottom until 1932. The 1946-47 post-World War II
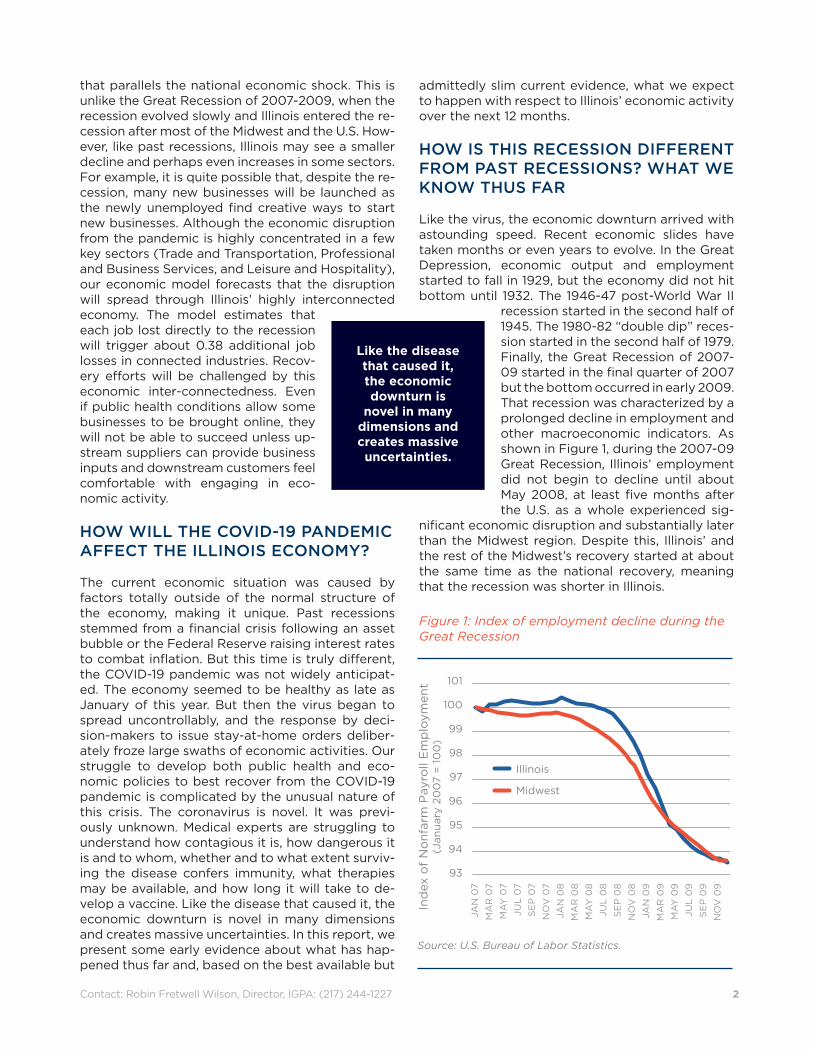
recession started in the second half of 1945. The 1980-82 “double dip” reces-sion started in the second half of 1979. Finally, the Great Recession of 2007-09 started in the final quarter of 2007 but the bottom occurred in early 2009. That recession was characterized by a prolonged decline in employment and other macroeconomic indicators. As shown in Figure 1, during the 2007-09 Great Recession, Illinois’ employment did not begin to decline until about May 2008, at least five months after the U.S. as a whole experienced sig-
nificant economic disruption and substantially later than the Midwest region. Despite this, Illinois’ and the rest of the Midwest’s recovery started at about the same time as the national recovery, meaning that the recession was shorter in Illinois.
JAN
07
MA
R 0
7M
AY
07
JUL
07
SE
P 0
7N
OV
07
JAN
08
MA
R 0
8M
AY
08
JUL
08
SE
P 0
8N
OV
08
JAN
09
MA
R 0
9M
AY
09
JUL
09
SE
P 0
9N
OV
09
Midwest
Illinois
Ind
ex o
f N
onf
arm
Pay
roll
Em
plo
ymen
t(J
anua
ry 2
00
7 =
10
0)
101
100
99
98
97
96
95
94
93
Figure 1: Index of employment decline during the Great Recession
Source: U.S. Bureau of Labor Statistics.
Like the disease that caused it, the economic downturn is
novel in many dimensions and creates massive uncertainties.

3 Contact: Robin Fretwell Wilson, Director, IGPA: (217) 244-1227
Weeks Since Onset of Increase-16 -8 0 8 16 24 32 40 48
Init
ial U
nem
plo
ymen
t C
laim
s 200,000
150,000
100,000
50,000
0
March 2020
October 2008
November 2009
Figure 2: Initial unemployment claims (Illinois)
Source: U.S. Department of Labor. Unemployment Insurance Weekly Claims Data. Retrieved May 10, 2020 from https://oui.doleta.gov/unemploy/claims.asp.
Weeks Since Onset of Increase-16 -8 0 8 16 24 32 40 48
Init
ial U
nem
plo
ymen
t C
laim
s
7,000,000
6,000,000
5,000,000
4,000,000
3,000,000
2,000,000
1,000,000
0
March 2020
October 2008
November 2009
Figure 3: Initial unemployment claims (U.S.)
Source: U.S. Department of Labor. Unemployment Insurance Weekly Claims Data. Retrieved May 10, 2020 from https://oui.doleta.gov/unemploy/claims.asp.
By contrast, the current crisis has been marked by an abrupt “structural break” in the growth of the economy. Figure 2 shows initial claims for unem-ployment in Illinois in the current and past two re-cessions, and Figure 3 shows the same data for the U.S. as a whole. The period capured in the figures extends from 16 weeks before the onset of the re-cession-related increase in unemployment claims to one year after.1 There are two obvious differ-ences between the COVID-related recession and past recessions: the speed with which the peak oc-curred and the disproportionate rise in the number of claims. Before April 2020, the largest number of claims in one week occurred in October 1982 and reached one-tenth of the peak number of claims in this recession.
The early unemployment claims in the current recession dwarf those of previous recessions. In many cases, the genesis of those claims is also qualitatively quite different: many of those current-ly unemployed were laid off because their place of employment was ordered to close or greatly contract its business activities due to public health concerns. Many of the unemployed will be able to garner relatively generous unemployment benefits due to recently enacted federal legislation. Despite this potentially mitigating factor, the hardship is undeniable and the macroeconomic repercussions are immense.
4Contact: Robin Fretwell Wilson, Director, IGPA: (217) 244-1227
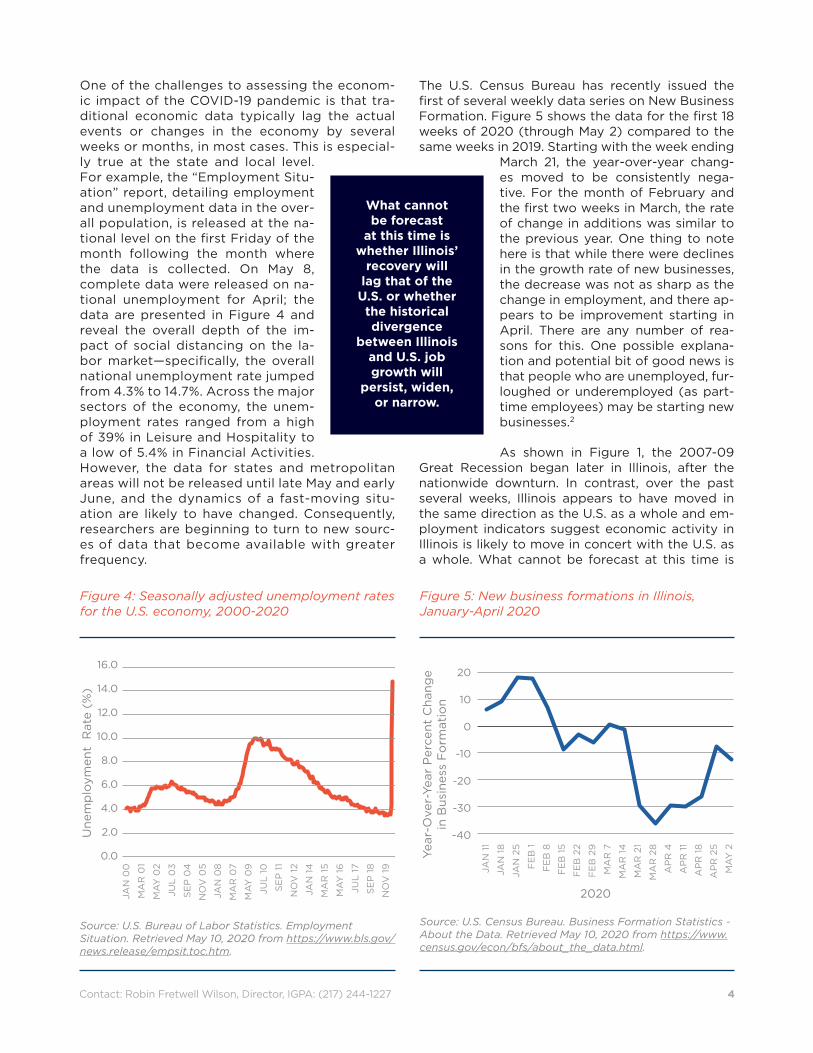
One of the challenges to assessing the econom-ic impact of the COVID-19 pandemic is that tra-ditional economic data typically lag the actual events or changes in the economy by several weeks or months, in most cases. This is especial-ly true at the state and local level. For example, the “Employment Situ-ation” report, detailing employment and unemployment data in the over-all population, is released at the na-tional level on the first Friday of the month following the month where the data is collected. On May 8, complete data were released on na-tional unemployment for April; the data are presented in Figure 4 and reveal the overall depth of the im-pact of social distancing on the la-bor market—specifically, the overall national unemployment rate jumped from 4.3% to 14.7%. Across the major sectors of the economy, the unem-ployment rates ranged from a high of 39% in Leisure and Hospitality to a low of 5.4% in Financial Activities. However, the data for states and metropolitan areas will not be released until late May and early June, and the dynamics of a fast-moving situ-ation are likely to have changed. Consequently, researchers are beginning to turn to new sourc-es of data that become available with greater frequency.
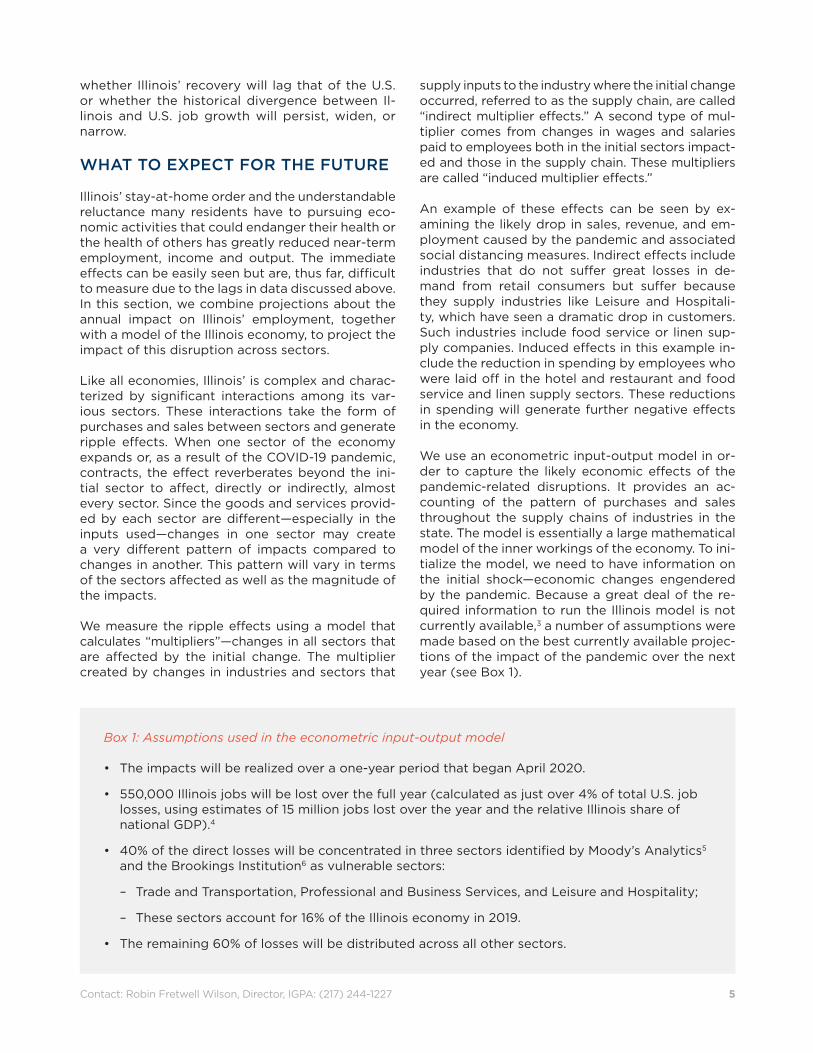
The U.S. Census Bureau has recently issued the first of several weekly data series on New Business Formation. Figure 5 shows the data for the first 18 weeks of 2020 (through May 2) compared to the same weeks in 2019. Starting with the week ending
March 21, the year-over-year chang-es moved to be consistently nega-tive. For the month of February and the first two weeks in March, the rate of change in additions was similar to the previous year. One thing to note here is that while there were declines in the growth rate of new businesses, the decrease was not as sharp as the change in employment, and there ap-pears to be improvement starting in April. There are any number of rea-sons for this. One possible explana-tion and potential bit of good news is that people who are unemployed, fur-loughed or underemployed (as part-time employees) may be starting new businesses.2
As shown in Figure 1, the 2007-09 Great Recession began later in Illinois, after the nationwide downturn. In contrast, over the past several weeks, Illinois appears to have moved in the same direction as the U.S. as a whole and em-ployment indicators suggest economic activity in Illinois is likely to move in concert with the U.S. as a whole. What cannot be forecast at this time is
JAN
07
MA
R 0
7M
AY
07
JUL
07
SE
P 0
7N
OV
07
JAN
08
MA
R 0
8M
AY
08
JUL
08
SE
P 0
8N
OV
08
JAN
09
MA
R 0
9M
AY
09
JUL
09
SE
P 0
9N
OV
09
Midwest
Illinois
Ind
ex o
f N
onf
arm
Pay
roll
Em
plo
ymen
t(J
anua
ry 2
00
7 =
10
0)
101
100
99
98
97
96
95
94
93
Weeks Since Onset of Increase-16 -8 0 8 16 24 32 40 48
Init
ial U
nem
plo
ymen
t C
laim
s 200,000
150,000
100,000
50,000
0
March 2020
October 2008
November 2009
Weeks Since Onset of Increase-16 -8 0 8 16 24 32 40 48
Init
ial U
nem
plo
ymen
t C
laim
s
7,000,000
6,000,000
5,000,000
4,000,000
3,000,000
2,000,000
1,000,000
0
March 2020
October 2008
November 2009
JAN
00
MA
R 0
1
MA
Y 0
2
JUL
03
SE
P 0
4
NO
V 0
5
JAN
08
MA
R 0
7
MA
Y 0
9
JUL
10
SE
P 1
1
NO
V 1
2
JAN
14
MA
R 1
5
MA
Y 1
6
JUL
17
SE
P 1
8
NO
V 1
9
Une
mp
loym
ent
Rat
e (%
)
16.0
14.0
12.0
10.0
8.0
6.0
4.0
2.0
0.0
JAN
11
JAN
18
JAN
25
FE
B 1
FE
B 8
FE
B 1
5
FE
B 2
2
FE
B 2
9
MA
R 7
MA
R 1
4
MA
R 2
1
MA
R 2
8
AP
R 4
AP
R 1
1
AP
R 1
8
AP
R 2
5
MA
Y 2
2020
Year
-Ove
r-Ye
ar P
erce
nt C
hang
ein
Bus
ines
s F
orm
atio
n
20
10
0
-10
-20
-30
-40
Figure 4: Seasonally adjusted unemployment rates for the U.S. economy, 2000-2020
Source: U.S. Bureau of Labor Statistics. Employment Situation. Retrieved May 10, 2020 from https://www.bls.gov/news.release/empsit.toc.htm.
JAN
07
MA
R 0
7M
AY
07
JUL
07
SE
P 0
7N
OV
07
JAN
08
MA
R 0
8M
AY
08
JUL
08
SE
P 0
8N
OV
08
JAN
09
MA
R 0
9M
AY
09
JUL
09
SE
P 0
9N
OV
09
Midwest
Illinois
Ind
ex o
f N
onf
arm
Pay
roll
Em
plo
ymen
t(J
anua
ry 2
00
7 =
10
0)
101
100
99
98
97
96
95
94
93
Weeks Since Onset of Increase-16 -8 0 8 16 24 32 40 48
Init
ial U
nem
plo
ymen
t C
laim
s 200,000
150,000
100,000
50,000
0
March 2020
October 2008
November 2009
Weeks Since Onset of Increase-16 -8 0 8 16 24 32 40 48
Init
ial U
nem
plo
ymen
t C
laim
s
7,000,000
6,000,000
5,000,000
4,000,000
3,000,000
2,000,000
1,000,000
0
March 2020
October 2008
November 2009
JAN
00
MA
R 0
1
MA
Y 0
2
JUL
03
SE
P 0
4
NO
V 0
5
JAN
08
MA
R 0
7
MA
Y 0
9
JUL
10
SE
P 1
1
NO
V 1
2
JAN
14
MA
R 1
5
MA
Y 1
6
JUL
17
SE
P 1
8
NO
V 1
9
Une
mp
loym
ent
Rat
e (%
)
16.0
14.0
12.0
10.0
8.0
6.0
4.0
2.0
0.0JA
N 1
1
JAN
18
JAN
25
FE
B 1
FE
B 8
FE
B 1
5
FE
B 2
2
FE
B 2
9
MA
R 7
MA
R 1
4
MA
R 2
1
MA
R 2
8
AP
R 4
AP
R 1
1
AP
R 1
8
AP
R 2
5
MA
Y 2
2020
Year
-Ove
r-Ye
ar P
erce
nt C
hang
ein
Bus
ines
s F
orm
atio
n
20
10
0
-10
-20
-30
-40
Figure 5: New business formations in Illinois, January-April 2020
Source: U.S. Census Bureau. Business Formation Statistics - About the Data. Retrieved May 10, 2020 from https://www.census.gov/econ/bfs/about_the_data.html.
What cannot be forecast
at this time is whether Illinois’
recovery will lag that of the U.S. or whether the historical divergence
between Illinois and U.S. job growth will
persist, widen, or narrow.
5Contact: Robin Fretwell Wilson, Director, IGPA: (217) 244-1227
whether Illinois’ recovery will lag that of the U.S. or whether the historical divergence between Il-linois and U.S. job growth will persist, widen, or narrow.
WHAT TO EXPECT FOR THE FUTURE
Illinois’ stay-at-home order and the understandable reluctance many residents have to pursuing eco-nomic activities that could endanger their health or the health of others has greatly reduced near-term employment, income and output. The immediate effects can be easily seen but are, thus far, difficult to measure due to the lags in data discussed above. In this section, we combine projections about the annual impact on Illinois’ employment, together with a model of the Illinois economy, to project the impact of this disruption across sectors.
Like all economies, Illinois’ is complex and charac-terized by significant interactions among its var-ious sectors. These interactions take the form of purchases and sales between sectors and generate ripple effects. When one sector of the economy expands or, as a result of the COVID-19 pandemic, contracts, the effect reverberates beyond the ini-tial sector to affect, directly or indirectly, almost every sector. Since the goods and services provid-ed by each sector are different—especially in the inputs used—changes in one sector may create a very different pattern of impacts compared to changes in another. This pattern will vary in terms of the sectors affected as well as the magnitude of the impacts.
We measure the ripple effects using a model that calculates “multipliers”—changes in all sectors that are affected by the initial change. The multiplier created by changes in industries and sectors that
supply inputs to the industry where the initial change occurred, referred to as the supply chain, are called “indirect multiplier effects.” A second type of mul-tiplier comes from changes in wages and salaries paid to employees both in the initial sectors impact-ed and those in the supply chain. These multipliers are called “induced multiplier effects.” An example of these effects can be seen by ex-amining the likely drop in sales, revenue, and em-ployment caused by the pandemic and associated social distancing measures. Indirect effects include industries that do not suffer great losses in de-mand from retail consumers but suffer because they supply industries like Leisure and Hospitali-ty, which have seen a dramatic drop in customers. Such industries include food service or linen sup-ply companies. Induced effects in this example in-clude the reduction in spending by employees who were laid off in the hotel and restaurant and food service and linen supply sectors. These reductions in spending will generate further negative effects in the economy.
We use an econometric input-output model in or-der to capture the likely economic effects of the pandemic-related disruptions. It provides an ac-counting of the pattern of purchases and sales throughout the supply chains of industries in the state. The model is essentially a large mathematical model of the inner workings of the economy. To ini-tialize the model, we need to have information on the initial shock—economic changes engendered by the pandemic. Because a great deal of the re-quired information to run the Illinois model is not currently available,3 a number of assumptions were made based on the best currently available projec-tions of the impact of the pandemic over the next year (see Box 1).
Box 1: Assumptions used in the econometric input-output model
• The impacts will be realized over a one-year period that began April 2020.
• 550,000 Illinois jobs will be lost over the full year (calculated as just over 4% of total U.S. job losses, using estimates of 15 million jobs lost over the year and the relative Illinois share of national GDP).4
• 40% of the direct losses will be concentrated in three sectors identified by Moody’s Analytics5 and the Brookings Institution6 as vulnerable sectors:
– Trade and Transportation, Professional and Business Services, and Leisure and Hospitality;
– These sectors account for 16% of the Illinois economy in 2019.
• The remaining 60% of losses will be distributed across all other sectors.
6Contact: Robin Fretwell Wilson, Director, IGPA: (217) 244-1227
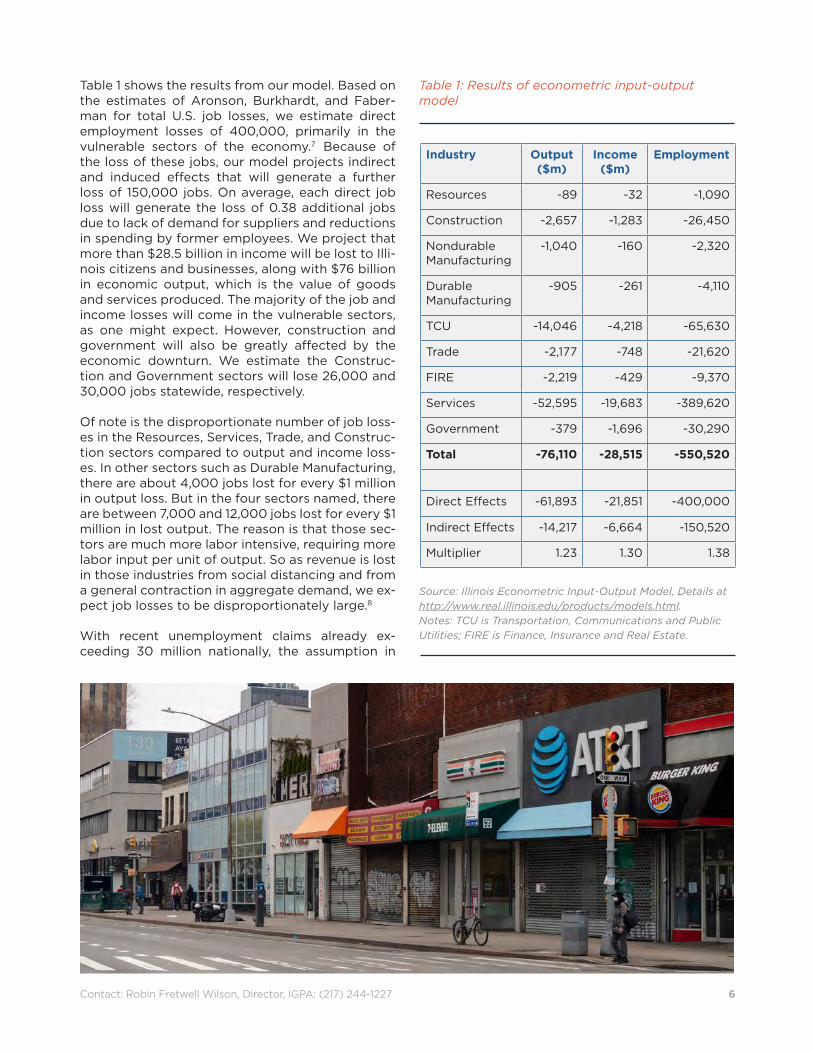
Table 1 shows the results from our model. Based on the estimates of Aronson, Burkhardt, and Faber-man for total U.S. job losses, we estimate direct employment losses of 400,000, primarily in the vulnerable sectors of the economy.7 Because of the loss of these jobs, our model projects indirect and induced effects that will generate a further loss of 150,000 jobs. On average, each direct job loss will generate the loss of 0.38 additional jobs due to lack of demand for suppliers and reductions in spending by former employees. We project that more than $28.5 billion in income will be lost to Illi-nois citizens and businesses, along with $76 billion in economic output, which is the value of goods and services produced. The majority of the job and income losses will come in the vulnerable sectors, as one might expect. However, construction and government will also be greatly affected by the economic downturn. We estimate the Construc-tion and Government sectors will lose 26,000 and 30,000 jobs statewide, respectively.
Of note is the disproportionate number of job loss-es in the Resources, Services, Trade, and Construc-tion sectors compared to output and income loss-es. In other sectors such as Durable Manufacturing, there are about 4,000 jobs lost for every $1 million in output loss. But in the four sectors named, there are between 7,000 and 12,000 jobs lost for every $1 million in lost output. The reason is that those sec-tors are much more labor intensive, requiring more labor input per unit of output. So as revenue is lost in those industries from social distancing and from a general contraction in aggregate demand, we ex-pect job losses to be disproportionately large.8
With recent unemployment claims already ex-ceeding 30 million nationally, the assumption in
Industry Output ($m)
Income ($m)
Employment
Resources -89 -32 -1,090
Construction -2,657 -1,283 -26,450
Nondurable Manufacturing
-1,040 -160 -2,320
Durable Manufacturing
-905 -261 -4,110
TCU -14,046 -4,218 -65,630
Trade -2,177 -748 -21,620
FIRE -2,219 -429 -9,370
Services -52,595 -19,683 -389,620
Government -379 -1,696 -30,290
Total -76,110 -28,515 -550,520
Direct Effects -61,893 -21,851 -400,000
Indirect Effects -14,217 -6,664 -150,520
Multiplier 1.23 1.30 1.38
Table 1: Results of econometric input-output model
Source: Illinois Econometric Input-Output Model, Details at http://www.real.illinois.edu/products/models.html.Notes: TCU is Transportation, Communications and Public Utilities; FIRE is Finance, Insurance and Real Estate.
7Contact: Robin Fretwell Wilson, Director, IGPA: (217) 244-1227
Box 1 that only 15 million jobs will be lost nation-ally might seem very conservative. However, Table 1 represents our estimates for Illinois over a one-year period, so the 15 million figure—or 550,000 for Illinois—should be thought of as jobs lost across the entire year. For this purpose, a job that disap-pears for three months represents the loss of one-fourth of a job for the year. In reality, many more jobs than 15 million are likely to be affected; for example, some employees may be furloughed for several months and then return to work; other po-sitions may be reduced to 75% or 50% of full time. In all likelihood, somewhere between 1 million and 1.5 million Illinois jobs may be affected. The final impact will depend on the extended effects of the stay-at-home orders and the pace and structure of the opening up of the economy.
CHALLENGES TO RECOVERY
There are many challenges for the eventual re-covery of the economy. While a “gradual opening up” sounds reasonable, the realities of the modern economy and presence of the coronavirus suggest that attention has to be paid to the complexities of the interactions between sectors, the relationship between income and expenditures of households, and how the so-called new normal will affect the
viability of many operations. Some sectors may have more flexibility than others, but supply chains are complex and tightly integrated as a result of competitive pressures. Just-in-time assembly has proven to add to the productive efficiency of the economy at a potential cost of reducing the abil-ity to withstand disruptions. In recent weeks, the closing of several meat processing facilities has slowed or stopped the delivery of livestock from farms, creating a significant bottleneck in the sup-ply chain. Many restaurant owners have estimat-ed that their ability to cover costs might be chal-lenged if occupancy levels are reduced as a result of social distancing rules. This will limit the ability of restaurants to rehire the pre-pandemic levels of staff, further delaying the economy’s recovery. Also, for those who have lost jobs or have seen a reduction in income from reduced hours, it is like-ly that their demand for restaurant meals, visits to athletic events, and other entertainment might be curtailed for both financial reasons and concerns about infection.
In terms of forecasting a recovery, analysts and forecasters have discussed patterns that resemble letters of the alphabet or symbols. The most opti-mistic models envision a “V-shaped” recovery, with a fast decline and equally fast recovery. An exam-ple of this type of model is from the Congressional
8Contact: Robin Fretwell Wilson, Director, IGPA: (217) 244-1227
Budget Office. It predicts a decline of almost 40% in Gross Domestic Product (GDP) on an annualized basis in the second quarter, followed by an imme-diate recovery in GDP to a positive 23.5% growth in the third quarter.9 An opposite pattern to this is an “L-shaped” recovery, with a rapid decline and then an extremely slow return to economic growth. An example of this pattern was recently issued by Guggenheim Investments, which predicts negative growth through the first two quarters of 2020, then a slow return to trend growth over the next four years.10 Most recently, Zandi, deRitis and Sweet have described the most likely pattern as a “Nike swoosh,” with a gradual return to trend growth.11
Alternative economic data are also revealing pat-terns in the economy that have been influenced by the unique circumstances of a pandemic-driven economic contraction. Using credit card data, Ear-nest Research revealed some significant changes in the ways consumers have been allocating their purchases.12 They found a significant increase in food expenditures from grocery stores and a con-comitant decline in expenditures at restaurants and for entertainment. There also have been declines in non-food-related shopping, travel and trans-portation, especially decreases in gas purchases. When the Census Bureau reveals the results of the most recent Current Population Survey, it will be possible to estimate the impact of (1) redirection of consumer expenditures, and (2) the reduction in overall spending. Since household consumption represents about 70% of GDP, small changes in the volume of spending and the distribution of spend-ing can have very significant impacts that will vary among sectors of the economy.
One of the most important factors that will drive the shape of the recovery is the degree to which employees are going to feel comfortable returning to the workplace and how households view the risk of attending sporting events, cultural activities and leisure facilities. A recent Washington Post-Univer-sity of Maryland poll found that a broad majority of
respondents would not feel comfortable going to gatherings of 10 or more people until later in 2020 or beyond.13 These were not risks faced by house-holds in the recovery from previous recessions, so they add an important layer of uncertainty to the current economic situation. Further, many of the employees in vulnerable sectors may be very dependent on child-care facilities and the ability of these operations to resume may impede labor force participation.14

9Contact: Robin Fretwell Wilson, Director, IGPA: (217) 244-1227
Geoffrey HewingsIGPA Scholar Emeritus;
Director EmeritusRegional Economics
Applications Laboratory University of Illinois at
Urbana-Champaign
Kenneth KrizIGPA Affiliate;
University DistinguishedProfessor of Public Administration;
Director, Institute for Illinois Public Finance
University of Illinoisat Springfield
David MerrimanIGPA Senior Scholar;
James J. Stukel Presidential Professor of
Public AdministrationUniversity of Illinois
at Chicago
Beverly BunchProfessor of Public
AdmiistrationUniversity of Illinois
at Springfield
Patricia ByrnesAssociate Professor
of EconomicsUniversity of Illinois
at Springfield
Francis ChoiPhD Student
Public AdministrationUniveristy of Illinois
at Chicago
Larry DeBrockDean Emeritus;
Professor of Finance and Economics
Gies College of Business
University of Illinois atUrbana-Champaign
Michael DisherPhD Student Economics
University of Illioisat Chicago
Joshua DruckerAssociate Professorof Urban Planning
and PolicyUniversity of Illinois
at Chicago
Matt FinkinMaybelle Swanlund
Endowed Chair, Center for
Advanced Study; Professor of Law
University of Illinois at Urbana-Champaign
Don FullertonIGPA Senior Scholar; Gutgsell Professor
of FinanceUniversity of Illinois at
Urbana-Champaign
Brian GainesIGPA Senior Scholar;
Professor ofPolitical Science
University ofIllinois at
Urbana-Champaign
J. Fred GiertzIGPA Scholar
Emeritus;Professor Emeritus
of EconomicsUniversity of
Illinois at Urbana-Champaign
Joseph HoerethDirector, Institute
for Policy and Civic
EngagementUniversity of Illinois
at Chicago
Faye JonesDirector
Albert E. Jenner Law Library; Clinical
Professor of Law University of
Illinois at Urbana-Champaign
Amanda Kass Associate Director
Government Finance Research Center
University of Illinoisat Chicago
Arwi KrizVisiting Research
FellowInstitute for Illinois
Public FinanceUniversity of Illinois
at Springfield
Christopher Z. MooneyIGPA Senior Scholar;W. Russell Arrington
Professor ofState Politics
University of Illinoisat Chicago
Michael PaganoDean, College of
Urban Planning and Public Affairs
Director, Government Finance Research
CenterUniversity of Illinois
at Chicago
Lisa PowellDirector
Division ofHealth Policy
and AdministrationUniversity of Illinois
at Chicago
Tara PowellAssistant Professor
School ofSocial WorkUniversity of
Illinois atUrbana-Champaign
Elizabeth T. PowersIGPA Senior Scholar Associate Professor
of EconomicsUniversity of
Illinois atUrbana-Champaign
Kent RedfieldIGPA Scholar
Emeritus;Professor Emeritusof Political ScienceUniversity of Illinois
at Springfield
Julian ReifIGPA Senior Scholar;Assistant Professor
of FinanceUniversity of
Illinois atUrbana-Champaign
Moira ZellnerAssociate Professor
Urban Planning and Policy Director,
Urban Data Visualization Lab
University of Illinoisat Chicago
Robin Fretwell WilsonDirector
Institute of Government and
Public AffairsUniversity of Illinois
System
We are honored to have the opportunity to harness our collective research and experience to serve our neighbors and
the residents of Illinois during a time of great need.
Respectfully submitted,
10Contact: Robin Fretwell Wilson, Director, IGPA: (217) 244-1227
Audience
IGPA Impact Reports are intended to be useful to pol-icymakers and stakeholders, including but not limited to University of Illinois System leaders, state legisla-tors, Governor J.B. Pritzker’s office, state agencies, news media, nonprofits, educators, volunteer organi-zations, and faith leaders.
Photography from istockphoto.com Pg. 1 - Closed sign on street #1213432934 by
tumsasedgarsPg. 3 - Masked Ben Franklin #1218811591 by
FeverpitchedPg. 5 - Empty streetscape #1218114737 by Alex
PotemkinPg. 7 - Man on Steps #1222691579 by Blue Planet
StudioPg. 8 - Woman in store #1214438422 by zoranm
ENDNOTES
1 We define the onset as occurring when the number of claims exceeds the baseline–fur-ther defined as the 52-week moving average of claims–by 50% for a prolonged period of time.
2 There is evidence of increased new busi-nesses formation in previous recessions. See Fairlie, R. W., “Entrepreneurship, Economic Conditions, and the Great Recession.” Journal of Economics & Management Strategy, 22(2), 207–231.
3 Even less data are currently available about economic conditions in sub-state regions. However, we expect to be tracking sub-state conditions as data becomes available. See the Illinois Economic Observatory at https://per-ma.cc/Y9UB-468Q.
4 Aaronson, D., Burkhardt, H., and Faberman, J., “Potential Jobs Impacted by Covid-19,” Chicago Fed Insights. Retrieved May 5, 2020 from https://perma.cc/82C3-HEQM.
5 Zandi, M., “COVID-19: A Fiscal Stimulus Plan,” Moody’s Analytics Economic View. March 16, 2020, Retrieved April 27, 2020 from https://perma.cc/C5MJ-44PJ.
6 Muro, M., Maxim, R., & Whiton, J., “The Plac-es a COVID-19 Recession Will Likely Hit Hard-est,” Brookings Institution. Retrieved April 5, 2020 from https://perma.cc/TRA5-29YM.
7 Aaronson, D., et al, “Potential Jobs.
8 As an aside, the government sector is an outlier in the calculations here; the concept of government output is not well measured or well defined.
9 Swagel, P., “CBO’s Current Projections of Output, Employment, and Interest Rates and a Preliminary Look at Federal Deficits for 2020 and 2021.” Congressional Budget Office Blog, April 24, 2020, Retrieved May 9, 2020 from https://perma.cc/48T9-SAAM.
10 Minerd, S., “Prepare for the Era of Recrimi-nation,” Guggenheim Investments, Retrieved May 9, 2020 from https://perma.cc/ZC7V-9A5K.
11 Zandi, M., DeRitis, C., & Sweet, R., “COVID-19: Q&A Update,” Moody’s Analyt-ics. April 2020, Retrieved May 6, 2020 from https://perma.cc/5YY3-5RZ9.
12 Earnest Research, “Coronavirus is Changing How We Spend Money, Part 3,” https://perma.cc/8RSQ-QF4Y.
13 Balz, D., Clement, S., “Americans’ Expecta-tions for Safe Public Gatherings Slip to July at the Earliest, Post-U. Md. poll finds,” Wash-ington Post, May 13, 2020, https://perma.cc/DZR6-4Q2G.
14 Powers, Elizabeth T., “Policy Spotlight: The Foundational Role of Child Care for Economic Recovery from the COVID-19 Pandemic,” Insti-tute of Government and Public Affairs, Univer-sity of Illinois System, Forthcoming.
IGPA TASK FORCE ON THE IMPACT OF THE COVID-19 PANDEMIC (AS OF MAY 7, 2020)
Resources for All Groups Robin Fretwell Wilson
Director, Institute of Government and Public Affairs U of I System
Brian Gaines IGPA Senior Scholar; Professor of Political Science Urbana Joseph K. Hoereth Director, Institute for Policy and Civic Engagement Chicago Faye Jones Director, Albert E. Jenner Law Library and Clinical Professor of Law Urbana Christopher Z. Mooney
IGPA Senior Scholar; W. Russell Arrington Professor of State Politics Chicago
Kent Redfield IGPA Scholar Emeritus; Professor Emeritus of Political Science Springfield Moira Zellner Associate Professor, Urban Planning and Policy and Director, Urban
Data Visualization Lab Chicago
Economic & Fiscal Impact Group Beverly Bunch Professor of Public Administration Springfield Patricia Byrnes Associate Professor of Economics Springfield Francis Choi PhD Student; Public Administration Chicago Larry DeBrock Dean Emeritus; Professor of Finance and Professor of Economics, Gies
College of Business Urbana
Michael Disher PhD Student, Economics
Joshua Drucker Associate Professor of Urban Planning and Policy Chicago Matthew W. Finkin Maybelle Swanlund Endowed Chair, Center for Advanced Study
Professor of Law, College of Law Urbana
Don Fullerton IGPA Senior Scholar; Gutgsell Professor of Finance Urbana J. Fred Giertz IGPA Scholar Emeritus; Professor Emeritus of Economics Urbana Geoffrey Hewings Director Emeritus, Regional Economics Applications Laboratory; IGPA
Scholar Emeritus; Professor Emeritus in Economics, Geography, Urban & Regional Planning and Agriculture and Consumer Economics
Urbana
Amanda Kass Associate Director, Government Finance Research Center Chicago Kenneth Kriz University Distinguished Professor of Public Administration; Director,
Institute for Illinois Public Finance Springfield
Arwi Kriz Visiting Research Fellow, Institute for Illinois Public Finance Springfield David Merriman
IGPA Senior Scholar/James J. Stukel Presidential Professor of Public Administration
Chicago
Michael Pagano Dean, College of Urban Planning and Public Affairs; Director, Government Finance Research Center
Chicago
Lisa Powell Director, Division of Health Policy and Administration Chicago Tara Powell Assistant Professor, School of Social Work Urbana Elizabeth T. Powers IGPA Senior Scholar; Associate Professor of Economics Urbana Julian Reif IGPA Senior Scholar; Assistant Professor of Finance Urbana
IGPA TASK FORCE ON THE IMPACT OF THE COVID-19 PANDEMIC (AS OF MAY 7, 2020)
Community and Family Resilience Group Marc Atkins Professor of Psychiatry Chicago Judith Cook Director, Center on Mental Health Services Research and Policy Chicago Teresa Córdova Professor of Urban Planning and Public Policy; Director, Great Cities
Institute Chicago
Barbara Fiese Director, Family Resiliency Center Urbana Tamara Fuller Director, Children and Family Research Center Urbana Brian Gaines IGPA Senior Scholar, Professor of Political Science Urbana Betsy Goulet Clinical Assistant Professor, Public Administration Springfield Rosalba Hernandez Assistant Professor, School of Social Work Urbana Ron Hershow Director, Division of Epidemiology and Biostatistics, School of Public
Health Chicago
Richard Kaplan Guy Raymond Jones Chair in Law, College of Law Urbana Brenda Koester Associate Director, Family Resiliency Center Urbana Jonathan D. Klein Professor of Pediatrics Chicago Maria Krysan IGPA Senior Scholar; Professor of Sociology Chicago Janet Liechty Associate Professor, School of Social Work Urbana Amanda E. Lewis LAS Distinguished Professor; Director, Institute for Research on Race
and Public Policy Chicago
Darren Lubotsky IGPA Senior Scholar; Professor of Economics Chicago Ruby Mendenhall Associate Professor in Sociology, African American Studies, Urban and
Regional Planning, and Social Work Urbana
Brian Ogolsky Associate Professor of Human Development and Family Studies Urbana Elizabeth T. Powers IGPA Senior Scholar; Associate Professor of Economics Urbana Tara Powell Assistant Professor, School of Social Work Chicago Brian Smith Special Assistant to Professor Wilson; 2L, College of Law; BS,
Neuroscience, Amherst College; MPH, Johns Hopkins Bloomberg School of Public Health
Urbana
Janet Smith Co-director, Voorhees Center on Neighborhood and Community Improvement
Chicago
P.S. Sriraj Director, Urban Transportation Center Chicago James Swartz Professor, Jane Addams School of Social Work Chicago Nikolas Theodore Director, Center for Urban Economic Development Chicago Edna Viruell-Fuentes
Associate Professor of Latino/Latina Studies Urbana
Stevan Weine Director, Center for Global Health Chicago
IGPA TASK FORCE ON THE IMPACT OF THE COVID-19 PANDEMIC (AS OF MAY 7, 2020)
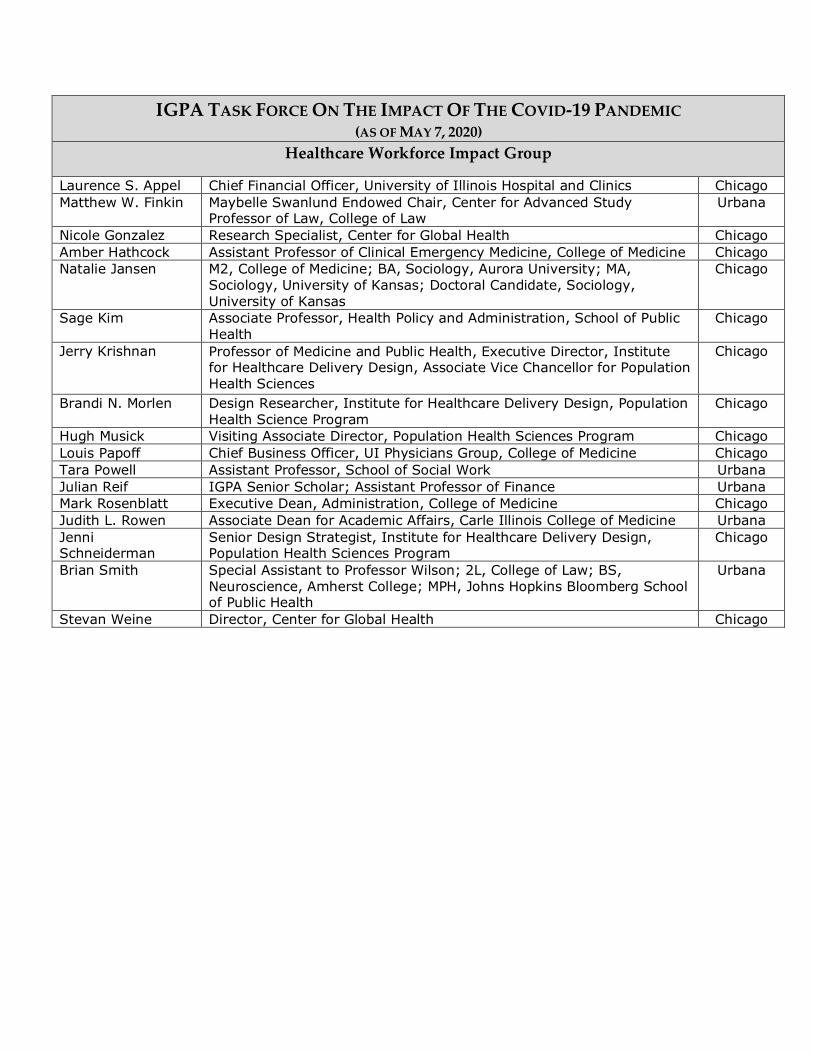
Healthcare Workforce Impact Group
Laurence S. Appel Chief Financial Officer, University of Illinois Hospital and Clinics Chicago Matthew W. Finkin Maybelle Swanlund Endowed Chair, Center for Advanced Study
Professor of Law, College of Law Urbana
Nicole Gonzalez Research Specialist, Center for Global Health Chicago Amber Hathcock Assistant Professor of Clinical Emergency Medicine, College of Medicine Chicago Natalie Jansen M2, College of Medicine; BA, Sociology, Aurora University; MA,
Sociology, University of Kansas; Doctoral Candidate, Sociology, University of Kansas
Chicago
Sage Kim Associate Professor, Health Policy and Administration, School of Public Health
Chicago
Jerry Krishnan Professor of Medicine and Public Health, Executive Director, Institute for Healthcare Delivery Design, Associate Vice Chancellor for Population Health Sciences
Chicago
Brandi N. Morlen Design Researcher, Institute for Healthcare Delivery Design, Population Health Science Program
Chicago
Hugh Musick Visiting Associate Director, Population Health Sciences Program Chicago Louis Papoff Chief Business Officer, UI Physicians Group, College of Medicine Chicago Tara Powell Assistant Professor, School of Social Work Urbana Julian Reif IGPA Senior Scholar; Assistant Professor of Finance Urbana Mark Rosenblatt Executive Dean, Administration, College of Medicine Chicago Judith L. Rowen Associate Dean for Academic Affairs, Carle Illinois College of Medicine Urbana Jenni Schneiderman
Senior Design Strategist, Institute for Healthcare Delivery Design, Population Health Sciences Program
Chicago
Brian Smith Special Assistant to Professor Wilson; 2L, College of Law; BS, Neuroscience, Amherst College; MPH, Johns Hopkins Bloomberg School of Public Health
Urbana
Stevan Weine Director, Center for Global Health Chicago