Economic Evaluation and Market Analysis for Natural Gas ...
172
DOE/MC/27346 - 5098 (DE96000631) Economic Evaluation and Market Analysis for Natural Gas Utilization Topical Report John H, Hackworth Robert W. Koch A. John Rezaiyan April 1995 Work Performed Under Contract No.: DE-AC21-90MC27346 For U.S. Department of Energy Office of Environmental Management Office of Technology Development Washington, DC U.S. Department of Energy Office of Fossil Energy Morgantown Energy Technology Center Morgantown, West Virginia By K&M Engineering & Consulting Corporation Washington, DC DISTRIBUTION OF THIS DOCUMENT IS UNLIMITED 0 MASTE
Transcript of Economic Evaluation and Market Analysis for Natural Gas ...

DOE/MC/27346 - 5098 (DE96000631)
Economic Evaluation and Market Analysis for Natural Gas Utilization
Topical Report
John H, Hackworth Robert W. Koch A. John Rezaiyan
April 1995
Work Performed Under Contract No.: DE-AC21-90MC27346
For U.S. Department of Energy Office of Environmental Management Office of Technology Development Washington, DC
U.S. Department of Energy Office of Fossil Energy Morgantown Energy Technology Center Morgantown, West Virginia
By K&M Engineering & Consulting Corporation Washington, DC
DISTRIBUTION OF THIS DOCUMENT IS UNLIMITED 0 MASTE

DOE/MC/27346 ~ 5098 (DE96000631)
Economic Evaluation and Market Analysis for Natural Gas Utilization
Topical Report
John H, Hackworth Robert W. Koch A. John Rezaiyan
Work Performed Under Contract No.: DE-AC21-90MC27346
For U.S. Department of Energy Office of Environmental Management Office of Technology Development 1000 Independence Avenue Washington, DC 20585
U.S. Department of Energy Office of Fossil Energy Morgantown Energy Technology Center P.O. Box 880 Morgantown, West Virginia 26507-0880
By K&M Engineering and Consulting Corporation
2001 L Street, NW. Washington, DC 20036
April 1995

Contents
Executive Summary E-l
1. Introduction 1-1
2. U.S. Natural Gas Supply and Market Analysis 2-1 2.1. Supply 2-1 2.2. Demand 2-3 2.3. Gas Markets of the 1980s and Search for New Markets 2-3 2.4. Gas Supply and Demand Issues—Low Quality Gas 2-7 2.5. Gas Supply and Demand Issues—Use of Remote Gas 2-8 2.6. Price Outlook 2-10 2.7. Summary 2-11
3. Transportation Fuels Market 3-1 3.1. Pressure for Market Change 3-1 3.2. Market Segments 3-4 3.3. Use of Gas and Gas-Derived Products 3-8 3.4. Fuel Physical Properties 3-9 3.5. Fuel Distribution 3-15 3.6. Vehicle/Engine Systems 3-18 3.7. MarketPenetration 3-21
4. Natural Gas Market Analysis—Use as a Chemical Feedstock 4-1 4.1. Ammonia 4-1 4.2. Methanol 4-3 4.3. Ethylene 4-6
5. Natural Gas Market Analysis—Use in Power Generation 5-1
6. Process Routes from Natural Gas to Transportation Fuels, Chemical Feedstocks, and Utility Fuel 6-1
7. Gas Use in Transportation Fuels—Economic Analysis 7-1 7.1. Price Forecast—Transportation Fuels and Components 7-1 7.2. Economic Evaluation —Analysis Methodology 7-4
8. Gas Use in Transportation Fuels—Economic Analysis 8-1 8.1. Natural Gas to Methanol by the Liquid-phase Methanol Process 8-2 8.2. Natural Gas to Liquid Products via Fischer-Tropsch 8-9
i

Contents (cont'd) 8.3.Gasoline by Oxidative Coupling of Methane and Oligomerization S-ir
8.4. Natural Gas to Higher Alcohols by the IFP Process E-^Z 8.5. Natural Gas and Butane to MTBE 8-27 8.6. Compressed Natural Gas (CNG) for Transportation Fuel 8-35 8.7. Liquefied Natural Gas (LNG) for Transportation Fuel 8-36
9. Gas Use in Chemicals and Power Production-Economic Analysis 9-1 9.1. Natural Gas to Methanol by the Liquid—Phase Methanol Process 9-3 9.2. Natural Gas to Ammonia 9-6 9.3. Natural Gas for Power Production Using a Combined Cycle 9-11 9.4. Upgrading of Low Quality Natural Gas by Nitrogen Rejection 9-14 9.5. Economics of Conversion of Natural Gas to Ethylene 9-17 9.6. Economics of Conversion of Natural Gas to Methyl Chloride 9-19
10. Sensitivity Analysis of Economics in Converting Natural Gas to Fischer-Tropsch Liquids 10-1 10.1. Effect of Using Slurry Reactor 10-1 10.2. Effect of Gas Price Growth Rate 10-2 10.3. Effect of Plant Size 10-2 10.4. Effect of Barge-Mounted Plants and Alasican North-Slope Location 10-3 10.5. Effect of Using Ceramic Membranes for Oxygen Production 10-5 10.6. Effect of Changing Natural Gas Price 10-6 10.7. Summary 10-7
11. Comparative Economics and Potential for Increased Gas Use 11-1 11.1. Comparative Economics Transportation Fuels 11-1 11.2. Compara tive Economics Chemicals and Power Production 11-3 11.3. Potential for Increased Gas Use 11-5 11.4. Estimated Employment Generation of a Gas-to-Liquids Industry 11-6 11.5. Potential Improvements and Cost Reductions for New Gas to Liquids Projects 11-6
References R-l
Appendix A. Methodology for Calculating the Required Price of Gas-Derived Products A-1
ii

Exhibits
ES-l. Price Forecasts of U.S. Oil and Natural Gas E-2 ES-2. Assessment of Increased Gas Use in the Transportation Fuels Market E-3 ES-3. Conversion of Natural Gas to Transportation Fuels E-4 ES-4. Comparative Economics of Gas to Transportation Fuel Processes E-5 ES-5. Use of Natural Gas as a Chemical Feedstock E-7 ES-6. Conversion of Natural Gas to Chemicals and Power E-8 ES-7. Economic Comparison of Natural Gas in Chemical and Power Processes E-9 ES-8. Fischer-Tropsch Process Economics Sensitivity Analysis E-ll 2.1. Natural Gas Production and Productive Capacity by Month, 1980-1992 2-2 2.2. Current Estimate of Undiscovered Natural Gas Resources 2-4 2.3. Natural Gas Supply and Disposition in the United States, 1992 2-5 2.4. Natural Gas Delivered to Consumers in the United States 2-6 2.5. Reserves of Natural Gas Classified According to Contaminant Level 2-7 2.6. Proven Reserves versus C0 2 Plus N2 Content 2-9 2.7. Methanol Production Cost 2-10 2.8. Forecasts of U.S. Oil and Natural Gas Prices (US$ 1994 prices) 2-11 3.1. Summary of U.S. Vehicle Fuel Consumption, 1992 3-2 3.2. New Transportation Fuels—Government Policy Steps 3-3 3.3. Non-Petroleum Transportation Fuels 3-5 3.4. Transportation Energy Use by Vehicle Type, 1990 3-6 3.5. Automobile Fleets by Use in 1991 3-7 3.6. Diesel Fuel Tank Storage Data for Trucking Operations 3-7 3.7. Physical Properties of Gasoline, Diesel, and Selected Alternative Fuels 3-10 3.8. Weighted National Statistics for Natural Gas in Ten Major Urban Areas
of the United States Without Propane/Air (P/A) Peakshaving 3-11 3.9. Distribution of Refined Petroleum Products 3-16 4.1. Use of Ammonia 4-2 4.2. U.S. Methanol Supply/Demand 4-4 4.3. U.S. Ethylene Supply/Demand 4-7 6.1. Conversion of Natural Gas to Transportation Fuels 6-2 6.2. Conversion of Natural Gas to Chemicals and Power 6-4 7.1. Transportation Fuels Price Forecast (prices in 1992 $) 7-2 7.2. Transportation Fuels Price Forecast (prices in current $) 7-3 7.3. Oil and Natural Gas Prices 7-4 8.1. Economic Comparison of Gas-to-Liquids Processes 8-2 8.2. LPMEOH Process Flow Diagram 8-4 8.3. Fischer-Tropsch Process 8-10 8.4. SASOL Reactor Production Composition 8-11 8.5. Methane to Gasoline/Oxidative Coupling Process 8-17'
iii

Exhibits (cont'd)
8.6. Simplified Block Diagram of the IFP Process 8-24 8.7. MTBE Process Flow Diagram 8-29 8.8. Mixed Refrigerant Cascade System Used for Liquefaction of Natural Gas 8-37 9-1. Economics Comparison of Natural Gas to Chemicals and Power Processes 9-2 9-2. LPMEOH Process Flow Diagram 9-4 9-3. Ammonia Process 9-8 . 9-4. Combined-Cycle Power Plant 9-12 9-5. Nitrogen Rejection From Subquality Natural Gas by a Cryogenic Process 9-16 10-1. Fischer-Tropsch Process Economics Sensitivity Analysis 10-8 11-1. Market Prices and Production Costs for U. S. Production Facilities 11-2 11-2. 11-4 11-3. 11-4 A-l. Liquid Phase Methanol A-3 A-2. Definition of Terms A-6 A-3. Summary of Economics for Conversion of Natural Gas to Transportation Fuels A-8 A-4. Summary of Economics for Conversion of Natural Gas to Transportation Fuels A-9 A-5. Summary of Economics for Conversion of Natural Gas to Chemicals A-10 A-6. Summary of Economics for Conversion of Natural Gas to Power, Nitrogen
Rejection and Production of Methyl Chloride A-l 1 A-7. Summary of Economics of Sensitivity to Gas Price Growth Rate and Plant Size
for Fischer-Tropsch Process with Slurry Reactor A-12 A-8. Summary of Economics of Sensitivity to Location and Gas Price for
Fischer-Tropsch Process with Slurry Reactor A-13
iv

Executive Summary
During the past decade, the U.S. has experienced a surplus gas supply. Future prospects are brightening because of increased estimates of the potential size of undiscovered gas reserves. At the same time, U.S. oil reserves and production have steadily declined, while oil imports have steadily increased.
Reducing volume growth of crude oil imports was a key objective of the Energy Policy Act of 1992. Natural gas could be an important alternative energy source to liquid products derived from crude oil to help meet market demand. The purpose of this study was to (1) analyze three energy markets to determine whether greater use could be made of natural gas or its derivatives and (2) determine whether those products could be provided on an economically competitive basis. The following three markets were targeted for possible increases in gas use: transportation fuels, power generation, and chemical feedstock.
Gas-derived products that could potentially compete in these three markets were identified, and the economics of the processes for producing those products were evaluated. The processes considered covered the range from commercial to those in early stages of process development. The analysis also evaluated the use of both high-quality natural gas and lower-quality gases containing C0 2 and N 2 levels above normal pipeline quality standards.
Gas Supply and Utilization
The U.S's gas-supply surplus of the past decade is slowly disappearing as the new reserve addition rate has almost kept pace with the annual depletion rate caused by consumption. The strong reserve addition rate that has maintained the supply surplus has occurred in a weak gas-price market. Future gas supply and pricing have significant implications for where energy research and development (R&D) dollars should be allocated. Current and future relative prices of natural gas, crude oil, and coal are important for today's energy use decisions and tomorrow's considerations of substituting coal- and gas-derived liquid products in applications that currently use products derived from crude oil.
This report's economic analyses are based on price forecasts developed by the U.S. Department of Energy/Energy Information Administration (DOE/EIA); they predict that U.S. gas prices will rise faster than oil prices from now until the year 2010 (Exhibit ES-1). A forecast of higher price growth for natural gas versus crude oil means that, for a gas-to-liquid conversion process, the feedstock cost would increase more rapidly than the price of the product.
An alternative scenario with high crude-oil prices in the future would be an environment in which processes for converting gas or coal to liquids begin to look attractive. Most of the energy forecasting community has been lowering their estimates of long-range crude prices in recent
E-l - 1 -

Exhibit ES-1. Price Forecasts for U.S. Oil and Natural Gas
Forecast Price
(in 1994 US$) Growth Rate
(%) 1993 2000 2010 1993-2010
1994 DOE Outlook Gas ($/MCF) Oil ($/bbl)
1.79 18.65
2.48 21.25
3.56 28.88
4.1 2.6
1995 DOE Outlook Gas ($/MCF) Oil ($/bbl)
2.02 16.12
2.29 19.13
3.37 24.12
3.1 2.4
1995 GRI Forecast Gas (S/MCF) Oil ($ftbl)
2.06 16.42
2.53 18.58
2.71 20.54
1.6 1.3
years. Forecasts, however, contain much uncertainty. Government-funded R&D is not directed solely at preparing for the most likely future; the Government must also commit resources to preparing for the less likely outcomes that may occur. In this case, the need is to prepare for a possible significant increase in crude oil price and a larger price differential versus U.S. gas. The probability of a high crude-price scenario should affect the level of resource commitment to gas-to-liquids R&D. Clearly, the probability of high crude prices has diminished.
The U.S. gas supply outlook is optimistic. In its 1995 U.S. Energy Supply and Demand analysis, the Gas Research Institute (GRI) estimates that the volume of reserve needed to meet consumption through the year 2010 can be added with little price increase. Previous GRI assessments showed significant price increases would be required. GRI bases its outlook on improvements in technology expected in the coming decade.
Analysis of Gas-Derived Products in Transportation Fuels Markets
Three types of products derived from natural gas can be used in the transportation fuels market (Exhibit ES-2). Natural gas is currently used in the production of MTBE, an ether and oxygenate, used as a blend component in producing gasoline because of its high octane properties and ability to meet the Clean Air Act Amendments of 1990 (CAAA) oxygen-content standard for gasoline that about one-third of the U.S. market requires. Other ethers and alcohols could potentially be produced from natural gas and compete in the gasoline market. While oxygenates command a price premium compared with other gasoline components, the volumes required are limited by octane need and oxygen-content requirements as specified by environmental regulations.
Natural gas can also be used to produce synthetic gasoline and diesel for which there is obviously a large market. In this case, the issue is the price competitiveness of gas-derived gasoline and
E-2 - 2 -

diesel versus products derived from crude oil. The final avenue of access is production of alternative transportation fuels, primarily methanol and CNG.
Exhibit ES-2. Assessment of Increased Gas Use in the Transportation Fuels Market
Fuel Type Gas-Derived Products Market Penetration Market Size Gasoline blend components
MTBE, Other ethers, Alcohols
Easy Limited by need for oxygenates
Gasoline and diesel
Synthesized gasoline and diesel
Easy if price is competitive
Large
Alternative transportation fuels
Methanol, Compressed natural gas (CNG)
Difficult Large but difficult to penetrate
Even if the alternative transportation fuels can be produced at prices competitive with gasoline and diesel fuel, they face major hurdles in gaining entry and acceptance in that market.
Ideally, an alternative-fueled vehicle would be an original equipment vehicle/engine system optimized to use the specific fuel. During the transition period of establishing use of the fuel, existing gasoline or diesel vehicles can sometimes be converted to using the alternative fuel, such as methanol or CNG. Vehicles can also be designed to use either of two fuels (bi-fueled) or a combination (flexible-fueled). These types of vehicles are designed to help consumers cope with the problem of finding fuel while the distribution and fueling station infrastructure is growing. Finally, a new fuel must gain acceptance, which depends on how consumers compare the alternatively-fueled vehicle's economics, convenience, performance, and safety with conventionally-fueled vehicles.
Economic Evaluation of Gas to Transportation Fuel Conversion Process
Process routes for natural gas to transportation fuel processes are shown in Exhibit ES-3. The economic evaluation for these processes was done using data taken from various economic studies. Only Fischer-Tropsch (FT) and oxidative coupling economic data were available from a common source. Since each data source used somewhat different factors to determine total capital and total operating and maintenance costs, it was decided to accept certain basic data from the economic sources and calculate the remaining economics using a consistent methodology. All costs were escalated to December 1993 using Nelson-Farrar Indexes reported in the Oil and Gas Journal. Estimates of future gas prices were based on the 1994 EIA outlook (see Exhibit ES-1). The GRI forecast, which estimates a lower price-growth rate, was used in sensitivity analysis studies.
E-3 - 3 -

EXHIBIT ES-3 CONVERSION OF NATURAL GAS TO TRANSPORTATION FUELS
~" D
ESU
LFU
RIZ
ED
NA
TUR
AL
G
AS
COMPRESSOR — rnMPRP'ssBn
~" D
ESU
LFU
RIZ
ED
NA
TUR
AL
G
AS
W- COMPRESSOR NATURAL
GAS
~" D
ESU
LFU
RIZ
ED
NA
TUR
AL
G
AS
W- COMPRESSOR
MTBE SYNTHESIS
~" D
ESU
LFU
RIZ
ED
NA
TUR
AL
G
AS
ISOBUTYLENES _ MTBE SYNTHESIS
~" D
ESU
LFU
RIZ
ED
NA
TUR
AL
G
AS
MTBE SYNTHESIS
~" D
ESU
LFU
RIZ
ED
NA
TUR
AL
G
AS
l •
MTBE SYNTHESIS
^ » M i B E
~" D
ESU
LFU
RIZ
ED
NA
TUR
AL
G
AS
ISOMEREATION & DEHYDROGENATION
ISOBUTYLENES * •
MTBE SYNTHESIS
^ » M i B E
~" D
ESU
LFU
RIZ
ED
NA
TUR
AL
G
AS
ISOMEREATION & DEHYDROGENATION
ISOBUTYLENES * •
~" D
ESU
LFU
RIZ
ED
NA
TUR
AL
G
AS
ISOMEREATION & DEHYDROGENATION
ISOBUTYLENES * • TAME SYNTHESIS
~" D
ESU
LFU
RIZ
ED
NA
TUR
AL
G
AS
BUTANES • ISOMEREATION & DEHYDROGENATION
ISOAMYLENE
TAME SYNTHESIS ^ TAME ISOMEREATION &
DEHYDROGENATION ISOAMYLENE
^ MFTHrtNOL
METHANOL SYNTHESIS • STEAM REFORMING] METHANOL SYNTHESIS • STEAM REFORMING] METHANOL SYNTHESIS
P-
•
STEAM REFORMING]
^-SYNTHESIS
GAS ^
P- MOBIL MTG
• COMBINATION REFORMING
^-SYNTHESIS
GAS ^ ^
MOBIL MTG
• COMBINATION REFORMING
^-SYNTHESIS
GAS ^ ^
COMBINATION REFORMING SYNTHESIS
GAS ^ ^ MOBILMTO MOBIL MOGD
•GASOLINE AND DIESEL
SYNTHESIS GAS ^ ^ MOBILMTO MOBIL
MOGD •GASOLINE AND
DIESEL PARTIAL OXIDATION
MOBILMTO MOBIL MOGD
•GASOLINE AND DIESEL
• PARTIAL OXIDATION • • PARTIAL OXIDATION •
UPGRADING
• PARTIAL OXIDATION •
FISCHER-TROPSCH
^ UPGRADING
FISCHER-TROPSCH
^ UPGRADING CATALYTIC PARTIA
OXIDATION i, ^-
FISCHER-TROPSCH UPGRADING DIESEL CATALYTIC PARTIA
OXIDATION i, UPGRADING DIESEL CATALYTIC PARTIA
OXIDATION
HIGHER ALCOHOL SYNTHESIS ,. ^ HIGHER ALCOHOL SYNTHESIS
^. PARTIAL OXn>ATION
ZSM-5 OLIGOMERIZATION
PARTIAL OXn>ATION
ZSM-5 OLIGOMERIZATION • GASOLINE • GASOLINE
OXYHYDRO-CHLORINATION
ZSM-S OIJGOMERIZATION
• GASOLINE
OXYHYDRO-CHLORINATION
ZSM-S OIJGOMERIZATION
OXIDATIVE COUPLING
ZSM-S OLIGOMERIZATION
OXIDATIVE COUPLING
ZSM-S OLIGOMERIZATION
1
I I

A summary of the economic analysis of converting natural gas to transportation fuels is shown in Exhibit ES-4. Converting natural gas to methanol and MTBE involves commercial processes, and various facilities have been built where products are being produced and marketed at competitive prices. The cost of producing MTBE from natural gas and n-butane was evaluated and estimated at 86 cents per gallon (cpg). Analysis of the gasoline market shows that MTBE can command a price premium of 30-40 cpg over refinery gasoline gate prices. Thus, MTBE is clearly commercially viable at current gasoline prices, and its competitiveness should continue in the future.
Exhibit ES-4. Comparative Economics of Gas to Transportation Fuel Processes
Process
Liquid phase methanol
UOP-MTBE
IFP higher alcohol
Fischer-Tropsch
Oxidative coupling
Delivered CNG
Product Methanol MTBE C1-C6 alcohol
Gasoline or diesel
Gasoline CNG
Costs (cpg) Feed 24 51 36 52 52 48 Other operating 7 17 22 28 43 11 Capital 12 14 43 58 67 7
Total 44 86 120 137 169 73 Equivalent gasoline (cpg) 74 NA NA 137 169 73 Competing fuels Gasoline Octane
blend compnts.
Gasoline blend
compnts.
Gasoline Gasoline Delivered gasoline
Competing fuel price (cpg) 68 98 68-98 68 68 84
The economic analysis estimated that methanol can be produced from continental U.S. gas at 44 cpg. Viewing methanol as an alternative transportation fuel, the 44 cpg must be translated to an equivalent gasoline basis, accounting for energy density and efficiency differences. On a gasoline-equivalent basis, methanol would be 74 cpg at the plant gate versus 68 cpg for gasoline. Although not a large differential, an even slightly higher price, combined with the formidable hurdles of developing distribution and refueling infrastructure and gaining consumer acceptance, is a major obstacle on the path to commercial success for methanol.
The demonstrated processes are those that have been built at commercial scale and for which cost and technical feasibility have been demonstrated. Conversion of natural gas to liquids using FT is placed in this category. While there are no operating FT gas-to-liquid plants, there are commercial FT units for converting syngas from coal gasification and commercial units for generating syngas from natural gas. The estimated cost of producing liquid fuels from natural gas using a FT process is 1.37 $/gal. (double the current price of gasoline). If gas prices rise faster
E-5 - 5 -

than crude, the gap between the cost of producing FT liquids and gasoline would only widen. The economic hope for a FT process using natural gas may lie with utilizing remote gas resources. The processes analyzed in this study that are in the R&D phase include producing higher alcohols from natural gas and oxidative coupling, a direct methane to gasoline process. Using conversion and selectivity assumptions for oxidative coupling previously used in a Bechtel analysis, the cost of producing a gasoline product would be 1.69 $/gal. This cost far exceeds current gasoline prices. Moreover, review of various oxidative coupling research results indicates that the conversion and selectivity assumed in the Bechtel economic analysis are beyond those that have practically been achieved.
Several processes continue to be studied to convert natural gas to Cj-C6 alcohols. In this study, economics were developed for the EFP process and the estimated cost of the product was 1.20 $/gal. While the higher alcohols merit a market price premium over gasoline, the IFP alcohol product consists of 50-70% methanol and 16-23% ethanol. Because of such poor selectivity to higher alcohols, the process appears economically unattractive. In this process, as in the case of oxidative coupling, the question is whether there is sufficient reason to believe that a major process improvement is achievable that can justify further R&D expenditures.
The most cost competitive of the alternative transportation fuels is CNG. As shown in Exhibit ES-4, CNG can be supplied to the motoring public in many parts of the U.S. at a price less than gasoline on a gasoline equivalent basis. CNG has good engine performance and substantial elements of a delivery infrastructure. The problems with gas is that it is a gas. Compared to gasoline, CNG fuel to drive an equivalent distance occupies four-to-five times the space needed by gasoline. Thus, larger fuel tanks are required. Perceptions about safety may also pose a problem because a gas seems inherently more dangerous to many people than does a liquid fuel, particularly when the gas is under considerable pressure.
Recently, considerable interest has been generated about the possible use of DME (dimethyl ether) as an alternative diesel fuel. In contrast to MTBE and TAME, DME has a high cetane number rather than a high octane number; hence, it is a compression ignition fuel. The cost of producing DME was not evaluated in this study but the process developer has claimed costs similar to methanol. The most interesting aspect of DME is its attractive emissions performance attributes. In sharp contrast to diesel, which has a particulate emissions problem, combustion of DME produces virtually no particulates.
Economics and Use of Gas in Chemical Feedstock and Power Generation Markets
Use of natural gas in chemical feedstock and power generation applications is established. This study analyzed the market for chemical products to assess demand growth and the potential for increased gas usage. Likewise, the issue of increased natural gas use in the power sector was addressed. For each application, use of low-quality natural gas (LQNG) was also compared with use of high-quality natural gas (HQNG).
E-6 - 6 -

Principal uses of natural gas in the chemical feedstocks market are in the production of ammonia, methanol and hydrogen (Exhibit ES-5). The most promising growth area for increased gas usage is in methanol production. U.S. methanol consumption in 1991 was 1.68 billion gallons; in 1995, it is expected to reach 2.75 billion gallons. This growth is primarily attributable to the increased use of methanol to produce MTBE for use in making oxygenated and reformulated gasoline. The high rate of methanol demand growth will diminish after 1995. Use of methanol as a direct transportation fuel is an uncertain factor in assessing long- term demand prospects.
Exhibit ES-5. Use of Natural Gas as a Chemical Feedstock
% of Total Natural Gas Consumed as Feedstock Material Produced Product Use U.S. Market Growth
60 Ammonia Fertilizer Very Low 22 Hydrogen and other Oil refining Moderate 18 Methanol Transportation fuels and
chemicals High
Ammonia production currently accounts for 60% of natural gas used as chemical feedstock. U.S. demand, however, has been stagnant, along with the continued threat of foreign competition from low gas-price regions throughout the world. Because of the small chance for ammonia production capacity growth in the U.S., little opportunity for increased use of natural gas is apparent.
The process conversion routes from natural gas to chemical and power market inputs are shown in Exhibit ES-6 and the economics are summarized in Exhibit ES-7. As can be seen, using high-quality gas as process feed, methanol can be produced at a cost well below current market price, but the market is currently tight and prices are at the height of a short-term spike. More importantly, future prices are expected to support an acceptable return on investment. On the other hand, ammonia prices, which are currently high, still do not cover the return to capital. Market growth and U.S. facility economics provide a consistently bleak outlook for increasing use of natural gas for ammonia production.
Use of gas is increasing as a fuel for power generation due to favorable economics, a 3.7 cent per kilowatt hour cost, supports that growth.
Economics of Using Low-Quality Natural Gas
In all of these cases, LQNG and HQNG were compared for use as a feed. The LQNG considered contained 13% N2. A high nitrogen gas was analyzed because it is most costly to upgrade a low-quality gas with high nitrogen content. In the methanol case, assuming the methanol product would sell at the same price whether using the LQNG or HQNG feed, comparative values of the LQNG and HQNG would be 2.27 $/MMBTU and 2.43 $/MMBTU, respectively. In the ammonia
E-7
- 7 -

EXHIBIT ES-6 CONVERSION OF NATURAL GAS TO CHEMICALS AND POWER
W I
00
METHANOL
DE
SUL
FUR
EE
D
NA
TUR
AL
STEAM REFORMING
METHANOL
DE
SUL
FUR
EE
D
NA
TUR
AL
•
STEAM REFORMING
METHANOL
DE
SUL
FUR
EE
D
NA
TUR
AL
•
METHANOL SYNTHESIS
METHANOL
DE
SUL
FUR
EE
D
NA
TUR
AL
• SYNTHESIS HAS ^
METHANOL SYNTHESIS
_ ^ . A M M O N I A
POWER
ETHYLENE
METHYL CHLORIDE
DE
SUL
FUR
EE
D
NA
TUR
AL
• COMBINATION REFORMING
SYNTHESIS HAS ^
METHANOL SYNTHESIS
_ ^ . A M M O N I A
POWER
ETHYLENE
METHYL CHLORIDE
DE
SUL
FUR
EE
D
NA
TUR
AL
• COMBINATION REFORMING
SYNTHESIS HAS ^
_ ^ . A M M O N I A
POWER
ETHYLENE
METHYL CHLORIDE
DE
SUL
FUR
EE
D
NA
TUR
AL
COMBINATION REFORMING ^ .
SYNTHESIS HAS ^
_ ^ . A M M O N I A
POWER
ETHYLENE
METHYL CHLORIDE
^ . SYNTHESIS HAS ^
_ ^ . A M M O N I A
POWER
ETHYLENE
METHYL CHLORIDE
^ .
_ ^ . A M M O N I A
POWER
ETHYLENE
METHYL CHLORIDE
PARTIAL OXIDATION
^ .
_ ^ . A M M O N I A
POWER
ETHYLENE
METHYL CHLORIDE
PARTIAL OXIDATION
^ .
SECONDARY REFORMER —
PURIFICATION AND AMMONIA CONVERTER
_ ^ . A M M O N I A
POWER
ETHYLENE
METHYL CHLORIDE
PARTIAL OXIDATION SECONDARY
REFORMER — PURIFICATION AND AMMONIA CONVERTER
_ ^ . A M M O N I A
POWER
ETHYLENE
METHYL CHLORIDE
SECONDARY REFORMER —
PURIFICATION AND AMMONIA CONVERTER
_ ^ . A M M O N I A
POWER
ETHYLENE
METHYL CHLORIDE
AIR
_ ^ . A M M O N I A
POWER
ETHYLENE
METHYL CHLORIDE
CATALYTIC PARTIAL OXIDATION
AIR
_ ^ . A M M O N I A
POWER
ETHYLENE
METHYL CHLORIDE
CATALYTIC PARTIAL OXIDATION
AIR
_ ^ . A M M O N I A
POWER
ETHYLENE
METHYL CHLORIDE
_ ^ . A M M O N I A
POWER
ETHYLENE
METHYL CHLORIDE
• STEAM TURBINE GENERATOR
_ ^ . A M M O N I A
POWER
ETHYLENE
METHYL CHLORIDE
COMBUSTION TURBINE GENERATOR
HEAT RECOVERY STEAM GENERATOR
• STEAM TURBINE GENERATOR
_ ^ . A M M O N I A
POWER
ETHYLENE
METHYL CHLORIDE
jp.
COMBUSTION TURBINE GENERATOR
HEAT RECOVERY STEAM GENERATOR
STEAM TURBINE GENERATOR
_ ^ . A M M O N I A
POWER
ETHYLENE
METHYL CHLORIDE
jp.
COMBUSTION TURBINE GENERATOR
HEAT RECOVERY STEAM GENERATOR
_ ^ . A M M O N I A
POWER
ETHYLENE
METHYL CHLORIDE
jp.
+ 1
_ ^ . A M M O N I A
POWER
ETHYLENE
METHYL CHLORIDE
jp.
P
_ ^ . A M M O N I A
POWER
ETHYLENE
METHYL CHLORIDE
jp.
OXIDATIVE COUPLING
P
_ ^ . A M M O N I A
POWER
ETHYLENE
METHYL CHLORIDE
OXIDATIVE COUPLING P
_ ^ . A M M O N I A
POWER
ETHYLENE
METHYL CHLORIDE
_ ^ . A M M O N I A
POWER
ETHYLENE
METHYL CHLORIDE
OXYIIYDRO-CHLORINATION •
_ ^ . A M M O N I A
POWER
ETHYLENE
METHYL CHLORIDE
OXYIIYDRO-CHLORINATION •
_ ^ . A M M O N I A
POWER
ETHYLENE
METHYL CHLORIDE
OXYIIYDRO-CHLORINATION
_ ^ . A M M O N I A
POWER
ETHYLENE
METHYL CHLORIDE
_ ^ . A M M O N I A
POWER
ETHYLENE
METHYL CHLORIDE
I CO I

Exhibit ES-7. Economic Comparison of Natural Gas in Chemical and Power Processes
Process Liquid-phase Methanol Ammonia Combined cycle
Cryogenic nitrogen production
Product Methanol Ammonia Electric Power HQNG Type of natural gas feed High quality Low quality High quality Low quality High quality Low quality Low quality Costs ($/unit product) Unit name
Feed Other operating Capital
Total
Gallon 0.24 0.07 0.12 0.44
Gallon 0.24 0.07 0.12 0.44
Short ton 50 80 57 240
Short ton 46 83 59 240
kWh 0.019 0.005 0.011 0.037
kWh 0.018 0.006 0.012 0.037
106 Btu 1.58 0.31 0.24 2.43
Value of natural gas feed ($/106Btu) 2.43 2.27* 2.43 2.24* 2.43 2.32* 1.71* Product's market price range, 10/93-10/94 ($/unit) 0.46-1.40 104-232 0.046-0.052 2.43
* Assumes product will have same price it would if produced from HQNG.
i i
E-9

case, the values are 2.24 S/MMBTU and 2.43 $/MMBTU, respectively. In the combined-cycle case, the LQNG value is 2.32 S/MMBTU, a range of 0.11 $/MMBTU-0.19 $/MMBTU lower than the HQNG value. These values compare favorably to the cost of upgrading the L Q N G T ^ nitrogen rejection, which would place a value of only 1.71 $/MMBTU on the LQNG. Resuls that make direct use of LQNG appear to be the path to pursue. However, an important element of the economics not considered is LQNG transport to the production facility and product transport to customers. In the case of power, it is expensive to transport if it cannot be marketed locally. In the case of ammonia, no new production facilities are needed. In the case of methanol, the product is needed in the Gulf Coast region, where high N 2 gas production is low.
Thus, the economics of LQNG look favorable, but location of market and production facilities limits opportunities.
Improving Process Economics and Market Potential
The economic analysis serves two purposes. First, it shows the relative cost of providing products using competing process options. Second, it establishes the sensitivity of the production costs to changes in the cost of feed, reductions in capital cost, or improvements in conversion rates or selectivity.
Selected sensitivity analysis cases for FT are displayed in Exhibit ES-8. The exhibit shows that use of a slurry reactor reduces product cost 2 $/bbl. GRI price growth versus DOE price forecast would reduce the initial product cost by 4.60 $^bl. Large differences are achieved if the technology is used in a remote gas area where facility construction costs are comparable to those of the U.S. With gas prices at 0.50 $/MMBTU, production cost would be 36 $/bbl; if plant size were scaled up four times, price could be reduced to 25 $/bbl.
Such indirect conversion processes as FT and methanol production involved high capital cost; the syngas generation step represents 70% of the facility cost for methanol and 56% for FT. Thus, if improvement could be found in this step, the impact would be significant. While syngas production is viewed as an established process, such new approaches as membrane reactor systems could still provide opportunities for further improvement.
In the case of the direct conversion processes, poor conversion and selectivity have been the barrier to achieving competitive process schemes. For these processes, marginal improvement will not suffice. New concepts with the potential to break through the yield barriers are needed for eventual success.
Achieving greater use of natural gas as an alternative transportation fuel is an uncertain prospect. The U.S. Government has set a target of displacing 30% of the crude derived fuels for light-duty vehicle with non-crude-derived by 2010. CNG has attractive economics, but the potential srowth on new motor vehicles to 30% faces both political uncertainty in terms of long-term commitment, as well as the obstacles of developing a delivery system infrastructure, refueling technology, refueling outlets, and consumer acceptance.
E-10

Exhibit ES-8. Fischer-Tropsch Process Economics Sensitivity Analysis
Case Syngas Process
Type FT Reactor
Plant Location
Capacity (B/D)
Gas Price (S/MMBTU) Unit Cost of Product (S/bbl)
Initial Growth Rate Feed O&M
Cap. Charge
Pit. Gate
1 Partial Oxidation
Arge Fixed-Bed
Gulf Coast 14,500 2.43 3.1 21.68 11.91 24.53 59.61
2 Partial Oxidation
FT Slurry
Gulf Coast 14,500 2.43 3.1 20.92 11.88 22.56 56.84
3 Partial Oxidation
FT Slurry
Gulf Coast 14,500 2.43 1.6 20.92 11.88 22.56 54.04
4 Partial Oxidation
FourRX Slurry
Gulf Coast 58,000 2.43 3.1 20.92 7.47 15.05 45.67
5 Partial Oxidation
FT Slurry Asia 14,500 0.50 0 4.30 11.88 22.07 35.95
6 Partial Oxidation
FT Slurry Asia 14,500 0.00 0 0.00 11.88 21.94 31.81
7 Partial Oxidation
FT Slurry Asia 58,000 0.50 0 4.30 7.47 14.86 25.03
E-ll

1. Introduction
The U.S. has substantial uncommitted reserves of natural gas and large quantities of undiscovered conventional resources, as well as such unconventional gas resources as coal bed methane and tight sands. Conversion of gas to liquid fuels and other forms of energy could unlock these resources, reduce the need for imported fuels, and provide a secure supply of liquid fuels.
The three market segments for natural gas utilization are (1) motor fuels, (2) power generation, and (3) chemical feedstock markets. Major routes for converting natural gas to transportation fuels, chemicals, and power are described and process economics for converting natural gas to these products are presented. Use of both HQNG and LQNG have been analyzed in these market applications and economics for them are presented. A sensitivity analysis has also been presented for Fischer-Tropsch economics.
Prior to determining the economics, a literature search was carried out for a wide variety of processes for converting natural gas to fuels for transportation, power and chemical markets. The transportation fuels considered included methanol, MTBE, C1-C6 alcohols, FT liquids, gasoline by direct conversion, and compressed and liquefied natural gas. Production of methanol, ammonia, and ethylene for chemical markets was analyzed; gas use in the power sector was evaluated. A particular process was chosen for detailed studies for each of these products, but alternative ways of making the same product were also discussed.
This report provides the results of these studies, whose objectives included the following:
• Identifying best possible use of domestic resources and ways to decrease dependency on foreign energy sources.
• Determining which processes for converting natural gas are most likely to have a future payout in the form of economical processes that can be commercialized.
• Providing a better understanding of natural gas supplies, current and future utilization and pricing, and applying this knowledge to making decisions about transportation fuels.
• Determining which processes to emphasize in future research, development, and demonstration projects to benefit our country most.
1-1

2. U.S. Natural Gas Supply and Market Analysis
2.1. Supply
Interest in "gas-to-liquids" has been tied strongly to the supply/demand picture for both natural gas and crude oil. In the 1970s, the price of international crude oil rose rapidly. During that same period, gas supplies in the U.S. were shrinking and, while prices were regulated, increases were being allowed for "new" gas supplies. In the U.S. crude-oil and natural-gas price and supply environment of the 1970s, the interest in gas-to-liquids focused on converting remote gas, which had a low market value, to liquids and transporting the liquids to U.S. markets. The potential sources of remote gas considered were Alaska, the Middle East, and Southeast Asia. However, during the 1980s, the U.S. supply/demand and price paths for crude oil and natural gas followed directions that differed from what had been forecast; consequently, the gas-to-liquid focus changed.
Increasing crude oil and gas prices of the late 1970s and early 1980s resulted in a response of falling demand and surplus supply. However, the oil and gas supply surpluses differed greatly for oil and gas. In the case of oil, the supply surplus was international and resulted in falling international and domestic crude oil prices. The U.S. oil supply from domestic sources has, as a consequence of the crude oil price decline, steadily declined since 1985. Increases in oil imports have been required to meet demand. By contrast, the gas supply surplus has been within the U.S., and, while gas prices declined when crude prices declined, additions of new gas supply and production capability have maintained a surplus.
U.S. natural gas production and productive capacity are shown in Exhibit 2-1. Surplus productive capacity has existed since 1980. Since 1986, the gap between capacity and production has been slowly closing as capacity has been declining slightly and demand increasing.
Since the U.S. produces about 10% of its proven natural gas reserves each year, new reserves have had to be added annually to maintain the productive capacity for the past decade. Much of these reserves has been added in a relatively weak gas market, i.e., low prices. This has occurred for several reasons [1,2].
• Infield drilling and new drilling technology have resulted in significant revisions to the reserve estimates of known fields.
• As gas market prices have fallen, so have finding costs. This has resulted from a combination of declining drilling costs and increases in reserves added per well drilled.
• Tax incentives have encouraged the development of non-conventional gas reserves, such as coal bed methane and gas from tight formations. In 1992 about 10% of production came from non-conventional sources (approximately 2/3 from tight gas and 1/3 from coal bed methane).
2-1

ExMbit2-l Natural Gas Production and Productfve Capacity by Month, 1980-1992
80 -
70 -
a 1*H i2
O 30 H e
a 20
10 H
Production Productiva Capacity
0 ^WT1WWf«l|ill|lll|iplWIHIII|IIWIIIIIIIilllllWII|llllll|IIIIIIWIHIIIIIII(l»)WIIIIWIWIIHI»wpw<wWWI •• % I » n n •
1980 1981 1982 1983 1984 198S 1986 1987 1988 1989 1990 1SS: '992
Sara: Energy Information Administrate!, Natural Gas Pmducth* Capacity (or &* Lowtr *3 Stim: !S& through 193X
2-2 - 1 4 -

Prospects for being able to sustain future U.S. supply to meet gas market requirements by continuing to add the reserves needed is now viewed with much greater optimism than in the 1970s. Exhibit 2-2 shows the current estimates of undiscovered natural gas resources in North America [3].
2.2. Demand
Natural gas is now being consumed in five market sectors in the United States, as shown in Exhibit 2-3. The historical consumption in these markets is shown in Exhibit 2-4. The largest consuming market sector is the industrial sector. The historical plot of industrial gas consumption reveals some of the significant changes that have affected U.S. gas markets. Li the price-regulated environments of the early 1970s, demand was rising rapidly, but new supplies were being added at too slow a rate to keep pace with increased demand. This led to supply shortages and curtailment of gas supplies to consumers and priorities of services, which brought about declines in demand in the industrial and utility sectors. Again in the early 1980s, increasing energy prices for oil and gas, conservation measures, and a shift away from heavy industry led to further declines in industrial and utility demands.
In the past five years, there has been an increase in industrial demand. The largest element of this increase has been the demand originating in cogenerators and non-utility generators (NUGs) of electricity. Thus, while the electric utility sector appears to be falling slightly, the actual overall use of gas for electricity generation has been rising.
About 92% of the gas used in the industrial sector is for fuel and power; the remaining 8% of the gas consumption is used for process feedstocks. That means that about 3.5% of total natural gas consumption is used as feedstock. Natural gas is used as a feedstock to produce the following three materials [4]: ammonia, hydrogen, and methanol. The percent of total natural gas consumed as process feedstock for each of the three materials is 60,23, and 18, respectively.
2.3. Gas Markets of the 1980s and Search for New Markets
The surplus gas availabilities and lower prices in the late 1980s prompted gas producers and marketers to seek new market opportunities, especially where attractive prices might be achieved. There has been interest in three market areas: power generation, chemical feedstocks, and transportation fuels. The most significant growth to date has been in the power generation area. Natural gas has been an attractive fuel for new cogeneration and non-utility generators because:
• Relatively high-generation efficiencies of natural gas-fired combined-cycle plants, along with lower gas prices, yield attractive generation economics.
• Gas-based generation systems are smaller in scale than other fossil-generation systems and are often more compatible with cogeneration and NUG market needs. The smaller-scale systems have also been attractive to utilities that have become fearful of having large-capacity expansions judged as being investments that were not "prudent."
2-3

EXHIBIT 2-2 Current Estimate of Undiscovered Natural Gas Resources
Volumes in Trillion Cubic Feet
Undiscovered Resources Proved Resources
Note: Resource base estimates include resources in areas currently off limits to exploration and development. Resource and Mexico reserve data are estimates as of December 31,1990, using current technology. Other proved reserve data are estimates as of December 31,1992, using current technology.
Sources: Reproduced from "Natural Gas 1994, Issues and Trends," DOE/EIA 8520, July 1994.
2-4 -16-

EXHIBIT 2-3 NATURAL GAS SUPPLY AND DISPOSITION
IN THE UNITED STATES, 1992 (TRILLION CUBIC FEET)
Gross Withdrawals from Gas and Oil Wells
22.1
Natural Gas Storage Facilities
Natural Gas Processed
16.0
Natural Gas Markets
Residential Commercial Industrial Vehicle Fuel Electric Utility 4.7 2.8 7.5 0.0005 2.8
2-5

EXHIBIT 2-4 Natural Gas Delivered to Consumers in the United States, 1965-1992
Source* 1935-1975: Bureau 0/Mines, Minerals Yearbook, 'Natural Cu" chapter. 1976-1978: Energy Information Administrator Production and Consumption. 1979. 1980-1992: Form E1A-I76, "Awuuil Report of Natural tuul Supplemental (*n Supply tuut IHuriltutum.

• Natural gas has excellent environmental characteristics.
Opportunities in the chemical feedstock market may, in fact, be indirectly tied to the transportation market. Two of the three products that use natural gas as a feedstock are tied to the transportation fuel market to a significant degree. Natural gas is used for production of hydrogen. The greatest demand for hydrogen is in the crude-oil refining process to improve yields and reduce the sulfur content of transportation fuels. Methanol has a number of chemical market uses, but growth in methanol demand is tied to expanding use in the production of MTBE (for which methanol is required) and direct use of methanol as a transportation fuel.
Of the three market opportunities, this interim report focuses primarily on the transportation fuel market, which is discussed in detail in Section 3.
2.4. Gas Supply and Demand Issues—Low Quality Gas
The quality of natural gas in the U.S. resource base was described in a previously published report [5]. In that report, a portion of the current proven reserves was defined as LQNG because the gas produced from some reservoirs contains sufficient amounts of non-hydrocarbon gases to lower the heating value or other properties of the natural gas to levels below commercial pipeline standards. LQNG is a natural gas that contains more than 2% carbon dioxide, more than 4% nitrogen, or more than 4% combined carbon dioxide and nitrogen. The analysis of the quality profile of U.S. natural gas resource is based on a detailed study [6] of the chemical composition of current resources and estimated composition of undiscovered gas.
Analysis of the data base of natural gas resources provides the breakdown shown in Exhibit 2-5 for each of the LQNG reserve categories. Four columns are shown in the table to clearly identify the part of the resource that contains high amounts of both CO2 (>2%) and N2 (>4%).
Exhibit 2-5. Reserves of Natural Gas Classified According to Contaminant Level
Category
Low Quality Natural Gas, % of Reserves
Category
>2%C0 2but <4%N 2
<2% C0 2
but >4%N 2
<2% C0 2 and <4%N 2but >4% CO2+N2
>2% C 0 2
and >4%N 2
Total LQNG
Proven 18.6 13.1 1.0 1.6 34.3
Probable 33.7 8.0 0.7 1.8 44.3
Undiscovered 31.4 7.2 0.4 3.1 42.0
Total 29.4 8.6 0.6 2.5 41.1
2-7

While Exhibit 2-5 indicates that 34% of proven reserves are low quality and 41% of the total resource base is potentially low quality, additional analysis of the data base showed that the low quality gas resources contained only moderate amounts of impurities. The C 0 2 plus N 2 content of proven reserves are shown in Exhibit 2.6. As can be seen, approximately 88% of the proven reserves have less than 10% C0 2 + N 2 and about 98% of the proven resources have less than 20% C0 2 + N 2.
Exhibit 2-5 indicates that, of the LQNG resources, only 1.6% has both high N 2 and high C0 2 . Consequently, upgrading LQNG is a matter of removing either C0 2 or N 2 from most LQNG gas streams. In Section 9, conversion of LQNG directly to liquids options is compared with upgrading it to pipeline quality.
2.5. Gas Supply and Demand Issues—Use of Remote Gas
There are large supplies of natural gas in regions of the world with small demand markets. Li the U.S., natural gas reserves are 165 trillion cubic feet and annual production is about 10% of reserves. By contrast, reserves in the Middle East are about 1,500 trillion cubic feet and annual production is only about 1/2 of a percent of the reserves.
Because natural gas is expensive to transport when pipeline links are not available and ocean vessels are the only option, there is large variation in gas prices between developed gas market areas (Europe or continental U.S.) and remote regions, such as the Persian Gulf The attraction of the vast resources and lower gas prices in some regions, such as the Persian Gulf, continues to generate interest in utilizing the gas resources in these regions for gas-to-liquid projects and shipment of the liquid products to market areas.
The lower gas prices in remote regions must offset the added higher facility investment and transportation costs that occur when building gas-to-liquid plant facilities in remote locations and transporting the liquid products to market areas. Exhibit 2-7 illustrates this point by comparing the production and transportation costs for conversion of natural gas to methanol at different locations [7].
2-8

1 Exhibit 2-6
i vo
PROVEN RESERVES VS. CO, PLUS No CONTENT
0) >
CD CO CO
cc c CO > o
o
100
8 0
6 0
4 0
2 0
0 0
Lower 48 States
/
5 10 15 Carbon Dioxide Plus Nitrogen Content, vol%
20
i

Exhibit 2-7. Methanol Production Cost (^/Gallon)
Production
-u Plant Locations
Production U.S. Gulf Coast Persian Gulf Alaska
Gas Feedstock 22 6 4
Other Operating 7 7 10
Capital Charges 12 14 26
Total Production 41 27 40
Transportation to U.S. 0 9-27 3-6
2.6. Price Outlook
The price of natural gas and future price growth are important to the economics of gas-to-liquid conversion processes. Since gas-derived products primarily compete against crude-oil derived products, the future prices of natural gas versus crude oil are also important.
This study used the natural gas and crude oil price projections contained in the 1994 Annual Energy Outlook [7] developed by DOE/EIA. The oil and gas price forecast is given in Exhibit 2-8. In EIA's 1994 forecast, future gas prices were projected to grow at a faster rate than crude oil. Li recent years, virtually all energy forecasters have projected gas price growth at a higher rate than crude oil prices. The assumption of higher future gas price growth rate relative to crude oil makes it more difficult for a process using a gas feed to be economically attractive versus a process using a crude oil feed.
A new set of energy price forecasts have recently become available [8, 9], and Exhibit 2-8 shows the 1995 EIA Outlook and the latest GRI forecasts. As can be seen again, gas price growth is projected to exceed crude oil price growth. The growth rate is somewhat closer. The drawing together of oil and gas price growth, however, is not sufficient to change the outcome of the economic analysis done using the 1994 forecast, based on sensitivity analysis studies.
2-10

Exhibit 2-8. Forecasts of U.S. Oil and Natural Gas Prices (US$ 1994 prices)
Price in
Growth Rate (%)
Forecast 1993 2000 2010 1993-2010
1994 DOE Outlook Gas (S/MCF) Oil ($/bbl)
1.79 18.65
2.48 21.25
3.56 28.88
4.1 2.6
1995 DOE Outlook Gas ($/MCF) Oil ($/bbl)
2.02 16.12
2.29 19.13
3.37 24.12
3.1 2.4
1995 GRI Forecast Gas ($/MCF) Oil (S/bbl)
2.06 16.42
2.53 18.58
2.71 20.54
1.6 1.3
2.7. Summary
Availability of natural gas for the next 20 years to meet U.S. needs is projected to be adequate. Needs can be supplied from North American gas resources. The U.S. gas supply surplus, which has existed for the past decade, is disappearing; this will induce a higher rate of price growth. Gas use will continue in the present markets. The growth in use of gas for power generation may decline with rising prices. The transportation market appears to be a potential growth market but development is in an early stage and long-term prospects can only be judged as uncertain at this stage.
2-11

3. Transportation Fuels Market
For the past seventy years, the principal fuels for motor vehicle transportation in the U.S. have been gasoline and diesel fuel derived from crude oil. Gasoline is consumed by automobiles and light duty trucks while diesel fuel is primarily consumed by heavy duty vehicles, buses and heavy trucks. In 1992 over 110 billion gallons of gasoline were consumed in the U.S. and diesel fuel consumption was about 24 billion gallons. A small amount of propane has been used as a vehicle fuel over the years but currently propane powered vehicles account for less than 0.2% of the vehicle population.
While the use of alternative fuels in motor vehicles has not been significant in the U.S., there is a substantial volume of alcohols (primarily ethanol) and ethers (primarily methyl tertiary butyl ether) blended into the gasoline product as shown in Exhibit 3-1.
In recent years pressure in the transportation fuels market has been growing for additional use of alternative fuels. The pressures come from several sources - environmental, government policy and market economics.
3.1. Pressure for Market Change
During the 1970s and 1980s in the U.S., there has been an effort to reduce harmful vehicle emissions. The approach during this time period was to change gasoline fuel requirements and to modify the design of gasoline vehicles. The Clean Air Act of 1970 began the effort to reduce vehicle emission. The 1970 Clean Air Act (CAA) permitted the regulation of fuel additives and it established a schedule for reducing lead use in gasoline. In 1973 the catalytic converter was introduced to reduce vehicle tail pipe emissions. As lead was eliminated, its octane boosting effect was replaced by increasing the aromatic content of gasoline and by adding high octane blending components such as methyl tertiary butyl ether (MTBE).
In the late 1980s and early 1990s the question of vehicle fuels was revisited by government policy makers. Two policy positions were reached and translated into new legislation:
(1) Lower vehicle emissions can be achieved with the use of new clean fuels.
(2) The growth in U.S. oil imports can be diminished with economic incentives and mandates to use clean alternative fuels not derived from crude oil.
3-1

Exhibit 3-1. Summary of U.S. Vehicle Fuel Consumption, 1992
Fuel Consumption Gasoline Equivalent
(Million Gallons) Traditional
Gasoline1 110,135 million gallons 110,315 Diesel 21,375 million gallons 23,866
Alternative Fuels M-852 2 million gallons 1 M-1003 * *
E-854 * *
E-955 * *
LPG 250 million gallons 184 CNG 511 million cubic feet 4 LNG * *
Hydrogen * *
Replacement Fuels (Included in Gasoline)
Ethanol in Gasohol6 1,061 million gallons 701 MTBE 1,445 million gallons 1,175
•Value represents a negligible amount 'Gasoline includes the replacement fuels, ethanol and MTBE. 2 A fuel mixture of 85 percent methanol and 15 percent gasoline. 3 A fuel consisting of 100 percent methanol. 4 A fuel mixture of 85 percent ethanol and 15 percent gasoline. 5 A fuel mixture of 95 percent ethanol and 5 percent gasoline. 6 A fuel mixture of 10 percent ethanol and 90 percent gasoline. Notes: Fuel terms are defined as follows: LPG, liquefied petroleum gas (propane); CNG, compressed natural gas; LNG, liquefied natural gas; MTBE, methyl tertiary-butyl ether, E-85 (15% gasoline and 85% ethanol), M85 (15% gasoline and 85% methanol), M100 (100% methanol). Sources: Gasoline consumption: Energy Information Ackiinistration, Petroleum Supply Annual 1992, Vol. 1, DOE/EIA-0340(92)/1, (Washington, D.C., May 26,1993), Table S4, adjusted to include field ethanol blended and to cover only highway uses. Highway use was estimated as 97.1 percent of total gasoline supplied, based on 1990 data published in the Transportation Energy Data Book: Edition 13, prepared by Oak Ridge National Laboratory for the U.S. Department of Energy (Oak Ridge, TN, March 1993), Table 2.7.Highway diesel consumption:Energy Information Administration, Fuel Oil and Kerosene Sales 1991, DOE/EIA-O535(01) and Fuel Oil and Kerosene Sales 1992, DOE/EIA-0535(92); and Federal Highway Administration, Spastics of Highway Special Fuels Use, Table 1. M-85: California Energy Commission (facsimile provided). CNG: Energy Information Administration, Natural Gas Annual 1992, DOE/EIA-031(92)(Washington, DC, December 1992), Table 1. LPG: Estimated as 50 percent of engine fuel reported by American Petroleum Institute, 1992 Sales of Natural Gas Liquids and Liquefied Refinery Gases (Washington, D.C., October 1993) which shows a total of 500 million gallons engine fuel use. Ethanol and MTBE: Energy Information Administration, Petroleum Supply Monthly, DOE/EIA-0109(93/0 l)(Washington, DC, January 1993), Appendix D. Reference: "Alternatives to Traditional Transportation Fuels: An Overview", DOE/EIA-0585/0, June 1994, Table ES2, page xiii.
3-2

The three legislative acts of the late 1980s and early 1990s that impact transportation fuels are summarized in Exhibit 3-2. The Alternative Motor Fuels Acts of 1988 provided an incentive to auto makers, in the form of a CAFE credit, to produce alternative fuel vehicles.
Exhibit 3-2. New Transportation Fuels-Government Policy Steps
I ALTERNATIVE MOTOR FUELS ACT 1988
• CAFE credit for Alternative Fuel Vehicle Production
H CLEAN AIR ACT AMENDMENTS OF 1990
• 1992 Winter Oxygenated Gasoline for CO Non-Attainment Areas
• 1995 Reformulated Gasoline for Ozone Non-Attainment Areas
• Requirements for Fleets to Use Clean Alternative Fuels
• Clean Alternative Fuels: Alcohols, Reformulated Gasoline, Natural Gas, LPG, Reformulated Diesel, Hydrogen, Electricity
m ENERGY POLICY ACT OF 1992
• Primary Aim — Reduction of Oil Imports
• Alternative Fuel Vehicle Fleet Requirements
• Tax Deduction, Tax Credits, Etc.
• Alternative Fuels: Alcohols, Natural Gas, LPG, Hydrogen, Biomass Derived, Coal Derived, Electricity
The Clean Air Act Amendments (CAAA) of 1990 focused on the environment and took a number of steps to reduce vehicle emissions by requiring a number of new standards for motor vehicle fuels. The CAAA provided for the EPA to issue regulations and delineate clean fuel requirements and vehicle emission standards. The implementation of the CAAA has required the use of oxygenated gasoline in the winter months in areas that exceed CO air quality standards. In these "non-attaining" CO areas a minimum oxygen content provided by adding alcohol or ether, such as MTBE to the gasoline is required. For areas not attaining the ozone standard the use of reformulated gasoline is required year
3-3

around. Reformulated gasoline has a number of composition requirements, one of which is a minimum oxygen content requirement. The consequence of the CAAA is that in 1995 over 40% of the gallons of U.S. gasoline sold will contain from 2-2.7% oxygen. A 2.7% oxygen requirement translates to 15% MTBE or 7.7% ethanol by volume. The CAAA also requires the production of clean fuel vehicles. The Act defines clean alternative fuels as methanol, ethanol, other alcohols, reformulated gasoline, reformulated diesel (trucks only), natural gas, liquefied petroleum gas (LPG), hydrogen, or electricity.
The primary aim of the Energy Policy Act of 1992 (EPACT) is the reduction of crude oil imports. EPACT set a national goal of 30% penetration of non-petroleum fuels in the light-duty vehicle market by 2010 and requires the purchase of alternative fuel vehicles for government fleets and also for private fleets, if needed to achieved volume usage goals. The Act also creates tax incentives for vehicle buyers and for alternative fuel service station operators. As indicated in Exhibit 3-2, the alternative fuels defined by EPACT includes the alcohols, natural gas, LPG, hydrogen, biomass derived fuels, coal derived fuels and electricity.
There has been concern expressed that the EPACT goal of 30% will not be reached by 2010. For example, a projection by David Gushee of the Congressional Research Service [10] shows that the volume of non-petroleum fuels will fall far short of the 30% target in 2010 (see Exhibit 3-3).
3.2. Market Segments
In addressing the question of possible entry of new fuels into the U.S. motor vehicle market there are two important ways to break the market down. The first is the type of use (e.g., bus versus personal passenger car) and secondly, by the way the vehicle is fueled (e.g., at a service station versus a fleet vehicle terminal). As shown in Exhibit 3-4 gasoline is currently the primary fuel for automobiles and light trucks. Diesel fuel is the primary fuel for the heavy trucks and for many of the off-highway vehicles and buses.
3-4

EXHIBIT 3-3 NON-PETROLEUM TRANSPORTATION FUELS
NON-PETROLEUM TRANSPORTATION FUELS
Billions of Gallons
tm.rrtra.rp OQjflJ 1078 1981 1084 1087 1000 1003 1006 1000 2002 2005 2008
£]h«no! Natural Gaa
^ MTBE liiiiU Molhanol
G£3 Propena fLPQ> L.-.J Gioclrlc C«r»
i en
Sourefl: {.fVSHEB
MTBE (no|Md»a all maihyf «|h«fa Elhano? lil)Uorf«a othyl Mfi«»a

Exhibit 3-4. Transportation Energy Use By Vehicle Type, 1990
Vehicle Type
Gasoline (Trillion
Btu)
Diesel (Trillion
Btu)
Gasoline (Percent Total
Btu)
Number of Vehicles
(Thousands)
Highway
Automobiles 8,946 121 98.7 143,550
Motorcycles 24 100 4,260
Buses
Transit 0.2 79 0.3 61
Intercity 22 0.0 21
School 30 33 47.4 508
Trucks are Highway
Light Trucks 4,002 152 96.3 38,650
Other Trucks 604 2,779 17.9 4,538
Off-Highway
Construction 31 179 15.0
Farming 64 392 14.0
Source: "Transportation Energy Data Book: Edition 13", ORNL-6743, by Stacy C. Davis, Sonja G. Strang, March 1993.
Fleet vehicles are a logical target market for new alternative fuels. There is a markets dilemma in vehicle fuel markets - to make the fuel/vehicle system attractive to potential users there have to be sufficient refueling locations to provide consumer comfort about fiiei supply, and at the same time there have to be enough customers for a refueling location to justify installation of equipment to provide the fuel. That dilemma is overcome with fleet vehicles since many fleets refuel at their own fleet terminal locations. Of the 143.6 million automobiles in the U.S., about 8.2 million are cars in fleets often or more as shown in Exhibit 3-5 below.
3-6

Exhibit 3-5. Automobile Fleets by Use in 1991 (Thousands)
Type of Fleet1 Number of Automobiles % of Total Business 3,466 42.3 Individual Leased 2,008 24.5 Government 619 7.6 Utilities 544 6.6 Police 250 3.1 Taxi 141 1.7 Rental 1,160 14.2
TOTAL 8,188 100
Source: ORNL-6743 from Bobit Publishing Company, Automotive Fleet Research Department, "1992 Automotive Fleet Fact Book", Redondo, CA, 1992 'Ten or more cars in fleets
Many heavy duty trucks also operate from fleet terminals that have fueling tanks as shown in Exhibit 3-6 below.
Exhibit 3-6. Diesel Fuel Tank Storage Data For Trucking Operations*
Category of Respondent By Truck
Fleet Size % of Trucking Firms
Operate From Only 1 Terminal (% of Category)
Have Diesel Tank Storage
(% of Category) 1-9 22 81 71
10-24 24 66 65 25-99 26 61 74 100+ 28 31 87
* Data for Sample of 437 Trucking Operations Survey by Newport Research in 1988 Source: Data provided by Robert Crump, Newport Research, Bethesda, Md.
3-7 - 3 0 -

Having company-owned fuel storage at terminals should not, however, be taken to mean that these terminals are the only fueling locations for the firm's trucks. Despite the large percentage of truck firms with company-owned fuel storage, shown above, there appears to be a trend towards greater use of truck stops for fueling trucks. The National Petroleum Council (NPC) study on "Petroleum Storage and Transportation in 1989 [11] estimated that in 1986,60% of the diesel fuel used was obtained at truck stops and 40% at company owned facilities. The National Association of Truck Stop Operators provided an estimate of about 70% purchased at truck stops based on 1989 data.
Even though fleet operators may prefer the added convenience of refueling at highway service locations they remain a favored target market for potential alternative fuel producers seeking to establish a market position.
3.3. Use of Gas and Gas-Derived Products
There are three routes by which natural gas can be used in the transportation fuels market:
1) Synthesize a conventional gasoline or a diesel product from natural gas,
2) Produce a material that can be blended into gasoline, such as an oxygenate,
3) Use gas directly as compressed natural gas (CNG) or convert the gas to other, new alternative transportation fuels, such as methanol.
For the first option the question is whether gasoline or diesel fuel can be synthesized from natural gas at a cost which is competitive with gasoline and diesel produced from crude oil. This issue will be discussed in the Economic Analysis Section (Section 8). As has already been described, there is an existing and growing market for oxygenates. Oxygenates must be included in gasoline product to meet CAAA requirements. The oxygenate market presently exists and is growing as the CAAA requirements expand in the 1995-2000 time frame. The primary use of gas and gas-derived liquid products in the transportation market is now in the production of MTBE. There are ways to improve MTBE synthesis routes and to produce other oxygenate products (other ethers and alcohols) that may be worth pursuing to maximize the opportunities for natural gas uses in transportation. Gas derived oxygenate products face competition in the oxygenate market from biomass derived ethanol. Ethanol is not cost competitive but is highly subsidized by the Federal Government and some state governments and there has been heavy political lobbying to expand its use as an oxygenate.
3-8

The third option listed above is to use gas as an alternative fuel. The primary routes are to use gas directly as an engine fuel or to convert it to the liquid fuel product methanol. Section 3.4 describes the attributes of natural gas and methanol relative to gasoline and diesel and discusses the potential problems that are faced in successfully establishing these fuels in the U.S. transportation market. Vehicle and engine systems will be discussed along with the delivery and fueling systems that will have to be established for successful market penetration.
3.4. Fuel Physical Properties
Exhibit 3-7 provides an overview of the physical properties of gasoline, diesel, methanol, MTBE and CNG. These properties have important impacts on the vehicle and engine systems and on the distribution and refueling processes. The following discussion will contrast CNG, methanol and MTBE with fuels now in use.
3-9

Exhibit 3-7. Physical Properties of Gasoline, Diesel, and Selected Alternative Fuels
Properties Gasoline Diesel Fuel MTBE CNG Methanol Constituents Hydrocarbon Mixture (C2 -
C ] 0) Hydrocarbon Mixture (C ) 2 -C 2 0)
(CH3)3 COCH3 Approx. 90% Methane (C2, C3, C0 2 ,H 2 ,He,N 2 )
CH3OH
Boiling Range (°F) 80 to 420 320 to 720 131 -259 149 Reid Vapor Pressure 8-12 0.2 7.8 2400 4.6 Density (lb/gal) 5.8 to 6.5 6.5 to 7.3 6.19 1.07 6.6 Energy Content (LHV)
Btu/lb 19,000 18,900 15,100 21,300 8,600 Btu/gal 115,000 128,000 93,500 22,800 56,560
Heat of Vaporization Btu/lb 140-170 100-200 138 219 506 Autoignition Temperature (°F)
450 to 900 400 to 500 815 1,350 878
Flashpoint (°F) -45 125 (min) -14 -300 52 Octane Number (R+M)/2 87 to 93 N/A 108 120 99 Flammability Limits (vol% in air)
1.4 7.6
0.7 5.0
1.6 8.4
5.3 14.0
6.7 36.0
Water Solubility (%) Negligible Negligible 4.3 - 100 Flame Speed (ft/sec) 1.3 1.3 1.1 1.3
3-10

There is wide variation in the composition of natural gas at the wellhead but gas processing removes much of the light hydrocarbons, C0 2 , N 2 and S before entering the pipeline system. While pipeline gas is predominantly methane, there are still some variations in composition based on gas processing practices and the time of the year. Exhibit 3-8 shows the range of variation for pipeline gas quaHi*ir ten major urban areas. This variation can increase because some local gas utilities inject propane/air mixtures into natural gas during seasonal periods to reduce the need for gas. Variations in the natural gas quality can cause some problems during fueling. For example, the heavier hydrocarbons condense out when the compressed gas expands at the regulator, and any water content in the gas can also pose a problem with the water forming ice or hydrates with the gas.
Exhibit 3-8. Weighted National Statistics for Natural Gas in Ten Major Urban Areas of the United States Without Propane/Air (P/A) Peakshaving1
Component Mean 10th Percentile 90th Percentile
Methane (Mole %) 93.2 88.5 96.4
Ethane (Mole %) 3.6 1.8 5.0
Propane (Mole %) 0.8 0.3 1.3
C4+ (Mole %) 0.5 0.1 0.6
C0 2 + N2(Mole%) 2.7 1.0 4.7
Heating Value (Btu/scf) 1,037 1,023 1,050
Specific Gravity 0.603 0.578 0.628
Wobbe Number2 1,338 1,312 1,357
Air/Fuel Ratio (Mass) 16.3 14.7 16.8
Propane/Air peak sharing" (P/A) refers to the addition of propane/air mixtures to natural gas during peak demand periods in order to reduce the need for natural gas. 2 Wobbe number is the high heating value on a volumetric basis divided by the square root of the specific gravity relative to air. It represents a measure of energy flow through an office.
Source: William E. Liss and William H. Thrasher, "Natural Gas as a Stationary Engine and Vehicular Fuel," Society of Automotive Engineers (SAE), Paper No. 912364 (Warrendale, PA, 1991), p. 46.
3-11

Methanol is synthesized by replacing one of the hydrogens in methane with an OH radical. The addition of the OH radical adds polar characteristics to these molecules. Alcohols with small hydrocarbon structures like methanol have strong polarity, while alcohols with larger hydrocarbon structures have weak polarity. MTBE and ETBE, which are made from methanol and ethanol respectively, are ethers. Ethers do not have the OH radical, and have little or no significant polarity. Polarity in a molecule is a highly cohesive molecular bonding force.
At room temperature, low molecular weight substances like methanol would be gases if polarity did not keep them collapsed into liquids. When methanol is dissolved in a nonpolar solvent like gasoline, the alcohol molecules become separated, and the molecular cohesion is weakened. The alcohol behaves more like a gas in such a mixture and results in a larger than anticipated increase in vapor pressure for the gasoline mixture than would be expected based on the vapor pressures of the pure alcohol or gasoline. However, when alcohol concentrations in gasoline are at the 85 percent level, the Reid Vapor Pressure of the mixture is lower than that of gasoline alone. In addition, if water exists as a second phase with the gasoline, the polar alcohols will be drawn to the water, which is also highly polar. This becomes an issue in transporting and storing fuels because water frequently exists in tank bottoms and pipelines. Methanol is highly toxic, and raises safety concerns for human ingestion, eye or skin contact, and inhalation. Extra precautions are needed when handling methanol compared with gasoline.
Volumetric energy density can be an important consideration for a transportation fuel. Conventional gasoline, oxygenated and reformulated gasoline, and diesel, which are liquids, have the highest energy densities. Methanol is a liquid at atmospheric pressure and ambient temperatures, so it is stored and handled similarly to gasoline. However, on a volume basis methanol has about half the energy content of gasoline. The lower energy density implies that at equivalent engine efficiency (miles per Btu), a pure-alcohol-fueled vehicle would travel half to two-thirds as far as a gasoline-fueled vehicle using the same size tank. These efficiency differences are compensated for, slightly, by improvements in efficiency that can be realized in spark ignition engines using alcohols compared to gasoline. E85 (a mixture of 85% ethanol and 15% gasoline) and M85 (85% methanol, 15% gasoline) have slightly higher energy densities than neat ethanol and methanol because of the addition of gasoline. Natural gas is stored in the vehicle fuel tanks under pressure as a compressed gas. Even under fairly high pressure, both the density and energy density of natural gas is considerably less than those of a liquid fuel.
The difference in energy densities has a pronounced effect on vehicle storage equipment. At 3000 psi, a typical pressure for CNG vehicle fuel tanks, the volumetric energy density of natural gas is about one fifth that of diesel fuel and one fourth of gasoline. Thus, if all other efficiencies were equal, a CNG vehicle tank would be four times the size of a gasoline tank to cover the same driving range [12]. For comparison, the weight of the fuel and tank in pounds per gallon of diesel fuel equivalents are 47 lbs for natural gas in a steel cylinder, 36 lbs for natural gas in a fiber-reinforced steel tank, 26 lbs for natural gas in an advanced fiber-wrapped aluminum cylinder, 18.4 lbs per gallon diesel equivalent for methanol in a conventional tank, and 9 lbs per gallon for diesel in a conventional tank [12].
3-12

Despite the large variation in vehicle storage requirements that results from energy density differences, the energy density impact on engine performance is less dramatic. When fuels are combusted in spark ignition engines, they are primarily in a vapor or gaseous phase, and gas energy densities are related to molecular weight and the relative hydrogen/carbon/oxygen content of the molecules. While considerable energy volume density differences exist between methane and the higher molecular weight compounds in gasoline, in all cases, the gas that enters the cylinder is a mixture offuel and air. The air is a far larger component of the gas entering the chamber than the fuel. The volume of air coming in is regulated to contain the amount of oxygen needed to combust all the fuel (a stoichiometric mixture), and since air is about 80 percent nitrogen, a large amount of air is added to the fuel to provide the required oxygen.
Volatility indicates a fuel's ability to vaporize under different temperatures and pressures. It is the property that affects startup engine performance the most. While high volatility is desirable in cold weather, it can cause loss of power or vapor lock in warmer weather. High volatility can also lead to increased evaporative emissions. Thus volatility is controlled both for engine performance as well as emissions.
Volatility is not an issue with CNG. As a gas it does not need to vaporize before burning, making cold-start enrichment or further blending for cold start reasons unnecessary. Cold-start enrichment is a primary source of carbon monoxide emissions in gasoline-fueled vehicles.
The alcohols are less volatile than gasoline when methanol is used in neat form or as an 85 percent alcohol blend (M85). The Reid Vapor Pressure for methanol as a pure component is 4.6, and varies for gasoline blends with between 8 and 15. Methanol is insufficiently volatile for cold engine starts, even at moderate temperatures. Because of the low volatility, the most critical performance issues for the methanol fueled-vehicles are the cold start-up problem and misfiring during warmup [13].
Various solutions to the cold start problem have been identified for neat alcohols, including carrying an on-board supply of a volatile fuel such as gasohol or propane for start-ups. The addition of gasoline to alcohol fuels helps to improve the cold start-up problem. Current engine technology for dedicated methanol fuel use is designed for M85 [14]. One original equipment manufacturer demonstrated engine cold-start capability with M85 down to temperatures as low as -20°F using computer-controlled starting systems [13].
Octane number measures a fuel's tendency to knock in a spark ignition engine. Knocking occurs when the gasoline-air vapor mixture prematurely self-ignites as the mixture is compressed during the upward movement of the piston. The self-ignition occurs before the cylinder reaches the top of its stroke, causing the cylinder to push against the crank shaft instead of with it. This creates a knock, which not only works against the motive power of the engine but also puts a strain on the mechanical parts. Generally, the higher the octane number, the higher the compression ratio that can be tolerated without knocking. Engines with higher compression ratios have more power and higher efficiencies.
3-13

Pure methane has a road octane number, (R+M)/2, of over 120. High quantities of other constituents in natural gas, such as propane, increase the tendency of this fuel to knock, while the inert elements such as carbon dioxide and nitrogen decrease the tendency. Generally the content of propane and inert elements in pipeline quality gas is such as to cancel their opposing impacts on tendency to knock. Thus, pipeline quality gas exhibits antiknock characteristics similar to methane [14]. Natural gas can be used in engines with compression ratios as high as 15:1 (versus 8-10:1 for 91 octane gasoline) [11]. An optimum compression ratio of 15:1 might result in a 15 to 22 percent increase in power and engine efficiency over a base compression ratio of 8.4:1 which is more typical of gasoline-fiieled engines [15].
Neat methanol's road octane number at 100 is intermediate between CNG and gasoline. Compression ratios for alcohol fuels might be raised to 13.0:1.
Heat of vaporization affects engine power and efficiency. It measures the amount of heat absorbed by a fuel as it evaporates from a liquid state, which occurs when the fuel is mixed with air prior to combustion. Higher heat of vaporization leads to improved cooling ability. Higher cooling during the intake stroke of a spark ignition engine results in a denser air/fuel mixture. A denser mixture has two effects. First, by itself the denser charge allows for greater power. Second, a denser charge permits a greater compression ratio, which improves power and efficiency. Although a high heat of vaporization improves power and efficiency, it also adds to cold start problems when there is little heat in the air or in the engine to vaporize the fuel prior to sparking ignition.
The alcohol fuels have much higher heats of vaporization than gasoline or diesel. For methanol, typical power increases of 10 percent from increased charge density have been observed in unmodified automotive engines using methanol instead of gasoline.
High flame speeds allow for more complete combustion and potentially leaner fuel mixtures. While the liquid fuels have similar flame speeds, methanol is thought to have a higher flame speed than gasoline. Natural gas, however, has a slower flame speed than the other fuels, which impairs spark-engine efficiency unless the spark timing is advanced to compensate. The need for advanced timing can be offset by use of high compression ratios and compact, turbulent compression chambers that decrease the distance the flame must travel. The alcohol fuels distinguish themselves in the area of flame temperature and luminosity. For alcohol fuels, the flame temperature is lower than that of gasoline and the luminosity is low so that less thermal energy is lost through conduction or radiation. Low flame temperature also helps reduce nitrogen oxides formation. The lower luminosity, however, is a safety issue. When alcohol burns, the flame is essentially invisible. When gasoline is added to the neat alcohol fuels as in M85 it increases the luminosity.
Autoignition temperature is a measure of when a fuel will self ignite. Self ignition is a concern in environments where the fuel might escape and come into contact with hot engine parts. As a safety feature, high autoignition temperatures are desirable. Natural gas has the highest autoignition temperature at 1004°F. Gasoline and diesel have the lowest autoignition temperatures at 495°F. Flammability limits measure the range of fuel/air mixtures that will ignite. From a safety perspective, a wide range is less desirable than a narrow range. Of the hydrocarbon fuels, methanol has the widest flammability limits (7.3 percent to 36 percent). In partially filled or empty storage tanks, the methanol
3-14
fuel is more likely to produce a combustible mixture above the fuel than the other alternative hydrocarbon fuels. Gasoline tank vapors are too rich in fuel to ignite, and the addition of gasoline to the methanol reduces the flammability limits of M85 compared to M100. Relative to gasoline, the safety concerns associated with the wide flammability limits of methanol are offset by the safety advantages of methanol's relatively high lower-flammability limits, higher flashpoint temperature, higher autoignition temperature, and lower vapor pressures than gasoline [16]. For example, the high lower-flammability limit of methanol keeps it from igniting in air at concentrations below about 6 percent, while gasoline will ignite at concentrations as low as 1.4 percent [17].
While wide flammability limits are not good from a safety perspective, they can be a positive characteristic for engine performance. Wide limits increase the flexibility to vary engine power or speed under different conditions by adjusting the fuel/air ratio.
3.5. Fuel Distribution
Alternative fuels have to penetrate a conventional fuel market that has a well-developed infrastructure. Unfortunately, they generally cannot make use of the existing petroleum fuel infrastructure. Some fuels, such as natural gas, already have a significant infrastructure in place because of their other uses. Other fuels, such as methanol, have very little infrastructure to serve a vehicle market. Therefore, infrastructure needs for alternative fuels in some cases may be a hurdle to market penetration. This section will briefly review the distribution system for each fuel.
Gasoline, diesel, and other refined oil products travel through an extensive distribution and marketing chain beginning at the refineries as shown in Exhibit 3-9. Refineries are clustered on the Gulf Coast, the East Coast and West Coast where they can receive crude from both international and domestic locations. While refineries serve some large industrial and utility customers directly, product is usually distributed by pipeline or barge to large terminals closer to the end user. From these pipeline and marketing terminals, some product is again sent directly to large industrial and utility users, but most product is sent to bulk storage facilities that act as hubs for final distribution to retail outlets and large customers. Product is moved to the bulk plants and on to retail outlets or wholesale customers by tank trucks, which typically haul from 5,000 to 10,000 gallons each. Pipelines are the cheapest means of transportation on a cents per mile-gallon basis followed by barge and finally by truck. Exhibit 3-9 illustrates the cost differences in transportation modes. Transportation cost becomes important when gasoline is competing with other alternative fuels that do not have an efficient delivery infrastructure. The data in Exhibit 3-9 shows trucking costs per mile-gallon to be 25 times as high as pipeline costs. Inability to use cheap pipeline delivery systems can quickly hurt the economics of other fuels. While terminal costs shown in Exhibit 3-9 are generally not significant compared with the delivery costs, storage is an important part of the delivery system in assuring that product is available when needed.
The pervasive need for gasoline and diesel fiiel requires many retail outlets. Since diesel mainly serves the commercial trucking industry, the number and character of diesel retail outlets are considerably different than gasoline outlets. A typical gasoline station has two or three pump islands, each with three pumps and size nozzles. A station will also have three underground storage tanks to handle three
3-15

EXHIBIT 3-9 DISTRIBUTION OF REFINED PETROLEUM PRODUCTS
Manufacturing & Product Imports
Transportation & Storage
Wholesale Retail
i i—»
BULK . k» PLANTS
PIPELINE* MARKETING
ERMINALS
Tllmtrativp C.tKt in Transport Oatnlino from thp U.S. Hiilf Coast in a Rnstnn Sprvirp S TRANSPORT COST
Transport Segment Number of Miles
Cents per Gallon
Cents per Mile per
Gallon Pipeline to NY Harbor 1.500 2.2 0.0015 Terminal Cost (Incremental) — 0.1 .. Barge to Boston 2S0 1.1 0.0044 Terminal Cost (Incremental) - 0.1 — Truck to Service Station 40 1.5 0.0375 TOTAL 1,790 5.0 0.0028
ation
Source: National Petoleum Council, S&T System Dynamics, Petroleum Storage and Transportation, Volume II (Washington, D.C., April 1989), p. 65.
i
i

grades of gasoline (regular, premium, and some mid-grade). The total number of gasoline retail outlets in the United States as surveyed by National Petroleum News was 207,406 in 1993. Average gasoline sales per outlet was estimated to be almost 75,000 gallons per month [18].
Methanol will probably be transferred from import terminals or production facilities by barge, rail or truck to retail outlets. While methanol is a liquid at ambient temperatures and pressures, it cannot be moved easily through the existing petroleum product network to the end users. First, methanol cannot use the current petroleum pipeline system. It may suffer water contamination, phase separation in the case of M85, or cross contamination from other petroleum products. Second, methanol's corrosive properties make many of today's existing storage facilities as well as pipelines unsuitable for use with these fuels. The contamination and corrosive issues are solvable [19], but in the near term the petroleum system cannot be used. Third, while splash blending of methanol and gasoline will be possible in the initial stages of growth, if large volumes of M85 are to be used, petroleum product terminals may have to be altered to deal with automatic blending of the two products. However, because new dedicated truck loading racks will be needed to prevent water and product cross contamination, in-line blenders can be added at the new truck loading racks when they are installed [20].
Different safety concerns will also require different equipment and handling procedures for methanol along the distribution system than are used for gasoline. Generally, M85 is offered at a gasoline retail outlet that contains the appropriate storage and dispensing facilities for alcohols. At the retail outlet, materials must be compatible with alcohols' corrosive characteristics. For example, methanol underground storage tanks must be made of carbon steel or specially formulated fiberglass. A fuel filter must be added to remove dust particles that are loosened from the tank walls by the methanol. Dispenser materials must also be compatible with the alcohols.
Since methanol is not widely used, retail outlet information is limited. California reported 49 retail outlets planned for operation by the end of 1992 (compared to over 13,000 gasoline outlets in the state). When all planned outlets are considered, California may soon have 82 outlets [21]. California probably has the majority of U.S. retail outlets selling M85 today.
A development in the methanol retail outlet area was recently reported. Methanex (MetaUgesellschaft Refining and Marketing, Inc.), a subsidiary of Metallgesellschaft Corporation (MG Corp.), announced it will assist independent refiners in putting up 2,500 fuel sites across the United States over the next three years. Methanol pumps will be added at independent refiners' stations in big cities and in non-attainment areas where M85 fuel-flexible vehicles are expected to be used.
Market penetration of M85 and methanol is projected by DOE to develop around marine terminals because of the high cost of shipping the product by rail or truck and the potential need for imports. Based on an analysis indicating that trucking gasoline for a 100-mile radius around marine terminals is economical, it was assumed the same would be true for methanol. Since approximately 75 percent of the vehicle miles traveled in the United States are within these 100-mile radii, methanol should :*"-~^-to reach a large market in spite of current distribution limitations.
3-17

Natural gas is distributed throughout the United States in extensive pipeline systems that extend from the wellhead to the end user. Every continental state has access to natural gas through pipelines. The pipeline system consists of long-distance transmission systems followed by local distribution systems. Some underground storage is also used to help supply seasonal peak needs. The distribution system is operated at lower pressures than the transmission system. In 1992, the distribution system was able to serve 52.3 million residential consumers, 4.4 million commercial consumers and 0.2 million industrial establishments.
The main issue with CNG distribution for transportation purposes is the lack of refueling stations. The rest of the distribution is well developed. Refueling CNG vehicles requires connecting a manifold on the vehicle to a high-pressure gas line. A refueling station takes natural gas from the low pressure distribution pipeline and compresses it for transfer to the vehicle.
Slow-fill stations attach the vehicle directly to a compressor, and have little or no storage capacity. Refueling time is dependent on the compressor, but might be 6 to 8 hours for automobiles [22]. Slow-fill stations are used for fleet vehicles that can remain idle in a single location for a period of time. The pressure in the vehicle cylinders rise as they fill, and when they reach a specified pressure, the compressor automatically shuts down. Fast-fill stations are similar, but they have storage capacity to allow filling in a short period of time comparable to gasoline refills (5-7 minutes for automobiles). The compressor must be able to handle peak demand without falling behind. A cascade of high pressure cylinders, each containing gas at different pressures, provides the storage. Refueling occurs by equalizing pressure with each cylinder in turn, in ascending sequence. A home slow-fill compressor is also available for individual use sized to refuel one or two vehicles in a residential driveway.
In 1992, the National Renewable Energy Laboratory reported 349 CNG public and private refueling sites.
3.6. Vehicle/Engine Systems
As indicated in the previous section, as the number of alternatively fueled vehicles grows there will be a transition period when a vehicle owner may find it difficult in some locations to find methanol or CNG available. That practical supply problem has given rise to the design of vehicles that can operate on either an alternative or a conventional fuel - referred to as "dual-fueled" or "bi-fueled" vehicles. Vehicles that can operate on a mixture of alternative and conventional fuel are referred to as "flexible-fueled" vehicles. The term "dedicated vehicle" refers to a vehicle that runs exclusively on a single fuel. The dual-fueled and flexible-fueled vehicles provide flexibility and convenience but do not allow for optimization of the engine performance for a specific fuel.
The gasoline engine used to power most light duty vehicles is a spark ignition engine. Both methanol and CNG are high octane fuels and are ideally suited as spark-ignition fuels. Diesel fuel is used in a compression ignition engine in which the fuel "auto" or self-ignites when the fuel contacts the compressed hot air in the cylinder. Methanol and CNG will not auto-ignite in a diesel engine. However, diesel engines have been modified to operate with those fuels employing a "glow plug" or another ignition source.
3-18

For methanol and CNG the vehicle/engine system can be described in terms of the two main elements:
(1) Vehicle fuel storage system (2) Vehicle engine system
Methanol Vehicle Fuel Storage: Methanol corrodes lead-plated fuel tanks, magnesium, copper, lead, zinc, and aluminum parts in addition to some synthetic gaskets. Hence, alcohol-compatible vehicles require special lines, hoses, valves and fuel tanks that can resist corrosion. Other than material composition, the mechanical parts of methanol-fueled vehicles are the same as those in gasoline vehicles. Supplementary components that are included in flexible-fueled vehicles include: a flame arrester to prevent sparks from entering the fuel tank during refueling; a fuel sensor to determine the amount of alcohol in the fuel; and sometimes a cold start system, which may not be a feature on all flexible-fueled vehicles. Since methanol has a lower energy density per unit volume than gasoline, vehicle range is reduced unless a larger fuel tank is supplied.
Methanol Vehicle Engine Systems: Since methanol fuel is a high octane fuel, flexible-fueled engines are optimized with a somewhat advanced ignition timing and an adjusted air/fuel ratio. Overall, neat methanol in spark ignition engines can provide improved power output and greater thermal efficiencies over gasoline. Emission considerations can result in some limitations to elevated compression ratios and lean combustion permitted by methanol's physical characteristics. Difficulty in cold starts and warm-up misfiring are methanol's major performance problems, but solutions are being developed to deal with these issues.
Neat methanol is best suited for spark ignition engines. Methanol has a high octane value, and hence has a corresponding low cetane value (somewhere below 15 versus 40-55 for diesel). In addition, methanol fails to provide adequate lubrication to the high pressure pumps used to inject fuel into the compressed air in the combustion chamber of a compression engine. These characteristics make neat methanol unsuitable for compression ignition engine use, but various means are available to modify either the engine or the fuel to address the situation.
In order to address some of the spark ignition engine performance problems that result form methanol's characteristics, methanol is blended with gasoline mainly to mitigate cold start and warmup problems. Current spark-ignition engine technology for dedicated methanol fuel use is designed for M85. The addition of gasoline to methanol improves flame visibility when the mixture burns and increases energy density over neat methanol. Compression engines have been modified for use with methanol, but that modification includes the addition of an ignition source, such as a glow plug.
While the addition of gasoline can help performance and safety, it detracts slightly from the emissions gains that neat methanol offers. Emission considerations also limit the engine efficiency gains that could be obtained from elevated compression ratios and lean fuel mixtures. Even with these considerations, one estimate indicates that spark ignition engine efficiency gain of about 18 percent over gasoline could be obtained with dedicated vehicles, and 6 percent could be obtained with flexible-fuel methanol vehicles that can use mixtures of M85 and unleaded gasoline [14].
3-19

Engines for flexible-fueled vehicles are being designed for the transition period between now and some future date when advanced vehicle technology will use neat methanol. These engines must deal with the entire range of gasoline/methanol mixes since a wide range of blends can occur in a tank when gasoline and M85 are purchased interchangeably. For example, the control system must be able to monitor the fuel composition and carry two sets of calibrations for fuel flow and spark timing - one each for gasoline and methanol - and interpolate for the mixtures. Oxygen sensor changes may also be needed to deal with emission control adjustments.
When alcohol fuels are used in flexible-fueled vehicles, they must accommodate the lower octane fuel used, namely gasoline. Consequently the compression ratio in these vehicles is not usually modified to produce the maximum engine efficiency advantages of M85.
CNG Vehicle Fuel Storage: A compressed natural gas vehicle stores gaseous fuel at a pressure of 2,400 to 3,600 psi. Even at a pressure of 3,600 psi, a unit volume of compressed natural gas has less than one-fourth of the energy content of gasoline, which means a much greater storage requirement for the vehicle.
Compressed natural gas tanks are larger and fuel plus tank weight is higher than for the liquid fuel/tank alternative; however, natural gas fuel tanks have been improved by recent technological advances. A refueling port and lines with pressure safety valves must be installed on vehicles fueled by compressed natural gas. High pressure fuel lines from the storage cylinder lead to a pressure reducer, which lowers gas pressure in one or two steps. Historically gaseous fuel systems used simple air-valve air-fuel mixers to create proper air/fuel mixtures for combustion. Today's emission limitations require more precision and control. One original equipment manufacturer (OEM) vehicle, for example, is using a fuel injection system containing an electronic control module that processes information from oxygen sensors (for emissions) and provides signals to adjust the fuel flow both for better performance and for better emissions control.
The most significant influence on the efficiency of a natural gas vehicle is the fuel tank weight; the heavier the tank the less efficient the vehicle. Cumbersome fuel tanks, whose weight reduces power (3 to 5 percent), can also affect potential vehicular range. Light-duty vehicles operating on compressed natural gas are either dual-fueled or dedicated. The extra weight of carrying two fuel systems in the dual-fueled vehicles detracts from efficiency. Engine adjustments in dual-fueled vehicles may also compromise performance with both fuels.
CNG Vehicle Engine System: Natural gas has a higher octane value than gasoline with generally good performance characteristics. As a gas, it has few cold-weather starting problems. Its octane value allows for use of higher engine compression ratios than can be used with gasoline alone. Higher compression ratios allow for higher power and fuel efficiency. The efficiency and power gains achievable from higher compression ratios help to offset power losses relative to gasoline caused by the lower energy density of the natural gas.
3-20
Differences in density of natural gas and air keep these two gases from forming a homogeneous mixture when first combined. Fluctuations in the air-fuel mixture can result in an engine misfire. Time and turbulence are needed inside the engine to create a uniform mixture.
While the characteristics of natural gas just discussed indicate that an engine designed to improve efficiency and lower carbon monoxide emissions would be a high compression, lean-bum engine, other characteristics make optimization challenging. For example, lean-bum engines can encourage the formation of nitrogen oxides because excess oxygen is present, and the high flame temperature of natural gas increases the peak combustion temperature. Designers of compressed natural gas vehicles are considering catalytic emission controls to deal with the problem of nitrogen oxides. Nonmethane hydrocarbon emissions-are low relative to gasoline. However, total hydrocarbon emissions from natural gas engines can be high because methane is slower to react than other hydrocarbons, and in lean fuel mixtures, the slow flame speed of natural gas may be too low for combustion to be completed during the power stroke.
3.7. Market Penetration
For the past fifty years, the U.S. transportation fuels market has belonged almost exclusively to the crude-derived products, gasoline and diesel fuel. However, government policy and legislature acts are now targeting a greater use of non-crude alternative transportation fuels. These policies are based on both environmental issues and concern about the rising dependence on oil imports.
The Clean Air Act Amendments of 1990 (CAAA) encouraged the use of alternative fuels and specifically required the inclusion of oxygenates (e.g., MTBE and ethanol) in the gasoline used in many parts of the U.S. The Energy Policy Act of 1992 (EPACT) targeted the growth of non-crude derived alternative transportation fuels requiring the use of alternative fuels in fleet vehicles and providing incentives for vehicle production and fuel outlets. EPACT set a national goal of displacing 30% of the crude-derived light-duty vehicle fuel with non-petroleum-derived-replacement fuels by 2010. Natural gas can help meet the 30% objective with CNG and the use of natural gas in production of methanol and MTBE.
Natural gas and natural gas derived products can enter the transportation fuel market by any of three possible routes:
• Conventional Fuel blend component — MTBE or alcohol • Conventional Fuel — conversion of natural gas to gasoline or diesel • Alternative Fuel — methanol or CNG
Routes 1) and 2) are readily accessible to gas-derived products, if those products can be produced at an economically competitive price. The alternative fuels face a markedly difficult situation.
The first route that natural gas can take into the transportation market is conversion of natural gas to methanol and subsequent use of methanol to produce MTBE or tertiary amyl methyl ether (TAME).
3-21

MTBE is the most commonly used oxygenate in the production of oxygenated and reformulated gasoline when required by the CAAA. Production of reformulated gasoline requires 11-15% MTBE when it is used at the oxygenate. In 1995, production of MTBE and TAME in the U.S. should approach 250 thousand barrels per day (3.5% of total gasoline volume). Demand for MTBE and TAME will continue to grow to the year 2000 as use of reformulated gasoline expands. These are high octane, gasoline blending components containing the oxygen required to meet oxygenated and reformulated gasoline requirements and hence command a price premium above the price of gasoline. This is an attractive market for these and other oxygenates derived from natural gas. There is, of course, an upper limit to demand growth, as the reformulated gasoline program reaches full implementation.
The second avenue of access to the transportation fuel market is the oldest — natural gas can, by various synthesis routes, be converted into gasoline or diesel. The various routes can go via synthesis gas in the case of the Fischer-Tropsch process, via methanol as in Mobil's MTG process or the direct conversion such as oxidative coupling. The appeal of these processes is that an established market exists for the products produced. The problem that all of these gasoline and diesel processes share is achieving cost competitiveness.
The third route is the production of alternative transportation fuels from gas, such as methanol and CNG. Like most alternative fuels, methanol and CNG require new or converted vehicles with engines and fuel storage and delivery systems designed for the fuels used. Distribution systems and fueling stations must also be developed so that vehicle owners can refuel their vehicles when needed. Since market penetration depends on the purchase of new vehicles and development of a new refueling infrastructure, the commercial establishment of a new alternative fuel faces major obstacles to success. There are three major hurdles to overcome in establishing new transportation fuel in the market:
• Building a customer base of vehicles which can use the fuel
• Developing infrastructure of delivery and refueling facilities
• Gaining consumer acceptance of fuel/vehicle systems
Building a customer base can be a time-consuming process. Only about 7-8% of the total stock of motor vehicles are replaced each year. Thus, new alternative fuel vehicles must try to gain some fraction of the new vehicle market. For some vehicles, engine conversions to accommodate the alternative fuel are possible and this has accounted for some of the alternative vehicles in the past. Conversion vehicles, however, are generally more expensive and more likely to have poorer performances. Establishing a significant market position requires the production and sales of new vehicles designed for the use of the alternative fuel. Finding a motor vehicle manufacturer (referred to in the trade as an OEM, original equipment manufacturer) who will produce a vehicle for an alternative fuel is a significant hurdle. Even modifying a version of an existing vehicle represents a significant cost commitment that vehicle manufacturers are reluctant to make without reasonably strong evidence the alternative fuel vehicles will sell in adequate numbers to justify the cost of design and production startup.
3-22

Developing the infrastructure for delivery and refueling outlets represents the second major hurdle. The dimensions of the fuel distribution and refueling problems were described previously in Section 3.5.
Due to the hurdles posed by both vehicle manufacturing and delivery infrastructure, both EPACT and most industry promoters of alternative fuel have selected the fleet vehicle market as the initial segment of the vehicle market which they seek to penetrate. The fleet market is sizeable, with 8.2 million cars in fleets of 10 or more vehicles in the total U. S. automobile population of 143.6 million. Many fleet vehicles also refuel at central locations, which diminishes the problem of building fueling infrastructures. Fleets also have central maintenance facilities that can resolve some of the support needed for a vehicle system which is unfamiliar to most auto mechanical repair shops. Federal and state governments also own or operate a significant number of fleet vehicles that can be totally committed to alternative fuels.
The third significant hurdle is gaining consumer acceptance of the alternative-fueled vehicle. Potential vehicle buyers assess a number of factors in deciding on the possible purchase of an alternative-fuel vehicle:
• Cost—Vehicle cost, fuel cost, maintenance and repair cost • Convenience—Fuel availability, refueling time, refueling frequency • Performance—Start reliability, no stalling, power • Safety perception—As safe or safer than current vehicles
New alternative fuels can fail to gain market acceptance if consumer perception turns against the fuel or vehicle system or any of the items listed above. Methanol and natural gas have very different strengths in trying to penetrate the transportation fuels market. CNG is very cost competitive, has good engine performance, and substantial elements of a delivery infrastructure. The problem with gas is that it is a. gas. Vehicle storage is a problem, compared to gasoline; CNG fuel to drive an equivalent distance occupies 4-5 times the space. Perception about safety may also pose a problem, because to many people a gas seems inherently more dangerous. Moreover, CNG is also a gas under considerable pressure. Methanol, in contrast, is a liquid facing different problems, whose solutions need to be demonstrated to achieve consumer acceptance. It must be demonstrated that methanol's cold start and corrosion problems have been solved. Adequate infrastructure for the delivery of methanol must be developed, along with opening of an adequate number of fueling locations to meet consumer needs in areas where the fuel is used. Finally, a record of safe use for methanol must be established.
There are significant hurdles to overcome to establish an alternative motor fuel in the marketplace. The EPACT has done several things to promote establishment of alternative fuels and overcome the hurdles. These include mandated fleet usage of alternative fuels, incentive for manufacturers of alternative-fuel vehicles and incentives for infrastructure development. There are also active efforts by the natural gas industry, propane, methanol and ethanol producers to promote use of those fuels. Still, overcoming the hurdles for any of the alternative fuels may not be achieved.
3-23

4. Natural Gas Market Analysis—Use as a Chemical Feedstock
This section discusses the use of the methane component of natural gas as a chemical feedstock. In Section 2.2 of this report, it was stated that about 92% of the gas used in the industrial sector is for fuel and power and the remaining 8% of the gas consumption is used for process feedstocks. Since 42% of natural gas is consumed in the industrial sector, then natural gas consumption for chemical feedstocks would represent 3.5% of total natural gas consumption. Natural gas is used as a feedstock to produce ammonia, methanol, and hydrogen and other. The percent of total natural gas consumed as process feedstock for these materials is 60,22, and 18, respectively. [23]
The market for ammonia, methanol and hydrogen is discussed. Additionally, the ethylene and light olefin market is described as a market where methane could be consumed depending on the success of technologies described in Section 9.5.
4.1. Ammonia
Ammonia is the basic intermediate for all nitrogen fertilizers. Ammonia is produced by the reaction of hydrogen with nitrogen. The hydrogen for the process is produced by reforming natural gas. The uses of ammonia are shown in Exhibit 4-1. As shown, 80% of the ammonia goes to the production of nitrogen fertilizers.
In the U.S., ammonia consumption has been stagnant and production capacity has been in decline; some older facilities have been shut down and a recent report [24] indicated that "In the last five years alone, an estimated 2 million to 3 million tons of capacity have been taken out of service, and the scaled-down ammonia facilities left in the U.S. are running at 3.5 percent over capacity".
Recently, ammonia prices have been very strong but there is little expectation that high prices will be sustained or lead to capacity and production expansion in the U.S. Ammonia is viewed as a very mature business with imports posing a strong competitor threat to domestic producers. An ADL Report [25] stated that:
"The United States is one of the few major countries in the world with no import duties or other import restrictions on fertilizers and fertilizer raw materials. It has therefore, been a prime target market for nitrogen exporters, including Trinidad, Venezuela, the Soviet Union and Eastern Europe."
While ammonia plants are not being built, there may be some limited opportunities for LQNG use. Ammonia plants are a little less concentrated on the Gulf Coast than much of the petrochemical industry. Still the needed coincidence of LQNG production and ammonia production facilities will be quite limiting.
4-1

EXHIBIT 4-1 Use of Ammonia
Ammonia
to
Ammonia
Fertilizers 80%
Nitric Acid
Urea 2 1 %
Ammonium Nitrate 14%
Diammonium & Other Ammonium Phosphates
13%
Ammonium Sulfate 4 0 %
Other Uses 20%
Explosives 5%
(Ammonium Nitrate)
Fiber Intermediates 9%
Miscellaneous 6%
itrogen Solutions 10%
Acrylonitrile
Caprolactum
Hexamethylene Diamine
Other Organics
Source: "The Role of Natural Gas in the Chemical Process Industry: Implications for the Future V.2", Mark L. Kesler and Barbara Ex, ADL for GRI, Dec. 1990 GRI - 90/0261.1
I CO I

4.2. Methanol
Methanol is used in the production of a number of chemicals and is also used both directly and indirectly as a transportation fuel. The consumption is broken down by use in Exhibit 4-2. As is shown, the largest use of methanol is in the production of the fuel oxygenate MTBE. Use of methanol in fuel oxygenate production is also the area of major growth for methanol. As shown in Exhibit 4-2, the forecast is for U.S. methanol consumption in the year 2000 to be almost double the 1990 volume. Much of this growth is attributable to growth in MTBE production in the U.S.
The largest chemical use of methanol is in the production of formaldehyde which is primarily used in producing construction material such as foam insulation and as a resin binder for plywood and composition board. Use would normally be expected to increase with growth of the construction segment of the economy but concerns about reputed carcinogenicity has cast a shadow over growth in the use of formaldehydes. Acetic acid is the second largest chemical use. It is used in the making of paints, adhesives, coatings and other products. Demand is expected to increase at about 1.5% per year.
As shown below PACE [23] reports that the use of methanol to produce MTBE in 1991 was 489 million gallons. For the year 1994, the estimate is 857 million gallons. This represents a healthy growth rate of over 20% per year. But with the increased use of MTBE required to produce the reformulated gasoline which must be provided to about one third of the U.S. gasoline market, methanol consumption is estimated to jump to 1513 million gallons in 1995. U.S. methanol demand for MTBE production is expected to level off and future growth in the U.S. will depend on possible expansion of the reformulated gasoline program.
U.S. METHANOL CONSUMPTION FOR MTBE PRODUCTION YEAR 1991 1992 1993 1994 1995 1996 VOLUME 489 560 772 857 1513 1650
The U.S. is now experiencing an unusual growth period for methanol. This year will have seen the conversion of two ammonia plants into methanol plants. Terra Industries converted a 400 ton/day ammonia plant at Woodward, OK to a 130,000 Mt/year methanol plant and Cytec Industries converted an ammonia plant at Fortier, LA to a 570,000 Mt/year methanol plant [26]. But most dramatic has been the increase in methanol prices. In March, methanol was selling for about 55 cents per gallon, then the price began to increase at about 10 cpg each month and was about 1.30 $/gallon at the end of September.
Current methanol prices demonstrate that prices can represent an incentive for capacity growth. There is little doubt that methanol price will fall back as the tight supply situation eases. The compelling question relevant to this analysis is future methanol demand growth and domestic production that will utilize greater quantities of U.S. gas production. The growth propelled by the rapid increase m rviiLii_> use will not continue. Methanol used directly as a transportation fuel could bring significant growth in the future but that is both starting from a very low base volume and has all the uncertainties associated
4-3

Exhibit 4-2. U.S. Methanol Supply/Demand (million gallons)
YEAR CONSUMPTION NET IMPORTS
PRODUCTION CAPACITY PRICE cpg
1981 1168 -100 1268 1522 65.4 1982 982 -115 1097 1872 52.3 1983 1146 5 1005 1870 45.1 1984 1386 151 1235 1235 40.2 1985 1377 347 1030 1185 41 1986 1428 341 1087 1140 31.4 1987 1512 375 1137 1040 32.5 1988 1765 657 1108 1255 56.6 1989 1637 397 1240 1460 43.7 1990 1586 328 1258 1480 40.6 1991 1675 362 1313 1492 51.9 1992 1721 437 1323 1570 37.6 1993 1766 398 1670 1689 40.8 1994 2050 465 1941 1954 1995 2747 769 1978 2197 1996 2906 591 2315 2572 1997 2929 614 2315 2572 1998 2952 637 2315 2572 1999 2977 662 2315 2572 2000 3006 691 2315 2572
Source: Pace Petrochemical Service
4-4
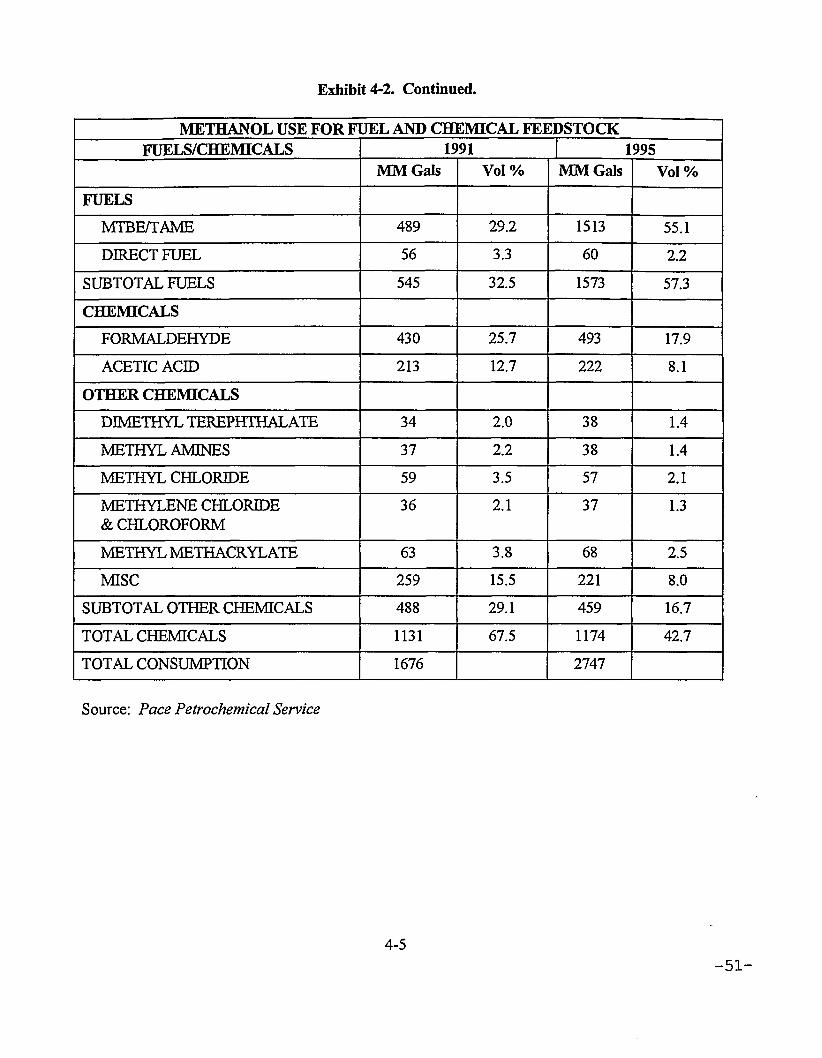
Exhibit 4-2. Continued.
METHANOL USE FOR FUEL AND CHEMICAL FEEDSTOCK FUELS/CHEMICALS 1991 1995
MM Gals Vol % MM Gals Vol %
FUELS
MTBE/TAME 489 29.2 1513 55.1
DIRECT FUEL 56 3.3 60 2.2
SUBTOTAL FUELS 545 32.5 1573 57.3
CHEMICALS
FORMALDEHYDE 430 25.7 493 17.9
ACETIC ACID 213 12.7 222 8.1
OTHER CHEMICALS
DIMETHYL TEREPHTHALATE 34 2.0 38 1.4
METHYL AMINES 37 2.2 38 1.4
METHYL CHLORIDE 59 3.5 57 2.1
METHYLENE CHLORIDE & CHLOROFORM
36 2.1 37 1.3
METHYL METHACRYL ATE 63 3.8 68 2.5
MISC 259 15.5 221 8.0
SUBTOTAL OTHER CHEMICALS 488 29.1 459 16.7
TOTAL CHEMICALS 1131 67.5 1174 42.7
TOTAL CONSUMPTION 1676 2747
Source: Pace Petrochemical Service
4-5

with a new product gaining a successful position in an established market. A 3% U.S. methanol growth rate is estimated between 1995 and 2005 assuming expansion of RFG usage and favorable growth in direct fuel use.
Future gas use for methanol production in the U.S. also depends on whether U.S. methanol demand is satisfied by increasing domestic production or by increasing imports. Those considering new domestic production facilities are concerned about the threat of foreign competition from potential new methanol production in remote areas with little local gas demand and hence low market value gas as a feedstock. During the past decade in which natural gas prices have stagnated, expansion of methanol capacity in
the U.S. has occurred. In the next decade, methanol capacity expansion will be based on assessments of demand growth, gas price growth rates, and the impact of foreign competition — all of which have considerable uncertainties.
4.3. Ethylene
Ethylene is the largest-volume chemical of the entire petrochemical industry. In 1993, U.S. ethylene consumption was about 42 billion pounds compared to 12 billion pounds of methanol. Ethylene is the most basic building block of the chemical industry and is used in the production of a vast array of chemical products. The production of plastics represents the largest use of ethylene accounting for about 70% of ethylene consumption.
Historic and forecast ethylene consumption estimates are shown in Exhibit 4-3. During the 1980's decade, ethylene consumption grew at over 3% per year. From 1993 to 2003, consumption growth is forecast to be 2.2% per year.
Natural gas liquids, which are part of natural gas production are the largest components of ethylene feedstock. Currently, there is no use of methane in ethylene production; however, several gas conversion technologies now in R&D stage are exploring way of using methane as a feedstock for ethylene production (See Section 9.5).
Currently, about 50% of the ethylene is produced using ethane as a feedstock, about 20% is produced from propane and 7% from butane. The other 23% is produced using naphtha and gas oil fractions derived from the refining of crude oil. Virtually all of the ethane produced in natural gas processing goes to the production of ethylene and about one third of the propane is used in ethylene production.
Converting ethane and propane to ethylene is a less difficult conversion than conversion of methane to ethylene. But since propane is more expensive than methane on a per BTU basis, it is possible for methane to be cost competitive at a lower conversion level. The economics in Section 9.5 indicates that methane-to-ethylene conversion economics show some promise.
4-6

Exhibit 4-3. U.S. Ethylene Supply/Demand (million pounds)
YEAR CONSUMPTION* PRODUCTION CAPACITY 1981 28,378 29,418 41,115 1982 27,473 24,501 39,140 1983 29,151 28,677 37,355 1984 30,809 31,383 35,280 1985 30,862 29,847 33,150 1986 31,897 32,859 35,055 1987 33,907 34,951 35,655 1988 36,516 37,204 37,255 1989 35,104 34,947 39,485 1990 38,337 37,474 41,585 1991 40,328 38,938 44,565 1992 41,221 41,254 46,215 1993 41,819 41,907 47,890 FORECAST 1994 43,004 43,004 50,190 1995 43,791 43,791 50,690 1996 44,675 44,675 50,690 1997 45,780 45,780 50,690 1998 46,800 46,800 50,690 1999 48,021 48,021 50,690 2000 49,243 49,243 50,690 2001 50,300 50,300 50,690 2002 51,063 51,063 51,690 2003 52,164 52,164 53,690
Source: Pace Petrochemical Service -1993 Annual Issue
4-7

5. Natural Gas Market Analysis—Use in Power Generation
Based on surveys by DOE and Power Engineering [27], about half of the planned new electric generating facilities are expected to be gas fired, primarily combined-cycle plants. These units are more efficient, less capital intensive, available in a range of capacities, and can be constructed more quickly than coal or oil fired units. Approximately 60% of the planned capacity additions from 1995 to 2000 are expected to be gas fired, and gas share of generation fuel will increase from 10 to 13% from 1993 to 2000 [28].
DOE's forecast of fuel use by utilities is shown below.
Fuel Use for Electric Generation (QBTU/yr)
Electric Utilities* 1990 1992 2000 2005 2010
Annual Growth 1990-2010 (%)
Annual Growth 1992-2010 (%)
Distillate Fuel 0.02 0.03 0.08 0.13 0.11 7.7 8.4 Residual Fuel 1.23 0.90 0.93 0.97 0.81 -2.1 -0.6 Natural Gas 2.88 2.86 4.36 5.24 5.10 2.9 3.3 Steam Coal 16.10 16.30 17.49 18.05 19.93 1.1 1.1 Nuclear Power 6.20 6.40 7.21 7.30 6.57 0.3 0.1 Renewable Energy/Other
3.64 3.20 4.23 4.55 5.21 1.8 2.7
Total 30.07 29.69 34.30 36.24 37.74 1.1 1.3
Source: Energy Information Administration/Annual Energy Outlook 1994
As shown, electricity generation represents an area for increased gas usage. In the economic analysis of Section 9.3, the economics of using both high and low quality natural gas are analyzed. There will be many more opportunities for high quality gas than for LQNG. The new planned gas generating facilities are located at diverse locations around the United States. High quality gas is available at many of these locations because of the gas pipeline distribution system. LQNG is only available in areas close to the LQNG production locations.
5-1

6. Process Routes from Natural Gas to Transportation Fuels, Chemical Feedstocks, and Utility Fuel
The U.S. makes good use of its abundant natural gas resources for residential heating, commercial and industrial energy requirements and power generation. However, there is a substantial untapped role for natural gas in the form of conversion to transportation fuels. This is particularly important in overcoming our increasing dependency on foreign energy supplies for transportation fuels.
Exhibit 6-1 gives an overview of the major routes for converting natural gas to transportation fuels. Natural gas can either be: a) converted to synthesis gas (a mixture of CO and H2), which is then converted to a variety of liquid fuels, or b) reacted directly to produce other intermediates which in turn are converted to liquid fuels or c) used directly in a vehicle as compressed natural gas or liquified natural gas.
A fundamental problem in converting natural gas to other commercial products is the chemical stability of the methane molecule. The bonds in methane are among the most unreactive of any of the hydrocarbons. Reactions that convert methane to other chemical forms are usually irreversible and difficult to control. For example, combustion or complete oxidation gives CO2 and H 2 0, neither of which can be used as a fuel. Therefore, a widely practiced means of utilizing natural gas has been to convert it to synthesis gas by steam reforming. The intermediate CO + H2 syngas mixture in turn is used to synthesize liquid fuel products.
The fuels which can be made from natural gas include gasoline, diesel oil, oxygenates, methanol, LNG and CNG. The most prominent examples of oxygenates are methyl tertiary butyl ether (MTBE), tertiary amyl methyl ether (TAME) and C1-C6 alcohols. Recent work has also shown that dimethyl ether can be used as a diesel fuel.
Some of the routes to transportation fuels have been commercialized. Methanol is being made from synthesis gas commercially by methods such as the ICI and Lurgi processes. Gasoline has been produced commercially from synthesis gas by the Fischer-Tropsch process. A newer scheme, also operated commercially, is the conversion of methanol to gasoline (MTG). A similar process converts methanol to olefin (MTO) and then to gasoline and diesel oil (MOGD). Both MTG and MTO/MOGD processes have been developed by Mobil using a unique ZSM-5 zeolitic catalyst.
6-1

EXHIBIT 6-1 CONVERSION OF NATURAL GAS TO TRANSPORTATION FUELS
w < <
COMPRESSOR
ISOBUTYLENES
BUTANES- 1SOMERIZATION & DEHYDROGENATION
ISOBUTYLENES T
STEAM REFORMING
COMBINATION REFORMING
PARTIAL OXIDATION
CATALYTIC PAR' OXIDATION
TLUL
SYNTHESIS GAS w
METHANOL SYNTHESIS
FISCHER-TROPSCH
HIGHER ALCOHOL SYNTHESIS
PARTIAL OXIDATION
ZSM-S OLIGOMERIZATION
OXYHYDRO-CHLORINATION
ZSM-S OUCOMERIZATION
OXIDATIVE COUPLING
ZSM-5 OLIGOMEREATION
MTBE SYNTHESIS
ISOAMYLENE
TAME SYNTHESIS
MOBIL MTG
MOBILMTO MOBIL MOGD
UPGRADING
COMPRESSED NATURAL
GAS
MTBE
TAME
- • METHANOL
- • GASOLINE
3ASOUNE AND DIESEL
- • G A S O L I N E AND DIESEL
C,-C« ALCOHOLS
" • GASOLINE
GASOLINE
- • • GASOLINE
I en en l

The development and commercialization of the MTG and Fischer-Tropsch processes represent major breakthroughs in synthetic fuels technology. However, both of these routes depend on manufacture of synthesis gas, which is inherently the most costly step in these processes from the standpoint of both capital and fuel requirements.
Other commercial processes have been developed to manufacture MTBE and TAME from methanol and C4 or C5 hydrocarbons. Natural gas is also used commercially in buses or trucks in the form of compressed gas (CNG) or liquified natural gas (LNG).
A significant portion of the current gas-to-liquids research program emphasizes direct conversion of methane to intermediates which in turn can be converted to liquid fuels, thus bypassing the conventional synthesis gas step. Processes concerned with the newer approach use partial oxidation, oxyhydrochlorination, or oxidative coupling to break the carbon/hydrogen bonds in methane and produce reactive intermediates. These processes are in various stages of research and development.
Although steam reforming is commonly used for making synthesis gas, other methods, such as partial oxidation and combination reforming are being explored. Likewise, other methods of making methanol such as the liquid-phase methanol process (LPMEOH) have been given serious consideration. In the Fischer-Tropsch area the use of the slurry reactor has been the subject of research as an alternative to the commercial methods used in South Africa. The processes developed by various companies for producing C1-C6 alcohols are still in the developmental stage and have not reached full commercial status.
In the following sections, process descriptions, flow diagrams, major reactions, material balances and economics will be given for:
• The liquid-phase methanol process (LPMEOH) • Fischer-Tropsch process • Gasoline by oxidative coupling or oxyhydrochlorination of methane and oligomerization • Higher alcohols by the EFP process • UOP method of producing MTBE
These processes are chosen for the presentation of process descriptions and economic analysis because (1) their technology was either on the leading edge of process development or are typical of processes for their general category of process, (2) sufficient process descriptions and economic data were available to obtain fairly reliable economics and (3) they permitted good cost comparisons with other process costs and market values.
In addition to using natural gas for making transportation fuels, natural gas may also be used to produce chemical feedstocks and power. Exhibit 6-2 gives an overview of the major routes for converting natural gas to chemical feedstocks and power. The exhibit shows three types of routes: (a) conversion to synthesis gas followed by production of chemical feedstocks; (b) combustion for power production; and (c) reacted directly to produce chemical feedstocks.
6-3

EXHIBIT 6-2 CONVERSION OF NATURAL GAS TO CHEMICALS AND POWER
METHANOL
~ D
ESU
LFU
RIZ
ED
NA
TUR
AL
G
AS
STEAM REFORMING
METHANOL
~ D
ESU
LFU
RIZ
ED
NA
TUR
AL
G
AS ^ -
STEAM REFORMING ^
METHANOL
~ D
ESU
LFU
RIZ
ED
NA
TUR
AL
G
AS ^ -
^
METHANOL SYNTHESIS
METHANOL
~ D
ESU
LFU
RIZ
ED
NA
TUR
AL
G
AS ^ -
^
SYNTHESIS HAS fc
METHANOL SYNTHESIS
_ _ ^ A M M O N I A
POWER
ETHYLENE
METHYL CHLORIDE
~ D
ESU
LFU
RIZ
ED
NA
TUR
AL
G
AS ^ - COMBINATION
REFORMING
^
SYNTHESIS HAS fc
METHANOL SYNTHESIS
_ _ ^ A M M O N I A
POWER
ETHYLENE
METHYL CHLORIDE
~ D
ESU
LFU
RIZ
ED
NA
TUR
AL
G
AS ^ - COMBINATION
REFORMING
^
SYNTHESIS HAS fc
_ _ ^ A M M O N I A
POWER
ETHYLENE
METHYL CHLORIDE
~ D
ESU
LFU
RIZ
ED
NA
TUR
AL
G
AS COMBINATION
REFORMING ^ . SYNTHESIS HAS fc
_ _ ^ A M M O N I A
POWER
ETHYLENE
METHYL CHLORIDE
^ . SYNTHESIS HAS fc
_ _ ^ A M M O N I A
POWER
ETHYLENE
METHYL CHLORIDE
^ .
_ _ ^ A M M O N I A
POWER
ETHYLENE
METHYL CHLORIDE
PARTIAL OXIDATION
^ .
_ _ ^ A M M O N I A
POWER
ETHYLENE
METHYL CHLORIDE
PARTIAL OXIDATION
^ .
SECONDARY REFORMER —
PURIFICATION AND AMMONIA CONVERTER
_ _ ^ A M M O N I A
POWER
ETHYLENE
METHYL CHLORIDE
PARTIAL OXIDATION SECONDARY
REFORMER — PURIFICATION AND AMMONIA CONVERTER
_ _ ^ A M M O N I A
POWER
ETHYLENE
METHYL CHLORIDE
SECONDARY REFORMER —
PURIFICATION AND AMMONIA CONVERTER
_ _ ^ A M M O N I A
POWER
ETHYLENE
METHYL CHLORIDE
1 AIR
_ _ ^ A M M O N I A
POWER
ETHYLENE
METHYL CHLORIDE
CATALYTIC PARTIAL OXIDATION
1 AIR
_ _ ^ A M M O N I A
POWER
ETHYLENE
METHYL CHLORIDE
CATALYTIC PARTIAL OXIDATION
1 AIR
_ _ ^ A M M O N I A
POWER
ETHYLENE
METHYL CHLORIDE
_ _ ^ A M M O N I A
POWER
ETHYLENE
METHYL CHLORIDE
STEAM TURBINE GENERATOR
_ _ ^ A M M O N I A
POWER
ETHYLENE
METHYL CHLORIDE
COMBUSTION TURBINE GENERATOR
HEAT RECOVERY STEAM GENERATOR
STEAM TURBINE GENERATOR
_ _ ^ A M M O N I A
POWER
ETHYLENE
METHYL CHLORIDE
COMBUSTION TURBINE GENERATOR
HEAT RECOVERY STEAM GENERATOR
STEAM TURBINE GENERATOR
_ _ ^ A M M O N I A
POWER
ETHYLENE
METHYL CHLORIDE
COMBUSTION TURBINE GENERATOR
HEAT RECOVERY STEAM GENERATOR
STEAM TURBINE GENERATOR
_ _ ^ A M M O N I A
POWER
ETHYLENE
METHYL CHLORIDE
COMBUSTION TURBINE GENERATOR
HEAT RECOVERY STEAM GENERATOR
•
_ _ ^ A M M O N I A
POWER
ETHYLENE
METHYL CHLORIDE
• 1
_ _ ^ A M M O N I A
POWER
ETHYLENE
METHYL CHLORIDE
P
_ _ ^ A M M O N I A
POWER
ETHYLENE
METHYL CHLORIDE
OXD3ATIVE COUPUNG
P
_ _ ^ A M M O N I A
POWER
ETHYLENE
METHYL CHLORIDE
OXD3ATIVE COUPUNG P
_ _ ^ A M M O N I A
POWER
ETHYLENE
METHYL CHLORIDE
_ _ ^ A M M O N I A
POWER
ETHYLENE
METHYL CHLORIDE
OXYHYDRO-CHLORINATION
_ _ ^ A M M O N I A
POWER
ETHYLENE
METHYL CHLORIDE
OXYHYDRO-CHLORINATION
_ _ ^ A M M O N I A
POWER
ETHYLENE
METHYL CHLORIDE
OXYHYDRO-CHLORINATION
_ _ ^ A M M O N I A
POWER
ETHYLENE
METHYL CHLORIDE
_ _ ^ A M M O N I A
POWER
ETHYLENE
METHYL CHLORIDE
I Cn CO I

The most prominent chemicals which can be made from natural gas are methanol and ammonia. These have been commercialized using a variety of processes. Both of these processes depend on the production of synthesis gas. The synthesis gas step is the most costly step in the processes. The production of power from natural gas by combusting the gas and using the gas to generate power is widely used commercially.
Research work has been done on the direct conversion of methane to produce chemicals such as ethylene and methyl chloride. Ethylene is made commercially available by the steam cracking of ethane, propane and other hydrocarbons. Direct conversion of methane to ethylene can not compete commercially at this point. Methyl chloride is not useful commercially but could be converted to liquid transportation fuels.
Economics were obtained for a variety of processes using natural gas. Methods of producing chemicals, power and transportation were analyzed. Processes which represented either high volume or potentially high-value uses of natural gas were emphasized. In some of the cases, economics for both high and low quality natural gas (LQNG) feedstocks were included in order to determine the value of the LQNG by calculating the differences in feedstock costs needed to obtain comparable product costs. The cost of upgrading a high nitrogen content, LQNG was determined using a nitrogen rejection process to compare upgrading LQNG to high quality gas with use of LQNG in conversion processes.
Sections describing the economics of producing ethylene and methyl chloride from natural gas were also included. Conversion of natural gas to ethylene is discussed but no economic case analysis is provided.
In the following sections, process descriptions, flow diagrams, major reactions, material balances and economics are provided. The processes included are:
• Production of methanol by the Liquid Phase method using both high-quality and low-quality natural gas as feedstocks
• Production of ammonia using both high-quality and low-quality natural gas as feedstocks
• Production of power with combined cycle technology using both high-quality and low-quality natural gas as feedstocks
• Upgrading of high nitrogen-content natural gas by cryogenic nitrogen rejection
• Literature review on the production of ethylene from natural gas with emphasis on direct conversion processes
• Production of methyl chloride
6-5

7. Gas Use in Transportation Fuels—Economic Analysis
7.1. Price Forecast-Transportation Fuels and Components
The economic competitiveness of producing the various transportation fuels in future years will depend on the prices of their feedstocks and the relative price of their products. A price forecast has been developed for feedstocks and transportation fuel products. The forecast has been developed using the crude oil and natural gas price forecast developed by DOE/EIA and published in the "Annual Energy Outlook 1994" [7]. Price forecasts for other individual feedstocks and products were developed by K&M based on the EIA crude and natural gas price paths.
The transportation fuels price forecast is presented in Exhibit 7-1 and is based on the DOE/EIA Reference Case forecast. In the reference case, the price of natural gas is forecast to grow at an annual constant dollar growth rate of 3.9%, while crude oil is forecast to grow at 2.5% annually. In the forecast, the prices of gasoline and diesel are primarily dependent on the price of crude oil but will grow at a slightly higher rate to reflect the added cost of gasoline reformulation required by the CAAA. Natural gas prices are forecast for the Gulf Coast states of Texas and Louisiana, both at the wellhead and for the industrial delivered prices, which the process industries would be expected to pay.
The prices for the gas liquids, propane, and normal butane, are somewhat dependent on natural gas prices but are more dependent on the prices of distillate heating oil, diesel fuel and gasoline. The methanol price forecast is a function of the natural gas prices, while the MTBE price forecast is a function of the prices of methanol and butane (the feedstocks) and gasoline (the product into which it is blended).
The forecast of Exhibit 7-1 which is stated in 1992 constant dollars has been restated in current dollars in Exhibit 7-2 along with historical data for the various fuels.
7-1 - 6 0 -

Exhibit 7-1. Transportation Fuels Price Forecast (Prices in 1992 S) jj Refiner
Acquisition Cost Crude
Foreign $/BBL
Refiner Acquisition Cost Crude Composite
$/BBL
Unleaded Regular
Wholesale Gasoline Avg. US
cpg
Wholesale Diesel
Avg. US CPg
Well-head Natural
Gas Louisiana $/MCF
Well-head Natural
Gas Texas
$/MCF
Well-head Natural
Gas Total US S/MCF
Industrial Customers
Natural Gas
Louisiana $/MCF
Industrial Customers
Natural Gas
Texas S/MCF
Avg. Spot Propane
Mt. Belvieu
cpg
Avg. Spot Butane
Mt. Belvieu
CPg
Avg. Spot i-Butane
Mt. Belvieu
cpg
Contract MTBE
cpg
f,
Methanol ,. US Gulf ;'
cpg
1992 18.20 18.43 64.4 59.0 1.73 1.76 1.74 1.93 2.12 32.1 38.5 46.3 108.5 37.6 1993 15.75 16.41 59.3 57.1 1.94 1.94 1.94 2.14 2.44 2.81 36.8 42.5 106.7 43.0 1994 16.20 16.50 58.3 53.0 1.95 1.95 1.95 2.15 2.45 25.9 34.1 39.9 102.9 40.6 1995 16.89 17.19 63.7 54.8 2.00 2.00 2.00 2.20 2.50 26.8 35.3 41.0 104.9 41.2 1996 17.60 17.90 65.6 56.6 2.08 2.08 2.08 2.28 2.58 27.7 36.4 42.1 106.8 42.2 1997 18.35 18.65 67.6 58.5 2.15 2.15 2.15 2.35 2.65 28.7 37.6 43.3 108.8 43.2 1998 19.13 19.43 74.4 60.5 2.23 2.23 2.23 2.43 2.73 29.7 38.9 44.6 111.8 44.3 1999 19.94 20.24 76.5 62.5 2.32 2.32 2.32 2.52 2.82 30.8 40.2 45.9 113.9 45.4 2000 20.79 21.09 78.8 64.7 2.40 2.40 2.40 2.60 2.90 31.9 41.6 47.2 116.1 46.6 2001 21.56 21.86 80.8 66.7 2.49 2.49 2.49 2.69 2.99 32.9 42.9 48.4 118.2 47.8 2002 22.35 22.65 82.9 68.7 2.59 2.59 2.59 2.79 3.09 33.9 44.1 49.7 120.3 49.0 2003 23.17 23.47 85.1 70.8 2.68 2.68 2.68 2.88 3.18 35.0 45.5 51.0 122.5 50.3 2004 24.02 24.32 87.3 72.9 2.79 2.79 2.79 2.99 3.29 36.1 46.9 52.4 124.8 51.7 2005 24.91 25.21 89.7 75.2 2.89 2.89 2.89 3.09 3.39 37.2 48.3 53.8 127.2 53.3 2006 25.53 25.83 91.3 76.8 3.00 3.00 3.00 3.20 3.50 38.0 49.3 54.7 129 54.5 2007 26.17 26.47 93.0 78.4 3.11 3.11 3.11 3.31 3.61 38.8 50.3 55.7 130.9 56.0 2008 26.82 27.12 94.7 80.1 3.23 3.23 3.23 3.43 3.73 39.7 51.3 56.7 132.8 57.5 2009 27.49 27.79 96.5 81.8 3.35 3.35 3.35 3.55 3.85 40.5 52.4 57.8 134.7 59.1 2010 28.18 28.48 98.3 83.5 3.47 3.47 3.47 3.67 3.97 41.4 53.5 58.8 136.8 60.8
l

Exhibit 7-2. Transportation Fuels Price Forecast (Prices in Current S)
Refiner Acquisition Cost Crude
Foreign $/BBL
Refiner Acquisition Cost Crude Composite
$/BBL
Unleaded Regular
Wholesale Gasoline Avg. US
cpg
Wholesale Diesel
Avg. US CP8
Well-head Natural
Gas Louisiana
$/MCF
Well-head Natural
Gas Texas $/MCF
Well-head Natural Gas
Total US $/MCF
Industrial Customers
Natural Gas
Lousiana S/MCF
Industrial Customers
Natural Gas
Texas S/MCF
Avg. Spot
Propane Mt.
Belvieu cPg
Avg. Spot
Butane Mt.
Belvieu cpg
Avg. Spot i-Butane
Mt. Belvieu
CPg
Contract MTBE
cpg
Methanol US Gulf :
cpg ,
1985 26.99 26.75 84.3 77.2 2.66 2.33 2.51 3.03 3.19 37.7 54.8 58.9 1986 14.00 15.55 52.2 45.2 2.21 1.65 1.94 1.91 2.46 24.2 30.8 35.2 1 1987 18.13 17.90 56.9 53.4 1.78 1.47 1.67 1.80 2.06 24.3 36.8 42.6 1988 14.56 14.67 54.8 47.3 1.81 1.51 1.69 1.99 , 2.19 22.1 29.6 33.3 1989 18.08 17.97 61.8 56.7 1.82 1.53 1.69 1.97 2.24 22.5 28.9 36.3 1990 21.76 22.22 75.8 69.4 1.83 1.57 1.71 2.00 2.18 35.1 42.5 49.8 100.5 39.0 1991 18.70 19.06 67.2 61.5 1.73 1.59 1.64 1.74 1.93 33.9 42.2 47.1 98.2 51.9 1992 18.20 18.43 64.4 59.0 1.73 1.76 1.74 1.93 2.12 32.1 38.5 46.3 108.5 37.6 1993 16.14 16.41 59.3 57.1 1.99 1.99 1.99 2.51 2.51 28.0 36.8 42.5 106.7 43.0 1994 17.00 17.30 60.4 55.1 2.05 2.05 2.05 2:58 2.58 26.9 35.4 41.2 106.2 46.3 1995 18.50 18.80 68.0 58.9 2.19 2.19 2.19 2.74 2.74 28.9 37.9 43.6 110.8 48.4 1996 19.89 20.19 71.6 62.4 2.34 2.34 2.34 2.91 2.91 30.7 40.1 45.8 114.6 50.6 1997 21.38 21.68 75.6 66.2 2.51 2.51 2.51 3.09 3.09 32.6 42.5 48.1 118.6 53.0 1998 22.98 23.28 84.6 70.3 2.68 2.68 2.68 3.28 3.28 34.7 45.2 50.7 123.9 55.6 1999 24.70 . 25.00 89.1 74.7 2.87 2.87 2.87 3.49 3.49 37.0 47.9 53.4 128.5 58.3 2000 26.54 26.84 94.0 79.4 3.07 3.07 3.07 3.71 3.71 39.4 51.0 56.4 133.5 61.3 2001 28.37 28.67 98.8 84.0 3.28 3.28 3.28 3.94 3.94 41.7 53.9 59.3 138.5 64.4 2002 30.33 30.63 104.0 89.0 3.51 3.51 3.51 4.19 4.19 44.3 57.1 62.4 143.8 67.7 2003 32.42 32.72 109.5 94.3 3.76 3.76 3.76 4.46 4.46 47.0 60.5 65.7 149.5 71.2 2004 34.65 34.95 115.4 100.0 4.02 4.02 4.02 4.74 4.74 49.9 64.1 69.2 155.6 75.0 2005 37.04 37.34 121.7 106.1 4.3 4.3 4.3 5.04 5.04 53.0 68.0 73.0 162.1 79.0 2006 39.15 39.45 127.3 111.5 4.6 4.6 4.6 5.36 5.36 55.7 71.4 76.3 168.1 83.3 2007 41.37 41.67 133.2 117.1 4.92 4.92 4.92 5.71 5.71 58.6 74.9 79.8 174.4 87.9 2008 43.72 44.02 139.4 123.1 5.26 5.26 5.26 6.08 6.08 61.6 78.7 83.5 181.1 92.8 2009 46.20 46.50 145.9 129.4 5.63 5.63 5.63 6.47 6.47 64.8 82.7 87.4 188.1 98.0 2010 48.82 49.12 152.9 136.1 6.02 6.02 6.02 6.88 6.88 68.1 86.9 91.5 195.6 103.6
I

There is much uncertainty in forecasting energy prices and, in addition to the Reference Case, the DOE/EIA produces several other energy price scenarios. Shown in Exhibit 7-3 are the 1992 and 2010 prices for crude oil and natural gas along with the average annual growth rate between 1992 and 2010 for the Reference Case and the High and Low Oil Price Cases.
Exhibit 7-3. Oil and Natural Gas Prices
Oil Prices ($/Bbl) 1992
Price (1992$) 2010 Price (1992 $)
Growth Rate 1992-2010
Low Oil Price Case 18.20 20.15 0.6
Reference Case 18.20 28.16 2.5
High Oil Price Case 18.20 34.11 3.6
Natural Gas at Wellhead ($/MCF)
Low Oil Price Case 1.75 3.25 3.5
Reference Case 1.75 3.47 3.9
High Oil Price Case 1.75 3.54 4.0
For the Reference Case a higher growth rate is projected for the wellhead price of natural gas than for world oil prices. Oil and gas price projections are based on different factors. U.S. gas price forecasts are based on the disappearance of the supply surplus which has existed for the past decade and price growth based on healthy demand and rising exploration cost for new gas. The key factor in oil prices is the worldwide supply/demand balance and the pressure the OPEC cartel can bring to bear on the market. The worldwide oil market is seen as having greater uncertainty than the U.S. gas market. In addition to the two scenarios shown, EIA also developed high and low economic growth cases. The growth price rate for the oil price cases and for the economic cases (not shown) ranges from 0.6% -3.6% for oil prices compared to a more narrow range of 3.0% to 4.0% for natural gas. In all cases, a higher price growth rate is forecast for gas than for crude oil, which means that the forecast does not indicate an improving economic situation for gas and gas-derived products versus products from other energy resources.
7.2. Economic Evaluation—Analysis Methodology
Data was taken from a variety of previous economic studies to develop the evaluation of the natural gas to products economics presented later in this section. Since each source of data used somewhat different factors for determining total capital and total operating and maintenance costs it was decided to accept certain basic data from the economic sources and calculate the rest of the economics using a consistent methodology.
7-4 - 6 3 -

All costs were escalated to December 1993 using Nelson-Farrar Indexes in the "Oil and Gas Journal". No adjustment was made for differences in plant capacity from one set of economics to another. The basic data taken from the economic sources in the literature are as follows:
• Design Capacity of Product • Service Factor • Process Field Cost (PFC) • Offsite/Utility Field Cost (UFC) • Operators/Shift • Catalyst and Chemicals Cost • Utilities Cost or Rate • Feed Gas Rate • Total Maintenance Cost
After establishing these basic economic data, the other economic data were calculated from them using the following factors:
• Process Units Project Contingency (PC): 15% of PFC • Process Units Home Office: 6%of(PFC + PC) • Process Units Engineering: 6%of(PFC + PC) • Offsite/Utilities Project Contingency (UPC): 15% of UFC • Offsite/Utilities Home Office: 6% of (UFC +UPC) • Offsite/Utilities Engineering: 6% of (UFC + UPC) • Initial Fills: 0.8% of Total Facilities Construction Investment • Start-up: 20% of Annual Operating Cost • Prepaid Royalties: 0.5% of Total Facilities Construction Investment • Maintenance Labor: 40% of Total Maintenance • Maintenance Materials: 60% of Total Maintenance • Direct Labor Cost: $18.08/hour • Total Direct Labor (TDL): Direct Labor + Maintenance Labor • Supervision: 25% of TDL • Benefits: 25% of TDL • General and Clerical: 45% of TDL • Corporate Overhead: 30% of TDL
A discounted cash flow (DCF) rate of return calculation was done using the initial operating year economics as a basis (see detailed description in Appendix A). Some of the factors used in the calculation are as follows:
7-5

Fraction Inflation 0.0301 Fraction Capital from Equity 0.8 Fraction Capital from Debt 0.2 Fraction Return on Equity 0.142 Fraction Return on Debt 0.09 Book Life Years 20 Tax Life Years 20 Fraction Tax Rate 0.4 Construction Period Years 3 Fraction Escalation Rate during Construction 0.0301
Since the types of feeds and products were different, growth rates in feedstocks prices and product costs varied from one set of economics to another based on the price forecast of Section 7.1. Economics and process descriptions will be discussed for six processes for conversion of natural gas to transportation fuels, chemicals, electric power and for upgrading natural gas. Detailed economics for one of the processes are given in the Appendix A, Exhibit A-l in the form of computer spreadsheets. On the first page of the economics analysis spreadsheet cost estimating inputs and process, offsite/utility and total plant investments are given. Costs for maintenance, labor and overheads, catalyst and chemicals, utilities, taxes and insurance and feedstocks, total operating and maintenance costs and working capital are on the second page. The third page contains input for a DCF calculation and a lists of intermediate results. The bottom line shows the price of the product in the initial year assuming a constant return on investment for all cases. Appendix A contains summary tables for the economic cases shown in the report. More detail is provided than is given in the economics in Sections 8.1 to 8.7 and 9.1 to 9.6. Exhibits A-3 and A-4 have summaries of economics for the conversion of natural gas to transportation fuels. Exhibit A-5 has a summary of economics for conversion of natural gas to chemicals. Exhibit A-6 has a summary of economics for conversion of natural gas to power and nitrogen rejection. Exhibits A-7 and A-8 have summaries of economics for the sensitivity analysis of converting natural gas to Fischer-Tropsch liquids.
In the economic summaries in the text and in Appendix A, the feed, operating, and capital costs are based on initial-year costs, and the product price is based on a DCF calculation and thus takes into account the cost growth during the period covered. Therefore, the cost components do not add up to the product price.
7-6

8. Gas Use in Transportation Fuels—Economic Analysis
In this section, the economics of processes for converting natural gas to transportation fuels will be analyzed. The processes for making transportation fuel from natural gas are broken into three categories: commercial, demonstrated, and under development.
A summary of the processes covered in this section is as follows:
Product Process Status Section No.
Methanol Liquid Phase Methanol
Commercial 8.1
MTBE Commercial 8.5
CNG Demonstrated 8.6
LNG Demonstrated 8.7
Gasoline or Diesel Fischer-Tropsch Demonstrated 8.2
Higher Alcohols IFP Process Pilot Plant 8.4
DME (as Diesel Fuel) Haldor Topsoe Pilot Plant 8.5
Gasoline Oxidative Coupling Research 8.3
Gasoline Oxyhydrochlorination Research 8.3
A cost summary for six of the processes covered in this section is given in Exhibit 8-1. Cost for the six processes are also compared with the prices of the fuels against which these products must compete in the fuels market. A more detailed discussion of these products and their costs is presented in Section 11.1
8-1 - 6 6 -

Exhibit 8-1. Economic Comparison of Gas-to-Liquids Processes
Process
Product
Liquid Phase Methanol (LPMEOH)
Methanol
UOP-MTBE
MTBE
IFP Higher Alcohol
C1-C6 Alcohol
Fischer-Tropsch
Gasoline/Diesel
Oxidative Coupling
Gasoline
Delivered" i CNG !
CNG
Costs: (cents per gallon product)
Feed 24 51 36 52 52 48 2
Other Operating
7 17 22 28 43 11
Capital 12 14 43 58 67 7 TOTAL 44 86 120 137 169 73
Gasoline Equivalent Gallon Cost
74 NA NA 137 169 73
Competing Fuel Gasoline High Octane Blend Components
Gasoline Blend Components
Gasoline Gasoline Delivered Gasoline
Price of Competing Fuel
68 98 68-98 68 68 843
1 Delivered to consumer, not including fuel taxes 2 Range for delivery to Middle Atlantic and Midwest locations 3 Retail price excluding fuel taxes
8.1. Natural Gas to Methanol by the Liquid-phase Methanol Process
The liquid-phase methanol (LPMEOH) process was invented by Chem Systems Inc. In a report by Chem Systems it is compared to a version of the more conventional gas-phase processes [29]. The biggest difference between the two processes is in the method of removing the heat of reaction.
Due to its ability to absorb the methanol synthesis heat of reaction in an inert hydrocarbon liquid and transfer this heat to generate steam, the LPMEOH process is capable of achieving a high convassr
8-2 - 6 7 -

per pass. Thus, it has economic advantages when combined with larger single-train natural gas-based plants that utilize advanced technology for generating synthesis gas.
The following section will give details of this process. Other methods of converting natural gas to methanol will also be discussed briefly.
LPMEOH Process Description
Exhibit 8-2 shows the LPMEOH process flow diagram. The LPMEOH process converts synthesis gas produced from natural gas to methanol. Alternatively, the process could use syngas from coal. The usual design incorporates generation of synthesis gas (H2, CO and C0 2) from natural gas by steam reforming.
An advanced synthesis gas generation process (not shown) includes both quench and convective trains to achieve maximum thermal efficiency in the methanol production. The synthesis gas is then fed to a three-stage LPMEOH system. The first reactor operates as "once-through" and the last two reactors in series with converted syngas recycled to the second stage reactor. The methanol reactor operates at 1600 psia and a 482T exit temperature [29].
Major Reactions
The synthesis gas contains, H2, CO and C 0 2 along with inert gases such as CHt and N 2. The key reactions which take place in the reactor are:
AH. Btu/Lb Mole of CO or CO?
(1) CO + 2 H 2 -> CH3OH -39,100
(2) C 0 2 + 3 H 2 - ^ CH3OH + H 2 0 -21,300
(3) CO + H 2 0 -» C0 2 + H 2 -17,600
Material Balance
According to the report on LPMEOH [29] (page 69, Table HI - B-3), when charging a feed consisting of 582,000 lb/hr of syngas to the LPMEOH section, the products consist of 525,000 lb/hr of crude methanol and 58,000 lb/hr of fuel gas. The syngas has the following composition in mol %: 30% carbon monoxide, 3% carbon dioxide, 65% hydrogen and 2% other gases. The fuel gas produced consists of 5% carbon monoxide, 11% carbon dioxide, 17% argon, 14% nitrogen, 50% hydrogen and 3% other gases.
8-3
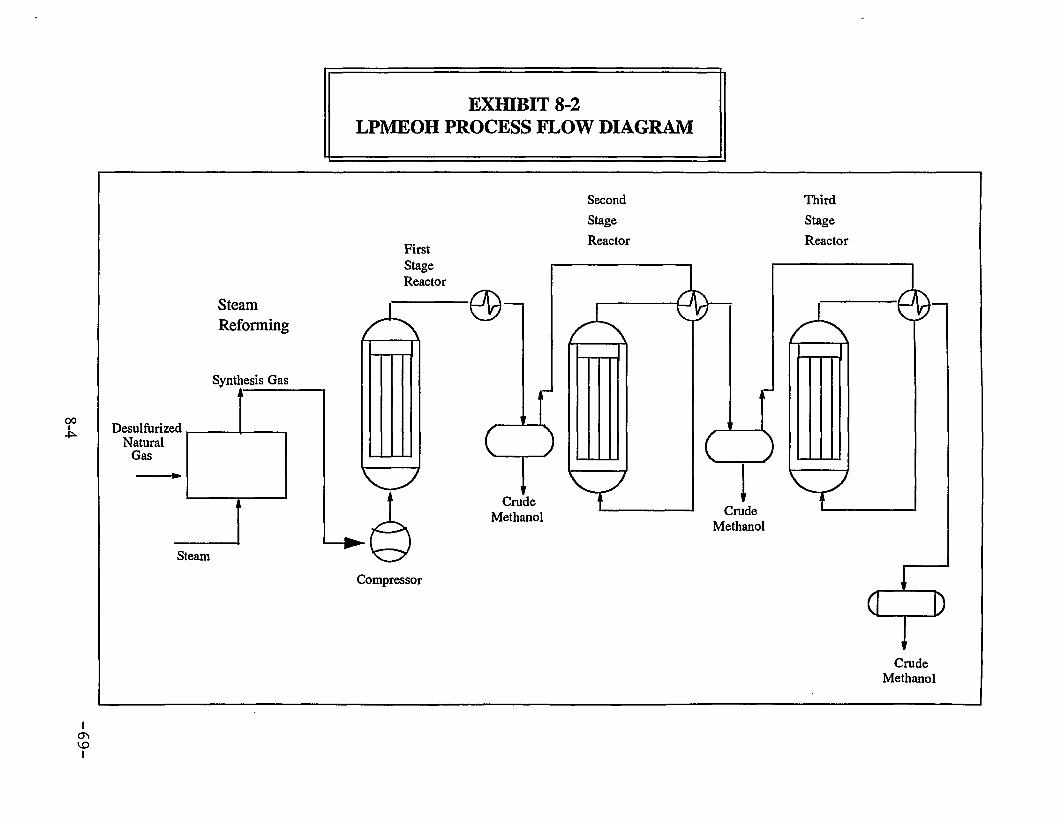
EXfflBIT 8-2 LPMEOH PROCESS FLOW DIAGRAM
First Stage Reactor
Second Stage Reactor
Third Stage Reactor
Steam Reforming
Synthesis Gas
CO Desulfurized Natural
Gas
Steam
c )
t Crude
Methanol
c Crude
Methanol
Compressor
C3 Crude
Methanol
o >
I

Economics
The following economics table for the liquid phase methanol process is based on the report proposed by Chem Systems [29]. The natural gas feed cost and the operating and maintenance cost shown below are for the initial year.
Plant Capacity, BPSD of Methanol 39,572
Total Capital, 106US$ 451.4 (USGC, December 1993)
$/B Methanol Product Natural Gas Feed, $2.43/106 Btu 10.08 Operating & Maintenance Costs 2.73 Capital Charges, 14.2% of Total Capital 4.91
Product Price: $/Barrel 18.65 $/Gallon 0.444
Other Methanol Process Routes
There are two major process steps in the production of methanol, i.e., production of syngas from natural gas and conversion of the syngas into methanol. Therefore, in developing new process routes, improvements can be made in either or both of these steps. The two major methods of producing syngas are steam reforming and partial oxidation. The partial oxidation can be carried out in three different ways: (1) autothermal reforming, (2) non-catalytic partial oxidation and (3) catalytic partial oxidation. These steps vary considerably in temperature. Haldor Topsoe claims advantages for an autothermal reforming process which has a special burner and a fixed catalyst bed in a brick lined reactor [30]. For commercial-scale plants Haldor Topsoe suggests a two-step combination of tubular and autothermal reforming processes. There are tradeoffs between using air or oxygen for manufacturing the syngas. Cryogenic oxygen plants are expensive but so is air compression. Oxygen addition through a membrane may be possible but the feasibility still has not been proven.
Bechtel identified three processes for methanol production as emerging technology [31]. These techniques substitute partial oxidation with 99.5% oxygen for reforming, in whole or in part, for stoichiometric or near stoichiometric synthesis gas production. They are:
• Catalytic partial oxidation (Davy McKee) plus ICI-licensed methanol reactor design using internal tubes for preheating inlet gas.
• Combined reforming (Lurgi) design using a small conventional primary and non-catalytic secondary reformer. The methanol synthesis step uses a copper-based catalyst which permits high activity at less than 300°C.
8-5

• Combined reforming and fluid bed synthesis (Mitsubishi) design using a fluid-bed methanol reactor which permits optimum heat recovery but adds to investment and catalyst makeup requirements.
Comparing the natural gas requirements of these technologies with the requirement for conventional technologies, the natural gas consumption from the greatest to the least is required for conventional technology, catalytic partial oxidation, combined reforming, and fluidized-bed synthesis.
Additional details on Lurgi's combined reforming process shows that that process begins to have a cost advantage over the conventional process at about 1300 tons per day [32]. The advantage comes from small boiler feed water and steam systems and elimination of some utilities which are provided by the air separation unit. Lurgi and Foster Wheeler compare their reforming process to three other processes [33]. Some of the advantages of combined reforming according to Lurgj and Foster Wheeler are:
• 8% to 10% reduction in the consumption of natural gas
• Reduction in the size of the primary reformer
• Reduction of syngas compression requirement due to increased syngas pressure
• Reduced steam consumption
• Production of syngas with the stoichiometric composition required by methanol synthesis
Combined reforming has a lower total energy requirement than conventional reforming, catalytic autothermal reforming and noncatalytic partial oxidation. This confirms the findings of Bechtel mentioned previously. Investment requirements from highest to lowest are in this order: conventional steam reforming, noncatalytic partial oxidation, combined reforming and catalytic autothermal reforming. In terms of CO2 and NO x emissions, the lowest emissions are projected for catalytic autothermal reforming and noncatalytic partial oxidation with conventional steam reforming having the highest emissions.
ICI gives details of their process for methanol synthesis and shows how through improvements over the years overall efficiency has risen from 58% in early designs to 72% in a current design [34] and [35]. This has been accompanied by rising capital costs for heat recovery equipment. The design can be varied depending on whether a plant is located in a high or low cost energy area and whether fresh water is available.
Sud-Chemie AG proposes to increase methanol production from a given facility by adding more CO2 from an outside source [36]. A catalyst was developed which showed greater stability in the C02-rich environment.
8-6

Effect of Cost Factors on Product Costs
As shown in the previous discussion there are newer syngas processes which have lower costs than conventional reforming. In addition, ICI has been moving in the direction of better thermal efficiency. Designs are available with savings in capital cost at the expense of higher rates of energy consumption. When lower energy consumption is needed, capital costs are increased to provide better heat recovery. The choice of these alternatives is a function of how rapidly energy costs are increasing. Some guidelines for achieving the best process designs are:
• Build new facilities to test the new improved technology in both syngas production and methanol synthesis. According to the USDOE it has been difficult to test new technology because very few methanol plants have been built in the past 15 years [37].
• Current and future developments should include larger size plants beyond the 3000 metric tons per day (MTPD) level. This would permit the testing of new technologies such as designed by Davy McKee and Mitsubishi. Bechtel has shown that multi-train designs have the advantage of scale in offblots and engineering savings in onplots [31]. While the increase in costs of the onplots is almost linear with the number of trains (capacity exponent is 0.97), the exponents for offplots, indirects and engineering are much lower, resulting in an overall capacity exponent of 0.69.
• According to Haldor Topsoe [30] 70% of the investments in a methanol plant is for syngas manufacture. Therefore, more effort is justified in improving syngas manufacture than in improving methanol synthesis.
• Two-step syngas production has an advantage over conventional reforming. Thermal efficiency is better, and it is easier to get the right composition of gas for methanol synthesis.
• In syngas production processes where oxygen is used, studies could determine whether to use air or enriched air instead. Membranes could be used for air enrichment. Results of studies comparing use of air, oxygen or enriched air for coal gasification could be applied to methanol production.
• Research could be done to study the feasibility of using a syngas process to supply gas for both methanol and ammonia production in a single plant. This has been done in a Terra International plant in Woodward, Oklahoma [38].
Bechtel [31] made a study of investment and operating costs in various locations in the world for methanol plants. Costs were estimated for six locations. These are as follows, listed in order of lowest to highest investment costs: Port Arthur in Texas, Point Lisas in Trinidad, Edmonton in Alberta, Jubail in Saudi Arabia, Dampier in Australia, and Prudhoe Bay in Alaska. Investment cost location factors are as high as 1.63 for Prudhoe Bay whereas Port Arthur had a factor of 1.00. Costs are higher for both investments and operating costs where fresh water is in limited supply and sea water has to be used for cooling. Other problems in remote locations involve labor supply and importing equipment.
8-7

Commercial Methanol Plants
According to the PACE Petrochemical Service [39] expected U.S. production of methanol in 1994 THEL be 2,225 million gallons and the apparent consumption will be 2,700 million gallons with an e s fe^a i plant operating rate of 99%. Thus, U.S. plants are currently nearly at full capacity and are importing methanol. Any significant increase in methanol demand would require plant construction and greater use of natural gas.
Hydrocarbon Processing [40] shows three licensors of methanol plants. These are:
• Haldor Topsoe A/S. They use two-step reforming followed by low-pressure synthesis. Their newest plant is in Norway with a 2500 MTPD capacity and is scheduled for start -up in 1996. They claim a 10% reduction in cost compared to a conventional plant based on straight steam reforming when building large-scale plants.
• ICI Katalco. They have a low pressure methanol process. Synthesis gas is most commonly produced by steam reforming. They have built 47 plants and presently have four under construction.
• The M. W. Kellogg Co. They use high-pressure steam reforming. The methanol reactors use BASF low-pressure synthesis catalyst. There are approximately 180 M. W. Kellogg synthesis gas plants including methanol, ammonia and hydrogen production. The most recent methanol plant was a 2268 tpd plant in Chile.
Summary
The process description, major reactions, material balance and economics have been shown for the Liquid Phase Methanol (LPMEOH) process. The LPMEOH process has never been experimentally tested and there is a need for a demonstration plant similar to the tests of coal-based power plants carried out under the Clean Coal program. The LPMEOH process is economically competitive or somewhat better than commercial methanol plants. Commercial methanol plants are in a high state of development. Nevertheless, there is still room for small improvements in the methanol processes and a potential advantage for building larger, more economical plants.
8-8

8.2. Natural Gas to Liquid Products via Fischer-Tropsch
The Fischer-Tropsch process for conversion of synthesis gas to liquid fuels (primarily gasoline and diesel) was discovered in Germany in the 1920's and has been commercialized by SASOL Ltd. in South Africa [41]. The technology has been undergoing development over a period of many years. Three plants are in operation: Sasol I at Sasolburg and Sasoi II and IE at Secunda. The economics presented in this section are based on use of natural gas as a feedstock and combining some of the Fisher-Tropsch technologies from SASOL with a more modern method of synthesis gas production for the natural gas feed.
The SASOL plants are the only commercial plants using Fischer-Tropsch and they use coal to make synthesis gas to use as a feed to the Fischer-Tropsch process. However, natural gas as well as other hydrocarbons can also be used to generate synthesis gas for use in Fischer-Tropsch reactors. There is a difference in carbon-to-hydrogen ratio depending on the feedstock type. The design of the synthesis gas and the Fischer-Tropsch steps must take these differences into account.
Process Description
The flow diagram for the gas-to-liquids Fischer-Tropsch process, as developed by Bechtel [42] is shown in Exhibit 8-3. Synthesis gas is produced in a non-catalytic partial oxidation (POX) gasifier operating at 2600T and at sufficient pressure that compression of synthesis gas is not required. After heat recovery and water removal, synthesis gas is admitted directly to the Fischer-Tropsch synthesis loop. Fourteen tubular fixed-bed reactors with steam generators in the shell are used. These reactors are patterned after the ARGE reactors at SASOL but have 3.3 times the capacity. Conditions are 400°F and 250 psig. CO conversion per pass is 60%, with an ultimate conversion of 89%. Selectivity to C5 and heaver hydrocarbons is 84% and the Schulz-Flory parameter is 0.9. A stabilized waxy syncrude is produced for fractionation. Excess tail gas from the fractionation section, over and above that required for fuel balance, is recycled back to the POX converter. C0 2 removal on the recycle stream prevents buildup of CO2 in the system.
8-9

EXfflBIT 8-3 FISCHER-TROPSCH PROCESS
HEATING
A NATURAL G A S •NVfr
+~.%^ U"
TAILGAS
C O r ^ -
PARTIAL OXIDATION 6 GASIFIER TRAINS
F-T SYNTHESIS 14 REACTOR TRAINS
"U SYNTHESIS GAS ^
1M 1111111l.l.l.t l l l l
F.T PRODUCT
FRACTIONATION SECTION
GASOLINE - • -AND
DIESEL
TAILGAS
C0 2 REMOVAL

Major Reactions
The F-T conversion to fuel products, primarily normal paraffins, proceeds according to the following equation:
AFLBtu/LbMoleofCO nCO + (2n+l)H 2->C nH 2n+2 + n H 2 0 -100,000
A concurrent reaction is the water-gas shift reaction:
CO + H 2 0 - > C 0 2 + H 2 -17,600
Other reactions that may be found in the Fischer-Tropsch synthesis are those producing alcohols, olefins and carbon according to Burns and Roe and PETC [43].
Composition of Product Stream
The Bechtel study [42] used for the economics of natural gas conversion to Fischer-Tropsch liquids shows that the CO conversion is 89% and the selectivity is 84% to C5 and heavier. The product is waxy (i.e., highly paraffinic).
In a literature reference on the coal-based Sasol plant in South Africa, M.E. Dry [44] gave breakdowns of products from the SASOL reactors on a % carbon atom basis. The breakdowns are shown in Exhibit 8-4.
Exhibit 8.4. SASOL Reactor Product Composition (% Carbon Atom)
Product F < W w
CH4 2.0 10 C2Ff4 0.1 4 C2Hs 1.8 4 C3H6 2.7 12 C3H8 1.7 2 C4H8 3.1 9 C4H10 1.9 2 C5 to C11 (gasoline) 18 40 C12 to Cig (diesel) 14 7 C19 tO C23 7 C 2 4 to C35 (medium wax) 20 4 >C35 (hard wax) 25 Water-soluble, non-acid chemicals 3.0 5 Water-soluble acids 0.2 1
8-11

SASOL hydrocracks the wax and oligomerizes the C3-C4. They use the naphtha as feed for making ethylene and the diesel is of good quality without further treating. Li addition, the oil work-up for Sasol II includes fractionation, catalytic polymerization, C 4 isomerization and alkylation, C5/C6 isomerization and naphtha hydrotreatment and reforming [45].
Economics
The following economics table for the Fischer-Tropsch process used data from the report prepared by Bechtel [40].
Plant Capacity, BPSD 14,500 of Fischer-Tropsch Liquid
Total Capital, 106U.S.$ 813.9 (USGC, December 1993)
$/B Fischer-Tropsch Product
Natural Gas Feed, $2.43/106 Btu 21.68 Operating and Maintenance Costs 11.90 Capital Charges, 14.2% of Total Capital 24.53
Product Price: $/Barrel 57.46 $/Gallon 1.37
Other Fischer-Tropsch Routes
Variations in the Fischer-Tropsch process consist of differences in reactor designs and differences in catalysts used in the reactors. The SASOL operations employ two different reactor systems, the ARGE fixed bed reactor and the Synthol entrained bed reactor. Other reactor designs have been proposed. In order to provide guidance for further development efforts the U.S. Department of Energy did a comparative study of four reactor systems for Fischer-Tropsch technology [46]. They are as follows:
• Entrained bed reactor, designed by Kellogg and used at SASOL.
• The tube-wall reactor developed by Pittsburgh Energy Technology Center (PETC).
• The slurry reactor, designed in Germany by H. Koelbel and operated semi-commercially in Germany.
• The ebullating bed reactor, developed by the U.S. Bureau of Mines and utilized by Chem Systems, Inc.
8-12

These designs vary from 530 to 640°F in the outlet temperature and from 0.7 to 2.4 in H2/CO ratio in the feed. The relative investment costs are: entrained bed 100, tube-wall 208, slurry 45 and ebullating bed 65. In terms of product yields there are wide variations with the slurry reactor having twice the gasoline yield as the entrained bed reactor. This study is based on conversion of 793 x 103 std m3/h of CO + H2, and it is not dependent on whether the synthesis gas was made from natural gas or coal. The overall conclusion is that the slurry reactor is the best design. It has the lowest investment and catalyst costs of the four reactors. A comparison of the slurry versus fixed-bed reactors [47] by Bechtel shows that both the investment costs and operating costs are lower for the slurry reactor than for the fixed-bed reactor.
The Shell Middle Distillate Synthesis Process [48] combines reforming of natural gas, a Fischer-Tropsch step and conversion to middle distillates by hydroisomerization and hydrocracking of the waxy product. The Fischer-Tropsch step uses a tubular fixed-bed reactor. It is chosen because it is simple and the technology is proven.
A review of Fischer-Tropsch processes by Bums and Roe and PETC [43] emphasizes iron-based catalysts for Fischer-Tropsch particularly for slurry phase reactors. There are recommendations for further work on catalyst and engineering development and catalyst characterization. The Fischer-Tropsch catalyst development work is continuing under the sponsorship of the U.S. Department of Energy. Following are highlights of some of the work reported at 1993 and 1994 Contractors Review Conferences:
• Energy International [49, 50] formulated Fischer-Tropsch cobalt catalysts and tested them in a fixed-bed reactor and in a slurry bubble column reactor.
• University of Kentucky [51, 52] attempted to formulate iron-based Fischer-Tropsch catalysts with the highest possible activity and life and the highest selectivity to desired products. A 100 lb batch of Si and K promoted catalyst was prepared for PETC.
• UOP [53] is developing the means of preparing 100 lb/day batches of Fischer-Tropsch catalyst for slurry processing.
• Texas A&M [54] has done Fischer-Tropsch catalyst development with emphasis on the effect of pretreatment procedures, promoters and binders. The work was done using iron/silica catalysts. Indications are that the targets set for them would be met in a bubble column slurry reactor.
• Bechtel, Amoco and Burns and Roe [55] have developed economics for 3 cases of indirect liquefaction using advanced Fischer-Tropsch technology using coal as a feedstock. They also developed ASPEN simulation models for the plants represented in these cases.
• Brookhaven National Laboratory [56] investigated ultrafine particle iron catalysts in slurry-phase Fischer-Tropsch synthesis. They developed 2 catalysts which were effective catalysts for Fischer-Tropsch synthesis.
8-13

• The MITRE Corporation [57] has updated their coal liquefaction simulation model to make it compatible with a Bechtel case. They carried out simulations which showed that (1) consjaszae; savings can be obtained in a Fischer-Tropsch synthesis by adding the coproduction of etecsisfc (2) the break-even cost of natural gas was estimated to be about $3 per million Btus to give the same Fischer-Tropsch products as coal at $1 per million Btus; (3) the cobalt catalyst system is preferred over iron catalyst; and (4) when using $0.50 per million Btus natural gas the Fischer-Tropsch products are competitive with a spot price of gasoline of about $23 per barrel.
• PETC, Gilbert/Commonwealth and University of Kentucky [58] are testing catalysts called "low-alpha" catalysts which produce hydrocarbons mainly in the gasoline range. These Fischer-Tropsch catalysts consisting of iron, copper and potassium in oxide form were given steady conversions and selectivities over 15 days.
• USDOE, University of Kentucky and Texas A&M [59] have shown that the nature of binders, promoters and pretreatment affects iron phases formed during pretreatment and Fischer-Tropsch synthesis.
Cost Factors
Nearly all of the work done to evaluate Fischer-Tropsch processes has been done using coal as the original feed. However, the work can also be applied to natural gas-based processing by adjusting the CO/H2 ratio through the design of the synthesis gas production plant.
Although SASOL in South Africa has operated coal-based Fischer-Tropsch plants, no natural gas-based Fischer-Tropsch plants have been built. A study was made by Bechtel, Amoco and Burns and Roe [60] for a plant including coal gasification, slurry Fischer-Tropsch and upgrading processes. The study by Bechtel shows that coal-based Fischer-Tropsch processing and coal-liquid upgrading would be competitive with crude oil production and refining at a crude cost of 30.7$/bbl. This indicates that a considerable increase in crude price would be needed before the Fischer-Tropsch process, using coal-gas, could compete with petroleum refining for production of transportation fuels. Use of natural gas and elimination of coal-gasification could improve the economics of Fischer-Tropsch processing.
As indicated earlier, the slurry reactor has the most economical design for Fischer-Tropsch. Further work on optimizing and characterizing catalysts is needed to ensure that catalyst conversion, life and selectivity can be sufficiently good to give a catalyst which can be used commercially.
UOP [61] has obtained economics for the upgrading of Fischer-Tropsch liquids from an ARGE reactor. UOP assumed that 38,860 Bbl/d of upgraded liquids were obtained by processing various fractions of product by use of units for (1) producing C6-C7 aromatics fromLPG, (2) converting benzene to alkyl aromatics, (3) converting naphtha to high octane gasoline, (4) converting Cs-C6
normal paraffins to isoparafiBns and (5) hydrocracking heavy waxy materials to lighter products. T i e capital cost in 1993 dollars would be 259 million dollars. The total upgrading cost including capital
8-14 - 1 9 -

charge factor and operating and maintenance but excluding feedstock costs is $5.78/Bbl of liquid product.
The work by UOP is an example of what can be done to determine upgrading costs and methodology and was done on UOP processes. To get the optimum method of upgrading Fischer-Tropsch liquids depending on product distribution and quality further work is needed. This work could be done using a refinery model or by a series of economic studies on various combinations of upgrading units. When determining the cost of transportation fuels from Fischer-Tropsch processing, the cost of upgrading needs to be added to the cost of producing raw Fischer-Tropsch liquids.
Burns and Roe and PETC [43] have provided a good overview of the development work needed to make Fischer-Tropsch competitive with other methods of making transportation fuels from natural gas. The work they propose includes catalyst development, catalyst characterization and engineering development.
A large part of the production of Fischer-Tropsch liquids consists of the production of synthesis gas to use as feed to the Fischer-Tropsch reactor. It is important to choose the right process for producing the synthesis gas to have the synthesis gas in the proper hydrogen to carbon monoxide ratio. The various ways for producing synthesis gas were discussed under the section on methanol production.
Summary
The process description, major reactions, material balance, product composition and economics have been shown for a process for producing Fischer-Tropsch liquids from natural gas. This process has never been tested but much of the process design and economics are based on the commercial coal-based Fischer-Tropsch process at SASOL in South Africa using the ARGE reactor. The economics could be improved somewhat by using the slurry reactor design. In addition, other methods of producing the synthesis gas may be preferred. Although further design and catalyst development and commercial testing would probably improve the Fischer-Tropsch process, it does not appear that the natural gas-based Fischer-Tropsch process would be an economical method for producing transportation fuels in the foreseeable future using lower 48 U.S. gas. This is true primarily because of current gas prices and the expectation that natural gas prices will increase faster than crude oil prices in the future. The Fischer-Tropsch process may be an economic process using low value gas in remote locations.
8.3. Gasoline by Oxidative Coupling of Methane and Oligomerization
There have been extensive research efforts undertaken during the 1980's and 1990's to find a process for the direct conversion of natural gas to gasoline to avoid the necessity of producing synthesis gas as an intermediate. In 1988 Bechtei [62] did a study to choose three direct conversion processes for further study. Partial oxidation, oxidative coupling and oxyhydrochlorination were selected from a list of nineteen processes.
8-15

When comparing the three processes, i.e., partial oxidation, oxidative coupling and oxyhydrochlorination it was found that a) partial oxidation had a higher production cost due to its higher capital cost and b) oxyhydrochlorination though more favorable from a cost standpoint had corrosion problems to overcome. Therefore, the oxidative coupling and oligomerization process was chosen for detailed examination in this section. Following is a process description for this process.
Process Description
Exhibit 8-5 shows an oxidative coupling process flow diagram. Desulfurized methane-rich gas is contacted at 1,472°F (800°C) and 55 psia with a reducible metal oxide catalysts in a circulating fluid-bed riser reactor. The catalyst is reoxidized in a separate oxidizer using air. Methane and other light paraffins undergo oxidative dehydrogenation with the reactor catalyst to produce free radicals and water. The radicals combine to form light olefins which are oligomerized to gasoline in a second reaction step over ZSM-5 catalyst in fixed-bed reactors. Byproduct CO2 and water are removed between the two reaction steps. Conversion in the first step is limited to 25 percent to maintain 78% selectivity, thus unconverted gases are recycled between reactors. Heat recovery produces steam to drive the recycle compressor. The large amount of recycle moderates the temperature rise in the second step permitting the use of fixed-bed reactors. The design is based primarily on ARCO data [62].
Major Reactions
The overall reaction is as follows:
AHLBtu/LbMoleofCEL
CH4 + ,/2 02^ , /2C 2 H4 + H2 -59,400
The mechanism for the oxidative coupling step in which methane is converted to ethane and ethylene over a metal oxide catalyst involves abstraction of hydrogen from methane to produce methyl radicals and surface hydroxyls on the catalyst, followed by release of the methyl radicals into the gas phase where they couple to form ethane
Catalyst-O* + CH4 -> CH3» + Catalyst-OH
CH3* (adsorbed) -> CH3» (gas phase)
2CH 3*->C 2H5
C2H5 —> C2H4 + H2
The conversion of ethane to ethylene occurs in the gas phase and is largely independent of the catalyst, but dependent on temperature and other operating conditions.
8-16

EXHIBIT 8-5 METHANE TO GASOLINE/OXTOATrVE COUPLING PROCESS
COUPLING REACTOR
COOLER
CYCLONE COMPRESSOR
STEAM
SEPARATOR
STEAM
WATER
DESULFURIZED NATURAL GAS
CATALYST REGENERATOR
RECYCLE GAS
I oo
I
H 2 0
ZSM-5 OLIGOMERIZATION
REACTOR
co 2
REMOVAL
OLEFINS
ABSORBER/ STRIPPER
C 5
GASOLINE
PURGE
RECYCLE EXPANDER

In the second step the ethylene oligomerizes (i.e., forms large chain paraffins and aromatics) in the presence of a zeolitic shape selective catalyst (Mobil ZSM5) to give higher molecular weight olefins which then to convert to aromatics, cycloparaffins and paraffins.
C2H4 —> C+5 olefins —» paraffins + cycloparaffins + aromatics
Composition of Product Stream
Bechtel's study assumes a methane conversion of 25% per pass [42]. This study assumes that in a recycle situation the ethane and higher paraffins will react completely to produce 90% olefins and 10% carbon dioxide. It is further assumed that 90.5% of the olefins are converted to C5+ material with formation of 5% iC4 and nC4 and 4% C3. The liquid product would have a specific gravity of 0.73.
Economics
The following economics table for oxidative coupling is based on the report prepared by Bechtel [42].
Plant Capacity, BPSD of Gasoline 14,500
Total Capital, 106 U.S. $ 937.7
(USGC, December 1993)
$/B Gasoline
Natural Gas Feed, S2.43/106 Btu 21.77 Operating and Maintenance Costs 8.12 Capital Charges, 14.2% of Total Capital 28.25 Product Price:
$/Barrel 71.12 $/Gallon 1.69
Other Direct Conversion Processes
In addition to oxidative coupling plus oligomerization Bechtel [42] chose the following two direct conversion processes for detailed study:
• Oxyhydrochlorination plus oligomerization
• Partial oxidation plus oligomerization
The primary reservations for the oxychlorination step have to do with the extreme corrosiveness of the process and the tendency to lose selectivity as the conversion increases. The partial oxidation step has also had limited success in obtaining good selectivity at a reasonable conversion level. The Bechtel
8-18

economics study ranks the six cases they evaluated in the following order from most expensive production costs to least expensive production costs: partial oxidation, oxidative coupling, oxyhydrochlorination, Fischer-Tropsch, Fixed-Bed MTG and Fluid-Bed MTG. There is possible improvement in the direct conversion process costs, if conversion and selectivity can be improved. The study also compares thermal efficiency for the six processes and finds them to be in the range of 45 to 53%.
The oxyhydrochlorination process is based on research conducted by the Department of Energy's Pittsburgh Energy Technology Center (PETC) [63]. In this process, natural gas is reacted with oxygen and hydrogen chloride over a catalyst made of CuCl, KC1 and LaCl2. The products are primarily chloromethane and dichloromethane in a 4 to 1 ratio. The chlorinated hydrocarbons are fed to a fixed bed reactor and are oligomerized to gasoline. The HC1 and water are separated and recycled.
The following economics table for oxyhydrochlorination is based on a report by Bechtel [42]. The economics from Bechtel were based on 25% conversion of methane. Arun Bose of PETC indicated that experimental results showed an 18% conversion. Therefore, the economics were adjusted to a basis of 18% conversion.
Plant Capacity, BPSD of Gasoline 14,500
Total Capital, 106US$ 956.4
(USGC, December 1993)
$/B Gasoline
Natural Gas Feed, $2.43/10* Btu 19.96 Operating and Maintenance Costs 24.89 Capital Charges, 14.2% of Total Capital 29.69 Product Price:
$/Barrel 76.53 $/Gallon 1.82
These economics show that the cost of producing gasoline by oxyhydrdchlorination is about 8% higher than the cost by oxidative coupling. The oxyhydrochlorination process can be stopped part way through to take off methyl chloride as a chemical rather than making gasoline. The production of methyl chloride from natural gas is discussed in Section 9.6.
Considerable research on direct conversion processes has been sponsored by the U.S. Department of Energy in recent years. None of these processes has yet shown evidence of competitive economics but they have attempted to use innovative materials, catalysis and technology in their research. Following are brief highlights of this research based on proceedings of the 1993 and 1994 Contractor Review Meeting.
8-19 - 8 4 -

Sandia [64, 65] is using biometric computer-aided molecular design to develop a process for the direct conversion of methane and other light hydrocarbons to liquid fuels. They have tested a series of halogenated iron dodecaphenylporphyrin catalysts and plan to develop and test new. z s?e active iron based catalysts. They hope to have W. R. Grace as an industrial partner.
Amax [66] is attempting to develop a catalyst which facilitates methane oxidation to methanol at high conversion and selectivity. Vanadium phosphate catalysts have been selected for this study. The catalyst tested was 90% selective to carbon monoxide but gave no methanol. They are exploring the effects of variables and use of promoters.
Argonne National Laboratory and Amoco Research Center [67] are developing mixed-conductivity oxides for use as oxygen-permeating membranes that can operate without electrodes. These can be used in converting methane or other hydrocarbons using air for the oxidant rather
than oxygen. Membrane tubes have been developed with 99% conversion to syngas but have not produced hydrocarbons by direct conversion.
Worcester Polytechnic Institute [68, 69] is developing membrane reactors for use in oxidative coupling of methane. The aim is to have control over reaction conversions and selectivity. The work to date has concentrated on fabricating membranes and doing modeling.
SRI International [70,71] is preparing fullerene-based catalysts or soots for conversion of methane to ethane and ethylene. The effect of adding hydrogen or other gases will be examined. Results so far show that activated carbon and Merene soot activate the C-H bond of methane and convert it into higher hydrocarbons. No condensable products are formed.
The University of Colorado [72] is studying the direct partial oxidation of methane to methanol using a catalytic membrane system. A cooling tube gives a rapid quench to inhibit further oxidation of the methanol. With a conversion of 4 to 7%, methanol selectivity is 40 to 50% with quenching. Work is being done to test use of air-like mixtures and to better understand reactor mechanisms.
Sun Company, Inc. [73] is trying to find new materials to catalyze the direct reaction of light alkanes with molecular oxygen to form alcohols and to develop practical processes for the direct oxidative conversion of natural gas to alcohol-rich liquid oxygenates. Work is concentrating on synthesizing, characterizing and testing porphyrin macrocycles as hosts for oxidation active transition metal centers including iron, manganese, chromium, ruthenium, cobalt and others. Proof-of-concept work consists of converting propane and isobutane to alcohols because this is much more readily done than conversion of methane.
Lehigh University [74] is investigating catalytic processes for the selective oxidation of methane to C2 hydrocarbons and methanol under relatively mild reaction conditions. The use of acid promoted Sr/La2C«3 has been shown to be very selective for the conversion of methane to C2 hydrocsdsm Further work will be directed toward conversion to oxygenates. Study of new catalysts -will continue.
8-20

• Dow Corning Corporation [75] has been working on the design and construction of a process demonstration unit for converting light alkane gases to methyl chloride via oxyhydrochlorination. They also will try to develop a stable, highly selective catalyst.
• The Institute of Gas Technology [76] is developing a process for converting natural gas to gasoline using carbon disulfide as an intermediate. This eliminates the necessity of sulfur removal as part of the process. Results so far show carbon disulfide produced in yields up to 98%.
• Lawrence Berkeley Laboratory [77] is converting methane using catalytic materials in membrane reactors. They have used Ca-Ni-K oxides for oxidative coupling and plan to study Li/MgO catalysts as well. They have a CRADA between LBL, Orion ACT and DOE.
In the 1980's research was done on direct conversion of methane by oxidative coupling by Union Carbide, Phillips Petroleum, ARCO Chemical, METC, Texas A&M, University of Pittsburgh, and Lawrence Livermore Laboratories. This work included catalyst development, mechanistic studies, and experimental studies. Information and literature surveys of direct conversion by oxidative coupling and other processes to obtain liquid fuels is available in the literature. References of particular interest are referred to in a report by A. D. Little [78] and the previously cited report by Bechtel [42]. An overview of the current work sponsored by PETC, much of which was highlighted earlier, was given by PETC and Burns and Roe. Parkyns et al of British Gas pic [79] has reviewed the literature for the direct conversion of methane to oxygenates and higher hydrocarbons. They conclude that they are not ready to challenge syngas-based processes.
Process Status and Potential
Arthur D. Little [78] states that researchers have shown that single-pass conversion and C2+ selectivity sum to 100% for oxidative coupling. A rule of thumb used by active researchers in oxidative coupling is that the overall yield of C2+ must be greater than 30% for the process to become economically attractive.
According to J. Lyons [80], Sun is not interested in oxidative coupling because the product, ethylene, is a gas and Sun wants to obtain a liquid fuel which can be easily transported. He said a process with better than 80% selectivity and 30% conversion of methane is needed to be worth considering. Bechtel [42] says that if selectivity could be increased to 100% the total plant costs reduction for oxidative coupling would be 10.5%. This improvement in selectivity would have the following effects:
• A reduction in catalyst circulation.
• A reduction in regenerator size and air compressor horsepower.
• A reduction in cooling water duty.
8-21

Arthur D. Little gives the following as goals and considerations for improving the oxidative coupling process:
• Achieve better than 3 5% single-pass conversion and 90% selectivity.
• Maintain high ratios of ethylene to ethane and of carbon monoxide to carbon dioxide.
• Reduce the reaction temperature to between 450-700°C.
• The re-oxidization of metal oxide catalysts from their reduced states using air in a fluidized-bed is preferred over the use of oxygen from an engineering standpoint.
• A system at pressures of 8 to 28 atmospheres is needed from an economic standpoint.
• Design catalysts which can be reactivated and have long catalyst lives if operated under proper conditions.
Commercialization
The oxidative coupling process has not been commercialized. None of the processes developed up to this time have had sufficiently good selectivity and conversion to compete with other natural gas to liquids processes.
The process description, major reactions, material balance, product composition and economics have been shown for the oxidative coupling and oligomerization process. This is a method for the direct conversion of natural gas to gasoline and thus is a means of bypassing the production of synthesis gas as an intermediate step. This process is based on considerable experimental work but has never been commercialized. The process has poor economics because the selectivity and conversion factors are low. Significant improvements in this process selectivity and conversion must be made to make this process viable. To date, the results of an extensive research has been discouraging and has diminished the likelihood of achieving that significant improvement in process selectivity, conversion, and economics. A comparison of economics for oxidative coupling and oxyhydrochlorination shows that the cost of product from oxyhydrochlorination is higher.
8.4. Natural Gas to Higher Alcohols by the IFP Process
Processes for the synthesis of higher alcohols using natural gas for a feedstock have been developed in Europe. In addition, the U.S. Department of Energy has sponsored research in this area. The economics to be presented in the following section will use the conversion of natural gas to higher alcohols by the Institute Francais du Petrole (IFP) process. The IFP process was developed in France and has been tested in Japan by the Idemitsu Kosan Company under a program sponsored by the Japanese government. The process was tested in a mini-pilot scale of 800 metric tons/year in Chiba, Japan. It has not been commercialized. [81]
8-22 - 8 7 -

Process Description
Details of the IFP process descriptions are given both by the MITRE Corporation [81] and IFP [82]. Synthesis gas is produced by high temperature partial oxidation of natural gas to minimize residual methane and carbon dioxide and to avoid unwanted CO2 removal. By C 0 2 recycle and removal the H2/CO ratio is adjusted to be in the range of 2 to 2.5.
The alcohol synthesis reaction takes place in two adiabatic multibed quench reactors in series to get good temperature control. The reaction temperature ranges from 260-320°C, the pressure range is 6-10 MPa and the space velocity range is 3000-6000 per hour. A copper-cobalt catalyst is used. After leaving the reactors, the product goes through a series of separation steps to separate gas, methanol and water from the C2 and heavier alcohol. A simplified flow diagram for this process is shown in Exhibit 8-6.
Major Reactions
The stoichiometry of mixed alcohol synthesis is based mainly on the following generalized reactions:
nCO + 2nH2 -> CJH^iOH + (n-l)H 20 CO + H 2 0 -> C 0 2 + H 2
nCO + (2n+l)H2 -> CHawa + nFfcO nCO + 2nH2 -» CnH2„ + nH 20
The first equation represents the primary alcohol synthesis reaction. The next equation represents the water-gas shift activity of the alcohol synthesis catalyst, and the last two reactions represent the Fischer-Tropsch activity of the catalyst to form paraffinic and olefinic hydrocarbons.
8-23
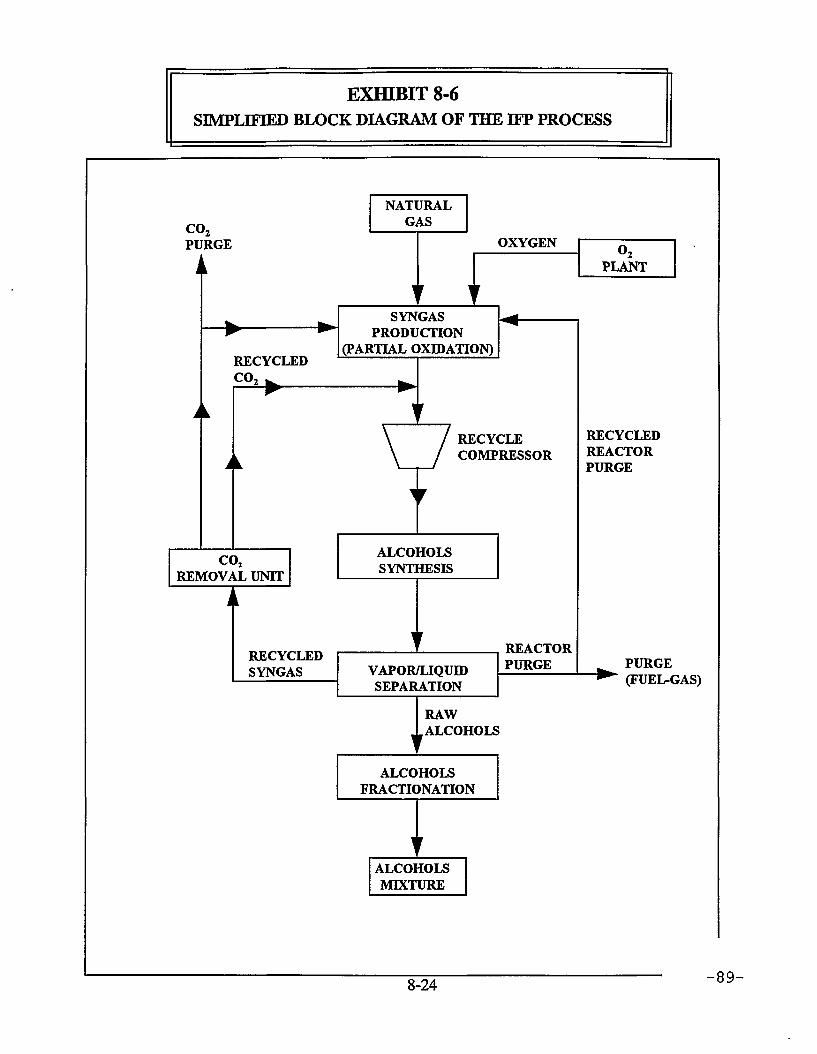
EXHIBIT 8-6 SIMPLIFIED BLOCK DIAGRAM OF THE IFP PROCESS
co 2
PURGE k
NATURAL GAS co 2
PURGE k
OXYGEN co 2
PURGE k
OXYGEN o 2
PLANT
co 2
PURGE k o 2
PLANT
A
" V
A
SYNGAS PRODUCTION
(PARTIAL OXIDATION)
—
RECYCLED REACTOR PURGE
A
SYNGAS PRODUCTION
(PARTIAL OXIDATION)
RECYCLED REACTOR PURGE
A
RECYCLED co 2 ^
SYNGAS PRODUCTION
(PARTIAL OXIDATION)
RECYCLED REACTOR PURGE
A
RECYCLED co 2 ^
RECYCLED REACTOR PURGE
A
A \ / RECYCLE \ / COMPRESSOR
RECYCLED REACTOR PURGE
A
A
i r
RECYCLED REACTOR PURGE A
ALCOHOLS SYNTHESIS
RECYCLED REACTOR PURGE
co2
REMOVAL UNIT
ALCOHOLS SYNTHESIS
RECYCLED REACTOR PURGE
co2
REMOVAL UNIT
1 ' REACTOR
RECYCLED REACTOR PURGE
J i
1 ' REACTOR
RECYCLED REACTOR PURGE
RECYCLED SYNGAS VAPOR/LIQUID
SEPARATION PURGE ^ PURGE RECYCLED
SYNGAS VAPOR/LIQUID SEPARATION ^ (FUEL-GAS)
VAPOR/LIQUID SEPARATION ^ (FUEL-GAS)
i
RAW ALCOHOLS
^ (FUEL-GAS)
ALCOHOLS FRACTIONATION
^ (FUEL-GAS)
1 '
^ (FUEL-GAS)
ALCOHOLS MIXTURE
^ (FUEL-GAS)
8-24 -89-

According to the first equation, the synthesis of mixed alcohols requires two moles (volumes) of hydrogen for each mole (volume) of carbon monoxide. On the other hand, the formation of paraffinic and olefinic hydrocarbons results in a molar H2/CO consumption (usage) ratio equal to or greater than two. However, the overall stoichiometric usage ratio in the mixed alcohol synthesis reaction system can become less than 2 if the catalyst used has a strong water-gas shift activity. The low H2/CO ratio means a carbon-monoxide rich syngas that favors the formation of higher alcohols.
The heat of formation of higher alcohols is greater than that for methanol. The combined synthesis of alcohols and hydrocarbons entails the release of large amounts of heat. The heat of reaction for a typical 50/50 methanol/higher alcohol mix, for example, is estimated to be about 25 percent higher per mole of carbon monoxide (CO) converted than for methanol alone. This indicates that efficient heat removal is an important aspect of higher alcohol production.
Composition of Product Stream
When maintaining a H2/CO ratio of 2-2.5, a temperature range of 260-320°C and a pressure range of 6-10 MPa, conversion per pass is 12-18% with a total conversion of 90+% [82]. The selectivity to alcohols is 70-75%. The composition of the gaseous products after hydrogen and carbon monoxide removal is 70-72% methane, 13-16% ethane and 8-12% C3-C5. The alcohol product consists of 50-70% methanol, 16-23% ethanol, 8-14% propanol and 7-13% C4+ alcohols.
Economics
The following economics table for the C1-C6 alcohols used data from a report by the MITRE Corporation [81].
Plant Capacity, BPSD 15,060 of C1-C6 alcohols
Total Capital, 106 U.S.S 638.1 (USGC, December 1993)
$/B Ci-Cg Alcohol Product
Natural Gas Feed, $2.43/106 Btu 14.91 Operating and Maintenance Costs 9.10 Capital Charges, 14.2% of Total Capital 18.26
Product Price: $/Barrel 50.37 $/Gallon 1.20
8-25

OthgrCii-Cfi Alcohol Routes
In addition to the IFP process there are several other processes which have been or are being developed along the path toward commercialization. These include the following according to the MITRE Corporation report [81]:
• Snamprogetti's MAS process has been developed in cooperation with Enichem and Haldor Topsoe A/S. This process has been implemented on an industrial demonstration scale of 15000 t/year in southern Italy. A syngas is produced and fed to the reactor at a temperature of 350 to 420°C. The reactor pressure is at 90 to 160 atmospheres. Separation of the product consists of taking methanol and ethanol as overhead products, and water is separated from the C3+ alcohol.
• The Octamix process is claimed by Lurgi to be an extension of their low pressure methanol process. Lurgi believes the Octamix process is ready to be used commercially because it uses well proven elements of their methanol process. The reactor feed consists of a syngas stream with a H2/CO ratio of 1.0 to 1.2 joined by a recycle gas stream. In the reactor the syngas mixture which has been compressed to 70 atmospheres is converted to alcohols at a temperature of 250° to 300°C over a Cu/ZnO catalyst. The product Ci to Cg alcohols are separated from the gases in a condensate drum. A unique feature of the Octamix process is the low level of water in the product. The product contains 17 to 42 weight percent C2 to Cg alcohols.
The U.S. Department of Energy has supported several programs for developing catalysts for the manufacture of higher alcohols [81]. Union Carbide Corporation did work to develop ruthenium-based catalytic systems for the synthesis of mixed alcohols. Lehigh University has done work to improve on molybdenum disulfide catalysts originally developed by the Dow Chemical Company.
Work was done at North Carolina State [83] to find a catalyst or catalysts for use in obtaining C1-C6 alcohols. The catalyst development work which involved Rh-based catalysts with various promoters was abandoned because they could not reach the established targets. Future work includes the use of a screening reactor to demonstrate the feasibility of "one step" synthesis of C2+ alcohols from methanol or dimethyl ether.
Cost Factors
The economics of adding C1-C6 alcohol to a gasoline blend are determined by such factors as how much it contributes to increasing the octane number and what kind of tax subsidies are applicable. Also, butanes must be backed out to maintain Reid Vapor Pressure to account for the addition of the oxygenates which have relatively high vapor pressures. The key to developing a good C1-C6 alcohols process is finding a good catalyst and using a reactor design that matches the catalyst properties. In the U.S. further research and development work on the catalysts developed by Union Carbide Corporation and Lehigh University may be worthwhile. These could be tested in a slurry phase reactor system.
A large part of the cost of the production of Ci-C6 liquids consists of the cost of production of synthesis gas to use as feed to the higher alcohols reactor. It is important to choose the right reactor to
8-26 - 9 1 -

produce a synthesis gas with the proper hydrogen-to-carbon monoxide ratio. The various ways for producing synthesis gas were discussed under the section for methanol production.
Commercialization
Three processes are at an advanced state of development [81]. These are IFP, Lurgi's Octamix and the Snamprogetti MAS process. All of these have been tested on a pilot plant but none of them has been operated on a commercial scale. Of these, the Octamix process is the simplest configuration. Lurgi has eliminated the isotropic distillation which has given Octamix an economic advantage over the other competitive processes. IFP and Snamprogetti have more complex reactor arrangements and may have temperature excursions. Octamix does not have these problems. Lurgi has arranged for a license authorizing U.S. Texas Methanol Corporation to manufacture and sell Octamix plants. An EPA waiver for Octamix to be used as a gasoline octane booster was granted in 1988. In granting this waiver, EPA considered exhaust emissions, evaporative emissions, driveability and materials compatibility of the new fuel.
Therefore the Octamix process is the most economical and nearest to commercial reality of all of the processes to make higher alcohols. The IFP process was chosen for the presentation of economics and process description in this section because this information was available for IFP but not for the other processes.
Summary
The process description, major reactions, product composition and economics have been shown for the IFP process for the production of C1-C6 alcohols. This process was developed in France and tested in a mini pilot scale plant in Japan. The economics for this process are poor and the prospects for improving this process significantly are not good. There are other ways of producing higher alcohols that are better than processes based on natural gas. Furthermore, the product from processes such as the IFP process predominantly consist of methanol and ethanol, and these alcohols are less desirable for use in gasolines. Further development of processes for converting natural gas to C1-C6 alcohols may not be recommended unless there is evidence of improved prospects for selectivity to higher alcohols.
8.5. Natural Gas and Butane to MTBE
Over the past decade the addition of methyl tertiary butyl ether (MTBE) to gasoline has increased rapidly. First MTBE was used as a high octane blending component which was substituted for tetraethyl lead which had to be phased out because of EPA requirements. Then, CAAA of 1990 required that gasoline sold in some areas have a minimum oxygen content. The use of ethers and MTBE in particular became an important part of the refinery strategy to produce oxygenated and reformulated gasoline. UOP has developed a three-step method for converting mixed butanes and methanol to MTBE [84]. The three process steps are the Butamer, Oleflex and MTBE units. The following process description is for the UOP technology [84].
8-27

Process Description
In the first step butane is converted to isobutane. The mixed butane feed is routed to a deisobutanizer column which recovers isobutane as an overhead product. The normal butane side cut is isomerized to isobutane in the UOP Butamer unit. The product from the Butamer unit is sent back to the deisobutanizer. The Butamer unit uses a dual-function, chloride-promoted catalyst in the presence of hydrogen.
In the second step, isobutane-rich overhead from the deisobutanizer is routed to the Oleflex unit which dehydrogenates isobutane to isobutylene at an overall selectivity of 91 to 93 mol%. The Oleflex unit consists of a reactor section, continuous catalyst regenerator and a product recovery section.
Liquid product from the Oleflex unit is routed to the Huels MTBE process unit. MTBE is produced by reacting isobutylene with methanol. An ion-exchange resin catalyst is used. The reaction is essentially 100% selective.
Seven Butamer units were in design and construction and 16 Huels MTBE units were on line by 1991. The Oleflex unit regenerator is modeled after the CCR platforming unit regenerator with 91 units in operation by 1991. The flow diagram for this process is shown in Exhibit 8-7.
Major Reactions
CH3-CH2-CH2-CH3 -> (CH3)3CH nButane Isobutane
(CH3)3-CH -> (CH3)2C=CH2+H2
Isobutane Isobutylene
(CH3)2C=CH2+CH3OH -> (CH3)3C-0-CH3
Isobutylene Methanol MTBE
Composition of Product Stream
The final product is essentially 100% MTBE coming from the Huels MTBE unit. The overall mass balance from a UOP-designed unit [84] is as follows:
8-28

EXHIBIT 8-7
MTBE PROCESS FLOW DIAGRAM
H, LE £ i METHANOL
OLEFLEX MTBEUNIT MTBE
Butane :an^ D I B
C5+
BUTAMER
t IL_ LE
LEGEND
DIB = DEISOBUTAMZER LE = LIGHT ENDS
8-29 - 9 4 -
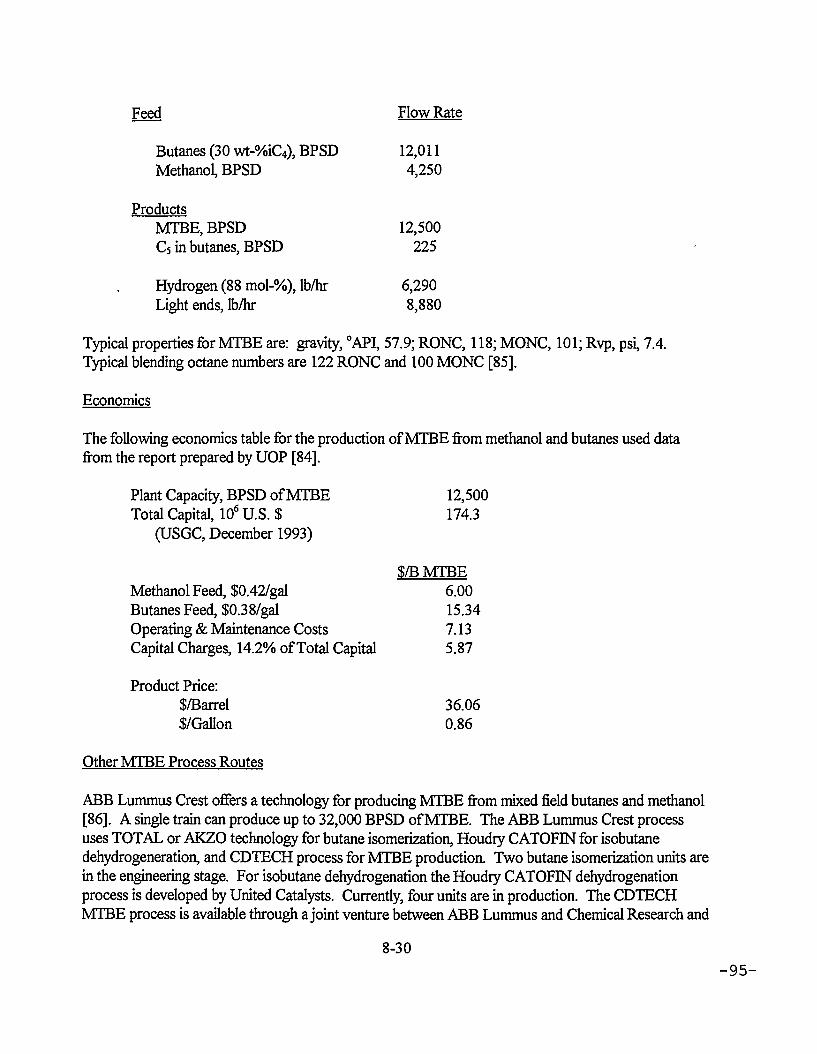
Feed Flow Rate
Butanes (30 wt-%iC4), BPSD 12,011 Methanol, BPSD 4,250
Products MTBE, BPSD 12,500 C 5 in butanes, BPSD 225
Hydrogen (88 mol-%), lb/hr 6,290 Light ends, lb/hr 8,880
Typical properties for MTBE are: gravity, °APL 57.9; RONC, 118; MONC, 101; Rvp, psi, 7.4. Typical blending octane numbers are 122 RONC and 100 MONC [85].
Economics
The following economics table for the production of MTBE from methanol and butanes used data from the report prepared by UOP [84].
Plant Capacity, BPSD of MTBE 12,500 Total Capital, 106 U.S. $ 174.3
(USGC, December 1993)
$/BMTBE Methanol Feed, $0.42/gal 6.00 Butanes Feed, $0.38/gal 15.34 Operating & Maintenance Costs 7.13 Capital Charges, 14.2% of Total Capital 5.87
Product Price: $/Barrel 36.06 $/Gallon 0.86
Other MTBE Process Routes
ABB Lummus Crest offers a technology for producing MTBE from mixed field butanes and methanol [86]. A single train can produce up to 32,000 BPSD of MTBE. The ABB Lummus Crest process uses TOTAL or AKZO technology for butane isomerization, Houdry CATOFIN for isobutane dehydrogeneration, and CDTECH process for MTBE production. Two butane isomerization units are in the engineering stage. For isobutane dehydrogenation the Houdry CATOFIN dehydrogenation process is developed by United Catalysts. Currently, four units are in production. The CDTECH MTBE process is available through a joint venture between ABB Lummus and Chemical Research and
8-30

Licensing Company. Fifty-four CDTECH MTBE plants are in operation, design, or construction stages. ABB Lummus Crest technology has a number of advantages, including lower butane demand (0.73 lb of butane needed to make 1 lb of MTBE) and no need to treat MTBE unit recycle isobutane raffinate.
Lyondell and Rohm and Haas [87] recommend using Amberlyst 35 Wet Polymeric catalyst to increase production of MTBE. Snamprogetti/ANIC [88] was one of the early designers of MTBE units. Their unit uses an ion exchange resin. Water is used for temperature control of the reactor. The product is greater than 98% MTBE.
In addition to using butanes and methanol as a starting point for the production of MTBE, mixed butylenes or isobutylene may be used in place of mixed butanes thus skipping the C 4 dehydration step. The unsaturated CVs are available from refinery FCC or steam cracking units. IFP has developed new technology to isomerize normal butanes to isobutylene [89]. It is called ISO-4 and uses continuous regeneration technology and minimizes side reactions of oligomerization and cracking.
Other routes to obtain isobutylene to feed to an MTBE unit are available. Kinetics Technology [90] suggests steam cracking isobutane to obtain a 70% yield of isobutylene and propylene. Texaco [91] proposes the dehydration of tertiary butyl alcohol to isobutylene in an isothermal fixed bed reactor using aluminum catalyst.
John Brown has written a 2-part series on the etherification of field butanes which gives a good overview of the work going on in this field [92, 93]. In the first part they review the fundamentals of butane isomerization, isobutane dehydrogenation and etherification. In butane isomerization the biggest concern is the deleterious effect of contaminants on the catalyst. Li isobutane dehydrogenation they discussed the need for an isothermal reactor, the desirability of using a catalyst which is also a heat carrier, other methods of providing heat, maintaining a low partial pressure and the problems of coking during regeneration. In MTBE conversion it is important to run in the liquid phase near the thermodynamic limit in order to get near 99% conversion. In the second part of the series the various commercial designs were discussed. Butane isomerization technology dates back to the 1940's. A variety of processes are available for the dehydrogenation of isobutane. These processes differ primarily in the characteristics of the reaction section. The MTBE process consists of (1) reaction, (2) recovery of the methanol and hydrocarbon raffinate stream and (3) recovery of excess methanol and its recycle to the reactor. The design of the reaction section differs mainly by the philosophy of heat of reaction removal. The three principal methods available are (1) fixed bed with recycle, (2) fixed bed tubular reaction and (3) catalytic distillation. Advantages of each system can be seen as a tradeoff between cost and feed efficiency. The higher production and capital costs are accompanied by higher conversion of the isobutylene.
Lehigh University [94, 95] have been developing catalysts and technology for the synthesis of oxygenated fuels and high value chemicals from natural gas. The concept of employing a dual reactor (SO4 27Zr0 2 followed by Amberlyst - 15) for the formation of MTBE was verified. The productivity was an order of magnitude better than using Amberlyst-15 alone. The feedstock is a
8-31 - 9 6 -

methanol/isobutanol mix. Work will continue on catalyst development and development of process steps for converting methane to MTBE in an optimal way.
Air Products and Chemicals, Inc. [96, 97] are developing one-and-two-stage processes to methaaci plus isobutanol from synthesis gas. The isobutanol is converted to isobutylene and is combined with methanol to produce MTBE. A slurry reactor process for converting methane to methanol and isobutanol at 280-320°C uses a cesium-promoted Cu/ZnO/Al203 catalyst. Current efforts are concentrating on improvement in selectivity for the two-step process. The direct synthesis of mixed alcohols has been demonstrated on a pilot scale at LaPorte, Texas.
Cost Factors
Much work has been done to develop the MTBE process as well as the processes for producing feed for the MTBE process. One of the principal decisions in choosing a process route is the cost and availability of C4 hydrocarbons. A1988 study by ARCO printed in an American Petroleum Institute (API) publication [98] compares the cost of producing MTBE when using various feedstocks. The total cost of MTBE in cents per gallon was 71.3 when isobutane was the feedstock, 74.7 when mixed butanes was the feedstock, 53.4 when steam cracker butylenes was the feedstock and 57.6 when fluid cracker butylenes was the feedstock. Thus it is most economical to make MTBE from steam cracker or FCC butylenes. However, these feedstocks are in limited supply and therefore isobutane and mixed butane feedstocks must be used as the demand for MTBE continues to increase. Potentially all gasoline sold in ozone nonattainment areas will need to contain 2.0 wt % oxygen but production of MTBE from the available isobutylene would only result in an oxygen concentration in the gasoline of 0.3 wt %. Therefore, using all the isobutylene from the FCC, coker and steam cracker units would not provide nearly enough MTBE to meet the gasoline specification [84]. Thus, there is a definite need for MTBE processes starting with mixed butanes or isobutane.
The capital costs for an MTBE complex break down as follows [93]:
Isomerization 15% to 20% Dehydrogenation 35% to 50% Etherification 10% to 15% Offsites 30% of TIC
Therefore, there is a better payoff to lower costs on the dehydrogenation section than on the isomerization and etherification sections. Some of the areas where improvement is still possible are in catalyst development, reaction design and utilization of byproducts. Eliminating or rninimizing the recycle stream by improving conversion and selectivity rates is advantageous. There is an advantage in developing catalysts which are tolerant to contaminants.
Comparisons of Ethers Produced from Natural Gas
The processes which make MTBE can easily be adapted to make other ethers such as tertiary amy! methyl ether (TAME) and ethyl tertiary butyl ether (ETBE). Manufacture of TAME is limited by the
8-32

relatively small supply of isoamylenes from FCC refinery units, and ETBE is less economical than MTBE and depends on government economic support being available for ethanol.
ETBE normally is produced from agricultural products so the only two ethers normally used in transportation fuels and which are produced starting with natural gas are MTBE and TAME. According to a 1981 study by Gulf Canada [99], TAME can be made for 24 cents/gallon. These costs exclude the cost of isoamylene for TAME and isobutylene for MTBE but they show that production costs is not a deciding factor when choosing between TAME and MTBE for use in transportation fuels.
According to ARCO [100], MTBE is the most versatile ether. It requires the least amount of ether to achieve the required oxygen level. In making high octane premium gasolines, it provides the maximum distillation benefit in lowering the 50% point. Sources for isobutylene are growing.
TAME provides the most environmental benefit. It reduces tailpipe emissions and converts volatile and highly reactive olefins into a low RVP and clean burning ether. The low RVP is particularly helpful in summer when butanes are removed at an economic penalty to the refiner.
Production of both TAME and MTBE will be needed and will be driven by the need to include them in gasoline to meet environmental requirements. Usually they use isobutylene and isoamylenes from fluid catalytic cracking and steam cracking as sources of feedstock. MTBE can also be made starting with mixed butanes. As previously mentioned [98], these sources will ultimately prove inadequate. It is important to continue to develop processes such as those proposed by Lehigh University [94, 95] and Air Products and Chemicals [96, 97] because they can make MTBE entirely from natural gas and do not have to rely on the refineries for part of their feedstocks.
Dimethyl Ether as Diesel Fuel
Recently Amoco Corporation, Haldor Topsoe A/S, AVL LIST Gmbh and Navistar International Transportation Corporation have developed a new, alternative fuel for diesel engines that has ultra-low emissions. The fuel, predominantly Dimethyl Ether (DME), can be made from natural gas or other feedstocks such as coal or biomass. Details of diesel equipment development and diesel engine test results using DME were presented at a 1995 meeting [101-103]. Unlike other alternative fuels, DME has a high cetane number, which makes it ideal for use in diesel engines. It can be used in diesel engines with minor engine modifications.
DME today is only used as an aerosol propellant and is produced in small quantities, about 150,000 tons annually. For fuel use, large DME plants would be necessary and they would take 3 to 5 years to build. There are two ways to make DME both available through Haldor Topsoe. For the natural gas to DME process [104], the following process steps are required: Natural gas desulfurization and reforming, CO2 removal, DME and methanol synthesis and purification. For methanol to DME, methanol is dehydrated and recycle methanol, water and DME are obtained in several separation steps. Initially, DME could be obtained by the methanol to DME process. Haldor Topsoe says that DME can be made more economically by the natural gas to DME process and that DME costs could be
8-33

similar to Compressed Natural Gas or Liquified Natural Gas, when DME is manufactured in large quantities. Continuing research is needed to improve the DME manufacturing process and reduce its cost, optimize diesel engines for DME and find ways to market the fuel.
Commercial Applications
The dehydrogenation of isobutane to make isobutylene is available using any of the following four commercial technologies [105]:
Process Name Licensor Catalyst
Oleflex UOP Noble-metal based CATOFIN ABB Lummus Crest Chromia-alumina STAR Phillips Petroleum Noble-metal based FBD-4 Snamprogetti SpA Chromia-alumina
These processes have much in common with differences being primarily in the characteristics of the reaction section.
The MTBE licensors and primary reactor technologies are as follows [105]: Fixed Bed
Conventional Boiling Point Expanded Bed Tubular
ARCO CDTECH IFP Snamprogetti Huels/UOP Huels/UOP Phillips RWE-DEA/Edeleanu E C Erdolchemie
Summary descriptions of four of these processes are contained in Hydrocarbon Processing [106]. The Phillips process has licensed seven installations plus a plant at a Phillips refinery. The ARCO chemical process provides total ether capacity of 140,000 bpsd. ARCO has four plants in the U.S. and two plants worldwide and 27 additional licensed plants. CDTECH, a partnership between ABB Lummus Crest and Chemical Research & Licensing has approximately 35 units in operation using a catalytic distillation method to produce MTBE or TAME. UOP has sixteen Huels MTBE units in operation and six more in design or construction. HPI7IRI and ARCO list each of the facilities and their capacity making MTBE [107]. The total U.S. operating capacity is 232,000 B/SD. In contrast, TAME has only 20,000 B/SD of U.S. operating capacity. The Energy Information Administration [108] breaks the MTBE production down by PAD districts. PAD District m which includes Texas and Louisiana has 87% of the MTBE operating capacity.
8-34

Summary
The process description, major reactions, product stream composition and economics have been shown for the UOP method of producing MTBE. Specifically the process steps included are (a) isomerization of butane to isobutane, (b) dehydrogenation of isobutane to isobutylene and (c) conversion of isobutylene and methanol to MTBE. The processes are commercialized and are economically competitive with similar processes licensed by CDTECH, Snamprogetti spA and Phillips. All of these process packages are commercial and are highly developed and efficient. Further studies would show the best designs and catalysts and thus show which are the optimum processes. However, it does not appear that there is much room for significant improvement in them. The production rate of MTBE is expected to grow rapidly as the need for its use as a gasoline additive expands, and so there will be a greater demand for an optimized method of producing MTBE. MTBE can also be made using isobutylene from the FCC and steam cracker processes but this method of getting isobutylene will not be sufficient to meet the isobutylene demand. Therefore, there will be more emphasis on producing MTBE starting with butanes and converting them to isobutylene in the future. There will also be more emphasis on using TAME in gasoline in addition to MTBE. In addition, there is a need to continue to develop processes which can make both the methanol and isobutylene needed to make MTBE entirely from natural gas.
8.6. Compressed Natural Gas (CNG) for Transportation Fuel
Compressed Natural Gas (CNG) has been used as a fuel in commercial fleets particularly for transit fleets. Development is under way for engines to handle this fuel and demonstrations of these engines using CNG have been carried out in businesses in various parts of the country.
The following section will give the economics and some of the advantages and disadvantages of using CNG as a transportation fuel.
Economics
The following economics table is for the production of CNG including the compressor, gas storage and gas line connection when converting a gasoline service station to fast-fill CNG refueling [109]. There is no universal pressure used in CNG but 3000 psig is typical. The product price is calculated using a delivered natural gas cost typical of Midwest and Middle Atlantic locations.
8-35 - 1 0 0 -

Plant Capacity, 106 Btu/Yr 108274 CNG
Total Capital, 106US$ 0.372 (USGC, December 1993)
$/106Btu
Natural Gas Feed, $4.14/106 Btu 4.14 Operating and Maintenance Costs 0.95 Capital Charges, 14.2% of Total Capital 0.61
CNG Product Price, $106 Btu 6.25 CNG Product Price, $/geg* (delivered) 0.73
*geg = gasoline equivalent gallons
Some Advantages and Disadvantages of CNG as a Transportation Fuel
There are both advantages and disadvantages of CNG as a transportation fuel [110]. The disadvantages include slightly higher vehicle cost, greater vehicle weight and higher refueling costs. However, the relatively low cost in terms of gasoline equivalent gallons (geg) will give lower operating costs. There is an advantage where transit loadings are moderate and where there is not a long operating range so that fuel capacity can be reduced.
CNG refueling stations are of two types, i.e., fast-fill and slow-fill. In the fast-fill approach, vehicles are filled in 2 to 5 minutes. With slow-fill the refueling requires up to 14 hours. The slow-fill method is less costly in terms of storage and compression.
8.7. Liquefied Natural Gas (LNG) for Transportation Fuel
Liquefied Natural Gas (LNG) has been used as a form of import natural gas and for peak shaving in utility plants. It is now beginning to emerge as an alternative to CNG for buses, trucks and locomotives. Numerous LNG vehicle demonstration projects have been planned or are being carried out [110].
The following section will give a brief description of the process for producing LNG. In addition, a discussion of the commercialization of natural gas liquefaction will be provided.
Process Description
Natural gas is pretreated and is then send to liquefier equipment. The liquefied natural gas is stored and dispensed as needed. A flow diagram for the liquefaction of natural gas using technology licensed by Air Products and Chemicals, Incorporated is shown in Exhibit 8-8.
8-36 - 1 0 1 -

EXHIBIT 8-8 MIXED REFRIGERANT
CASCADE SYSTEM USED FOR LIQUEFACTION OF NATURAL GAS
NATURAL GAS FEED
COMPRESSOR
-A/S/N^-A / v V
COOLER ]
H
SEPARATOR
-cxy
SEPARATOR
•JX-REFRIGERANT STREAM
I T
D = T T
LNG
8-37 - 1 0 2 -

Economics
The following economics table is for the liquefaction of transportation fuels. The basis for this tebfci, a report by Acurex for the Gas Research Institute on the use of liquefied natural gas (LNG) by-railroads [111]. The product price is calculated using a delivered natural gas cost typical of Midwest and Middle Atlantic locations.
Plant Capacity, 106 Gallons/Yr 168 CNG
Total Capital, 106US$ 83.3 (USGC, December 1993)
$/GallonLNG Natural Gas Feed, $4.14/106 Btu 0.387 Operating and Maintenance Costs 0.020 Capital Charges, 14.2% of Total Capital 0.072
LNG Product Price, $/Gallon 0.537 LNG Product Price, $/geg* 0.85
*geg = gasoline equivalent gallons
Commercialization of Liquefied Natural Gas
Natural gas can be stored as high pressure gas (compressed natural gas, CNG), as a cryogenic liquid (liquefied natural gas, LNG) or through the absorption of methane on molecular sieves and activated carbon. The last method is in the research stage [111]. A primary advantage of LNG compared to CNG is the higher number of BTUs of LNG that can be put into a tank. Although both CNG and LNG have 21,500 Btu/lb, CNG has 30,000 Btu/gallon while LNG has 73,000 Btu/gallon. This is particularly advantageous for transportation of the gas over long distances. LNG could be supplied from a large liquefaction plant at a gas field or imported LNG could be trucked to a refueling facility. Imported LNG would have an advantage over domestic LNG if it could be liquefied in large facilities overseas from fields with relatively low wellhead gas prices. The Interagency Commission on Alternative Motor Fuels [112] believes that in the year 2000 remote gas prices from locations such as Trinidad, Australia and the Middle East could range from $0.79 to $1.65/MMBtu. This is considerably less than the $2.43/MMBTU which this report has been assuming for domestic natural gas.
HydrocarbonProcessing [112] shows that the following are licensors for LNG processes.
• Costain Oil, Gas & Process Ltd. has one installation.
• Air Products and Chemicals, Inc. has ten installations throughout the world.
• Technip and Snamprogetti SpA has fourteen plants operating.
8-38

The plants are designed for use in utilities for base load requirements from field gas or for peak shaving from pipeline gas. However, these same plant designs can be used for transportation fuels.
Summary
The process description and economics for the liquefaction of natural gas have been shown. The economics show that LNG is potentially competitive with other fuels for use in buses, locomotives and trucks both because of its relatively low cost, its environmental acceptability, its uniformity of composition and its amount of energy per unit volume. The technology for liquefaction is mature and is available from a variety of licensors. Facilities for refueling and vehicles adapted to use the fuels are not available except in a few places. Thus much capital expenditure is needed before this transportation fuel can be used. Even though LNG appears to have a number of advantages compared to CNG, CNG has the advantage of wider use and acceptance, and slightly better unit cost.
8-39 - 1 0 4 -

9. Gas Use in Chemicals and Power Production — Economic Analysis
The use of gas in chemical feedstock and in power generation applications is established. This study has analyzed the market for chemical products to assess demand growth and the potential for increased gas usage. Likewise, the issue of increased natural gas use in the power sector was addressed. In each of these applications use of low quality natural gas (LQNG) was compared with use of high quality natural gas.
The economics are summarized in Exhibit 9-1. As can be seen, using high quality natural gas, methanol can be produced at a price well below the current market price, but the market is currently very tight. More importantly, future prices are expected to support an acceptable return on investment. On the other hand ammonia prices, which are currently high, still do not cover the return to capital.
Market growth and U.S. facility economics provide a consistently bleak outlook for increasing natural gas use for ammonia production.
Use of gas is increasing as a fuel for power generation and the favorable economics, a 3.7 cent per kilowatt hour cost, supports that growth.
In all of these cases, use of LQNG as a feed was compared with the use of high quality gas. The low quality gas considered contained 13% N2. A high nitrogen gas was analyzed because it is more costly to remove N2 than CO2 when upgrading a low quality natural gas to a high quality gas. In the methanol case, assuming that the methanol product would sell at the same price when using the LQNG feed as when using high quality gas, the value of the LQNG as a feed would be 2.27 $/MMBTU compared to 2.43 $/MMBTU for the high quality gas. For the ammonia case, the value is 2.24 $/MMBTU compared to the 2.43 $/MMBTU, and in the combined-cycle case, the LQNG is valued at 2.32 $/MMBTU. That is a range of 11-19 0/MMBTU lower value for the LQNG compared to high quality natural gas. Those numbers compare very favorably to upgrading the LQNG via nitrogen rejection which would place a value of only 1.71 $/MMBTU on the LQNG. These results make direct use of LQNG appear to be the path to pursue. There is, however, an important element of the economics not considered — the transportation of LQNG to the production facility, or transport of the product to customer. In the case of power, it is expensive to transport power, if it can not be marketed locally. In the case of ammonia, there is no need for new production facilities. For methanol, the product is needed on the Gulf Coast and little high N 2 gas production is located in the area.
Thus, while the economics for LQNG look favorable, there are limited opportunities because of market and production facilities locations.
9-1 - 1 0 5 -

Exhibit 9-1. Economic Comparison of Natural Gas To Chemicals and Power Processes
Process Liquid Phase Methanol (LPMEOH)
Ammonia Combined Cycle Cryogenic Nitrogen Production
Product Methanol Ammonia Power High Quality Natural Gas
Type of Natural Gas Feed
High Quality
Low Quality
High Quality
Low Quality
High Quality
Low Quality
Low Quality
Costs (dollars per unit product) Name of Unit Gallon Gallon Short
Ton Short Ton
kWh kWh 106Btu
Feed 0.24 0.24 50 46 0.019 0.018 1.58 Other Operating 0.07 0.07 80 83 0.005 0.006 0.31 Capital 0.12 0.12 57 59 0.011 0.012 0.24
TOTAL 0.44 0.44 240 240 0.037 0.037 2.43 Price of Natural Gas Feed,$/106Btu* 2.43 2.27 2.43 2.24 2.43 2.32 1.71 Market Price Range of Product, 10/93 -10/94, $/Unit
0.46 to 1.40 104 to 232 0.046 to 0.052
* The price of the low quality natural gas is the value the LQNG would have in producing the same price product as determined for the high quality gas feed case.
9-2 -106-

9.1. Natural Gas to Methanol by the Liquid-Phase Methanol Process
The liquid-phase methanol (LPMEOH) process was invented by Chem Systems Inc. In a report by Chem Systems it is compared to a version of the more conventional gas-phase processes. The biggest difference between the two processes is in the method of removing the heat of reaction.
Due to its ability to absorb the methanol synthesis heat of reaction in an inert hydrocarbon liquid and transfer this heat to generate steam, the LPMEOH process is capable of achieving a high conversion per pass. Thus, it has economic advantages when combined with larger single-train natural gas-based plants that utilize advanced technology for generating synthesis gas.
The following section will give details of this process. The process description, major reactions and material balance are the same as previously shown in Section 8.1 They are repeated here to help introduce the comparison of the economics of methanol using high and low quality natural gas. Other methods of converting natural gas to methanol were reported in Section 8.1 and will not be repeated here.
LPMEOH Process Description
Exhibit 9-2 shows the LPMEOH process flow diagram. The LPMEOH process converts synthesis gas produced from natural gas to methanol. Alternatively, the process could use syngas from coal. The usual design incorporates generation of synthesis gas (H2, CO and CO2) from natural gas by steam reforming.
An advanced synthesis gas generation process (not shown) includes both quench and convective trains to achieve maximum thermal efficiency in the methanol production. The synthesis gas is then fed to a three-stage LPMEOH system. The first reactor operates as 'once-through" and the last two reactors in series with converted syngas recycled to the second stage reactor. The methanol reactor operates at 1600psiaanda482°F.
Major Reactions
The synthesis gas contains, H2, CO and C0 2 along with inert gases such as CH4 and N 2. The key reactions which take place in the reactor are:
AH Btu/Lb Mole of CO or CO?
(1) CO + 2 H 2 -> CH3OH -39,100 (2) C0 2 + 3 H 2 -> CH3OH + H 2 0 -21,300 (3) CO + H 2 0 -> C0 2 + H 2 -17,600
9-3 - 1 0 7 -

EXHIBIT 9-2 LPMEOH PROCESS FLOW DIAGRAM
STEAM REFORMING
SYNTHESIS GAS
DESULFURIZED NATURAL
GAS
f
I STEAM
FIRST STAGE
REACTOR
SECOND STAGE
REACTOR
5 -©i
J CRUDE
METHANOL
COMPRESSOR
THIRD STAGE
REACTOR
c T
j
CRUDE METHANOL
CRUDE METHANOL
o CO I

Material Balance
According to the report on LPMEOH [29] (page 69, Table III - B-3), when charging a feed consisting of 582,000 lb/hr of syngas to the LPMEOH section, the products consist of 525,000 lb/hr of crude methanol and 58,000 lb/hr of fuel gas. The syngas has the following composition in mol %: 30% carbon monoxide, 3% carbon dioxide, 65% hydrogen and 2% other gases. The fuel gas produced consists of 5% carbon monoxide, 11% carbon dioxide, 17% argon, 14% nitrogen, 50% hydrogen and 3% other gases.
Economics
The following economics table for the liquid phase methanol process is based on the process proposed by Chem Systems when charging high quality natural gas.
Plant Capacity, BPSD of Methanol 39,572 Total Capital, 106 US$ 451.4 (USGC, December 1993)
$/B Methanol Product Natural Gas Feed, $2.43/106 Btu 10.08 Operating & Maintenance Costs 2.73 Capital Charges, 14.2 % of Total Capital 4.91
Product Price, $/Barrel 18.65 , $/Gallon 0.44
Economics were also obtained for methanol production charging low quality gas. This gas contained 13% nitrogen. The previous set of economics obtained when charging high quality natural gas was used as a starting point. Economics in a U.S. Department of Energy report [113] shows economics for methanol production using high quality natural gas and low quality natural gas containing 30% nitrogen. These economics were interpolated to get the effect on the economics of going from high quality natural gas feedstock to 13% nitrogen content low quality natural gas.
The economics table for methanol production when charging low quality natural gas is as follows. The feedstock price is adjusted to give the same methanol product price as for the economics using high quality natural gas as shown above.
Plant Capacity, BPSD of Methanol 39,572 Total Capital, 105 US$ 469.4 (USGC, December 1993)
$/B Methanol Product Natural Gas Feed, S2.27/106 Btu 9.87 Operating & Maintenance Costs 2.86 Capital Charges, 14.2 % of Total Capital 5.12
Product Price, $/Barrel 18.65 $/Gallon 0.44
9-5 -109 -

The resulting value of calculated for the low quality gas in this process is $2.27/MMBtu as compared to the $2.43/MMBtu for the high quality natural gas.
Other Methanol Process Routes and Effect of Cost Factors on Product Costs
Information on 'Other Methanol Process Routes" and 'Effect of Cost Factors on Product Costs" are covered as part of Section 8.1.
Summary
The process description, major reactions, material balance and economics have been shown for the Liquid Phase Methanol (LPMEOH) process. The LPMEOH process has never been experimentally tested and there is a need for a demonstration plant similar to the tests of coal-based power plants carried out under the Clean Coal Program. The LPMEOH process is economically competitive or somewhat better than commercial methanol plants. Commercial methanol plants are in a high state of development. Nevertheless, there is still room for small improvements in the methanol processes and a potential advantage for building larger, more economical plants.
Economics have been shown for producing methanol when charging both high and low quality natural gas. The use of low quality gas requires an expansion of process equipment dimensions and the use of additional feedstock compared to the use of high quality natural gas. Thus methanol can be made economically if the price of low quality feedstock is greater than 16 cents per million Btu less than the price of high quality natural gas. In this case the low quality gas contains 13% nitrogen. The problem with use of this low quality gas for methanol production is that it is available in the parts of western U.S. where methanol needs are minimal.
9.2. Natural Gas to Ammonia
The M. W. Kellogg Company is the world's leader in terms of the number of ammonia plants built. These plants have been built principally to supply fertilizer for use in agriculture. Like the production of methanol, ammonia production requires the production of synthesis gas as a first step. The following section will give details of this process as developed by M. W. Kellogg. Variations in ammonia production technology will also be discussed.
Process Description
Natural gas is desulfurized and is then fed to a primary steam reformer which converts 70% of the natural gas into a raw synthesis gas. In the secondary reformer, air is introduced to supply the nitrogen. The heat of combustion of the partially reformed gas supplies the energy to reform the remainder of the natural gas feed.
9-6 - 1 1 0 -

The secondary reformer effluent is cooled in waste heat boilers and delivered to the CO shift converters containing two types of catalyst. One is a high-temperature catalyst and the other is a low-temperature catalyst. Shift reactor effluent is cooled, condensed water is separated and then it is routed to the gas purification section. Carbon dioxide is removed using Union Carbide's Amine Guard process.
After carbon dioxide removal, final purification includes methanation and gas drying. The resulting pure synthesis gas is compressed, is mixed with a recycle stream and is introduced to the last stage of the compressor.
The gas mixture is passed to the ammonia converter. The effluent vapors are cooled by ammonia refrigeration and the unreacted gases are recycled. Anhydrous ammonia is condensed and separated from the effluent. A simplified flow diagram is shown in Exhibit 9-3.
Major Reactions
The synthesis gas contains H2, CO and CO2 along with inert gases such as CH4 and N 2. The key reactions which take place are:
(l)CO + H 2 0 -> C0 2 + H 2
(2 )3H 2 +N 2 -> 2NH3
Economics
The following economics table for ammonia production when charging high quality natural gas is based on work by Pullman Kellogg [114]. A paper by the Tennessee Valley Authority and Brown and Root Development [115] was used to determine the amount of investment which was used for utilities and offsites.
Plant Capacity, 103 Short tons/year of Ammonia Total Capital, 106 US$
(USGC, December 1993)
Natural Gas Feed, $2.43/106 Btu Operating and Maintenance Costs Capital Charges, 14.2% of Total Capital
Product Price, $/Short Ton
420
149.4
$/Short Ton - Ammonia Product 49.57 80.02 56.90
240.08
9-7

EXHIBIT 9-3 AMMONIA PROCESS
I 00
r L *
PREHEAT
STEAM STEAM
PREHEAT
STEAM STEAM
\ PREHEAT
STEAM STEAM
/L \ AIR COMPRESSION
\ PREHEAT
STEAM STEAM
AUXILIARY BOILER
> k h
>-
AUXILIARY BOILER
"
k
NATURAL GAS DESULFUR-
IZER >- PRIMARY
REFORMER SECONDARY REFORMER >- WASTE
HEAT RECOVERY
>- HIGH & LOW TEMP.
SHIFT
WASTE HEAT
RECOVERY - * * i
>*• DESULFUR-
IZER >- PRIMARY
REFORMER SECONDARY REFORMER >- WASTE
HEAT RECOVERY
HIGH & LOW TEMP.
SHIFT
WASTE HEAT
RECOVERY
Fl IFI
i i
<*
WASTE MEAT
RECOVERY co 2
REMOVAL > •
METIIA -NAT ION
- jr - i MOLECUI.AR
SIEVE DRIERS
WASTE MEAT
RECOVERY co 2
REMOVAL > •
METIIA -NAT ION
'
MOLECUI.AR SIEVE
DRIERS
WASTE MEAT
RECOVERY
PURGE GAS
RECOVERY
co 2
REMOVAL > •
METIIA -NAT ION
'
MOLECUI.AR SIEVE
DRIERS SYNTHESIS
LOOP
PURGE GAS
RECOVERY
' >~ SYNTHESIS
LOOP
PURGE GAS
RECOVERY
/ ] ' ' >~ SYNTHESIS
LOOP
/ ] r • REFRIGER
ATION
/ A
- • REFRIGERATION
/ A / \
SYN. GAS
REFRIGERATION • AMMONIA I'llUUUU 1 A
C( DMPRESSIOI* 4
l - » N3

Economics were also obtained for ammonia production when charging low quality gas. This gas contained 13 volume percent nitrogen. The previous set of economics obtained when charging high quality natural gas was used as a starting point. In calculating the investment, it was assumed that only the steam reforming and Rankine cycle investment and attendant offsites and Exhibit 9-3 utilities were increased by the greater flow rate of the low quality gas compared to high quality gas. A DOE report [113] was used to determine the capacity exponent used in the investment calculation.
Likewise, for calculating operating and maintenance costs, only the reforming and Rankine cycle sections were assumed to be affected by the change in gas quality. An Oil and Gas Journal Article [116] was used to estimate the effect on the change in natural gas requirement. The basis used was that one third of the natural gas was used for fuel and the rest for feedstock. The fuel rate but not the feedstock rate was assumed to be affected by a change in feedstock quality.
The economic table for ammonia production when charging low quality natural gas is as follows. The feedstock price is adjusted to give the same ammonia product price as for the economics using high quality natural gas. The calculated value of the LQNG is $2.24/MMBtu as shown below.
Plant Capacity, 103 Short tons/year of Ammonia Total Capital, 106 US$
(USGC, December 1993)
Natural Gas Feed, $2.24/106 Btu Operating and Maintenance Costs Capital Charges, 14.2% of Total Capital
420
154.9
$/Short Ton - Ammonia Product 45.69 82.73 59.06
Product Price, $/Short Ton 240.33
Variations of Ammonia Production Routes
Improvements have been made in the ammonia process mainly to decrease the energy consumption requirement. The M.W. Kellogg Company [117] reports that older ammonia plants had a cost of energy which was 80-90% of the selling price of ammonia. In the future, they expect that energy costs will still account for 50% of the product ammonia selling price. This represents a decrease of energy usage from 40 to less than 25 MMBtu/ST. Their strategies in new plant design included:
Reduce power consumption Improve process heat recovery Reduce CO2 removal energy consumption Improve power cycle efficiency Reduce stack gas losses
9-9

These improvements can be utilized not only in new plant designs but also in retrofitting existing plants.
KTI Corp. [116] has developed a process for producing ammonia in smaller plants in the 200 to 600 ton per day range in a more efficient manner. It is called the PARC process and includes a number of innovative features in its design. They claim a payout time of 1 to 2 years for natural gas valued at 5.54 S/MMBTU. This is considerably higher than current natural gas price. Therefore the implementation of these energy saving design changes does not appear to be attractive at this time.
Pullman Kellogg [114] has compared the costs of producing ammonia from natural gas, naphtha, fuel oil and coal at 1979 prices and determined that natural gas was the most economical feedstock. Their economic methods could be applied to any sets of feedstock prices to determine comparisons at present and future times.
Synthesis production is a large part of the total cost of ammonia production, and so new improved methods of synthesis gas production should be examined. These methods were discussed in Section 8.1.
Hydrocarbon Processing [118] shows flow diagrams for licensors who have processes for producing ammonia from hydrocarbon feedstocks. The companies involved are:
• Brown & Root Braun with twenty-five single-train plants.
• Two ammonia plants have been built by the LCA process which has advantages at small scale such as 500 tpd. ICI licenses this technology to three contractors: Chiyoda Corporation of Japan, Davy McKee of England and Mannesmann/KTI of Germany and the Netherlands.
• Two plants have been built using the AMV process licensed by ICI Katalco.
• large-scale, single-train ammonia plants are on stream or have been contracted for throughout the world with M. W. Kellogg Company as the licensor.
Where both methanol and ammonia products are needed, it would be cost effective to produce synthesis gas from a single process to supply feed for both processes.
Summary
The process description, major reactions and economics have been shown for the ammonia process using M. W. Kellogg methodology. The ammonia process technology is mature and it is not likely that many new process units will be built in the U.S. in the near future, because of stagnant market demand. There are new process improvements which could be applied to new and existing units if energy prices were high enough to justify them.
9-10

Economics have been shown for producing ammonia when charging both high and low quality natural gas. The use of low quality gas would cause an increase in equipment size and the use of more energy than when charging high quality natural gas. The ammonia can be made economically if the price of low quality feedstock is greater than 24 cents per million Btu less than the price of high quality natural gas. In this case the low quality gas contains 13% nitrogen. The problem with use of this low quality gas for ammonia production is that it is in the parts of the western U.S. where the demand for ammonia is small.
9.3. Natural Gas for Power Production Using a Combined Cycle
The term "combined cycle" refers to power cycles with a gas turbine and steam turbine combined in a series arrangement in which the exhaust from the gas turbine flows directly through a heat recovery steam generator (HRSG). Steam produced in the HRSG is used to drive the steam turbine. Electric generators, driven by both the gas and steam turbines, produce electric power for the grid. Combined cycle power plants, fueled by both natural gas and oil, have been in common use for power generation by electric utilities since the 1960s.
The power plant described in this section is rather large (426 MW) and is therefore quite efficient both because of its size and its use of modern technology. The following section will give details of this process. Information on alternate process routes and cost factors follows.
Process Description
Natural gas is fed to two General Electric PG7001F combustion turbines to generate 304 MW of power. The exhaust gas goes to a heat recovery steam generator where 1485 psig steam is produced. The steam is fed to a steam turbine generator to generate 129 MW of additional power. The total output of power is 426 MW. The net heat rate is 7700 Btu/kWh. A simplified flow diagram is shown in Exhibit 9-4.
9-11 - 1 1 5 -

EXHIBIT 9-4 COMBINED-CYCLE POWER PLANT
vo I
to
FLUE GAS
NATURAL EXHAUST HEAT HP GAS GAS RECOVERY STEAM
STEAM ^ GENERATOR
COMBUSTIOf 4 1 STEAM 1 TURBINE- | TURBINE 1 POWER
GENERATOH a GENERATOR 1 OUTPUT - - > • • •
l

Economics
The following economics table is for a combined cycle power production facility charging high quality natural gas. It is based on the 426 MW case for Gilbert Station Site Alternate Case 2 from an EPRI study prepared by Jersey Central Power and Light Company and Sargent and Lundy [119].
Plant Capacity, MW of Electricity 426 Total Capital, 106 US$ 231.8
(USGC, December 1993) $/kWh Electricity Product
Natural Gas Feed, $2.43/106 Btu 0.019 Operating and Maintenance Costs 0.005 Capital Charges, 14.2% of Total Capital 0.011 Electricity Product Price, $/kWh 0.037
Economics were also obtained for power production when charging low quality natural gas. This gas contained 13 volume percent nitrogen. The previous set of economics obtained when charging high quality natural gas was used as a basis for the price of electricity product. Based on a conversation with Peter Roberts of Solar [120] the mechanical part of the investment and maintenance costs were assumed to be 10% higher when charging low quality gas than when charging high quality gas. The increase in natural gas and chemical costs for a case charging low quality gas compared to the case charging high quality gas is based on an increase in gas volume. The increased gas volume is estimated from material balance data from a Virginia Power EPRI study [121]. The feedstock price is adjusted to give the same electricity product price as for the economics using high quality natural gas.
Plant Capacity, MW of Electricity 426 Total Capital, 106US$ 246.4
(USGC, December 1993) $/kWh Electricity Product
Natural Gas Feed, S2.32/106 Btu 0.018 Operating and Maintenance Costs 0.006 Capital Charges, 14.2% of Total Capital 0.012
Electricity Product Price, $/kWh 0.037
Alternate Process Routes and Cost Factors
Jersey Central Power & Light and Sargent and Lundy [119] have compared two methods of converting natural gas to power. These are steam - injected gas turbine units and combined cycle plants. Evaluations were made for plants located on a fresh water site and on a sea water site. For larger plants, 150 to 400 MW, the combined cycle units showed a distinct economic advantage and would definitely be preferred over the steam - injected gas turbines. Economics for smaller units were
9-13
much closer. The report also shows that there is a considerable advantage in terms of cost of electricity for plants at the 350 to 400 MW level compared to smaller plants.
Virginia Electric and Power Company [121] has shown a three-phase combined cycle power plant. Phases 1 and 2 consist of natural gas or distillate-fired combined cycle units. The third phase adds coal gasification facilities. Their conclusion was that (1) the price of natural gas and distillate would have to escalate significantly and (2) low price, high sulfur coal would have to be available to make the gasification plant installation economically attractive where coal is charged.
Summary
A process description and economics have been shown for power production using a combined cycle with natural gas as a feedstock. The technology is mature. Future improvements may be made in gas turbine technology or more efficient use of energy but whether the use of gas, fuel oil or coal as a feedstock is promoted in the future depends on the trend of relative price increases for these feedstocks.
Economics have been shown for power production when charging both high and low quality natural gas. The use of low quality gas would cause an increase in equipment size and energy usage and would require some equipment modifications to handle the low Btu gas but technologies exist to accomplish this. The power can be made economically if the price of low quality feedstock is greater than 11 cents per million Btu less than the price of high quality natural gas. In this case the low quality gas contains 13% nitrogen. The problem with use of this low quality gas for power production is that it is available in the parts of the western US where the demand for power is small.
9.4. Upgrading of Low Qualify Natural Gas by Nitrogen Rejection
Since there are large volumes of the natural gas which is of low quality and contains excessive amounts of carbon dioxide, nitrogen and hydrogen sulfide, it must be upgraded by eliminating these contaminants in order to become pipeline quality gas. In this section, only the elimination of nitrogen will be considered to illustrate the contaminant rejection problem.
The following section will give details of the process for removal of the nitrogen from subquality gas by the cryogenic process. Later in the section, nitrogen rejection by other process routes will be discussed.
Process Description
Subquality natural gas is first fed to a compressor where the gas is raised from 315 to 610 psia at the front of the plant to furnish energy to produce a refrigeration effect by gas expansion downstream. Before the gas reaches the low temperature part of the process, the precompressed gas is scrubbed in a column with an aqueous solution of diethanolamine (DEA) to remove CO2. Dehydration takes place
9-14 - 1 1 8 -

next in another column packed with molecular sieves. These two impurities are removed before hand to avoid solidification in downstream equipment.
Following dehydration, the gas stream is chilled by the returned N 2 and CH4 stream to -143°F, 587 psia to condense 85% of the inlet stream. The prechilled stream is expanded through a Joule-Thomson valve where the pressure of the stream is reduced to 347 psia and the temperature to -168°F. The expanded stream enters near the bottom of the first column in which a preliminary separation produces a substantially pure N2 stream overhead and a bottom stream containing the remaining N 2 and hydrocarbons. This preparation step rearranges the feed stream composition to match the expected " composition profile in the second column, thereby improving separation efficiency and reducing energy requirements. The preseparated top and bottom streams are separately flashed into the second column at 45 psia and 47 psia, respectively. The final separation in the second column produces a rejected N 2
stream overhead and a CH4 - rich bottom product stream. After heat exchanges to recover refrigeration, the rejected N 2 stream is vented to the atmosphere. The sales gas stream is recompressed to 315 psia and cooled to 120°F before it leaves the battery limits. A flow diagram for the process is shown in Exhibit 9-5.
Economics
The following economics table is for nitrogen rejection from a low quality natural gas containing 13.7% nitrogen. The economics are based on the cryogenic portion of a report by James Ma of SRI International for GRI [122]. The low quality gas feedstock price is adjusted to give a high quality gas price after nitrogen rejection of $2.43 per million Btu, the value used for high quality natural gas in this study. The resulting calculated value of the LQNG is $1.71/MMBtu as shown below.
Plant Capacity, Billion Btu/Yr 5932 High Quality Natural Gas
Total Capital, 106US$ 10.33 (USGC, December 1993)
$/106 Btu Upgraded Natural Gas Natural Gas Feed, Sl.71/106 Btu ' 1.579 Operating and Maintenance Costs 0.312 Capital Charges, 14.2% of Total Capital 0.242
Product Price of Upgraded Natural Gas, 2.431 $/106Btu
Other Nitrogen Rejection Process Routes
A study by Pullman Kellogg compares the economics of small scale nitrogen removal from natural gas [123]. The processes compared were cryogenic, Nitrotec's PSA and lean oil nitrogen removal processes. The cryogenic process had the lowest processing costs but the difference between PSA and cryogenic processes narrows as the nitrogen content approaches 15-25%. The lean oil method processing cost is high compared to both the cryogenic and PSA processes. The report verifies that
9-15

EXHIBIT 9-5 NITROGEN REJECTION FROM SUBQUALITY NATURAL GAS BY A CRYOGENIC PROCESS
FEED GAS
WATEfl TO TREATMENT AND - « -
DISPOSAL
^ CEX
v..
RION r END COMPRESSOR ~L
A* +A\f
YJ T_±J
CO,2 VENT
AMINE REGENERATOR
J
KNOCKOU1" DRUM
N 2 STREAM
AMINE TREAT EIT
SALES GAS
CONDENSER
r\ LOW
PRESSURE COLUMN
V,
-IXH HXK
J " &
HIGH PRESSURE
COLUMN \
SALES GAS COMPRESSOR
- ix j -COI.D
EXCIIANGER BOX
CI l/i SI REAM
DEIIY-DRATORS
REJECTED NITROGEN N 2 REJECTION COLUMNS

nitrogen removal from natural gas is expensive and several avenues for improving nitrogen removal technologies are identified. One important factor for improving economics is to develop the capability of the gas driven engines to accept lower heating value fuel gas.
The Mehra Process for nitrogen rejection has been compared to a cryogenic process for nitrogen rejection of a subquality natural gas [122]. The Mehra technology is a solvent absorption process. Based on results obtained for a 20 million Scfd capacity nitrogen rejection system, the Mehra technology was estimated to require 12% less total fixed capital investment than a cryogenic process. The cost savings by the Mehra technology were estimated at 3 cents per million Btu of upgraded natural gas. In addition, the Mehra process has advantageous qualitative features.
According to GRI [124] a PSA gas separation unit is ideal for small to mid-sized nitrogen rejection (i.e., up to 20 million scf7day of feed). The small amount of mechanical equipment and simple operation makes unattended operation possible. This unit uses carbon molecular sieves.
Summary
A process description and economics have been shown for a process which removes the 13% nitrogen content of a low quality gas using a cryogenic process. The cryogenic process is the recognized method for nitrogen rejection for large natural gas rates whereas the PSA method has advantages for low natural gas rates. It appears that the newer Mehra process has advantages over the cryogenic process but the Mehra process has not been experimentally tested and its capital cost advantage is partially offset by higher operating costs.
The nitrogen rejection process requires that low quality gas cost must be at least 72 cents per million Btu less than high quality gas. Use of this process makes it possible to convert the natural gas to pipeline quality. However, it is much more economical to use the low quality gas for chemical or power production, if that option is available.
9.5. Economics of Conversion of Natural Gas to Ethylene
The economics of converting natural gas to gasoline by direct conversion of methane was discussed in Section 8.3. In that analysis, it was shown that oxidative coupling, oxyhydrochlorination and partial oxidation were the most promising routes for direct conversion of methane but that none of them had sufficiently good selectivity and conversion to make commercial development economically feasible. Since conversion of methane to C2S and other hydrocarbons is a first step in the processes described in Section 8.3, much of what was said there would also apply to conversion of natural gas to ethylene. However, in this section some further discussion of economics will be given which concentrates on the conversion of methane by direct conversion to ethylene as the final product.
Parkyns et al [79] have reviewed the literature containing the economics of the direct conversion of methane to ethylene. Their general conclusion was that the technology is not ready to challenge syngas-based processes. In addition, the review explored novel approaches to methane conversion
9-17 - 1 2 1 -

which they believed might ultimately achieve the goal of commercialization of the direct conversion of methane. The economics reviewed included:
• Kuo and Ketkar did some studies for the U.S. Department of Energy [125] to screen direct methane conversion processes. They concluded that oxidative coupling was the most promising process. However, they said that ethylene production via oxidative coupling would only become competitive over traditional processes at conversion levels above 35% and selectivities above 88%.
• Union Carbide and Plastics Company Ltd. carried out a study on the effect that various operating parameters would have on the economic feasibility of a process based on oxidative coupling [126]. They recommended a process configuration using a demonstrated catalyst which would give low conversion (18%) but high selectivity (77% to C2's). This process is not yet commercially competitive. They believed that future catalyst improvements and high selectivity were the keys to success.
• Lee and Aitani [127] gave the economics for conversion of methane to ethylene at 65% selectivity using a LiCl/MnO catalyst operating at 2 bar and 750°C. They calculated that ethylene could be produced at 530 $/tonne based on 1989 U.S. natural gas prices. These results are the most optimistic encountered even though this ethylene price is still higher than recent market prices.
• Another encouraging study was included in a report covering the work of Geerts et al [128] on Li/MgO coupling catalysts. They combine a coupling reactor followed by an ethane cracking unit. They showed that ethylene could be produced at 500 $/tonne at something above 65% C2 selectivity and 38% methane conversion.
• Menshchikov et al [129] found the optimum methane conversion level to be 40% and the C2 selectivity to be 50% using coupling followed by pyrolysis. Even though the ethylene cost by this process was $679/tonne, this USSR based process development has led to construction of a pilot plant.
• G. Renesme et al [130] in a review article concluded that the environment for oxidative coupling was unfavorable in North America but that it was more promising in Europe and Japan where ethane is already the favored feedstock for steam cracking. They favor the IFP process for direct conversion of methane to ethylene at oil prices above $16/bbl.
• Parkyns et al [79] recommends that future work concentrate on catalyst development, mechanisms of surface reactions and gas separations.
9-18 - 1 2 2 -

A. D. Little has also reviewed the potential for developing a process for obtaining ethylene from methane by direct conversion [131]. Some of their conclusions are as follows:
• The Ci process must have raw material advantages to be commercial since capital costs are high.
• Current economic analysis shows the potential for oxychlorination of methane and oligomerization of methanol (MTO) to become competitive against conventional ethylene production. U.S. Gulf Coast plants using these processes and producing 1 billion pounds of ethylene per year could realize a 15% ROI with an ethylene selling prices of 0.220 to 0.225 $/lb. Of the two processes, oxychlorination has better process efficiencies because the oligomerization of methanol requires the production of methanol as an intermediate. However, the economics assume favorable yields which have not yet been demonstrated in a larger-scale process. Demonstration of process feasibility and development of these processes to commercial operation is necessary as a prelude to commercialization.
• The current limits of selectivity and conversion for oxidative coupling do not allow economic feasibility.
• A single world-scale ethylene plant based on oxychlorination would create a demand for 39.5 bcf of feedstock methane. Converting 25% of U.S. ethylene capacity to the oxychlorination process would create a yearly demand of 354 bcf of natural gas feedstock. Therefore, the potential for increasing the demand for natural gas is great.
Researchers at the Institute de Recherches sur la Catalyse in France have been studying the oxidative coupling of methane [132]. They say that while significant improvement in catalyst performance for the reaction of oxidative coupling of methane to C 2 hydrocarbons has been achieved in the last decade, C2 yields still remain limited in view of a potential industrial application. They have done modeling and experimental work that demonstrates that membrane reactors can be used.
9.6. Economics of Conversion of Natural Gas to Methyl Chloride
In Section 8.3 the economics for converting natural gas to transportation fuels was shown when using the oxyhydrochlorination plus oligomerization process. If you stop the oxyhydrochlorination process before doing the oligomerization, methyl chloride is the resulting product. Following is a brief process description for this process.
Process Description
Methane-rich gas is reacted with oxygen and hydrogen chloride in a fluid-bed reactor a 230 psia and 650°F over catalyst made of CuCL, KC1 and LaCl2. The reactants are cooled and condensed. Water containing unreacted hydrogen chloride and byproduct formic acid is removed and the HC1 is recycled. The products of the oxyhydrochlorination step are primarily chloromethane and dichloromethane in a
9-19

4 to 1 ratio. The design is reported by Bechtel [42] based on research conducted at the Pittsburgh Energy Technology Center [133].
Major Reaction
The oxyhydrochlorination reaction proceeds according to the following reaction:
CH4 + HC1 + 1/2 0 2 -> CH3 CI + H 2 0
The net reaction is highly exothermic, with approximately 30% of the heating value of the methane feed being liberated as sensible heat.
Economics
The following table for the economics of converting natural gas to methyl chloride is based on a report by Bechtel [42]. Based on a bar chart on Page 2-4 of the Bechtel report, the operating and maintenance and capital costs for production of methyl chloride were taken as 77% of the corresponding costs of oxyhydrochlorination plus oligomerization. Feed costs were assumed to be the same as for oxyhydrochlorination plus oligomerization. The material balance is based on Table 5.1 on Page 5-3.
Plant Capacity, Tons/Day of Methyl Chloride 8112 Total Capital, 106 U.S.$ 740.8
(USGC, December 1993) S/Ton Methvl Chloride
Natural Gas Feed, S2.43/106 Btu 35.67 Operating and Maintenance Costs 34.28 Capital Charges 41.10
Product Price: $/Ton 115.95
Process Status and Potential
A.D. Little has briefly reviewed the process for making methyl chloride from natural gas [131]. The chloromethanes such as methyl chloride are not in themselves valuable products. However, they can be converted to higher-valued olefins or hydrocarbon fuels. In Table 2-27, chlorination and oxychlorination research is summarized. Ethylene, vinyl chloride monomer and gasoline are the final products. The research has been conducted by KTI, ITT, PETC, USC and BP. Dow Corning has been doing research on a process for converting methane to methyl chloride via oxyhydrochlorination [134] and [135]. They have focused on developing a catalyst that will give stable, selective formation of methyl chloride. A Cu based catalyst system is most promising. They are also working on the design and construction of a process demonstration unit for this process.
9-20

The most serious reservations about the process are focused on costs associated with handling chlorides and disposal of chloride wastes. Concern was expressed that these problems and associated investments have not been adequately accounted for. The oxyhydrochlorination process is simple and occurs under moderate conditions. Methane conversion is high and methyl chloride selectivity is favored. This process has never been commercialized. Further process development and solutions for corrosivity problems are needed before this process can be commercialized.
9-21 - 1 2 5 -

10. Sensitivity Analysis of Economics in Converting Natural Gas to Fischer-Tropsch Liquids
The conversion of natural gas to Fischer-Tropsch liquids provides a method of obtaining desired transportation fuels but the cost can be relatively high. In this section, a number of parameters will be varied to show the effect on product cost. This will identify which element of cost most needs to be reduced to make Fischer-Tropsch gas-to-liquids a viable commercial process. Parameters to be examined include changing reactor type, gas price growth rate, plant size, location, use of barge mounted plants, oxygen production with ceramic membranes and natural gas price. All of the economics are based on costs before product upgrading.
10.1. Effect of Using Slurry Reactor
In Section 8.2, it was shown that investment costs and operating costs are lower for the slurry reactor than for the fixed-bed reactor for the Fischer-Tropsch process. Economics for the Fischer-Tropsch process using the slurry reactor have been obtained to better define this cost improvement. Economics obtained by Bechtel were used to determine differences in capital costs and operating and maintenance costs between Fischer-Tropsch plants with fixed-bed and slurry reactors [49]. Manpower was assumed to be the same for both reactor designs. The economics for obtaining Fischer-Tropsch liquids from natural gas using the slurry reactor are as follows:
Plant Capacity, BPSD 14,500 of Fischer-Tropsch Liquid
Total Capital, 106 U.S.$ 749.3 (USGC, December 1993)
$/B Fischer-Tropsch Product Natural Gas Feed, S2.43/106 Btu 20.92 Operating and Maintenance Costs 11.88 Capital Charges, 22.56
14.2% of Total Capital Product Price:
$/Barrel 56.84 $/Gallon 1.35
These economics were obtained using a 3.1% feed price growth rate. Economics obtained at the same feed price growth rate but using a fixed bed reactor gave a product price of 59.61 $/Barrel. Thus the use of a slurry reactor instead of a fixed-bed reactor resulted in decreasing the product cost by about $3^arrel, a substantial saving. This difference may understate the real advantage of using the slurry reactor since the slurry reactor produces a product with a much higher proportion of gasoline than the fixed-bed reactor.
10-1 - 1 2 6 -

10.2. Effect of Gas Price Growth Rate
In Section 7.1, the growth price rate for natural gas, in constant dollars, for the period 1992-2010 was predicted to be 3.5 - 4.0% annually. In Section 10.1, it was shown that for a Fischer-Tropsch plant with slurry reactor design the product cost is $56.84/Barrel when the growth rate is 3.1%. Economics will now be given for the same plant except when the growth rates are 0.6, 1.6 and 3.9%. In all cases, plant capacity and total capital stay the same so only product costs will be shown. The economics for Fischer-Tropsch plants charging natural gas at various natural gas price growth rates all starting with first year cost of $2.43/MMBtu are as follows:
Growth Rate for Natural Gas Price, % 0.6% 1.6% 3.9% Annually
Natural Gas Feed, $2.43/106 Btu 20.92 20.92 20.92 Operating and Maintenance Costs 11.88 11.88 11.88 Capital Charges, 14.2% of Total Capital 22.56 22.56 22.56 Product Price:
$/Barrel 52.76 54.04 58.87 $/Gallon 1.26 1.29 1.40
These results show that if the feed cost growth rate is 3.9% instead of 3.1% the Fischer-Tropsch product price is $2/B higher. Likewise if the feed cost growth rate is 0.6% instead of 3.1%, the Fischer-Tropsch product price is decreased by $4/B.
10.3. Effect of Plant Size
The effect of plant scale was analyzed in a case in which Fischer-Tropsch plant size was made four times larger than the one used in Section 10.1. A report by Bechtel was used to determine the eflfects on capital and operating and maintenance costs [31]. The Bechtel report is for the methanol process, but it was assumed that the same cost/capacity relationships could be applied to Fischer-Tropsch. This report shows that capacity exponents for process field costs of 0.96 should be used, capacity exponents for ofiplots field costs of 0.35 are recommended and capacity exponents for home office and engineering should be 0.47. The number of operators per shift was nearly doubled. The economics for a plant four times as large as the one in Section 10.1 but similar in other respects are as follows:
105 - 1 2 7 -

Plant Capacity, BPSD 58,000 of Fischer-Tropsch Liquid
Total Capital, 106U.S.$ 2010.6 (USGC, December 1993)
$/B Fischer-Tropsch Product
Natural Gas Feed, $2.43/106 Btu 20.92 Operating and Maintenance Costs 7.47 Capital Charges, 15.05
14.2% of Total Capital Product Price:
$/Barrel 45.67 $/Gallon 1.09
The economics showed that by quadrupling the size of the plant, the product price can be decreased by Sll/B. Thus it is advantageous to build as large a plant as possible as long as the product demand remains high.
10.4. Effect of Barge Mounted Plants and Alaska North Slope Location
The cost of mounting a Fischer-Tropsch plant on a barge or locating it on the North Slope of Alaska adds substantially to the cost of producing Fischer-Tropsch Liquids. These costs largely are balanced by assuming a very low cost for the natural gas.
Two sets of economics for plants similar to the one in Section 10.1 will be given to show the effect of making different assumptions about type and location of plant on the product price. The effects of remote location and/or barge mounting are based on estimates for methanol plants but it is assumed that the same relationships would apply to Fischer-Tropsch plants.
Chem Systems did a study for the U.S. Department of Energy in which they showed the differences in capital costs, maintenance costs and labor in terms of varying location [37]. There are four categories of location. The economics shown here are based on Category IV costs compared to Category I costs in Table 1-5 and 1-13. Category I costs are U.S. Gulf Coast and Category IV includes barge mounted plants and Alaska North Slope plants. In addition to increases in capital, operating and maintenance costs, costs are also included for adding infrastructure. Natural gas is priced at SO.50/106 Btu. The economics are as follows:
10-3 - 1 2 8 -

Plant Capacity, BPSD 14,500 of Fischer-Tropsch Liquid
Total Capital, 106U.S.$ 1,764.1 (Alaska North Slope or Barge-Mounted, (Note: includes 636.3 for
December 1993) infrastructure)
$/B Fischer-Tropsch Product
Natural Gas Feed, SO.50/106 Btu 4.30 Operating and Maintenance Costs 18.13 Capital Charges,
14.2% of Total Capital 54.10 Product Price:
$/Barrel 71.88 $/Gallon 1.71
In Table 1 in a paper prepared by Bechtel [31], capital and operating costs are compared for a plant on the U.S. Gulf Coast and a plant on the Alaska North Slope.- These cost relationships were used to obtain the following economics for a Fischer-Tropsch plant on the Alaska North Slope. There was no separate accounting for infrastructure. Natural gas is again priced at $0.50/106 Btu.
Plant Capacity, BPSD 14,500 of Fischer-Tropsch Liquid
Total Capital, 106U.S.$ 1223.7 (Alaska North Slope, December 1993)
$/B Fischer-Tropsch Product
Natural Gas Feed, SO.50/106 Btu 4.30 Operating and Maintenance Costs 19.60 Capital Charges,
14.2% of Total Capital 37.19 Product Price:
$/Barrel 57.44 $/Gallon 1.37
The economics show that when comparing costs for Fischer-Tropsch liquids on the U.S. Gulf Coast with costs on the North Slope or a barge mounted plant that Fischer-Tropsch liquids cost from about the same up to $15/Barrel more. This is assuming the natural gas price on the U.S. Gulf Coast is about 5 times as great as on the North Slope or at a barge-mounted remote location. Thus in most cases the manufacture of Fischer-Tropsch liquids cannot be economically justified in a remote location where facility and operating costs would be significantly greater than on the U.S. Gulf Coast.
104

10.5. Effect of Using Ceramic Membranes for Oxygen Production
Considerable work has been done to develop a ceramic membrane that could be used for oxygen production as an integral part of a process for obtaining synthesis gas from natural gas. Argonne National Laboratory has made long tubes of Sr-Fe-Co-0 membrane [136, 137]. These tubes have given methane conversion efficiencies as high as 99% for up to 350 hours. Oxygen is transported across the ceramic material in the form of oxygen ions. Only oxygen is transported so that nearly pure oxygen is available for the synthesis gas reaction on the other side of the membrane and there is no longer a need for air separation by means of a cryogenic oxygen plant.
Worcester Polytechnic Institute is studying the oxidative coupling of methane in an inorganic catalytic membrane [138, 139]. Their target is to convert methane into C2 hydrocarbons using a membrane which allows a controlled amount of oxygen to pass through the membrane to the reaction site. Their work has concentrated on using porous VYCOR membrane reactors in laboratory studies and synthesizing La-Sr-Fe-Co oxide perovskites as oxygen transfer materials for dense membranes. They are doing both experimental work and modeling studies.
The concept of using a ceramic membrane to separate oxygen from air and then deliver the oxygen to take part in a reaction with methane for the production of hydrocarbons is very attractive and presents possibilities for reducing the costs of synthesis gas production and thus also the costs of methanol, Fischer-Tropsch products and ammonia. The process not only delivers nearly pure oxygen but can do so at a wide range of temperatures and pressures. In the natural gas to gasoline process, the syngas production step represents 56% of total capital cost; thus a cost reduction in this step could have a significant impact in overall process economics.
Unfortunately, no cost estimates are yet available for the capital and operating costs for the membrane system in a synthesis gas process. The new perovskite type ceramic membranes are quite different from other membranes used in gas separations and so it is not advisable to use cost data for older membrane systems for the newly developed ceramic membranes. High priority should be given to estimating costs of the new membrane system, so that economics could be obtained. This would permit a comparison with more conventional synthesis gas generation using cryogenic oxygen production. This will help to justify the continued research in this type of ceramic membrane development.
10-5
- 1 3 0 -

10.6. Effect of Changing Natural Gas Price
In some parts of the world, particularly in remote areas, natural gas prices are much lower than the typical U.S. gas prices. In such locations, it may be attractive to convert the gas to a liquid fuel or chemical and transport it to the U.S. or major consumer markets around the world. In order to determine how much of a decrease in the cost of the production of Fischer-Tropsch liquids from natural gas can be obtained by using low cost gas, economics have been obtained when initial natural gas prices are $0.50 and $0.00/106 Btu and the gas price growth rate is equal to inflation (0% constant $'s). It is assumed that capital and operating and maintenance costs are the same as in the U.S. Gulf Coast. There may be places in Asia and other remote areas where this situation is applicable.
The economics for a Fischer-Tropsch plant with slurry reactor with low cost natural gas are as follows:
Plant Capacity, BPSD 14,500 14,500 58,000 of Fischer-Tropsch Liquid
Total Capital, 106U.S.$ 749.3 749.3 2,010.6 (USGC, December 1993)
Natural Gas Feed Cost, $/106 Btu 0.50 0.00 0.00 $/B Fischer-Tropsch Product
Natural Gas Feed 4.30 0.00 0.00 Operating and Maintenance Costs 11.88 11.88 7.47 Capital Charges, 22.07 21.94 14.86
14.2% of Total Capital Product Price:
$/Barrel 35.95 31.81 25.03 $/Gallon 0.86 0.76 0.60
When comparing these economics to the economics of Section 10.1, it can be seen that a decrease of 1.93 to 2.43 $/106 Btu in natural gas price results in a decrease in the Fischer-Tropsch liquid price of 21 and 25 $/B. When natural gas can be obtained at no cost, Fischer-Tropsch liquids can be produced which are only slightly more expensive than gasoline. However, the cost of transportation to market and upgrading still needs to be added to these costs. According to UOP, the cost of upgrading is $5.78/Bbl of liquid product [61].
10-6 - 1 3 1 -

10.7. Summary
The sensitivity cases for the FT gas-to-liquids process are summarized in Exhibit 10-1. In Case 1, the base case, the cost of product is unattractive both because of a high feed cost and a high capital cost. The Case 5 versus Case 1 indicates that the feed cost can be reduced by moving the facility to a remote gas production location where the wellhead gas has significantly lower market value. Comparing Case 4 and Case 1 shows that the capital cost component can be reduced by using the slurry process and increasing the plant scale to 58 MB/D, a moderate sized plant in comparison to most refineries producing gasoline or diesel product. Case 7 demonstrates that if the plant of Case 4 could be built at no greater cost in a low gas cost remote area the product could be produced at 25 $/Bbl - which brings it into the competitive price range with production of products from crude oil. Further achievement in reduction of the capital cost component could potentially be achieved with improvement in the syngas production step which represents over half of the capital cost of the production facility. The membrane syngas process may possess the potential of providing further capital cost reduction and merits further exploration.
It must be emphasized that making FT look economically attractive requires reduction of both feed and capital cost components. This means that a process that would utilize lower 48 gas is unlikely to be a candidate for an FT process. It can be seen as primarily a potential future competitor to LNG production for utilization of remote gas.
10-7
- 1 3 2 -

Exhibit 10-1. Fischer-Tropsch Process Economics Sensitivity Analysis
CASE SYNGAS PROCESS
TYPE FT REACTOR
PLANT LOCATION
CAPACITY B/D
GAS PRICE: S/MMBTU UNIT COST OF PRODUCT: S/BARREL
INITIAL GWTH RATE
FEED O&M CAP CHRG
PLT GATE
1 PARTIAL OXIDATION
ARGE FIXED-BED
GULF COAST 14,500 2.43 3.1 21.68 11.91 24.53 59.61
2 PARTIAL OXIDATION
FT SLURRY
GULF COAST 14,500 2.43 3.1 20.92 11.88 22.56 56.84
3 PARTIAL OXIDATION
FL SLURRY
GULF COAST 14,500 2.43 1.6 20.92 11.88 22.56 54.04
4 PARTIAL OXIDATION
FOURRX SLURRY
GULF COAST 58,000 2.43 3.1 20.92 7.47 15.05 45.67
5 PARTIAL OXIDATION
FT SLURRY ASIA 14,500 0.50 0 4.30 11.88 22.07 35.95
6 PARTIAL OXIDATION
FT SLURRY ASIA 14,500 0.00 0 0.00 11.88 21.94 31.81
7 PARTIAL OXIDATION
FT SLURRY ASIA 58,000 0.50 0 4.30 7.47 14.86 25.03
I
(jO I

11. Comparative Economics and Potential for Increased Gas Use
11.1. Comparative Economics — Transportation Fuels
In previous sections economic summaries were given for a variety of methods of converting natural gas into transportation fuels. The production costs for these processes will now be compared with market prices and recommendations will be made about the potential attractiveness of doing further research on these processes.
Methanol and MTBE are both established processes. Methanol is in wide use both as a chemical and as an intermediate for use in making other chemicals. Many people have discussed the idea of using it as a transportation fuel. MTBE is manufactured in a number of locations for use as a gasoline blend component used to enhance gasoline octane and to meet environmental requirements.
The Fischer-Tropsch process is a tested and commercial proven process. It has been used for gasoline and diesel oil production in South Africa. South Africa has been a special situation because the Fischer-Tropsch plants were built at a time when the international community was imposing an oil embargo on the country. Thus, the existence of the plants in South Africa should not be taken to imply commercial viability in other areas.
Direct conversion of natural gas to gasoline by oxidative coupling or oxyhydrochlorination plus oligomerization and the production of C1-C6 alcohols are in the research and development stage. All of the work on these processes has been done in the laboratory or pilot plant.
Exhibit 11-1 compares the costs of producing the transportation fuels discussed in Section 8.1 to 8.7, inclusive, with prices for comparable transportation fuels taken from price projection tables. All costs and prices are U.S. Gulf Coast, December 1993. Product costs are based on building a grassroots plant.
Exhibit 11-1 shows that methanol and MTBE can be produced from grassroots plants at costs comparable to the current market prices. Based on these results, further research to find methods of decreasing the cost of producing methanol and MTBE seems warranted but will undoubtedly be carried on by the vendors selling the competing commercial processes. It is estimated that by 1996, 52% of the methanol demand will be for conversion to MTBE. Research on methanol and MTBE will continue to be of great interest.
11-1

Exhibit 11-1. Market Prices and Production Costs for U.S. Production Facilities
Product/Process Name
Report Section Showing
Product Cost Estimates
Production Costs
$/Gallon
Product Market Prices
$/Gallon
Methanol/LPMEOH Process 8.1 0.44 0.43
Gasoline-diesel mix/Fischer-Tropsch Liquids*
8.2 1.51 0.66
Gasoline by Oxidative Coupling 8.3 1.69 0.69
Gasoline by Oxyhydrochlorination 8.3 1.82 0.69
Higher Alcohols by IFP Process 8.4 1.20 0.90 (for MTBE) and 0.43 (for
methanol)
MTBE by UOP Process 8.5 0.86 0.90
Compressed Natural Gas (CNG) 8.6 0.73/geg 0.84
Liquefied Natural Gas 8.7 0.85/geg 0.84 *Includes upgrading cost of Fischer-Tropsch liquids. Assumes 46% gasoline and 54%
diesel oil in product.
The cost of gasoline and diesel oil by Fischer-Tropsch processing is more than twice as large as the market price for these same products when produced from crude oil. Fischer-Tropsch does not look attractive using lower 48 gas now, nor will it likely look attractive in the future. In fact it will probably look less attractive if the forecast of U.S. lower 48 gas prices growing faster than crude turns out to be correct. The potential attractiveness with gas as a feedstock lies with using remote gas resources. If the cost of natural gas is $1.00 per million Btu rather than $2.43 per million Btu as assumed in Section 8 economics, the cost of producing Fischer-Tropsch liquids would go down to $1.17 per gallon (see Section 10.6).
Due to the high cost of producing C1-C6 alcohols, research in this area is not recommended unless there is evidence of the potential for significant improvements. The processes developed up to this time produce alcohol mixtures which consist mostly of methanol and ethanol. These forms of alcohols are not good from a marketing standpoint due to problems with polarity and water attraction. It appears that production of higher alcohols from chemicals other than methane may be more profitable.
11-2 - 1 3 5 -

Due to the poor economics of producing gasoline by direct conversion processes such as oxidative coupling and oxyhydrochlorination an economic process may not be available for a long time. A lot of research in this area has been done and hope for a breakthrough is diminishing. The economics given for oxidative coupling were based on an ARCO design from 1987 and nothing superior has appeared in the published literature since then.
CNG and LNG are competitive in price with gasoline and therefore are simple, attractive methods of utilizing natural gas for transportation fuels. Further work is needed to make it convenient and readily available as a fuel. As can be seen in Exhibit 8-8, it is more expensive to produce LNG than CNG. There are trade ofFs in comparing CNG and LNG, such as energy density, transportation and distribution costs to consumers, and vehicle fueling and storage. Currently, CNG is primarily being considered for cars and buses whereas LNG is being considered primarily for large trucks and locomotives.
There is new promise for future commercialization of a process for converting natural gas to dimethyl ether (DME) via the syngas route. A group of companies recently announced that DME is a good diesel fuel because of its high cetane number and low emissions.
In summary, methanol, MTBE, CNG and DME currently appear to be the most attractive forms of transportation fuels that can be made from natural gas. At this stage, production of Fischer-Tropsch liquids, gasoline by direct conversion and C1-C6 alcohols are less attractive alternative methods of converting natural gas to transportation fuels from an economic standpoint.
11.2. Comparative Economics — Chemicals and Power Production
In sections 9.1 - 9.6, economic summaries were given for a variety of ways to convert natural gas into chemicals and power. The production costs for these processes will now be compared with market prices, the economics of using low quality gas will be shown and recommendations will be made about the potential attractiveness of doing further research on these processes.
Exhibit 11-2 compares the cost of producing chemicals and power shown in Sections 9.1, 9.2, 9.3, and 9.6, with prices for chemicals and power taken from price projection tables. All costs and prices are U.S. Gulf Coast, December 1993 except for ammonia market prices. Product costs are based on building grassroots plants.
11-3 - 1 3 6 -

Exhibit 11-2.
Name of Product Section Showing Product Cost Economics
Cost of Producing Product
Actual Market Price
Methanol 9.1 $0.44/gallon $0.43/gallon Ammonia 9.2 S240/ST S140-145/ST (10/93)
S230-232/ST (10/94) Power by Combined Cycle
9.3 $0.037/kWh $0.049/kWh
Methyl Chloride 9.6 $116/Ton $0.335/lb
Exhibit 11-3 shows the value of the low quality natural gas when producing methanol, ammonia and power (Sections 9.1, 9.2, and 9.3). The LQNG contained 13% nitrogen. The value of the LQNG was calculated assuming the same product prices estimated for comparable plants which use high quality natural gas feed costing $2.43/million Btu. In addition, the price of low quality gas is shown when using it as a feedstock in a cryogenic nitrogen rejection plant to get high quality natural gas priced at $2.43/millionBtu.
Exhibit 11-3.
Product Made Using LQNG Feed
Value of LQNG When Alternative High Quality Gas is2.43$/MMBTU
Methanol 2.27 Ammonia 2.24 Power by Combined Cycle 2.32 High Quality Natural Gas by Nitrogen Rejection
1.71
The potential for increased gas use in each of the markets will be determined by the economics given above and by growth in domestic production of the product. In the case of methanol, the economics of producing methanol using domestic gas as a feed is estimated to be competitive with foreign produced methanol, and additional methanol capacity additions are expected. Methanol demand growth in the U.S. has been very strong because of the mandate to provide oxygenated and reformulated gasoline. The rate of growth in U.S. methanol demand will decrease after 1995, but will still be sufficient to provide for increased gas use.
11-4 - 1 3 7 -

The U.S. demand for ammonia has been stagnant and the US production cost for a new facility are not competitive compared to imported ammonia. Increased use of natural gas for ammonia production is unlikely. The possible use of methane as a feedstock for ethylene production was reviewed. Production of ethylene is an intermediate step in some of the processes for producing gasoline and diesel from methane. In fact the economics of producing ethylene appear to be more attractive than going the second step of conversion to gasoline. The research on methane to ethylene has shown some promise but conversion and selectivity have not yet achieved levels to be competitive with use of gas liquids for ethylene production.
The use of natural gas for power generation has been growing in both the industrial and power sectors. Gas based power costs are extremely competitive, gas is environmentally attractive, and gas-based generators have great size flexibility. Future growth is occurring and will continue as long as gas's future price picture remains as bright as it is now.
Methyl chloride can be produced from natural gas but the production process, oxyhydrochlorination, is still in the research stage. Methyl chloride has a fairly small market demand but the oxyhydrochlorination process has added importance, since in a second process step transportation fuels can be produced. More work is needed to bring the methyl chloride manufacturing cost down. The market price of methyl chloride is six times the cost of producing it probably because its current price is based on production of small quantities.
11.3. Potential For Increased Gas Use
At present about 200,000 B/D of MTBE is being produced. This is made from methanol and butanes with the methanol being produced using natural gas as a feedstock. At present, MTBE and relatively small amounts of CNG and methanol comprise the total amount of transportation fiaels made from natural gas.
This situation may change. Dimethyl ether (DME) is potentially useful as a new and superior diesel fuel. Compressed natural gas (CNG) is being demonstrated for use in fleet use as a clean burning fuel. Also methanol may increase in usage because of its environmental advantages. All of these would be
made starting with natural gas. If by the year 2010 a total of 1,000,000 B/D gasoline and diesel is replaced with gas derived fuels consisting of MTBE, DME, CNG and methanol, approximately 1.6 trillion cubic feet of natural gas per year would be used.
11-5
- 1 3 8 -

11.4. Estimated Employment Generation of a Gas-to-Liquids Industry
As has been described, some natural gas-to-liquid processes are already competitive with crude derived products and other processes may reach that state with additional research and development effort. When those processes are economically competitive with crude based products, that is, there are no subsidies, then there are favorable economic benefits to the American consumer. When gas derived products produced from domestic gas replace crude derived products, then they have a beneficial impact on the U.S. trade balance.
Construction of gas conversion process facilities will result in employment benefits of creating jobs that are well above average in wages and salaries. The process industries are among the most capital intensive of the manufacturing industries and wages are relatively high. According to API statistics [140] in 1992, the U.S. refinery industry employed 118,919 workers to produce approximately 14.8 MMB/D of products or about 8 workers per thousand barrels per day of product.
By 2010 DOE's Energy Outlpok [8] forecasts that U.S. demand for transportation fuel will increase by about 3 million barrels per day. If it is assumed that all of that increased demand were met by gas derived products, an estimate of the increase in process industry employment could be developed. Based on the economic analysis of this report, methanol and MTBE facilities would require only about 80-100% of the total employment of the average U.S. refinery on a per product barrel basis and a Fischer-Tropsh plant would require about 2 times the refinery employment. For new gas-to-liquid facilities, we have estimated that an average of 10 employees for a thousand barrel per day of production would be required. For 3 million barrels of incremental production, the total new process employment would be 30,000 employees. These higher paying jobs in the process industry would also indirectly create additional employment in the plant areas through the multiplier effect.
11.5. Potential Improvements and Cost Reductions for New Gas to Liquids Projects
The natural gas to liquids projects discussed in previous sections are in various stages of development. Some processes such as direct conversion of methane to gasoline via oxidative coupling and conversion of methane to higher alcohols are in the research stage. Other processes such as conversion of methane to methanol and MTBE are established commercial projects with numerous plants. In this section, some guidelines are provided to show what might be expected to happen to costs as a process is developed and commercialized.
Rand made an extensive study of cost growth in pioneer plants [141]. They looked at information supplied by 34 firms and covered pioneer process plants through R&D, project definition, engineering/construction and start-up. Results showed that the ratio of estimated costs to actual costs ranged from 49% in the R&D stage to 93% in the construction stage. Most of the variation in cost-estimation error can be explained by (1) the extent to which the plant's technology departs from that of prior plants, (2) the degree of definition of the project's site and characteristics and (3) plant complexity.
11-6
- 1 3 9 -

Rand also did several studies to show the improvement cost obtained by building a number of plants patterned on a first-of-a-kind process plant [142, 143]. When they compare costs of a second -***" with costs of a first-of-a-kind plant, their results showed that with respect to overall unit pra J "- ' cost/price, the effective range of improvement appears to be between 5 and 40 percent with a norm between 20 percent and 30 percent. Improvements in design and construction cost accounts for a 5 to 10 percent decrease in costs. Improvements in plant performance with successive plants is also a significant factor. An illustration is the three SASOL plants. SASOLI took 4 to 5 years to reach 75 percent of design capacity, SASOL II took 2 years to reach 75% of design capacity and SASOL HI reached 90% of design capacity in nine months. The best improvements in costs of successive plants resulted from use of the knowledge of the owner-operator and his experienced personnel and taking time to fully analyze the operation of the first plant before building the next plant. Another factor resulting in maximizing cost improvements in successive plants is based on maintaining similarity between the pioneer and follow-on plant.
Section B.5.3 of Volume I of the EPRI TAG Manual [144] is generally in agreement with the results of the Rand study. Figure B.5.1 shows capital costs/unit of capacity versus time. It shows that the capital cost based on incomplete data is about 30% of the actual capital cost of the first plant whereas capital cost for a plant available for commercial order is about 75% of the actual cost. After building the first plant, the third plant built would cost about 75% as much as the first plant and the fifth plant would cost 50% as much as the first plant. Not much change in plant cost is expected after building the fifth plant.
These studies may be used as a guide in making decisions about the development and demonstration of new processes. If the costs for a new process at the engineering/construction are 25% above the costs for a mature competitive process, it is probably advisable to build a first-of-a-kind plant. Later plants for the same process can be built at significantly lower costs and can reach capacity more quickly and thus compete with the mature process. It is therefore justified for government to subsidize and sponsor the building of such a plant.
11-7 - 1 4 0 -

References [I] Energy Information Administration, USDOE, "Natural Gas Annual 1992" Vol. 1, November 1993,DOE/EIA-0131(92)/1.
[2] Energy Information Administration, USDOE, "Natural Gas Annual 1992 - Issues and Trends", March 1993, DOE/EIA-0560(92).
[3] Energy Information Administration, USDOE, "Natural Gas Annual 1994 - Issues and Trends" July 1994, DOE/EIA-0560(94).
[4] Holtbeg, P.D. et al, "1993 Edition of the GRI Baseline Projection of U.S. Energy Supply and Demand Projection to 2010, Gas Research Institute, June 1993.
[5] W.P. Acheson, J. H. Hackworth, S. Kaspar and H. G. McUvried, "Utilization of Low Quality Natural Gas: A Content Assessment", DOE/MC/27346-35417 (DE94000047), Jan. 1993.
[6] R H. Ffugman, E. H. Vidas and P. S. Springer (Energy and Environmental Analysis, Inc.), "Chemical Composition of Discovered and Undiscovered Natural Gas in the Lower-48 United States", Gas Research Institute, Nov. 1990, GRI 90/0248.
[7] Energy Information Administration/U.S. Department of Energy, "Annual Energy Outlook 1994 with Projections to 2010", January, 1994, DOE/EIA-0383 (94).
[8] Energy Information Administration, US DOE "Annual Energy Outlook 1995 with Projections to 2010", January 1995, DOE/EIA-0383 (95).
[9] Gas Research Institute, "GRI Baseline Projection of US Energy Supply and Demand, 1995 Edition", Baseline/Gas Resource Analytical Center, August 1994.
[10] Gushee, David E., "Atlantic Transportation Fuels: Oil Import and Highway Tax Issues", Congressional Research Service, Order Code IB93009, updated February 18,1994.
[II] National Petroleum Council, "Petroleum Storage & Transportation", Washington, D.C., April 1989.
[12] Christopher S. Weaver, "Natural Gas Vehicles - A Review of the State of the Art," Society of Automotive Engineers (SAE), Paper Number 892133, (Warrendale, PA 1989), p. 37.
[13] American Petroleum Institute, Alcohols and Ethers, Publication No. 4261, 2nd ed. (Washington, DC July 1988) p. 54.
R-l - 1 4 1 -

[14] Frank Black, "An Overview of The Technical Implications of Methanol and Ethanol on Highway Motor Fuels," Society of Automotive Engineers (SAE), Paper Number 912413, (Warrendale, PA, 1991), p. 11.
[15] Environmental Protection Agency, Office of Mobile Sources, Analysis of the Economic and Environmental Effects of Compressed Natural Gas as a Vehicle Fuel, Volume I, Passenger Cars and Light Trucks, (Ann Arbor, MI, April 1990), p.48.
[16] California Department of Transportation, Division of Mass Transportation, Public Transportation Alternative Fuels, Final Report, prepared by Booz-Allen & Hamilton, Inc., FTA/DMT-CA-80-PB92-120120 (Sacramento, CA, June 30,1992), p. 5-3.
[17] U.S. Environmental Protection Agency, Office of Mobile Sources, Analysis of the Economic and Environmental Effects of Methanol as an Automotive Fuel, Special Report (Washington, DC, September 1990).
[18] National Petroleum News, Volume 85, Number 7 (Elk Grove Village, IL: Hunter Publishing Limited Partnership, Mid-June, 1993), pp. 130,133.
[19] First Interim Report of the Interagency Commission on Alternative Motor Fuels, (Washington, DC, September 30,1990), pp. 4-29,30.
[20] U.S. Department of Energy, Office of Policy, Planning, and Analysis, Assessments of Costs and Benefits of Flexible and Alternative Fuel Use in the U.S. Transportation Sector, Technical Report Four: Vehicle and Fuel Distribution Requirements, DOE/PE-0095P (Washington, DC, August 1990), pp. 18-21.
[21] California Energy Commission, fax provided by Methanex, July 15,1992.
[22] Annalloyd Thomason, "NGVs: What Every Customer Should Know," NGV Resource Guilde, Volume 1, ed. Ellen Pollock (Denver, CO: RP Publishing Inc., June 1993), p.7.
[23] PACE Petrochemical Service, Annual Issue, December 1993.
[24] "Ammonia Strength Has Staying Power", Chemical Marketing Reporter, October 3, 1994, p. 3.
[25] Mark L. Kesler and Barbara Ex (Arthur D. Little), "The Role of Natural Gas in the Chemical Process Industry: Implications for the Future, Volume 2, Appendices, Final Report, January 1989-June 1990", prepared for Gas Research Institute, December 1990, PB91-182535.
[26] "Methanol Moves into a New Era", Chemical Week, August 31/September 7,1994, p. 36.
R-2
- 1 4 2 -

[27] Smock, Robert, "Base Load Power Plans Continue to Expand", Power Engineering, April 1994, p. 23.
[28] Energy Information Administration, USDOE, "Natural Gas 1994: Issue and Trends", July 1994, DOE/EIA-0560 (94).
[29] Chem Systems Inc. "Topical Report LPMEOH Economics", submitted to Air Products and Chemicals, Inc., March 16, 1990.
[30] Jens R. Rostrup-Nielsen (Haldor Topsoe A/S), "Catalysis and Large-Scale Conversion of Natural Gas", presented at 4th European Workshop on Methane Activation, Eindhoven, May 18, 1994 to be published in an issue of Catalysis Today.
[31] Joseph M. Fox and David J. Slocum (Bechtel), "The Methanol Fuel Option - Cost and Implementation", presented to 1989 World Methanol Conference, Houston, Texas, December 5-7, 1989.
[32] Emil Supp (Lurgi GmbH), "Improved Methanol Production and Conversion Technologies", Energy Progress'(Vol. 5, No. 3), September, 1985, p. 127.
[33] G. L. Farina (Foster Wheeler) and Emil Supp (Lurgi), "Produce Syngas for Methanol", Hydrocarbon Processing, March 1992, p. 77.
[34] N. J. Macnaughton, A. Pinto and P. L. Rogerson (ICI), "Development of Methanol Technology for Future Fuel and Chemical Markets", Energy Progress (Vol. 4, No. 4), December 1984, p. 232.
[3 5] "ICI's Gas Heated Reformer Will Lower Methanol Production Costs", Synthetic Fuels Report, September 1990, p. 1-18.
[36] J. Ladebeck (Sud-Chemie AG), "Improve Methanol Synthesis", Hydrocarbon Processing, March 1993, p. 89.
[37] "Assessment of Costs and Benefits of Flexible and Alternative Fuel Use in the U.S. Transportation Sector - Technical Report Three: Methanol Production and Transportation Costs" (U.S. Department of Energy), November 1989, DOE/PE-0093.
[38] Anne K. Rhodes, "New Integrated Methanol/NH3 Plant Starts Up in Western Oklahoma", Oil & Gas Journal, August 8,1994, p. 65.
[39] PACE Petrochemical Service, November/December 1993, p. 57.
[40] Methanol Sections of Petrochemical Handbook 1993, Hydrocarbon Processing, pp. 190 and 193.
R-3
- 1 4 3 -

[41] J. Haggin, "Fischer-Tropsch: New Life for Old Technology", Chemical and Engineering News, October 26,1981, p. 22.
[42] Joseph M. Fox, Tan-Ping Chen and Bruce D. Degen (Bechtel), "Direct Methane Conversion Process Evaluations - Final Report, issued in October, 1988", July, 1988, prepared for the U.S. Department of Energy under Contract No. DE-AC22-87PC9814.
[43] RD. Srivastava (Burns and Roe) and V. U. S. Rao, G. Cinquegrane and G. J. Stiegel (PETC), "Catalysts for Fischer-Tropsch", Hydrocarbon Processing, February 1990, p. 59.
[44] M. E. Dry, "The Sasol Route to Fuels", Chemtech, December 1982, p. 744.
[45] "The Cost of Liquid Fuels From Coal Part II: Fischer-Tropsch Liquids", a report by JJEA Coal Research, November 1984, JJEA/EAS/E3/2.
[46] Mary L. Riekena, Anthony G. Vickers, Edward C. Haun and Robert C. Koltz (UOP), Chemical Engineering Progress, April 1982, p. 86. The complete study on this reference is based is UOP Inc. "Comparison of Fischer-Tropsch Reactor Systems - Phase I", Final Report, DOE Contract DEA CO1-78ET/0/59 (1981).
[47] J. M. Fox, B. D. Degen, Graver Cady, F. D. Deslate and R. L. Summers, (Bechtel), "Final Report - Slurry Reactor Design Studies", DOE Project No. DE-AC22-89PC89867, June 1990.
[48] Maarten van der Burgt, Jaap van Klinker and Tjong Sie, "The Shell Middle Distillate Synthesis Process", Petroleum Review, The Institute of Petroleum, April 1990, p. 204.
[49] Alan H. Singleton (Energy International), "Technology Development for Cobalt Fischer-Tropsch Catalyst", proceedings of the Coal Liquefaction and Gas Conversion Contractors' Review Conference, Vol. II, U.S. Department of Energy, PETC, September 27-29,1993, p. 877.
[50] A. H. Singleton (Energy International Corp) R. Oukaci, J. G. Goodwin and G. Marcelin (University of Pittsburgh), "Technology Development for Cobalt F-T Catalysts", Proceedings of the Coal Liquefaction and Gas Conversion Contractors' Review Conference, U.S. Department of Energy, PETC, September 7-8,1994, Pittsburgh, PA, pp. 427-433.
[51] Fred L. Tungate et al (University of Kentucky), "Technology Development for Iron Fischer-Tropsch Catalysts", Proceedings of the Coal Liquefaction and Gas Conversion Contractors' Review Conference, Vol. IL U.S. Department of Energy, PETC, September 27-29,1993, p. 879.
[52] B. H. Davis (University of Kentucky), "Technology Development for Iron Fischer-Tropsch Catalysts", Proceedings of the Coal Liquefaction and Gas Conversion Contractors' Review Conference, U.S. Department of Energy, PETC, September 7-8,1994, Pittsburgh, PA., pp. 373-387.
R-4 - 1 4 4 -

[53] R R. Frame and H. B. Gala (UOP), "Fischer-Tropsch Iron Catalyst Development", Proceedings of the Coal Liquefaction and Gas Conversion Contractors' Review Conference, Vol. IL U.S. Department of Energy, PETC, September 27-29,1993, p. 911.
[54] D. B. Bukur, X. Lang, M. Koranne and L. Nowicki (Texas A&M), "Pretreatment Effect on Process Evaluation Studies of Precipitated Iron Fischer-Tropsch Catalysts, "Proceedings of the Coal Liquefaction and Gas Conversion Contractors' Review Conference, Vol. H, U.S. Department of Energy, PETC, September 27-29,1993, p. 943.
[55] Gerald N. Choi and Samuel S. Tarn (Bechtel Corp. R&D), Joseph M. Fox (Consultant), Sheldon Kramer (Amoco) and John J. Marano (Burns and Roc Service Corp.), "Process Designs/Simulation Models for Advanced Fischer-Tropsch Technology", Proceedings of the Coal Liquefaction and Gas Conversion Contractors' Review Conference, U.S. Department of Energy, PETC, September 7-8, 1994, Pittsburgh, PA., pp. 463-477.
[56] D. Mahajan, E. Zuckerman and A. Kobayashi (Brookhaven National Laboratory), "Particle Size Dependence in Fischer-Tropsch Synthesis", Proceedings of the Coal Liquefaction and Gas Conversion Contractors' Review Conference, September 7-8, 1994, U.S. Department of Energy, PETC, Pittsburgh, PA., pp. 479-494.
[57] David Gray and Glen Tomlinson (the MITRE Corporation) "Comparison of Coal and Natural Gas Feedstocks in Indirect Liquefaction", Proceedings of the Coal Liquefaction and Gas Conversion Contractors' Review Conference, September 7-8, 1994, U.S. Department of Energy, PETC, Pittsburgh, PA., pp. 495-505.
[58] Robert J. Gormley, Michael F. Zavochak (U.S. DOE/PETC), Paul W. Deffenbaugh (Gilbert/Commonwealth, Inc.) and K.R.P.M. Rao (University of Kentucky), "Testing Low-Alpha Fischer-Tropsch Catalysts", Proceedings of the Coal Liquefaction and Gas Conversion Contractors' Review Conference, September 7-8, 1994, U.S. Department of Energy, PETC, Pittsburgh, PA., pp. 389-407.
[59] K.R.P.M. Rao, F.E. Huggins, G. P. Huffinan, B.H. Davis and RJ. O'Brien (University of Kentucky), RJ. Gormley (U.S. DOE) and R.J. O'Brien (Texas A&M University), "Mossbauer Spectroscopy Study of Iron-Based Catalysts Used in Fischer-Tropsch Synthesis", Proceedings of the Coal Liquefaction and Gas Conversion Contractors' Review Conference, U.S. Department of Energy, PETC, September 7-8,1994, Pittsburgh, PA., pp. 409-425.
[60] Gerald N. Choi and Samuel S. Tarn (Bechtel), Joseph Fox HI (consultant), Sheldon J. Kramer (Amoco) and John J. Marano (Burns and Roe), "Baseline Design/Economics for Advanced Fischer-Tropsch Technology", Proceedings of the Coal Liquefaction and Gas Conversion Contractors' Review Conference, Vol. JJ, U.S. Department of Energy, PETC, September 27-29,1993, p. 1055.
R-5

[61] P. P. Shah and H. E. Fullerton (UOP), "Economics of Upgrading Fischer-Tropsch Products", Proceedings of the Indirect Liquefaction Contractors' Review Meeting, compiled by G. J. Stiegel (PETC) and R D. Srivastava (Burns and Roe), November 6-8,1990, p. 383.
[62] C. A. Jones, JJ. Leonard and J.A. Sofranko (ARCO), "The Oxidative Conversion of Methane to Higher Hydrocarbons Over Alkali-Promoted Mn/Si02", Journal of Catalysis, Vol. 103, p. 311-319 (1987).
[63] C. E. Taylor and R P. Noceti, "Conversion of Methane to Gasoline-Range Hydrocarbons", American Chemical Society Division of Fuel Chemistry Preprints, 32 (3), pp. 307-314 (1989).
[64] M. Showalter, K. Erkkila and J. A. Shelnutt (Sandia National Laboratories), "Light Hydrocarbon Gas Conversion Using Halogenated Iron Dodecaphenylporphyrin Catalysts," Proceedings of the Coal Liquefaction and Gas Conversion Contractors' Review Conference, Vol. L, U.S. Department of Energy, PETC, September 27-29,1993, p. 249.
[65] Margaret A Showalter and John A. Shelnutt (Sandia National Laboratories), "Light Hydrocarbon Gas Conversion Using Halogenated Porphyrin Catalysts", Proceedings of the Coal Liquefaction and Gas Conversion Contractors' Review Conference, U.S. Department of Energy, PETC, September 7-8,1994, Pittsburgh, PA, pp. 667-675.
[66] Robert L. McCormick, Mahesh C. Jha and Robert D. Streuber (Amax R&D), "Development of Vanadium-Phosphate Catalysts for Methane Partial Oxidation", Proceedings of the Coal Liquefaction and Gas Conversion Contractors' Review Conference, Vol. L U.S. Department of Energy, PETC, September 27-29,1993, p. 277.
[67] V Balachandran, S. L. Morissette, J. T. Dusek, R. L. Meville and R. B. Poeppel (Argonne National Laboratory) and M. S. Kleefisch, S. Pei, T. P. Kobylinski and C.A. Udovich (Amoco Research Center), "Development of Ceramic Membranes for Partial Oxygenation of Hydrocarbon Fuels to High-Value-Added Products", Proceedings of the Coal Liquefaction and Gas Conversion Contractors' Review Conference, Vol. I, U.S. Department of Energy, PETC, September 27-29, 1993, p. 137.
[68] Y. H Ma, W. R. Moser, A. G. Dixon, A. M. Ramachandra, A. Boye and Y. Lu (Worcester Polytechnic Institute), "Oxidative Couplings of Methane Using Inorganic Membrane Reactor", Proceedings of the Coal Liquefaction and Gas Conversion Contractors' Review Conference, Vol. I, US. Department of Energy, PETC, September 27-29,1993, p. 161.
[69] Y H. Ma, W. R. Moser, A. G. Dixon, A. M. Ramachandra, Y. Lu, C. Binkerd and C. Y. Tsai (Worcester Polytechnic Institute), "Oxidative Coupling of Methane Using Inorganic Membrane Reactors", Proceedings of the Coal Liquefaction and Gas Conversion Contractors' Review Conference, US. Department of Energy, PETC, September 7-8,1994, pp. 687-707.
R-6 - 1 4 6 -

[70] A. S. Hirschon, R. Malhotra, R. B. Wilson and H-J Wu (SRI International), "Fullerene-Based Catalysts for Methane Activation", Proceedings of the Coal Liquefaction and Gas Conversion Contractors' Review Conference, Vol. L U.S. Department of Energy, PETC, September 27-29, 1993, p. 265.
[71] H. J. Wu, A S. Hirschon, & Malhotra and R. B. Wilson (SRI International), "Investigation of Fullerene-Based Catalysts for Methane Activation", Proceedings of the Coal Liquefaction and Gas Conversion Contractors' Review Conference, U.S. Department of Energy, PETC, September 7-8, 1994, pp. 709-720.
[72] John L. Falconer and Richard D. Noble (University of Colorado at Boulder), "Direct Conversion of Methane to Methanol in a Non-Isothermal Catalytic Membrane Reactor", Proceedings of the Fuels Technology Contractors Review Meeting, November 1993, DOE/METC-94/1002, p. 103.
[73] James E. Lyons (Sun Company), "Catalytic Conversion of Light Alkanes - Research and Proof-of-Concept Stages", Proceedings of the Fuels Technology Contractors Review Meeting, November 1993, DOE/METC-94/1002, p. 108.
[74] Kamil Klier and Richard G. Herman, "Selective Methane Deoxidation Over Promoted Oxide Catalysts", Proceedings of the Fuels Technology Contractors Review Meeting, November 1993, DOE/METC-94/1002, p. 121.
[75] B. M. Naasz, C. G. Knutson, R. J. Jarvis and S. P. Ferguson (Dow Corning Corp.), "Development of a Process Demonstration Unit for the Oxyhydrochlorination of Methane", Proceedings of the Coal Liquefaction and Gas Conversion Contractors' Review Conference, U.S. Department of Energy, PETC, September 7-8,1994, pp. 735-746.
[76] Erek J. Erekson and Frank Q. Miao (Institute of Gas Technology), "Gasoline from Natural Gas by Sulfur Processing", Proceedings of the Coal Liquefaction and Gas Conversion Contractors' Review Conference, U.S. Department of Energy, PETC, September 7-8,1994, pp. 747-759.
[77] Heinz Heinemann, Enrique Iglesia and Dale L. Perry (Lawrence Berkeley Laboratory), "Steady-State and Transient Catalytic Oxidation and Coupling of Methane", Proceedings of the Fuels Technology Contractors Review Meeting, November 1993, DOE/METC-94/1002, p. 138.
[78] Mark L. Kesler and Barbara Ex (Arthur D. Little), "The Role of Natural Gas in the Chemical Process Industry: Implications For the Future - Volume I", prepared for Gas Research Institute, December 1990, NTIS Number PB91-182527, GRI-90/0261.1, p. 174.
[79] N. D. Parkyns, C. I. Warburton and J. D. Wilson (British Gas pic, R&T Division), "Natural Gas Conversion to Liquid Fuels and Chemicals: Where does it stand?", Catalysis Today, 18 (1993), pp. 385-442.
R-7 - 1 4 7 -

[80] Telephone conversation between J. Lyons (Sun) and R. W. Koch (K&M), July 7,1994.
[81] Abdel H. El Sawy (MITRE Corp.), "Evaluation of Mixed Alcohol Production Processes and Catalysts", prepared by Sandia National Laboratories for the U.S. Department of Energy under contract DE-AC04-76DP00789, SAND89-7151, April 1990.
[82] Ph. Courty, J. P. Arlie, A. Convers, P. Mikitenko and A. Sugier (Institute Francais du Petrole), "C1-C6 Alcohols from Syngas", Hydrocarbon Processing, November 1984.
[83] George W. Roberts, Prasad V. Shertukde, M. Shawn McCutchen, Christopher M. Peeler and M. Henry Lamb (North Carolina State University), "Progress on Developing Technology for Producing Higher Alcohols from Synthesis Gas", Proceedings of the Coal Liquefaction and Gas Conversion Contractors' Review Conference, Vol. U, U.S. Department of Energy, PETC, September 27-29,1993, p. 765.
[84] Steve T. Bakas, Joseph H. Gregor and Paul R. Cottrell (UOP), "Integration of Technologies for the Conversion of Butanes into MTBE", presented at the 1991 NPRA Annual Meeting, March 17-19,1991, San Antonio, Texas, AM91-49.
[85] T. A. Ring, K. E. Bowers and L. J. McGovern (Bechtel), "MTBE Could Compete With Alkylate For Isobutylene", Oil & Gas Journal, April 30,1984, p. 47.
[86] ABB Lummus Crest, "MTBE from Field Butanes". Cover letter from Stanley Gussow of ABB Lummus Crest to John Hackworth, June 30,1994.
[87] Richard Chavez (Lyondell), Robert Olsen (Rohm and Haas) and Michael Ladisch (Purdue), "Increasing MTBE Productivity Without Increasing Capital Costs", 1994 World Conference on Refinery Processing and Reformulated Gasolines.
[88] Giancarlo Pecci and Telemaco Floris (Snamprogetti), "Ether Ups Antiknock of Gasoline", Hydrocarbon Processing, December 1977, p. 98.
[89] Richard M. Gialella (TFP Enterprises), Larry Mank, Jean-Pierre Burzynski, Didier Duee and Christine Travers, "ISO-4 and ISO-5: Skeletal Isomerization for Increased MTBE and TAME", presented at the 1993 NPRA Annual Meeting, March 21-23,1993, San Antonio, Texas, AM93-15.
[90] J. L. Monfils, S. Barendregt, S. K. Kapur and H. M. Woerde (Kinetics Technology International), "Upgrade Isobutane to Isobutylene", Hydrocarbon Processing, February, 1992, p. 47.
[91] O. C. Abraham and G. F. Prescott (Texaco R&D), "Make Isobutylene from TBA", Hydrocarbon Processing, February 1992, p. 51.
[92] P. R. Sarathy and G. S. Suffiidge (John Brown), "Etherify Field Butanes - Part 1", Hydrocarbon Processing, January 1993, p. 89.
R-8 - 1 4 8 -

[93] P. R Sarathy and G. S. Suffridge (John Brown), "Etherify Field Butanes - Part 2", Hydrocarbon Processing, February 1993, p. 43.
[94] Kamil Klier, Richard G. Herman, Owen C. Feeley, Marie A. Johansson and Jamie Menszak (Lehigh University), "High Octane Ethers from Synthesis Gas-derived Alcohols", Proceedings of the Coal Liquefaction and Gas Conversion Contractors Review Conference - Volume JJ, U.S. Department of Energy, PETC, September 27-29,1993, p. 739, Contract No. DE-A622-90PC90044.
[95] Kamil Klier, Richard G. Herman, Qun Sun, Luca Lietti, Marie A. Johansson and Owen C. Feeley (Lehigh University), "Oxygenates via Synthesis Gas", Proceedings of the Coal Liquefaction and Gas Conversion Contractors' Review Conference, U.S. Department of Energy, PETC, September 7-8, 1994, pp. 323-337.
[96] Dennis M. Brown (Air Products and Chemicals, Inc.), "Development of Alternative Fuels and Chemicals from Synthesis Gas", Proceedings of the Coal Liquefaction and Gas Conversion Contractors' Review Conference, U.S. Department of Energy, PETC, September 27-29, 1993, pp. 789-813.
[97] Edward C. Heydorn, Elizabeth S. Schaub, Van Eric E. Stein, Richard P. Underwood and Francis J. Walter (Air Products and Chemicals, Inc.), "Recent Progress on Syngas Conversion to Isobutand", Proceedings of the Coal Liquefaction and Gas Conversion Contractors' Review Conference, U.S. Department of Energy, PETC, September 7-8,1994, pp. 747-759.
[98] "Alcohols and Ethers - A Technical Assessment of Their Application as Fuels and Fuel Components", API Publication 4261, Second Edition, July 1988.
[99] J. D. Chase and B. B. Galvez (Gulf Canada Ltd.), "Maximize Blend Ethers with MTBE and TAME", Hydrocarbon Processing, March 1981, pp. 89-94.
[100] David J. Miller and Wilham J. Piel (ARCO Chemical Company), "Ether Options: MTBE/TAME & ETBE" presented at the 1989 NPRA Annual Meeting, March 19-21, 1989, San Francisco, CA, AM-89-58.
[101] Theo Fleisch, Chris McCarthy, Arun Basu & Carl Udovich (Amoco Corp.), Pat Charbonneau & Warren Slodowske (Navistar International Transportation Corp.), Svend-Erik Mikkelsen (Haldor Topsoe A/S) and Tim McCandless (AVL Powertrain Engineering, Inc.," A New Clean Diesel Technology: Demonstration of ULEV Emissions or a Navistar Diesel Engine Fueled with Dimethyl Ether", Society of Automotive Engineers (SAE), Paper Number 950061 (Warrendale, PA 1995).
[102] Paul Kapus and Herwig Ofrier (AVL LIST GmbH - Austria), "Development of Fuel Injection Equipment and Combustion System for DI Diesels Operated on Dimethyl Ether", Society of Automotive Engineers (SAE), Paper Number 950062, (Warrendale, PA, 1995).
R-9 - 1 4 9 -

[103] S. C. Sorenson (Technical University of Denmark) and Svend-Erik Mikkelsen (Haldor Topsoe A/S), "Performance and Emissions of a 0.273 Liter Direct Injection or Diesel Engine Fuelled with Neat Dimethyl Ether", Society of Automotive Engineers (SAE), Paper Number 950064 (Warrendale, PA 1995).
[104] J. B. Hanser, B. Voss, F. Joensen, I. D. Sigurdardottir (Haldor Topsoe A/S), "Large Scale Manufacture of Dimethyl Ether - A New Alternative Diesel Fuel from Natural Gas", Society of Automotive Engineers (SAE), Paper Number 950063 (Warrendale, PA 1995).
[105] E. J. Chang and S. M. Leiby (SRI International), "Ethers Help Gasoline Quality", Hydrocarbon Processing, February 1992, p. 41.
[106] MTBE/TAME/ETBE Processes in Petrochemical Handbook '93, Hydrocarbon Processing, March 1993, p. 193.
[107] 1994 United States Fuel Reformulation Map published by HPIHART/IRI Fuels Information Services in association with ARCO Chemical.
[108] "Petroleum Supply Annual 1993 - Volume 1", June 1994, Energy Information Administration, U.S. Department of Energy, DOE/EIA-0340(93)/1, p. 128.
[109] "First Interim Report of the Interagency Commission on Alternative Motor Fuels", September 30, 1990. This commission was established by the Alternative Motor Fuels Act of 1988 (P.L. 100-494).
[110] "Public Transportation Alternative Fuels, a Perspective for Small Transportation Operations for Use by Operators of Motor Bus and Demand Responsive Fleets", June 30, 1992, work done by Booz-Allen & Hamilton Inc. for California Department of Transportation, Division of Mass Transportation.
[ I l l ] Charlotte J. Pera and CarlB. Moyer (AcurexEnvironmental Corp.), "Topical Report - LNG as a Fuel for Railroads: Assessment of Technology Status and Economics", January 1993, GRI -93/0132.
[112] Gas Process Handbook - LNG, Hydrocarbon Processing, April 1992, Pages 115 and 116.
[113] "Assessment of Costs and Benefits of Flexible and Alternative Fuel Use in the U.S. Transportation Sector — Technical Report Six: Costs of Producing Methanol from Unutilized Natural Gas", July 1991, DOE/PE-0098P.
[114] T.A Czuppon and L.J. Buividas (Pullman Kellogg), "Which Feedstock for Ammonia?", Hydrocarbon Processing, September 1979, pp. 197-200.
R-10

[115] D A Waitzman and D.E. Nichols (Tennessee Valley Authority) and G.W. Alves and J.M. Hyland (Brown and Root Development, Inc.), "Ammonia From Coal", Coal Technology, 1979, Astrohall, Houston, Texas, Vol. 4, Table 2, Case 3, November 6-8,1979.
[116] "Ammonia Process Boasts Higher Efficiency" Oil & Gas Journal, May 4, 1981, pp. 270-280.
[117] J.R. LeBlanc (M. W. Kellogg Co.), "Make Ammonia with Less Energy", Hydrocarbon Processing, July 1984, pp. 69-72.
[118] Petrochemical Handbook 1993 - Ammonia, Hydrocarbon Processing, March 1993, pp. 162 and 164.
[119] "A Comparison of Steam-Injected Gas Turbine and Combined-Cycle Power Plants: Technology Assessments", June 1989, EPRI GS-6415, prepared by Jersey Central Power & Light Company and Sargent & Lundy.
[120] Telephone Conversation between Peter Roberts of Solar Turbines and Robert W. Koch of K&M Engineering and Consulting of October 25,1994.
[121] "Virginia Power's Study of a Shell-Based GCC Power Plant", September 1989, EPRI GS-6493, prepared by Virginia Electric and Power Company.
[122] James J.L. Ma (SRI International), "Comparison of the Mehra Process for Nitrogen Rejection to a Cryogenic Process for Nitrogen Rejection from Subquality Natural Gas - Topical Report", March 1991, GRI90/0290.
[123] Linda W. Echterhoff and Vijay K. Pathak (M.W. Kellogg Company), "Evaluation of Process Costs for Small Scale Nitrogen Removal from Natural Gas", August 1991, GRI - 91/0092, NTIS No. PB91-243121.
[124] Jorge Gamez (GRI), "Gas Processing Bulletin - Carbon Molecular Sieves for Nitrogen Removal from Natural Gas", September 1991, Gas Research Institute.
[125] J.C.W. Kuo and A.B. Ketkar, U.S. Department of Energy Report, DOE/PC/90009-3, August 1987.
[126] J.L. Matherne and G. Culp, AIChE Annual Meeting, Chicago (1990), Paper 59f and J.L. Matherne and G. Culp (Union Carbide Chemicals and Plastics Co. Inc.), "Direct Conversion of Methane to C2S and Liquid Fuels — Process Economics", presented at the Indirect Liquefaction Contractors' Review Meeting, Pittsburgh, PA., November 13-15, 1989, Pages 253-280 of the Proceedings, Work Done under Contract No. DE-AC22-87DE79817.
R-l l - 1 5 1 -

[127] A.K.K. Lee and AM. Aitani, (King Fahd University of Petroleum and Minerals), "Methane Conversion Technology and Economics", Fuel Science and Technology, International, 9(2), 1991, pp. 137-158.
[128] J.W. M.H. Geerts, J.M.N. van Kasteren and K. van der Wiele, Commission of the European Communities Report, No. EUR 13061 (1990).
[129] V.A. Menshchikov, P.S. Chekry and O.B. Shamrai, Catalysis Today, 13 (1992), p. 571.
[130] G. Renesme, J. Saint-Just and Y. Muller, Catalysis Today, 13 (1992), p. 371.
[131] Mark L. Kesler and Barbara Ex (Arthur D. Little), "The Role of Natural Gas in the Chemical Process Industry: Implications for the Future — Final Report for January 1989 - June 1990, Volume I", prepared for Gas Research Institute, December 1990, GRI - 90/0261.1, NTTS No. PB 91-182527, pp. 206-212.
[132] "Oxidative Coupling Methane", Chemical Engineering Progress, November 1994, p. 19.
[133] Taylor, C. E., and Noceti, R P., "Conversion of Methane to Gasoline-Range Hydrocarbons", American Chemical Society Division of Fuel Chemistry Preprints, 32 (3), pp. 307-314 (1987).
[134] B. M. Naasz, J. S. Smith, G. G. Knutson, R. F. Jarvis and S. P. Ferguson (DOW Coming Corporation), "Methyl Chloride via Oxyhydrochlorination of Methane", Proceedings of Coal Liquefaction and Gas Conversion Contractors' Review Conference, Vol. L U.S. Department of Energy, PETC, September 27-29,1993, Pittsburgh, PA, pp. 193-214.
[135] B. M. Naasz, C. G. Knutson, R. F. Jarvis and S. P. Ferguson (DOW Corning Corporation), "Development of a Process Demonstration Unit for the Oxyhydrochlorination of Methane", Proceedings of the Coal Liquefaction and Gas Conversion Contractors' Review Conference, U.S. Department of Energy, PETC, September 7-8,1994, Pittsburgh, PA, pp. 735-746.
[136] U. Balachandran, S. L. Morissette, J. T. Dusek, R. L. Mieville and R. B. Poeppel (Argonne National Laboratory) and M. S. Kleefisch, S. Pei, T. P. Kobylinski and C. A. Udovich (Amoco Research Center), "Development of Ceramic Membranes for Partial Oxygenation of Hydrocarbon Fuels to High-Value-Added Products", Proceedings of the Coal Liquefaction and Gas Conversion Contractors' Review Conference, Vol. L September 27-29,1993, Pittsburgh, PA, pp. 138-160.
[137] U. Balachandran, J. T. Dusek, R. L. Mieville and P. S. Matya (Argonne National Laboratory) and M. S. Kleefisch, S. Pei, T. P. Kobylinski and C. A Udovich (Amoco Research Center), Proceedings of the Coal Liquefaction and Gas Conversion Contractors' Review Conference, S U.S. Department of Energy, PETC, September 7-8,1994, Pittsburgh, PA pp. 677-686.
[138] Y. H. Ma, W. R Moser, A G. Dixon, A. M. Ramachandra, A. Boye and Y. Lu (Worcester Polytechnic Institute), "Oxidative Coupling of Methane Using Inorganic Membrane Reactor",
R-12
- 1 5 2 -

Proceedings of the Coal Liquefaction and Gas Conversion Contractors' Review Conference, Vol. L U.S. Department of Energy, PETC, September 27-29,1993, Pittsburgh, PA, pp. 161-191.
[139] Y. H. Ma, W. R Moser, A G. Dixon, A M. Ramachandra, Y. Lu, C. Binkerd and C. Y. Tsai (Worcester Polytechnic Institute), "Oxidative Coupling of Methane Using Inorganic Membrane Reactors", Proceedings of the Coal Liquefaction and Gas Conversion Contractors' Review Conference, Vol. I, U.S. Department of Energy, PETC, September 7-8,1994, Pittsburgh, PA, pp. 687-707.
[140] American Petroleum Institute, "Basic Petroleum Data Book - Petroleum Industry Statistics", Vol. XIV, Number 2, May 1994.
[141] Edward W. Merrow, Kenneth E. Phillips and Christopher W. Myers (The Rand Corporation), "Understanding Cost Growth and Performance Shortfalls in Pioneer Process Plants", prepared for the U.S. Department of Energy, September 1981, R-2569-DOE, Contract No. DE-ACO1-79PE70078.
[142] R W. Hess (The Rand Corporation), "Potential Production Cost Benefit of Constructing and Operating First-of-a-Kind Synthetic Fuel Plants", prepared for the U.S. Synthetic Fuels Corporation, March 1985, N-2274-SFC.
[143] R W. Hess (The Rand Corporation), "Review of Cost Improvement Literature with Emphasis on Synthetic Fuel Facilities and the Petroleum and Chemical Process Industries", prepared for the U.S. Synthetic Fuels Corporation, March 1985, N-2273-SFC.
[144] Technology Evaluation Section (Electric Power Research Institute), "TAG Technical Assessment Guide, Vol. 1: Electricity Supply, 1986", December 1986, p. 4463-SR, Vol. 1.
R-13

Appendix A
Methodology for Calculating the Required Price of Gas-Derived Products
A procedure has been developed to calculate the price of products produced from natural gas which is required to make investment in process facilities viable for the facility investor. The calculation procedure has been adapted from a GRI economic analysis calculation procedure, and much of the nomenclature has been retained in order that the procedure described here can be related to the GRI report.
The required price of gas-derived products is determined by summing the annual equivalents of the present worths of the following items, expressed in terms of a unit of product:
a. Cost of Process Facility, including Return (CPF) b. Operating and Maintenance Cost (OMC) c. Feedstock Cost (FC) d. Cost of Working Capital (CWC)
The sum of these items is set equal to the annualized present worth of the revenue from the sale of a unit of product, as shown in the following equation:
CPF + OMC + FC + CWC = RPS (Revenue from Product Sales)
The revenue from sales is a function of the price of a specific gas-derived product and the price of the gas-derived product is assumed to grow over time. In the calculation routine, the gas-derived price is projected to grow at a constant rate and the estimate of price growth is entered as a percent of the inflation rate.
An example of the calculation procedure is presented for the methanol production case and is shown in Exhibit A-l. On the third page of the example, calculations are detailed for handling price growth and determining the impact on the required selling price of methanol products in the initial year. Price growth is input as PPGWR; in the example, it is 192% of the rate of inflation. The annual growth rate of product prices (ESP) is the inflation rate (INF) times the product price growth (PPGWR) divided by 100. The price in each year is diagrammed in the following figure:
PWPE-- The sum of the present worths of product prices discounted to the initial year
ti Pi (1+ESP)
Pi (1 +ESP)2
Pi(l+ESP) n
A-l -154-

For price increasing at a constant growth rate, a term TVPE replaces the discount rate in the usual present value formula. Thus:
PWPE = PW(YRS,TYPE) = Cl+TVPE^ - 1 TVPE*(1+TVPE)YRS
and TVPE= CDD - ESP
1+ESP
where CDD is the current dollar discount rate. Similar formulas account for growth in operating cost, feed stock cost, and cost of working capital over time.
All of the costs and revenues are brought to their present worths in the initial year and then the annual equivalent of each cost is calculated by multiplying it by an annualization factor, ANBL. In the example, the annualizing factor is expressed in constant dollar terms. This was done because the set of calculations in the GRI reference document was done in constant dollars and because many of the forecasts of crude oil and gas price growth are given in constant dollar terms. The answer for the price of gas-derived products in the initial year will be the same regardless of
whether you work in constant or current dollars. The ANBL terms appear in all the individual elements. It is important to note that working in constant dollars does yield a value of CCR, the capital charge factor, that is lower than expected by those who are attuned to analyzing in a current dollar framework.
Data input to run the calculation program appears on pages 1 and 3 of the example output. On Page 1 of Exhibit A-l, results of the cost estimating work is input in the upper box. The calculation of total plant cost and variable operating and maintenance cost follows the procedure outlined in the EPRI "TAG". The percent cost factors on Pages 1 and 2 of Exhibit A-l can be changed at the users discretion. The result of the calculations on page 1 is the total plant investment (TPI) for the gas upgrading plant. On Page 2, the variable operating and maintenance cost (VOM), the feedstock cost (FC), and the working capital cost (WC) for the initial year of operation are calculated.
On Page 3 of the sample calculation, the economic analysis of the project is performed to calculate the price of gas that is required to provide the return on investment commensurate with the inputs on discount rate, life, and financing assumptions. Definitions for the variables in the formulas in the example calculation are given in Exhibit A-2. METC has been provided with a copy of the calculation routine used to produce the example calculation. This routine is a spreadsheet file that will work with either Lotus 1-2-3 (file extension .WK1) or Quattro Pro (file extension .WQ1).
A-2 - 1 5 5 -

Exhibit A-1 LIQUID PHASE METHANOL
CASE: MeOH COST BASIS: DEC.1993
Feed Stream: Natural Gas
Page 1 - Calculate Total Plant Investment Cost
INPUTS FROM COST ESTIMATION Design Cap(MMgal/yr MeOH) Service Factor Process Field Cost(MMS) Operators/Shift Cat & Chemicals(M$/Yr) Makeup Water(MGal/min) Feed Gas($/MMBTU) Feed Gas(MMBTU/Hr)
DC 607 SF 0.9132
PFC 210.5 OPS 35 CAC 7.2
MUW 0 FGS 2.43
FG 6258
TOTAL PLANT COST
PROCESS Field Cost Direct and Indirect Sales Tax %
Basic Facility Construction Investment Project Contingency % of BFCI
Home Office %ofBFCI+PC Engineering % of BFCI+PC
Total Process Facilities Construction Invstment
COST FACTOR%
COST,MM$
PFC 210.5 0 0.0
BFCI 210.5 15 PC 31.6
242.1 6 14.5 6 14.5
TPFCI 271.1
OFFSITES/UTILITIES: DIRECT AND INDIRECT Field Cost, Direct and Indirect Util & Gen Facilities % of Process BFCI Project Contingency % of Offsites
BFCI Offsites + Proj. Contingency Home Office % of Offsites BFCI+PC Engineering % of Offsites BFCI+PC
Total Offsites/Utilities Construction Investment
Total Facilities Constrctn InvstfTPFCI+TOFCI)
TOTAL PLANT INVESTMENT(TPI) Total Facilities Constrctn Invst Initial Fills % of TFCI Startup % of Ann Opr Cost(AOC) Prepaid Royalties % of TFCI
4.9 94.5 15 14.2
108.7 6 6.5 6 6.5
TOFCI 121.7
TFCI 392.9
392.9 0.8 3.1 20 33.9
0.5 2.0 -156-
Total Plant Investment TPI 431.9

Exhibit A-1 (Continued) LIQUID PHASE METHANOL
CASE: MeOH
Feed Stream: Natural Gas
ST BASIS: DEC.1993 DATA INPUTS COSTS Estimate % Fact. MM$/YR
TOTAL MAINTENANCE COST Facilities: % of TFCI 4.1 TMC 16.1
Page 2 - Calculate Operating & Maintenance Cost
VARIABLE OPR & MAIN COST(MM$/YR) DIRECT LABOR COST Operators Per Shift Annual Dir Lab @ $/Hr Maintenance Lab(% TMC)
Total Direct Labor
35 18.08
40
TDL
5.1 6.4
11.5
Labor Overheads Supervision % of TDL Benefits % of TDL Gen & Clerical % of TDL Corporate OH % of TDL Supplies % of TDL
25 25 45 30
5
2.9 2.9 5.2 3.5 0.6
Total Labor Overheads 15.0
Catalyst & Chemicals MM$ 7.2 Utilities Imported Power, Gas, Steam 0 -13.0 Makeup Water MGal/Min(MUW) 0 Water Cost $/MGal 0.0125 0.0
Maintenance Materials % of TMC 60 9.7 Local Taxes & Ins % of TFCI 1.5 5.9
Total Other O&M 9.8
Var Opr & Main(DL+Lab OH+Oth O&M) VOM 36.2
Feed Nat Gas ($/MMBTU) Feed Nat Gas MMBTU/Hr
Ann Opr Cost YR 1 (VOM+FC)
2.43 6258 FC
AOC
133.2
169.4
Working Cap(Consm & Parts) % of TFCI Working Cap(Acct Rec)1 Mon of AOC
1.4 5.5 14.1
- 1 5 7 -
WC 19.6

KOD 0.09 INF 0.0301
FCE 0.8 FCD 0.2 ROE 0.142
ROD 0.09 YRS 20 TYR 10 FIT 0.4
CYR 3 AFDUC 0.11
ESC 0.0301
ATCOC COD 0.122809
Exhibit A-1 (Continued) LIQUID PHASE METHANOL
CASE: MeOH ^eea Stream: Natural Gas
CONSTANT S DISC KDD 0.09 UNIT REVENUES AND COSTS FOR FIRST YEAR INFLATION FRAC CAP FROM EQ FRAC CAP FROM D8T RETURN ON EQUITY RETURN ON DEBT BOOK LIFE YRS TAX LIFE TAX RATE CONSTRUCTN PERIOD ALW FUND OUR CONST ESCAL RATE CONSCT Calculate WTAVGAFTTAXCOC CURRENT S DISC
ATCOC - +ROE»FCE+(1-FIT)*(ROD*FCD)
CDD = +(1+INF)*(1+KDD)-1
PW(YRS.CDD) - ((1+CDD)~YRS-1)/(C00*(1+CDD)~YRS)
Ann(YRS.KDD) = +(KDD*(1+KDD)~YRS)/((1+KDD)~YRS-1)
ESP = +INF'(PPGWR/100)
TVPE » +(CDD-ESP)/(1 +ESP)
PW(YRS.TVPE) = ((1+TVPE)~YRS-1)/(TVPE*(1+TVPE)~YRS)
ESO « +INF»(OMGWR/100)
TVOME - +(CDD-ES0)/(1 +ESO)
PW(YRS.TVOME) = ((l+TVOMEJ^YRS-IJ/CrVOME'fl+TVOMEJ^YRS)
ESF = +INF*(FCGWR/100)
TVFCE - +(CDD-ESF)/(1 +ESF)
PW(YRS.TVFCE) = ((l+TVFCE^YRS-IJ/CTVFCE'O+TVFCEJ^YRS)
ESW » +INF*(WCGWR/100)
TVWCE - +(CDD-ESW)/(1 +ESW)
PW(YRS.TVWCE) = ((1+TWCE)'SYRS-1)/(TVWCE*(1+TVWCE)~YRS)
PW(TYR.CDD) = ((1+CDD)~TYR-1)/(CDD*(1+CDD)">TYR)
EEL3 » +2*(TYR-PWTL)/(TYR*(TYR+1)*COD)
EEL1 m +(1+AFDUC)~(CYR/3)
EEL2 - +RT*(FCE+FC0*(1+AFDUC)~(CYR/3))
EEL4 = +((PWBL/YRS)*(1-(ATCOC/CDD))+(ATCOC/CDD)*EEL3)
CCR =• +ANBL/(1-RT)*(1/(1 +ESC))" (CYR/3)*EEL1 *((PWBL/YRS)*(1-ATCOC/CDD)+ATCOC/CDD)-EEL2*EEL4)
CCR 0.151
SPI*CCR-(BPR*ANBL*PWPE)-(OMC*ANBL*PWOME)-(FDC*ANBL*PWFDE)-{UWC*ANBL'PWWCE)
LetTOPC-+[(OMC*ANBL*PWOME)+(FDC*ANBL*PWFDE)+(UWC*ANBL*PWWCE)] TOPC 0.434
SPI'CCR 0.117
BASE YR PROD REV BPR
SPC CAP COST(TPI/DC*SF) SPI 0.779 S/gal O&M COST(Base Yr) OMC 0.065 S/gal FEEDCOST(YR1) FDC 0.240 Sis* WORKING CAPITAL(YR 1) UWC 0.035 S/gto PD PRICE GW(% INF) PPGWR 192 O&M COST GW(% INF) OMGWR 100 FEED COST GW(%INF) FCGWR 236 WORK CAP GW(94 INF) WCGWR 100 Calculata ESCAL RATE PRODUCT ESP
ESCAL RATE FUEL ESF
ESCAL RATE O&M
ATCOC
CDD
PWBL
ANBL
ESP
TVPE
PWPE
ESO
TVOME
PWOME
ESF
TVFCE
PWFDE
ESW
TVWCE
PWWCE
PWTL
EEL3
EEL1
EEL2
ESO
0.124
0.123
7.340
0.110
0.058
0.061
11.335
0.030
0.090
9.129
0.071
0.048
12.540
0.030
0.090
9.129
5.586
0.654
1.110
0.409
EEL4 0.657 •
• 1 5 8 -BPRm +((SPI*CCR)+TOPC)/(ANBL*PWPE) BPR 0.444

Exhibit A-2
DEFINITION OF TERMS
AFDUC Allowance for Funds During Construction represents interest costs
Ann (t,d) Annualized value of a present worth over t years at a discount rate of d (equal to l/PW(t,d))
ATCOC Weighted average After Tax Cost of Capital, based on funding from equity and debt
BPR Base Product Revenue is the revenue from the sale of a unit of product in the first year of operation, i.e., the product price
CCR Capital Charge Rate, which related the unit capital investment to the annualized value of operating costs and revenues (in this case, the CCR is on a constant $ basis)
CDD Current Dollar Discount factor
CYR Construction period in YeaRs during which investment $'s are expended
ESO Escalation factor for Operating and maintenance cost
ESP Annual Escalation factor for Product price
FCD Fraction of investment Capital from Debt sources
FCE Fraction of investment Capital from Equity sources
FCGWR Constant annual Feed Cost GroWth Rate stated at % of inflation rate
FCD Feed Cost in initial year, treated separated from other operating cost to allow for differences in cost escalation rates
INF General rate of inflation
A-6

Exhibit A-2 (Continued)
DEFINITION OF TERMS
KDD Konstant Dollar Discount rate
PPGWR Constant annual Product Price Growth Rate stated as % of inflation rate
PW(t,d) Uniform series Present Worth factor for t years at discount rate d
SPI Specific Plant Investment is the cost of investment per unit of production capacity. It is the Total Plant Investment divided by the Design Capacity times the Stream Factor
TOPC Total Operating Cost is the sum of the annualized present worths of the operating and maintenance costs, the feed cost and the cost of working capital
T VOME Time Value of Operating and Maintenance cost Price Escalation relative to the discount factor CDD, when the O&M cost is increasing at a constant rate of growth then TVOME replaced the d discount in the PW(t,d) relationship
TYR Tax life in years over which investment is depreciated
YRS Operating life of the investment in years
A-7 - 1

Exhibit A-3. Summary of Economics for Conversion of Natural Gas to Transportation Fuels
Type of Process Natural Gas to Methanol LPMEOH
Natural Gas to Gasoline and Diesel Fischer-Tropsch
Natural Gas to Gasoline and Diesel -Fischer-Tropsch Low Feed Cost
Natural Gas to Gasoline by Oxidative Coupling
Natural Gas to CI -C6 Alcohol IFP Process
Methanol and j Butane to MTBE UOP Process I
Design Product Capacity, BPSD 39572 14500 14500 14500 15060 12500 Natural Gas Feed Rate, 10° Btu/Hr 6852 5390 5390 5412 3850 -Methanol Feed Rate, BPSD - - - - - 4250 Butane Feed Rate, BPSD - - - - - 12011 Operators per Shift 35 22 22 22 11 10
w
Process Field Cost, 106$ 271.1 437.1 437.1 570.7 392.0 108.6 Offsite/Utility Field Cost, 106$ 121.7 311.2- 311.2 289.9 196.0 32.5 Initial Owner Cost, 106$ 39.0 41.7 29.6 49.2 31.7 22.9 Total Plant Investment, 106$ 431.8 790.1 777.9 909.8 619.8 163.9
Total Direct Labor, 106$/Yr 11.5 12.1 12.1 16.6 6.3 4.1 Total Labor Overheads, 106$/Yr 15.0 15.8 15.8 21.5 8.2 5.3 Total Other O&M, 106$/Yr 9.8 28.8 28.8 48.2 31.2 20.0 Total Var Opr &Main, 106$/Yr 36.2 56.7 56.7 86.3 45.7 29.3 Feedstock Cost, 10°$/Yr 133.2 103.3 42.5 103.7 74.8 87.6 1 Ann. Operating Cost, 106$/Yr 169.4 160.0 99.2 190.0 120.5 101.3" Working Capital, 106$/Yr 19.6 23.8 18.7 27.9 18.3 10.4
Capital Charge, $/Barrel 4.91 24.53 24.15 28.25 18.26 5.87 O&M Cost (Year 1), $/Barrel 2.73 11.90 11.90 18.11 9.10 7.13 Feed Cost (Year 1), $/Barrel 10.08 21.68 8.92 21.77 14.91 21.33 Working Capital (Year 1), $/Barrel 1.47 5.00 3.93 5.85 3.64 2.54 Product Price, $/Barrel+ 18.65 57.46 43.46 71.12 50.37 36.06 I Product Price, $/Gallon^ 0.444 1.37 1.03 1.69 1.20 0.86 0 •Basis: 14.2% DCF ROE ••Includes 15.5 x 10° $/Yr Byproduct Value
mu

Exhibit A-4. Summary of Economics for Conversion of Natural Gas to Transportation Fuels
Type of Process Natural Gas to Gasoline by Oxyhydrochlorination
Production of Liquefied Natural Gas (LNG)
Production of Compressed Natural Gas (CNG)
Design Product Capacity (Stream) 14500 BPSD 168xl0 6gal/Yr. LNG 108274 xl0 6Btu/Yr. CNG Natural Gas Feed Rate, 106 Btu/Hr (Cal) 4466 1717 9.44 Operators per Shift 22 2.2 0.25
Process Field Cost, 106$ 522.5 63.1 0.246 Offsite/Utility Field Cost, 105$ 379.5 0 0 Initial Owner Cost, 106$ 54.4 13.9 0.087 .Total Plant Investment, 106$ 956.4 77.0 0.333
Total Direct Labor, 106$/Yr 21.2. 0.7 0.032 Total Labor Overheads, 106$/Yr 27.5 0.9 0.041 Total Other O&M, 106$/Yr 69.9 1.5 0.006 Total Var Opr &Main, 106$/Yr 118.6 3.2 0.079 Feedstock Cost, 106$/Yr 95.1 62.3 0.342 Ann. Operating Cost, 106$/Yr 213.6 65.4 0.421 Working Capital, 106$/Yr 30.4 6.3 0.039
Capital Charge 29.7 $/Barrel 0.072 $/gal LNG 0.61 S/MMBTU O&M Cost (Year 1) 24.9 $/Barrel 0.020 $/gal LNG 0.95 $/MMBTU Feed Cost (Year 1) 20.0 $/Barrel 0.387 $/gal LNG 4.14S/MMBTU Working Capital (Year 1) 6.4 $/Barrel 0.034 $/gal LNG 0.47 S/MMBTU Product Price* 76.5 $/Barrel 0.537 $/gal LNG 6.25 $/MMBTU
| Product Price* 1.82$/Gallon 0.85 $/geg 0.73 $/geg Natural Gas Price, $/106 Btu 2.43 4.14 4.14
j*Basis: 14.2% DCF ROE geg = gasoline equivalent gallon
A-9

Exhibit A-5. Summary of Economics Tor Conversion of Natural Gas to Chemicals
1 Type of Process Natural Gas to Methanol - High Quality Natural Giis
Natural Gas to Methanol - Low Quality Natural Gas
Natural Gas to Ammonia -1 ligh Quality Natural Gas
Natural Gas to Ammonia -Low Quality Natural Gas
Design Product Capacity (Stream) 39572 BPSD 39572 BPSD 420 MST/Yr. NH3 420 MST/Yr. NH3
Natural Gas Feed Rate, 106 Btu/Hr (cat)
6258 6566 885 885
Operators per Shift 35 35 40 40
Process Field Cost, 106$ 271.1 285.0 111.7 116.3 Offsite/Utility Field Cost, 106$ 121.7 125.7 20.2 21.1 Initial Owner Cost, 106$ 39.0 39.0 11.6 11.6 Total Plant Investment, 106$ 431.9 449.7 143.4 148.9
Total Direct Labor, 106$/Yr 11.5 11.8 6.4 6.8 Total Labor Overheads, 106$/Yr 15.0 15.3 8.3 8.8 Total Other O&M, 106$/Yr 9.8 10.5 15.7 15.8 Total VarOpr&Main, 106$/Yr 36.2 37.6 30.4 31.4 Feedstock Cost, 10°$/Yr 133.2 130.3 18.8 17.4 Ann. Operating Cost, 106$/Yr 169.4 167.9 49.2 48.8 Working Capital, 106$/Yr 19.6 19.7 6.0 6.0
Capital Charge 4.91 $/Bbl 5.12 $/Bbl 57 $/ST 59 $/ST O&M Cost (Year 1) 2.73 $/Bbl 2.86 $/Bbl 80 $/ST 83 $/ST Feed Cost (Year I) 10.08 $/Bbl 9.87 $/Bbl 50 $/ST 46 $/ST Working Capital (Year 1) 1.47$/Bbl 1.51 $/Bbl 16$/ST 16S/ST
1 Product Price* 18.65 $/Bbl MeOH 18.65 $/Bbl MeOH 240 $/ST NH3 240 $/ST NH3
Product Price* 0.444 $/gal MeOH 0.444 $/gal MeOH Natural Gas Price, $/106 Btu 2.43 2.27 2.43 •2.24 •Basis: 14.2% DCF ROE
A-10

Exhibit A-6. Summary of Economics for Conversion of Natural Gas to Power, Nitrogen Rejection and Production of Methyl Chloride
Type of Process Natural Gas to Power - High Quality Natural Gas
Natural Gas to Power - Low Quality Natural Gas
Rejection of Nitrogen from Low Quality Natural Gas
Natural Gas to Methyl Chloride by Oxyhydrochlorination
Design Product Capacity (Stream) 426 MW 426 MW 5932 x 106Btu/Yr. 8112 Tons/Day Natural Gas Feed Rate, 10* Btu/Hr (Cal) 2627 2641 663 4466 Operator per Shift 6.25 6.25 2 17
Process Field Cost, 106$ 180.1 192.7 6.811 402.4 Offsite/Utility Field Cost, 106$ 25.8 27.8 0.279 292.1 Initial Owner Cost, 106$ 16.9 17.0 2.246 46.3 Total Plant Investment, 106$ 222.9 237.4 9.336 740.8
Total Direct Labor, 106$/Yr 1.5 1.6 0.418 16.3 Total Labor Overheads, 106$/Yr 2.0 2,0 0.543 21.2 Total Other O&M, 106$/Yr 12.3 13.1 0.818 53.8 Total VarOpr&Main, 106$/Yr 15.7 16.7 1.778 91.3 Feedstock Cost, 106$/Yr 55.9 53.7 8.991 95.1 Ann. Operating Cost, 106$/Yr 71.7 70.4 10.769 186.4 Working Capital, 106$/Yr 8.9 9.0 0.997 25.3
Capital Charge 0.011 $/kWh 0.012 $/kWh 0.242 $/MMBTU 41 $/Ton O&M Cost (Year 1) 0.005 $/kWh 0.006 $/kWh 0.312 $/MMBTU 34 $/Ton Feed Cost (Year 1) 0.019 $/kWh 0.018 $/kWh 1.579 S/MMBTU 36 $/Ton Working Capital (Year 1) 0.003 $/kWh 0.003 $/kWh 0.175 $/MMBTU 9 $/Ton
1 Product Price* 0.037 $/kWh 0.037 $/kWh 2.431 S/MMBTU I16$/Ton Natural Gas Price, $/106 Btu 2.43 2.32 1.71 2.43
[•Basis;: 14.2% DCF ROE
I
A-ll

Exhibit A-7. Summary of Economics of Sensitivity to Gas Price Growth Rate and Plant Size for Fischer-Tropsch Process with Slurry Reactor
Principal Variable Base Case with Slurry Reactor % Growth Rate for Natural Gas Four Times Base Case Plant 1 Size
0.6 1.6 3.9 Design Product Capacity, BPSD 14500 14500 14500 14500 58000 Natural Gas Feed Rate, 106 Btu/Hr 5201 5201 5201 5201 20804
I Operator per Shift 22 22 22 22 47
Process Field Cost, 106$ 381.6 381.6 381.6 381.6 1367.9 Offsite/Utility Field Cost, 106$ 304.9 304.9 304.9 304.9 504.8 Initial Owner Cost, 106$ 40.1 40.1 40.1 40.1 66.6 Total Plant Investment, 106$ 726.7 726.7 726.7 726.7 1939.3
Total Direct Labor, 106$/Yr 11.4 11.4 11.4 11.4 24.5 Total Labor Overheads, 106$/Yr 14.8 14.8 14.8 14.8 31.8 Total Other O&M, 106$/Yr 30.4 30.4 30.4 30.4 86.0 Total Var Opr &Main, 106$/Yr 56.6 56.6 56.6 56.6 142.2 Feedstock Cost, 10fi$/Yr 99.6 99.6 99.6 99.6 398.6 Ann. Operating Cost, 106$/Yr 156.2 156.2 156.2 156.2 540.8 Working Capital, 106$/Yr 22.6 22.6 22.6 22.6 71.3
Capital Charge $/Barrel 22.56 22.56 22.56 22.56 15.05 O&M Cost (Year 1), $/Barrel 11.88 11.88 11.88 11.88 7.47 Feed Cost (Year 1), $/Barrel 20.92 20.92 20.92 20.92 20.92 Working Capital (Year 1), $/Barrel 4.75 4.75 4.75 4.75 3.74 Product Price, $/Barrel 56.84 52.76 54.04 58.87 45.67
$/Gallon 1.35 1.26 1.29 1.40 1.09 Natural Gas Price, $/106 Btu 2.43 2.43 2.43 2.43 2.43 Annual % Growth Rate for Natural Gas Price
3.1 0.6 1.6 3.9 3.1
I
en I
A-12

Exhibit A-8. Summary of Economics of Sensitivity to Location and Gas Price for Fischei -Tropsch Process with Slurry Reactor
Principal Variable Barge Mounted Plant Location - Alaska North Slope
Natural Gas Price -$0.50/106 Btu
Natural Gas Price - j $0.00/106 Btu
Design Product Capacity, BPSD 14500 14500 14500 14500 Natural Gas Feed Rate, 106 Btu/Hr 5201 5201 5201 5201 Operator per Shift 22 22 22 22
Process Field Cost, 106$ 598.3 644.9 381.6 386.1 Offsite/Utility Field Cost, 106$ 478.0 515.3 304.9 304.9 Infrastructure, 106$ 636.3 0 0 0 Initial Owner Cost, 106$ 27.5 37.9 24.3 20.2 Total PJant Investment, 106 $ 1740.1 1198.0 710.9 706.8
Total Direct Labor, 106$/Yr 18.4 19.4 11.4 11.4 Total Labor Overheads, 106$/Yr 24.0 25.3 14.8 14.8 Total Other O&M, 106$/Yr 44.0 48.7 30.4 30.4 Total VarOpr&Main, 106$/Yr 86.4 93.4 56.6 56.6 Feedstock Cost, 106$/Yr 20.5 20.5 20.5 0 Ann. Operating Cost, 106$/Yr 106.9 113.9 77.1 56.6 Working Capital, 106$/Yr 24.0 25.7 16.0 14.3
Capital Charge, $/Barrel 54.10 37.19 22.07 21.94 O&M Cost (Year 1), $/Barrel 18.13 19.60 11.88 11.88 Feed Cost (Year I), $/Barrel 4.30 4.30 4.30 0 Working Capital (Year 1), $/Barrel 5.03 5.40 3.37 3.01 Product Price $/Barrel 71.88 57.44 35.95 31.81
$/Gallon 1.71 1.37 0.86 0.76 Natural Gas Price, $/106 Btu 0.50 0.50 0.50 0
(Annual % Growth Rate for Natural Gas Price 3.9 0 0 0
I
M
I A-13