Economic, Environmental and International Trade Effects of ...
23
Ort, Datum Autor Economic and Environmental Effects of the EU Directive on Energy Tax Harmonization Presented at: Climate Change Policy, National Allocation Plans and Emissions Trading in Comparison Schloss Leopoldskron Salzburg, Austria September 26 – October 1, 2004
Transcript of Economic, Environmental and International Trade Effects of ...

Ort, DatumAutor
Economic and Environmental Effects of the EU Directive on Energy Tax Harmonization
Presented at:
Climate Change Policy, National Allocation Plans and Emissions Trading in Comparison
Schloss LeopoldskronSalzburg, AustriaSeptember 26 – October 1, 2004

AuthorsGerman Institute for Economic Research, Berlin
• Jochen Diekmann• Michael Kohlhaas• Dieter Schumacher• Katja Schumacher
Öko-Institut - Institute for Applied Ecology, Berlin• Martin Cames

Goal and Scope of Paper
– Analyze the effects of the EU Directive on Energy Tax Harmonization
• on energy consumption and emissions • on economic growth and sectoral development• on international trade
– Focus on new EU Member Countries
– Use CGE model: GTAP-E

Background– EU Directive on Energy Tax Harmonization
• passed in October 2003 and entered into force in January 2004• Minimum rates for energy products as of 2004 as well as of 2010
– Directive aims at• reducing distortions between Member States and between
energy products• increasing the incentive to reduce energy consumption and
carbon dioxide emissions• establishing coherence of energy, transport and
environmental policies in Europe– Directive covers EU15 Member Countries plus 10
Accession Countries

History of EU Energy Taxation
– 1992 Directive for the taxation of mineral oils:• Harmonization of the structure and the rates of excise duties
Many exemptions and special provisions
– 1992 Proposal for CO2/energy taxationOpposed by several countries (unanimity required!)
– 1997 Proposal by EU Commission for a taxation framework of energy products and electricity
Provides base for the finally adopted, but much less stringent Directive of October 2004

EU Directive on Energy Tax Harmonization
– sets minimum tax rates for energy products– widens the scope of energy products covered to
mineral oils, coal, natural gas, electricity– includes general and country specific transitional
exemptions and reduced minimum rates

Comparison of minimum and actual taxation (EU-15)
Minimum taxation
Energy Carriersin euro per ...
1997 Proposal
Directive 2004/10 AT BE DK FI FR DE GR IE IT LU NL PT ES SE UK
Unleaded Petrol 1000 l 500 359 414 507 548 559 581 624 296 401 542 372 628 470 396 504 729Diesel (Transp.) 1000 l 393 302/330 290 304 370 304 383 440 245 304 403 253 344 269 294 341 729LFO 1000 l 39 21 76 13 279 68 49 61 166 47 403 5 198 33 85 279 50Heavy fuel oil 1000 kg 34 15 36 6 52 57 19 18 19 14 31 6 32 27 14 .. 44Nat. Gas GJ gcv 0.7 0,3 a) 1.0 0.3 7.2 0.5 0 1.0 0 0 4.3 0 2.5 0 0 4.5 0Coal, coke GJ gcv 0.7 0,3 a) 0 0 7.3 2.1 0 0 0 0 0 0 0.6 0 0 10 0Electricity MWh 3 1 b) 20 1.4 89 7.0 7.3 17.9 0 0 40 2.4 45 0 5.1 22 0a) 0,15 euro for business use; b) 0,5 euro for business use; all taxes without sulphur tax and VAT; .. - data not availableWhite fields indicate that actual taxes are less than minimum taxes.Sources: IEA 2003, BMU Umwelt 2003, EC 2003
Actual taxation in member states (2002)

Comparison of minimum and actual taxation (EU-accession countries)
Energy Carriersin euro per ...
1997 Proposal
Directive 2004/10 CZ HU PL SI
Unleaded Petrol 1000 l 500 359 351 409 381 276Diesel (Transp.) 1000 l 393 302/330 264 336 255 276LFO 1000 l 39 21 0 0 42 0Heavy fuel oil 1000 kg 34 15 0 0 0 0Nat. Gas GJ gcv 0.7 0,3 a) 0 0 0 0Coal, coke GJ gcv 0.7 0,3 a) 0 0 0 0Electricity MWh 3 1 b) 0 0 0 0.3a) 0,15 euro for business use; b) 0,5 euro for business use; all taxes without sulphur tax and VAT; .. - data not availableWhite fields indicate that actual taxes are less than minimum taxes.Sources: IEA 2003, BMU Umwelt 2003, EC 2003
Minimum taxationActual taxation in member
states (2002)

Minimum and actual taxes on gas oil
0
100
200
300
400
500
600
700
800
UK DE IT FR DK NL SE FI IE ES BE AT PT LU GR SI HU PL SK MT CZ LT EE LV CY
Euro
per
100
0 l l
EU15EU+10proposal 1997min 2010min 2004min 1993
Data: EU, BMU Data for 2002, Germany 2003

Modelling Framework and Data
– CGE model: GTAP-E (Burniaux, Truong 2002)• static version• perfect competition• Armington assumption• ‚regional household‘
– GTAP 5.4 data set (incl. CEE countries) • aggregation: 12 regions, 13 sectors

Regional aggregation
1 FRA France2 DEU Germany3 GBR Great Britain4 ITA Italy5 CZE Czech Republic6 HUN Hungary7 POL Poland8 XAC rest of Eastern European accession countries9 EUS group of southern European Union countries (ESP, POR, GRC)10 XEU rest of old EU member states (EU15 - 4)11 XOECD rest of OECD countries12 ROW rest of the world
Regions

Sectoral aggregation
2 COL coal 3 OIL crude oil4 GAS natural gas, gas manufacture, distribution5 p_c petroleum products, coal products6 ely electricity
1 AGR agriculture, forestry, fishing, food, beverages, tobacco
7 TCL textiles, clothing, etc. (labor intensive, non energy intens. manuf.)8 M_E machinery and equipment (capital intensive, non energy intens. manuf.)9 MIN non metallic minerals and products (energy intensive manufacturing)10 MET primary metals and metal products (energy intensive manufacturing)11 OEIM other energy intensive manufacturing (pulp and paper products, water)12 T_T trade and transport services13 SER other services
Sectors

Policy Scenarios– Ambiguity of Directive: sets minimum rates at a
level below actual rates in some countries– Minimum Tax Harmonization (MTH):
Member States fulfill minimum tax as set by Directive for 2010, but will not reduce existing taxes (partial harmonization)
– Full Tax Harmonization (FTH): As MTH, but Member States with higher tax rates lower their taxes to the minimum level
– Min. Tax Harmonization 1997 levels (MTH97): As MTH, but Member States fulfill minimum taxation according to the Commission’s tax proposal in 1997

Price changes (%) - Scenario FTH
-20-15-10-505
101520253035
FRA
GER U
K
ITA
CZE
HU
N
POL
XAC
EUS
XEU
Coal
IndustryHouseholds
-35-30-25-20-15-10-505
1015
FRA
GER U
K
ITA
CZE
HU
N
POL
XAC
EUS
XEU
Petroleum Products
-35-30-25-20-15-10-505
1015
FRA
GER U
K
ITA
CZE
HU
N
POL
XAC
EUS
XEU
Gas
-30
-25
-20
-15
-10
-5
0
5
FRA
GER U
K
ITA
CZE
HU
N
POL
XAC
EUS
XEU
Electricity

Price changes (%) - Scenario FTH97
-100
1020304050607080
FRA
GER U
K
ITA
CZE
HU
N
POL
XAC
EUS
XEU
Coal
IndustryHouseholds
-40
-30
-20
-10
0
10
20
30
FRA
GER U
K
ITA
CZE
HU
N
POL
XAC
EUS
XEU
Gas
IndustryHouseholds
-25
-20
-15
-10
-5
0
5
10
FRA
GER U
K
ITA
CZE
HU
N
POL
XAC
EUS
XEU
Electricity
IndustryHouseholds
-30
-20
-10
0
10
20
30
40
FRA
GER U
K
ITA
CZE
HU
N
POL
XAC
EUS
XEU
Petroleum products

Change of total demand of energy goods – MTH scenario
-6
-5
-4
-3
-2
-1
0
1[%]
FRA
DEU
GBR IT
A
CZE
HU
N
POL
XAC
EUS
XEU
XOEC
D
RO
W
coloilgasp_cely
EU-15:– Small changes in demand
(<1%) except for gas demand in FRA, GBR and EUS due to an increase in gas taxes
Accession countries:- Effects are most pronounced
for p_c and gas - Increase in electricity demand
due to higher tax rates on fossil fuels than on electricity (subst. effect)

Change of total demand of energy goods – FTH scenario
-10
-5
0
5
10
15
20
25
30
35[%]
FRA
DEU
GBR IT
A
CZE
HU
N
POL
XAC
EUS
XEU
XOEC
D
RO
W
coloilgasp_cely
EU-15:– Four largest countries lower tax
rates– High increase in energy demand– Only minor effects in Southern
EuropeAccession countries:
- Effects similar to MTH scenario- Higher decrease in demand for
p_c due to higher world market prices
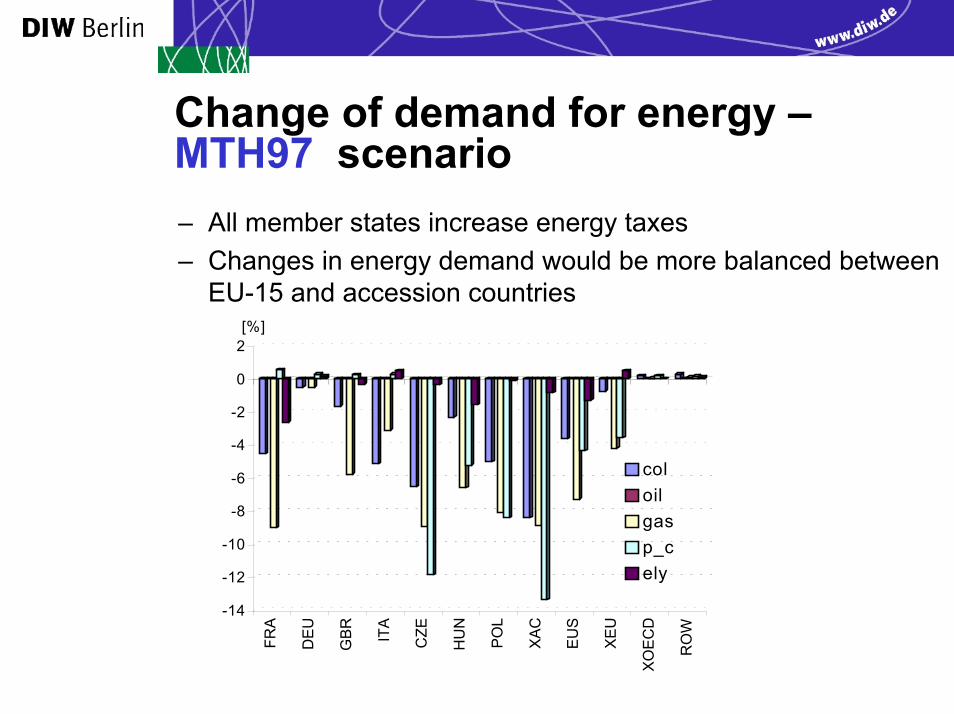
Change of demand for energy –MTH97 scenario
-14
-12
-10
-8
-6
-4
-2
0
2[%]
FRA
DEU
GBR IT
A
CZE
HU
N
POL
XAC
EUS
XEU
XOEC
D
RO
W
coloilgasp_cely
– All member states increase energy taxes– Changes in energy demand would be more balanced between
EU-15 and accession countries

Change of CO2 emissions by region (%)FRA DEU GBR ITA CZE HUN POL XAC EUS XEU XOECD ROW
FTH 4.87 9.43 16.66 15.65 -2.87 -0.41 -1.69 -3.11 1.04 4.31 -0.70 -0.46
MTH -1.11 -0.04 -0.14 -0.11 -3.23 -0.81 -1.38 -2.99 -0.72 0.04 0.02 0.00MTH97 -4.12 -0.32 -0.72 -1.53 -11.17 -4.42 -5.30 -8.78 -6.12 -3.26 0.15 0.04
-15
-10
-5
0
5
10
15
20
[%]
FRA
DEU
GBR IT
A
CZE
HU
N
POL
XAC
EUS
XEU
XOEC
D
RO
W
FTHMTHMTH97

Macroeconomic Effects: Real GDP
-0,6
-0,4
-0,2
0,0
0,2
0,4
0,6
0,8
1,0[%]
FRA
DEU
GBR IT
A
CZE
HU
N
POL
XAC
EUS
XEU
XOEC
D
RO
W
Change of real GDP
FTHMTHMTH97
MTH/MTH97:– Positive effects are very small– GDP-decrease for accession
countriesFTH:
- GDP-increase between 0.5-1% for countries with tax reduction
- GDP-decrease for countries with tax increases is higher than in MTH-scenario

Summary and Conclusions 1Partial Harmonization
• MTH reduces energy demand and CO2 emissions slightly• MTH implies GDP losses for new Member Countries,
positive effects for old Member Countries• MTH97 same as MTH but larger effects
→ Stricter tax rates (as in MTH97) needed in order to contribute to EU‘s energy efficiency and environmental goal in a non-negligible way
→ Negligible or positive economic effects for old EU members, negative effects for new Member States (but welfare gains from EU membership likely)

Summary and Conclusions 2Full Harmonization
• leads to increasing energy demand and CO2 emissions if no tax differentials were implemented
• old Member Countries increase their GDP at the expense of new member countries
→ Higher minimum tax rates needed if full harmonization is to pursue double objective of reducing distortions and reducing energy use and related emissions

Thank you!
Martin Cames – [email protected]Öko-Institut – http://www.oeko.de
Novalisstr. 10, 10115 Berlin, GermanyTel.: +49-30-280 486-83, Fax -88
http://www.gtap.agecon.purdue.edu/resources/download/1818.pdf
http://www.ecomod.net/conferences/ecomod2004/ecomod2004_papers/301.pdf