
Economic Assessment of IPM Programs Scott M. Swinton Dept. of Agricultural Economics Michigan State...
20
Economic Assessment of IPM Programs Scott M. Swinton Dept. of Agricultural Economics Michigan State University 4 th National IPM Symposium, Indianapolis, Apr.
-
Upload
stewart-tyler -
Category
Documents
-
view
215 -
download
0
Transcript of Economic Assessment of IPM Programs Scott M. Swinton Dept. of Agricultural Economics Michigan State...

Economic Assessment of IPM Programs
Scott M. Swinton
Dept. of Agricultural Economics
Michigan State University
4th National IPM Symposium, Indianapolis, Apr. 8-10, 2003

Purpose
• Economic assessments aim to evaluate the net benefits of investments in IPM
• Focus on valued outcomes– Outcomes may be monetary or not– Adoption per se is not an outcome; it is an
intermediate step that affects outcomes
• Scale:– Individual– Society

User-level profitability assessment
• Partial budget or partial enterprise budgets– Does average change in benefits from IPM exceed
average change in costs?
• Capital budget (investment analysis)– Does investment in IPM over time generate
benefits that cover costs?
• Risk analysis– Does adoption of IPM cause change in probability
distribution of net returns?

Illustrative partial budget: Intermediate IPM replaces Conventional
PM in 10-ac tart cherry orchard, 1998Reductions to Income ($) Gains To Income ($)
Added CostInsect pest prediction model 2Added scouting 111
Added Revenues(None)
Reduced Revenues(None)
Decreased CostReduced sprays 551
Total Reductions (A) 113 Total Gains (B) 551
Net Change (B-A) 438
Source: M. Williams M.S., 2000

Potential discounted cumulative returns to investment in IPM
$
Year
DiscountedAnnual
Net gain @ 10%
1 2 3 4 5 6 7 8
CumulativeNet gain
Break-evenIn Year 7
DiscountedCumulative
Net gain @ 10%
DiscountedBreak-evenIn Year 9-10
9

Adding risk and environmental benefits to a profit analysis
• Assign cash values & factor into money measure
• Use non-money measures & evaluate trade-offs (multi-criteria analysis)– Mean profit vs. Variance– Profit vs. pesticide exposure

4000
5000
6000
7000
14000 15000 16000 17000 18000 19000 20000
Mean Gross Margin ($ / 10ac)
Sta
nd
ard
Dev
atio
n o
f Y
earl
y M
ean
s
Std. Spring Nitrogen (Trt. 2)
Cover mix 2 (Trt. 6)
Compost (Trt. 9)
Cover mix 2 + Fertigated N(Trt. 11)
Metered, Fertigated N(Trt. 10)
Mean-risk profitability tradeoff in tart cherry groundcover management (NW Mich, 1995-2000)
x x
Desired direction

Profitability-nitrate leaching tradeoff in tart cherry groundcover systems (NW Mich, 1995-2000)
x
0
10
20
30
40
50
60
70
11000 13000 15000 17000 19000 21000 23000
Mean Gross Margin ($/10ac)
Mea
n N
itra
te l
each
ing
(kg
/ha)
Std. Spring Nitrogen (Trt. 2)
Metered fertigated Nitrogen (Trt. 10)Cover mix 2 +
Fertigated N (Trt. 11)
Compost (Trt. 9)
Cover mix 2 (Trt. 6)
Desired direction

Reduction in Cost and Environ. Impact by IPM Level: Michigan Tart Cherry, 1999
0%
5%
10%
15%
20%
25%
30%
35%
0% 5% 10% 15% 20%
Percent cost reduction from Conventional PM
Pe
rce
nt
red
uc
tio
n in
us
e-
ad
jus
ted
EIQ
Conventional
BasicIPM
IntermediateIPM
“Advanced”IPM

Challenges to incorporate environment & health in economic analysis
• Cost-effective non-market valuation– Environmental economists have developed a variety
of methods, but most require costly, targeted studies– Emergent lit on “benefit transfer” from prior studies
• How to aggregate different E&H benefits?– Scoring measures
• Subjectivity problem • Scores not necessarily designed for assessment
– Multiple E&H measures• Unwieldy to analyze• Diminishing willingness to pay for more E&H benefits

Scaling up from one IPM user to society: Adoption
• Need clear, simple IPM definition to measure adoption
• Projecting adoption trends into the future
Time
Pe
rce
nt a
dop
tion
0
100%
Max adoption
Present

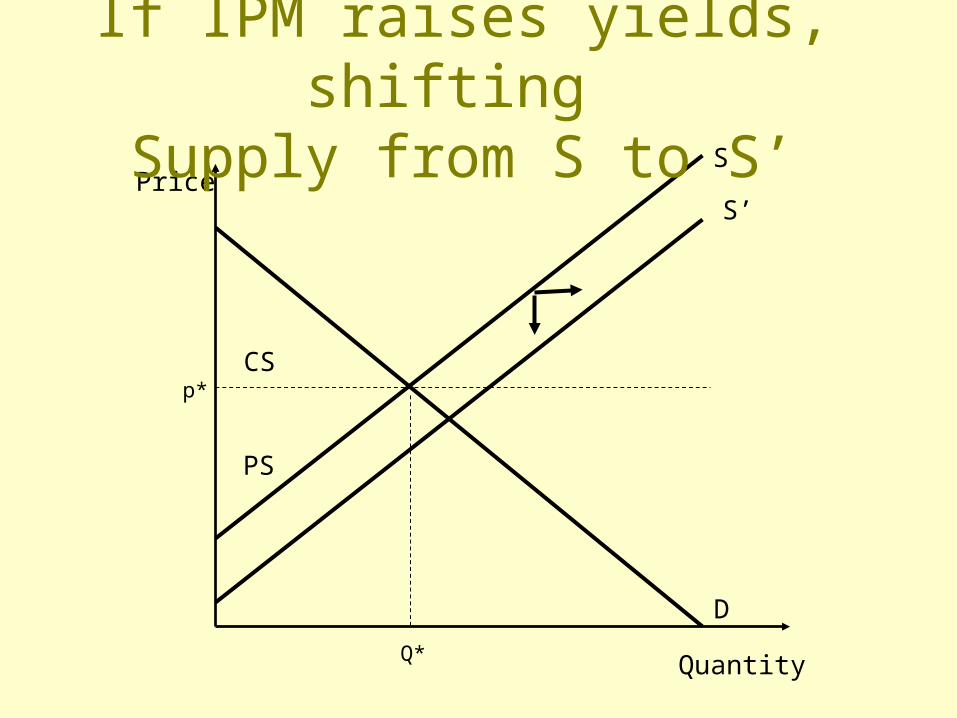
Scaling up from one IPM user to society: Market effects
• When many users adopt IPM, indirect market effects may result– Price effect (supply curve shifts)
• Higher yields will depress price• Higher costs will cause some producers to exit, increasing
prices for those who remain
– Income effect (input demand shifts)• Higher producer incomes may raise demand for
environmentally friendly inputs
• Economic surplus analysis can estimate effects
p*
D
Quantity
PriceS
PS
CS
S’
Q*
If IPM raises yields, shifting Supply from S to S’

Current state of the art
• Benefit-cost analysis over time based on– Adoption trends– IPM public program costs– Market-adjusted net benefits per adopter– Environmental & health benefits
• Valuation• Trade-offs
• Staff paper on “Economics of IPM”:• http://agecon.lib.umn.edu/cgi-bin/pdf_view.pl?paperid=1854
Challenges ahead:Cost-effective assessments
• Excellent impact assessments are costly– Expert opinion is cheap; can lead to error & bias– Surveys are costly, but cooperation with NASS can
cut costs & strengthen data quality– Benefit transfer research is developing new tools for
adapting prior E&H valuation results to new settings
• Scaling up economic assessment to multiple programs at national or international level not easy– Spillovers – Diminishing marginal benefits

Challenges ahead:Assessing biological IPM
• Innovations in ecological pest mgt calls for bioeconomic modeling of production systems with pests present– Dynamic systems
• Time to achieve new equilibrium?• Resilience & vulnerability to shocks?
– Beyond pesticide thresholds to habitat management for beneficials
– What value of such long-term investments?

Biological control of the pesky Michigan wolverinebug


Expert opinion vs Survey data:IPM adoption, tart cherry, 1999
0
5000
10000
15000
20000
25000
30000
Experts: NWMichigan
Survey: NWMichigan
Survey: AllMichigan
Acr
es
Advanced IPM
Intermed. IPM
Basic IPM
Conventional

Expert opinion vs Survey data:Gross revenue by IPM level, t.cherry, 1999
1200
1300
1400
1500
1600
1700
1800
1900
2000
2100
Conventional Basic IPM Intermed. IPM Advanced IPM
$/ac
re
NB: Error bars = 2 x Standard deviation
Experts assumed norevenue differencefrom Conventional PM.