EcoLens and TreePlus: Tools for exploring ecological interaction data Cynthia Sims Parr Bongshin...
13
EcoLens and TreePlus: Tools for exploring ecological interaction data Cynthia Sims Parr Bongshin Lee, Ben Bederson University of Maryland, College Park
-
date post
21-Dec-2015 -
Category
Documents
-
view
214 -
download
0
Transcript of EcoLens and TreePlus: Tools for exploring ecological interaction data Cynthia Sims Parr Bongshin...
EcoLens and TreePlus: Tools for exploring ecological interaction data
Cynthia Sims Parr
Bongshin Lee, Ben BedersonUniversity of Maryland, College Park

Ecological interaction webs
From http://www.geog.ouc.bc.ca/physgeog/contents/9o.html

Ultimate problem: Computational approach to ecological interaction analysis
Database
Interaction Web
Database
ADWattributes
Graph vis tools
Algorithms
Test predictions
Predictions
Explore forpatterns
PhylogeniesClassifications

Food web visualizationWilliams, Martinez, Dunne, et al.
Web, network, or “graph” representations
Node-link graphs Matrix List of connected pairs Trees with cross-links Coupled lists

TaxonTree

Data sources
Source # webs # interactors # links
Webs on the Web 17 1537 6328
Interaction Web DB 26 2177 9882
EcoWEB 213 4064 6363
Animal Diversity Web 1 1012 2869
Total 257 8,790 25,442

Interface Goals
Provide enough overview that users can decide where they want to explore
Bring large datasets down to human scales Support systematic exploration
dataset selection and comparison discovery of potentially interesting patterns data cleaning
Provide environment for examining modeling results
EcoLens and TreePlus
Demo
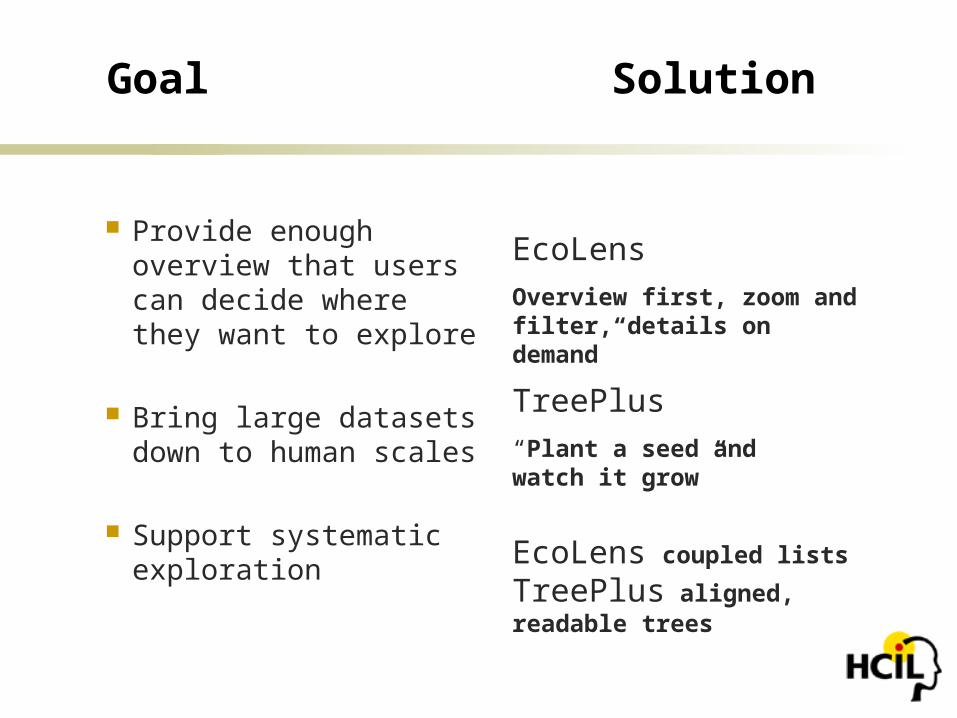
Goal Solution
Provide enough overview that users can decide where they want to explore
Bring large datasets down to human scales
Support systematic exploration
EcoLens
Overview first, zoom and filter, details on demand”
TreePlus
“Plant a seed and watch it grow”
EcoLens coupled lists
TreePlus aligned, readable trees

Next steps
Evaluate with food web researchers Visualize attributes of nodes and links Test against other graph viz alternatives Integrate with robust input and output tools Incorporate statistical computational tools

Broader implications
Generalizable framework for highly interconnected data: NetLens and TreePlus
Expanding the scale of web analysis among ecologists

Acknowledgements
Sarah Hankerson, Paula Rodgers, Bill Fagan and other members of the Ecological Informatics class
NSF ITR/IDM Microsoft Booze Allen Hamilton
http://www.cs.umd.edu/hcil/biodiversity


![[(SPAN)- ] - BONGSHIN · 2015. 11. 16. · [(SPAN)- ]스판 조정 실부하입력 예 최대표시눈금) :100.00kg 한눈의값 최소표시눈금()10g 표준분동 이준비되었을때50.00kg](https://static.fdocuments.us/doc/165x107/602a8a870aadc84d86728be0/span-2015-11-16-span-oe-ee-oeeoeoeoeee.jpg)