Eco-profiles of the European Plastics Industrypolyurethanes.org/uploads/documents/eco_polyol.pdf ·...
19
Eco-profiles of the European Plastics Industry POLYOLS A report by I Boustead for PlasticsEurope Data last calculated March 2005 1
Transcript of Eco-profiles of the European Plastics Industrypolyurethanes.org/uploads/documents/eco_polyol.pdf ·...

Eco-profiles of the European Plastics Industry
POLYOLS
A report by
I Boustead
for
PlasticsEurope
Data last calculated
March 2005
1

IMPORTANT NOTE Before using the data contained in this report, you are strongly recommended to look at the following documents: 1. Methodology This provides information about the analysis technique used and gives advice on the meaning of the results. 2. Data sources This gives information about the number of plants examined, the date when the data were collected and information about up-stream operations. In addition, you can also download data sets for most of the upstream operations used in this report. All of these documents can be found at: www.plasticseurope.org.
PlasticsEurope may be contacted at Ave E van Nieuwenhuyse 4 Box 3 B-1160 Brussels Telephone: 32-2-672-8259 Fax: 32-2-675-3935
2

CONTENTS POLYURETHANE ....................................................................................................................4
DIISOCYANATES.....................................................................................................................5
POLYOLS...................................................................................................................................6
PROCESS ROUTES ..................................................................................................................7
ECO-PROFILE OF POLYOLS..............................................................................................10
3
POLYURETHANE Polyurethanes (PUR) were first produced in 1937 by Otto Bayer and his co-workers in Germany and represent a family of polymers rather than a single polymer. Urethane polymers can be produced with a wide variety of properties, ranging from soft flexible foams and fibres through to hard solids so that they can be used in a diverse range of applications. There are five main areas of use for polyurethanes: (1) the furniture and mattress sector, which uses almost exclusively flexible foams, (2) the automotive industry which provides a market for flexible foams, filling foams, rigid and flexible integral skin foams as well as elastomers for engineering components, (3) the consumer sector, which is diversified in a manner similar to the automotive industry, (4) the building industry, which is by far the largest consumer of rigid foams as insulation materials, and (5) refrigeration engineering, which represents the second largest area for use of rigid polyurethane foams as insulation materials. For further details on the applications of polyurethane materials, see, for example, Oertel.1 Despite these differing properties, the polymers have one common characteristic in that they all incorporate the urethane group (-NH-CO-O-) into their structure. However, the polymers differ from simple thermoplastic polymers, such as the polyolefins, in that they are not sold as ready-made polymers but as precursors that are mixed at the conversion stage. These precursors are commonly polyols (compounds containing multiple -OH groups) and diisocyanates (compounds containing -NCO groups). The primary reaction during the production of polyurethanes is of the form: -NCO + HO- → -NH-CO-O-
1Oertel, G. (ed) Polyurethane Handbook. ISBN 3-446-17198-3. Hanser Publishers, Munich, Vienna, New York. (1993).
4

DIISOCYANATES The principal raw materials for polyurethane precursors are crude oil and natural gas. The diisocyanates having the greatest commercial importance originate from the aromatic content (benzene and toluene), while the polyols come almost exclusively from the aliphatic content. Some renewable materials are also used as raw material sources for polyols. Diisocyanates are obtained by phosgenation of diamines which are produced, via a number of intermediate steps, from aromatic hydrocarbons. The diisocyanates with the greatest technical importance are tolylene diisocyanate (TDI) and diphenylmethane diisocyanate (MDI). Commercial TDI is marketed as a mixture of the 2,4- and 2,6- isomers, predominantly at a ratio of 80:20 (See Figure 1)
CH3
NCO
NCO
CH3
NCONCO
2,4-TDI 2,6-TDI
Figure 1. Isomers of tolylenediisocyanate.
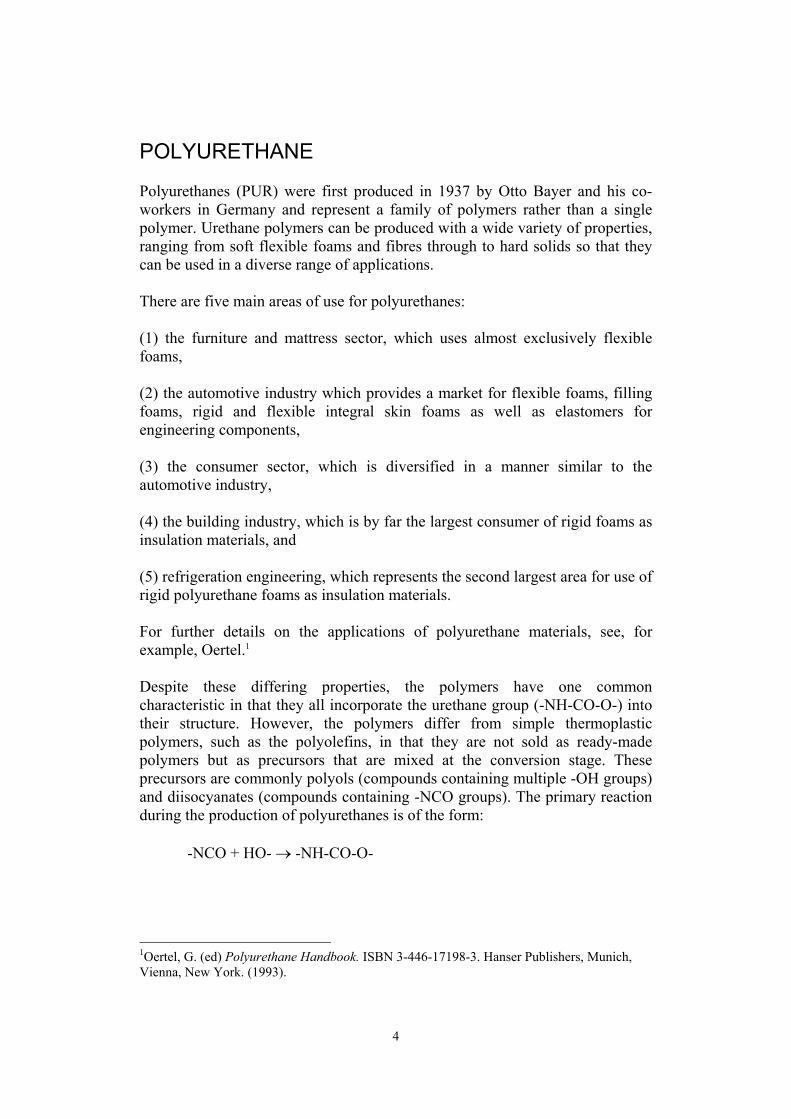
Figure 2 shows the structural formula of diphenylmethane 4,4'-diisocyanate (MDI monomer) and the product derived from it with a functionality greater than 2 (MDI polymer).
5
OCN
CH2
NCO
OCN NCONCO
CH2 CH2n
Figure 2. Structures of (a) MDI monomer and (b) MDI polymer.
(a)
(b)
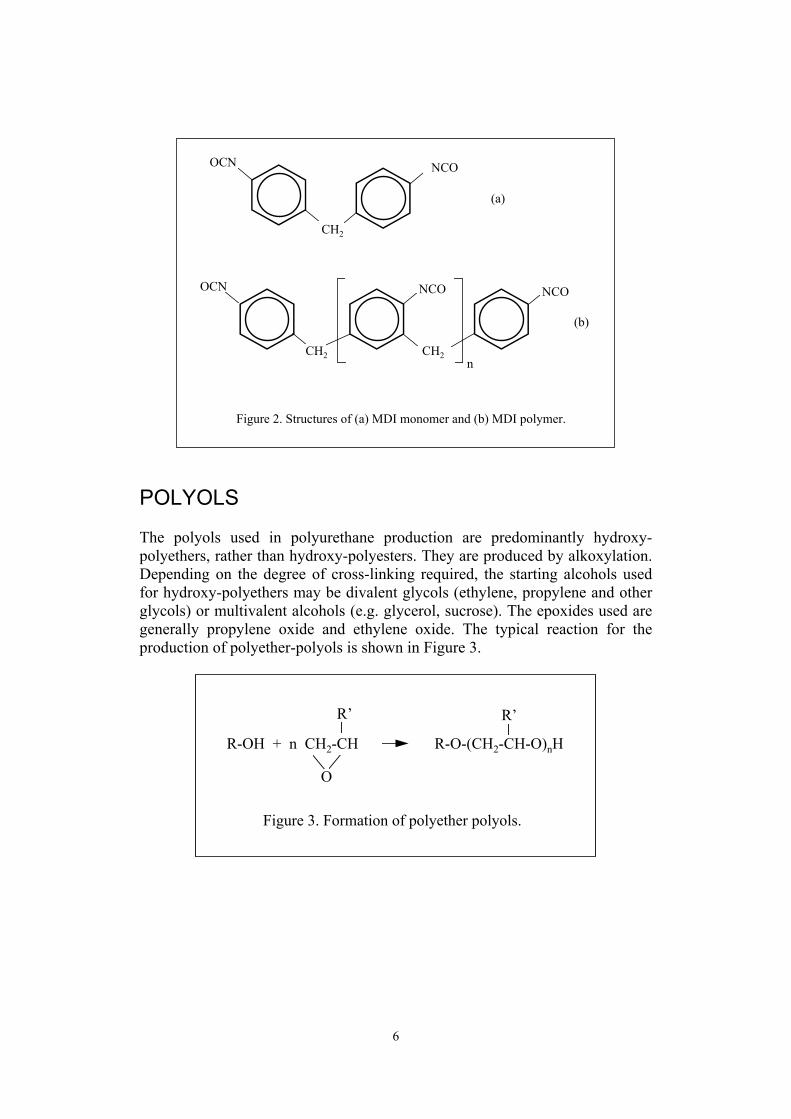
POLYOLS The polyols used in polyurethane production are predominantly hydroxy-polyethers, rather than hydroxy-polyesters. They are produced by alkoxylation. Depending on the degree of cross-linking required, the starting alcohols used for hydroxy-polyethers may be divalent glycols (ethylene, propylene and other glycols) or multivalent alcohols (e.g. glycerol, sucrose). The epoxides used are generally propylene oxide and ethylene oxide. The typical reaction for the production of polyether-polyols is shown in Figure 3.
R-OH + n CH2-CH
O
R’
R-O-(CH2-CH-O)nH
R’
Figure 3. Formation of polyether polyols.
6
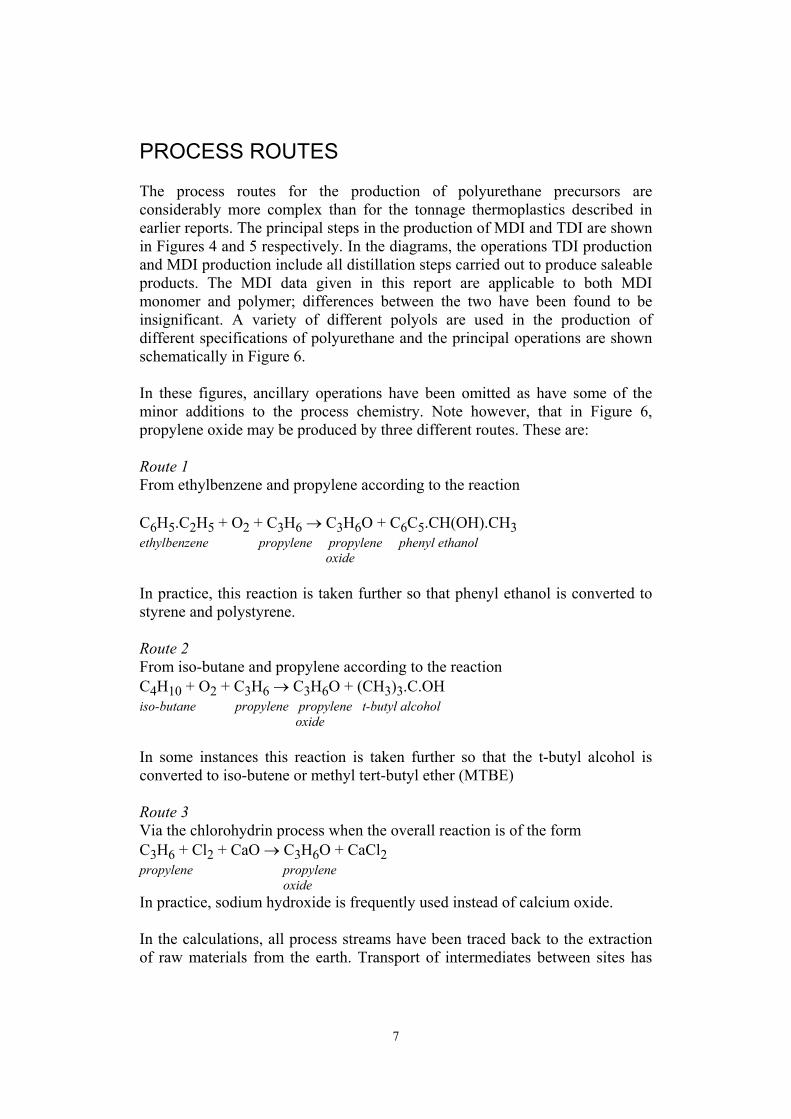
PROCESS ROUTES The process routes for the production of polyurethane precursors are considerably more complex than for the tonnage thermoplastics described in earlier reports. The principal steps in the production of MDI and TDI are shown in Figures 4 and 5 respectively. In the diagrams, the operations TDI production and MDI production include all distillation steps carried out to produce saleable products. The MDI data given in this report are applicable to both MDI monomer and polymer; differences between the two have been found to be insignificant. A variety of different polyols are used in the production of different specifications of polyurethane and the principal operations are shown schematically in Figure 6. In these figures, ancillary operations have been omitted as have some of the minor additions to the process chemistry. Note however, that in Figure 6, propylene oxide may be produced by three different routes. These are: Route 1 From ethylbenzene and propylene according to the reaction C6H5.C2H5 + O2 + C3H6 → C3H6O + C6C5.CH(OH).CH3 ethylbenzene propylene propylene phenyl ethanol oxide In practice, this reaction is taken further so that phenyl ethanol is converted to styrene and polystyrene. Route 2 From iso-butane and propylene according to the reaction C4H10 + O2 + C3H6 → C3H6O + (CH3)3.C.OH iso-butane propylene propylene t-butyl alcohol oxide In some instances this reaction is taken further so that the t-butyl alcohol is converted to iso-butene or methyl tert-butyl ether (MTBE) Route 3 Via the chlorohydrin process when the overall reaction is of the form C3H6 + Cl2 + CaO → C3H6O + CaCl2 propylene propylene oxide In practice, sodium hydroxide is frequently used instead of calcium oxide. In the calculations, all process streams have been traced back to the extraction of raw materials from the earth. Transport of intermediates between sites has
7

been included but on-site transport is assumed to be included in the data provided by the site operator. Services such as cooling water, steam, compressed air and nitrogen and oxygen gases have been included. Catalysts have been excluded from the system.
Sulphurproduction
Sulphuric acid production
Methanolproduction
Formaldehydeproduction
Benzeneproduction
Nitrobenzene production
MDAproduction
MDIproduction
Anilineproduction
Phosgeneproduction
Oilrefining
Crude oil
Sulphur
Carbonmonoxideproduction
Coke/natural gas
Chlorineproduction
Sodiumchloride
Nitric acidproduction
Ammoniaproduction
Naturalgas
Naturalgas
Figure 4Schematic diagram showing the principal operations leading to the production of MDI.* Note that hydrogen can be produced by a variety of different methods; e.g. from theelectrolysis of sodium chloride, as a by-product in hydrocarbon cracking, etc.
MDI
Hydrogenproduction*
8
Oilrefining
Crude oil
Nitric acidproduction
Ammoniaproduction
Naturalgas
Figure 5Schematic diagram showing the principal operations leading to the production of TDI.* Note that hydrogen can be produced by a variety of processes; e.g. during the electrolysisof sodium hydroxide, as a by-product in hydrocarbon cracking, etc.
Phosgeneproduction
Carbonmonoxideproduction
Coke/natural gas
Chlorineproduction
Sodiumchloride
TDIproduction
Toluene production
TDAproduction
Dinitrotoluene production
TDI
Sulphuric acidproduction
Sulphurproduction
Sulphur
Hydrogenproduction*
Natural gas
9
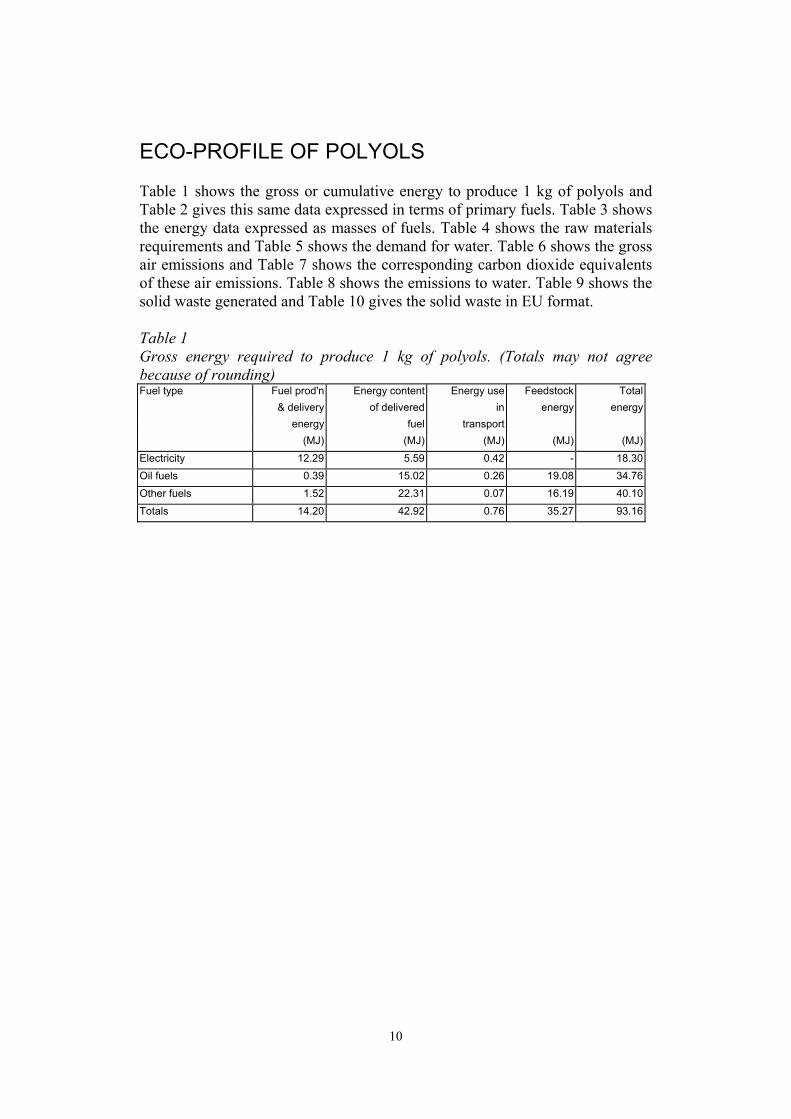
ECO-PROFILE OF POLYOLS Table 1 shows the gross or cumulative energy to produce 1 kg of polyols and Table 2 gives this same data expressed in terms of primary fuels. Table 3 shows the energy data expressed as masses of fuels. Table 4 shows the raw materials requirements and Table 5 shows the demand for water. Table 6 shows the gross air emissions and Table 7 shows the corresponding carbon dioxide equivalents of these air emissions. Table 8 shows the emissions to water. Table 9 shows the solid waste generated and Table 10 gives the solid waste in EU format. Table 1 Gross energy required to produce 1 kg of polyols. (Totals may not agree because of rounding) Fuel type Fuel prod'n Energy content Energy use Feedstock Total & delivery of delivered in energy energy energy fuel transport (MJ) (MJ) (MJ) (MJ) (MJ)
Electricity 12.29 5.59 0.42 - 18.30 Oil fuels 0.39 15.02 0.26 19.08 34.76 Other fuels 1.52 22.31 0.07 16.19 40.10 Totals 14.20 42.92 0.76 35.27 93.16
10
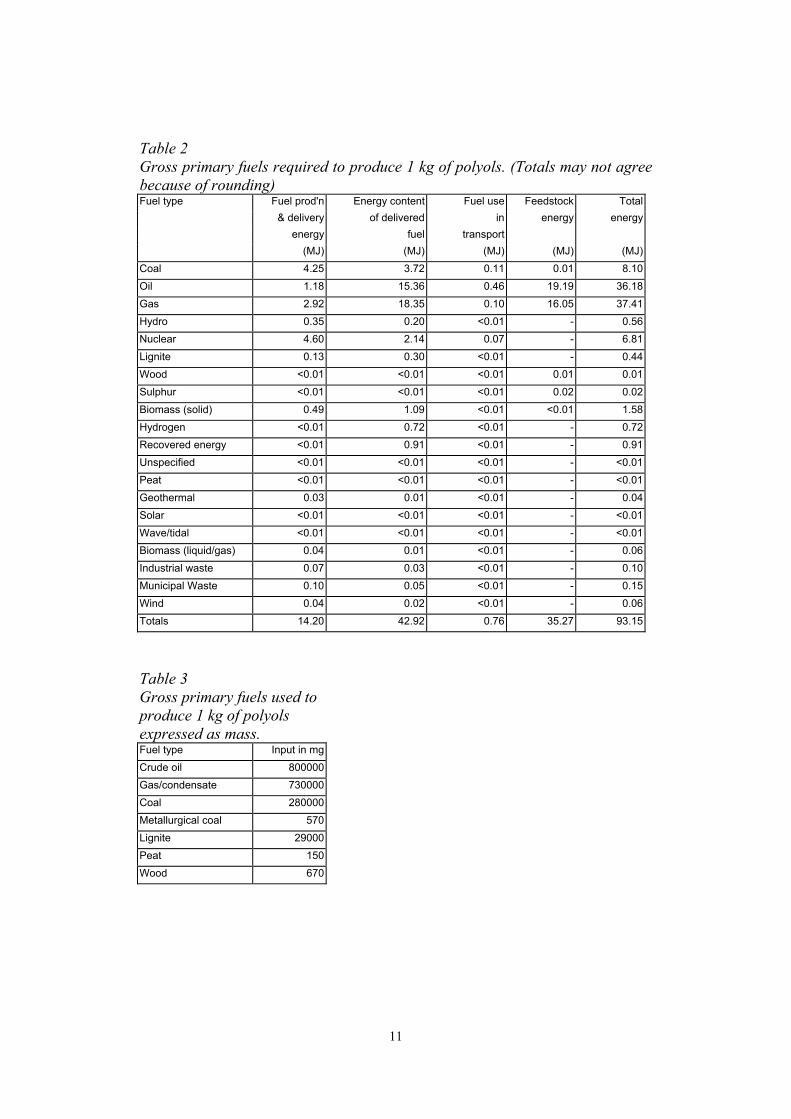
Table 2 Gross primary fuels required to produce 1 kg of polyols. (Totals may not agree because of rounding) Fuel type Fuel prod'n Energy content Fuel use Feedstock Total & delivery of delivered in energy energy energy fuel transport (MJ) (MJ) (MJ) (MJ) (MJ) Coal 4.25 3.72 0.11 0.01 8.10 Oil 1.18 15.36 0.46 19.19 36.18 Gas 2.92 18.35 0.10 16.05 37.41 Hydro 0.35 0.20 <0.01 - 0.56 Nuclear 4.60 2.14 0.07 - 6.81 Lignite 0.13 0.30 <0.01 - 0.44 Wood <0.01 <0.01 <0.01 0.01 0.01 Sulphur <0.01 <0.01 <0.01 0.02 0.02 Biomass (solid) 0.49 1.09 <0.01 <0.01 1.58 Hydrogen <0.01 0.72 <0.01 - 0.72 Recovered energy <0.01 0.91 <0.01 - 0.91 Unspecified <0.01 <0.01 <0.01 - <0.01 Peat <0.01 <0.01 <0.01 - <0.01 Geothermal 0.03 0.01 <0.01 - 0.04 Solar <0.01 <0.01 <0.01 - <0.01 Wave/tidal <0.01 <0.01 <0.01 - <0.01 Biomass (liquid/gas) 0.04 0.01 <0.01 - 0.06 Industrial waste 0.07 0.03 <0.01 - 0.10 Municipal Waste 0.10 0.05 <0.01 - 0.15 Wind 0.04 0.02 <0.01 - 0.06 Totals 14.20 42.92 0.76 35.27 93.15
Table 3 Gross primary fuels used to produce 1 kg of polyols expressed as mass. Fuel type Input in mg Crude oil 800000 Gas/condensate 730000 Coal 280000 Metallurgical coal 570 Lignite 29000 Peat 150 Wood 670
11
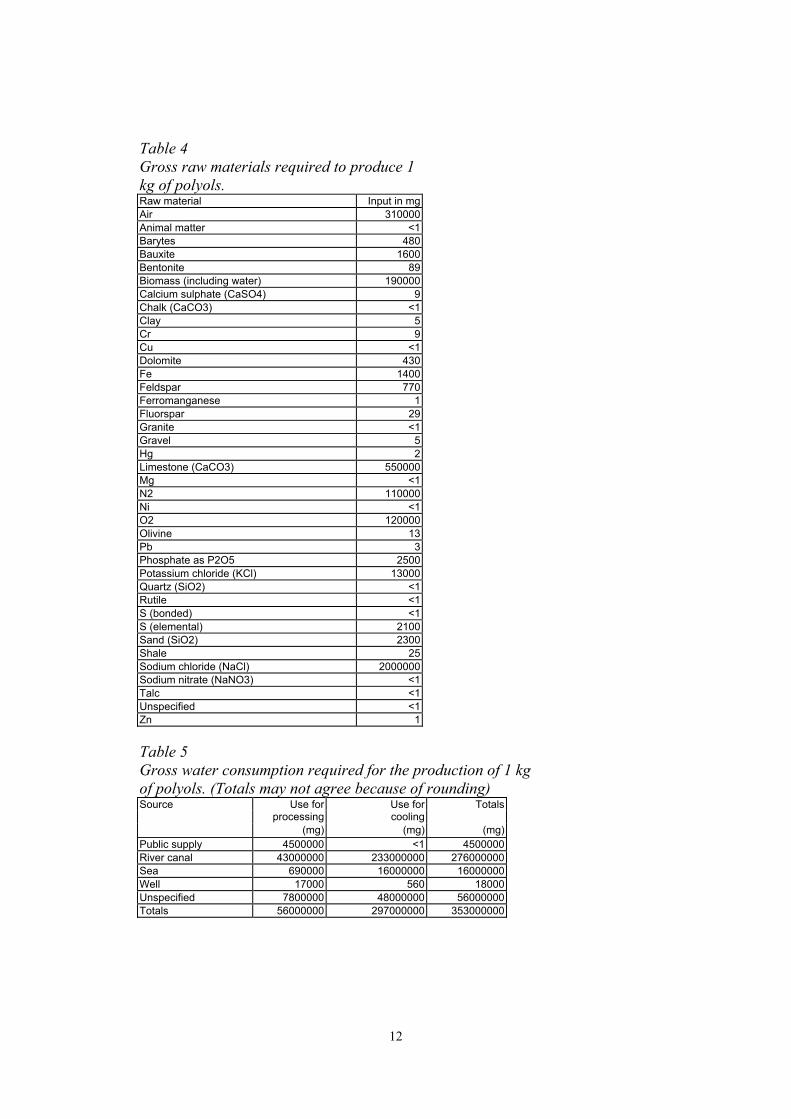
Table 4 Gross raw materials required to produce 1 kg of polyols. Raw material Input in mgAir 310000Animal matter <1Barytes 480Bauxite 1600Bentonite 89Biomass (including water) 190000Calcium sulphate (CaSO4) 9Chalk (CaCO3) <1Clay 5Cr 9Cu <1Dolomite 430Fe 1400Feldspar 770Ferromanganese 1Fluorspar 29Granite <1Gravel 5Hg 2Limestone (CaCO3) 550000Mg <1N2 110000Ni <1O2 120000Olivine 13Pb 3Phosphate as P2O5 2500Potassium chloride (KCl) 13000Quartz (SiO2) <1Rutile <1S (bonded) <1S (elemental) 2100Sand (SiO2) 2300Shale 25Sodium chloride (NaCl) 2000000Sodium nitrate (NaNO3) <1Talc <1Unspecified <1Zn 1 Table 5 Gross water consumption required for the production of 1 kg of polyols. (Totals may not agree because of rounding) Source Use for Use for Totals processing cooling (mg) (mg) (mg)Public supply 4500000 <1 4500000River canal 43000000 233000000 276000000Sea 690000 16000000 16000000Well 17000 560 18000Unspecified 7800000 48000000 56000000Totals 56000000 297000000 353000000
12
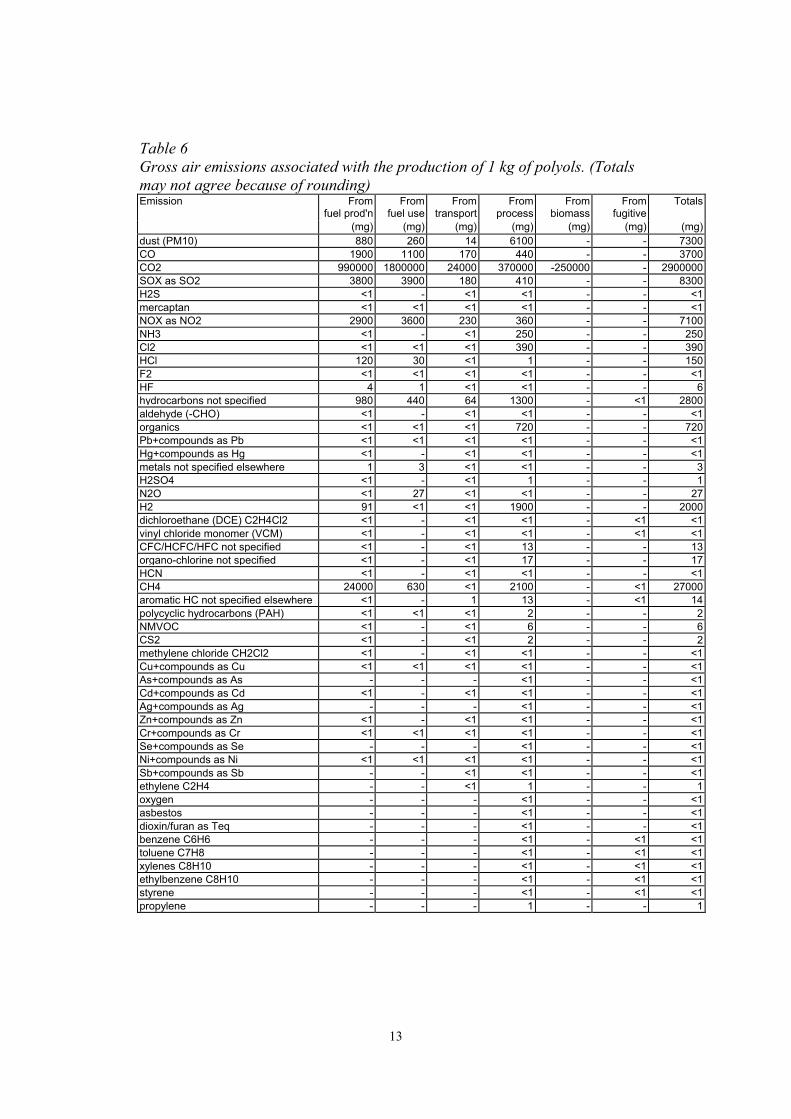
Table 6 Gross air emissions associated with the production of 1 kg of polyols. (Totals may not agree because of rounding) Emission From From From From From From Totals fuel prod'n fuel use transport process biomass fugitive (mg) (mg) (mg) (mg) (mg) (mg) (mg)dust (PM10) 880 260 14 6100 - - 7300CO 1900 1100 170 440 - - 3700CO2 990000 1800000 24000 370000 -250000 - 2900000SOX as SO2 3800 3900 180 410 - - 8300H2S <1 - <1 <1 - - <1mercaptan <1 <1 <1 <1 - - <1NOX as NO2 2900 3600 230 360 - - 7100NH3 <1 - <1 250 - - 250Cl2 <1 <1 <1 390 - - 390HCl 120 30 <1 1 - - 150F2 <1 <1 <1 <1 - - <1HF 4 1 <1 <1 - - 6hydrocarbons not specified 980 440 64 1300 - <1 2800aldehyde (-CHO) <1 - <1 <1 - - <1organics <1 <1 <1 720 - - 720Pb+compounds as Pb <1 <1 <1 <1 - - <1Hg+compounds as Hg <1 - <1 <1 - - <1metals not specified elsewhere 1 3 <1 <1 - - 3H2SO4 <1 - <1 1 - - 1N2O <1 27 <1 <1 - - 27H2 91 <1 <1 1900 - - 2000dichloroethane (DCE) C2H4Cl2 <1 - <1 <1 - <1 <1vinyl chloride monomer (VCM) <1 - <1 <1 - <1 <1CFC/HCFC/HFC not specified <1 - <1 13 - - 13organo-chlorine not specified <1 - <1 17 - - 17HCN <1 - <1 <1 - - <1CH4 24000 630 <1 2100 - <1 27000aromatic HC not specified elsewhere <1 - 1 13 - <1 14polycyclic hydrocarbons (PAH) <1 <1 <1 2 - - 2NMVOC <1 - <1 6 - - 6CS2 <1 - <1 2 - - 2methylene chloride CH2Cl2 <1 - <1 <1 - - <1Cu+compounds as Cu <1 <1 <1 <1 - - <1As+compounds as As - - - <1 - - <1Cd+compounds as Cd <1 - <1 <1 - - <1Ag+compounds as Ag - - - <1 - - <1Zn+compounds as Zn <1 - <1 <1 - - <1Cr+compounds as Cr <1 <1 <1 <1 - - <1Se+compounds as Se - - - <1 - - <1Ni+compounds as Ni <1 <1 <1 <1 - - <1Sb+compounds as Sb - - <1 <1 - - <1ethylene C2H4 - - <1 1 - - 1oxygen - - - <1 - - <1asbestos - - - <1 - - <1dioxin/furan as Teq - - - <1 - - <1benzene C6H6 - - - <1 - <1 <1toluene C7H8 - - - <1 - <1 <1xylenes C8H10 - - - <1 - <1 <1ethylbenzene C8H10 - - - <1 - <1 <1styrene - - - <1 - <1 <1propylene - - - 1 - - 1
13
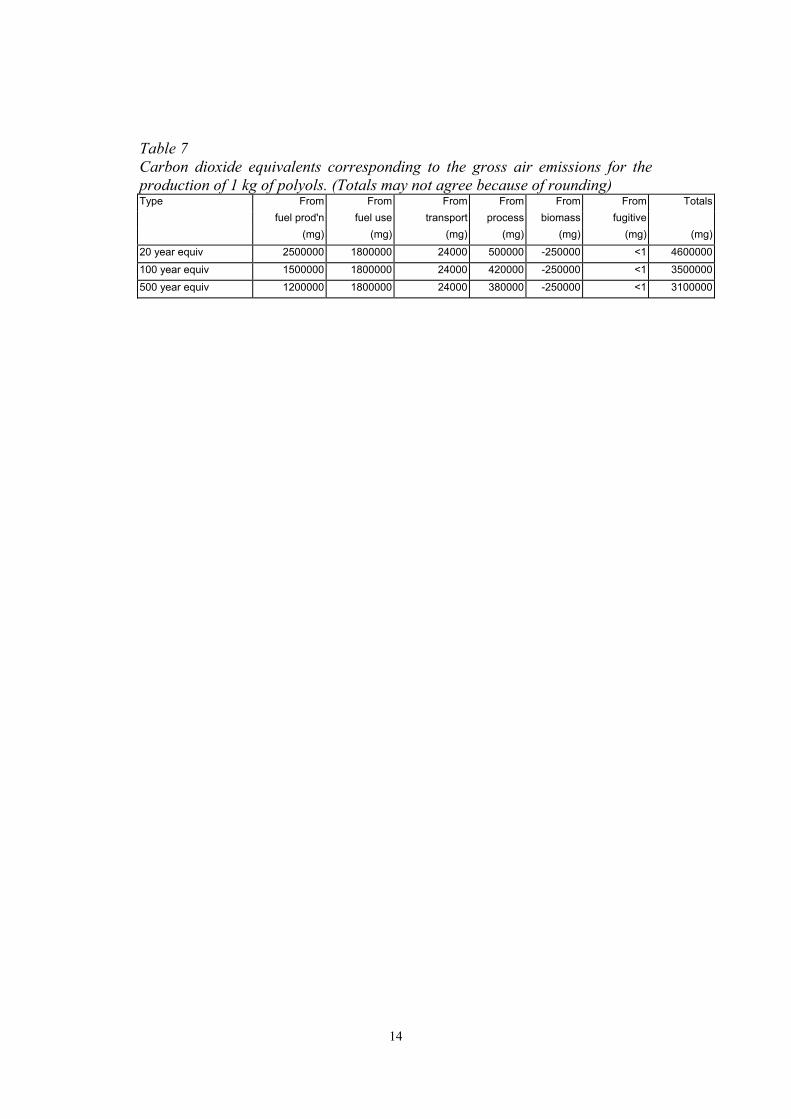
Table 7 Carbon dioxide equivalents corresponding to the gross air emissions for the production of 1 kg of polyols. (Totals may not agree because of rounding) Type From From From From From From Totals fuel prod'n fuel use transport process biomass fugitive (mg) (mg) (mg) (mg) (mg) (mg) (mg)
20 year equiv 2500000 1800000 24000 500000 -250000 <1 4600000100 year equiv 1500000 1800000 24000 420000 -250000 <1 3500000500 year equiv 1200000 1800000 24000 380000 -250000 <1 3100000
14

Table 8 Gross emissions to water arising from the production of 1 kg of polyols. (Totals may not agree because of rounding). Emission From From From From Totals fuel prod'n fuel use transport process (mg) (mg) (mg) (mg) (mg) COD 3 <1 <1 3600 3600 BOD <1 <1 <1 670 670 Pb+compounds as Pb <1 - <1 <1 <1 Fe+compounds as Fe <1 - <1 11 11 Na+compounds as Na <1 - <1 600000 600000 acid as H+ 3 - <1 3 6 NO3- <1 <1 <1 6000 6000 Hg+compounds as Hg <1 - <1 <1 <1 metals not specified elsewhere 1 - <1 58 58 ammonium compounds as NH4+ 3 <1 <1 4 7 Cl- 1 <1 <1 1100000 1100000 CN- <1 - <1 <1 <1 F- <1 - <1 1 1 S+sulphides as S <1 - <1 <1 <1 dissolved organics (non- <1 - <1 240 240 suspended solids 77 - 27 55000 55000 detergent/oil <1 <1 <1 4 4 hydrocarbons not specified 10 <1 <1 2 12 organo-chlorine not specified <1 - <1 1 1 dissolved chlorine <1 - <1 1 1 phenols <1 - <1 <1 <1 dissolved solids not specified <1 - <1 8600 8600 P+compounds as P <1 <1 <1 960 960 other nitrogen as N 1 <1 <1 2200 2200 other organics not specified <1 - <1 320 320 SO4-- <1 <1 <1 4000 4000 dichloroethane (DCE) <1 - <1 <1 <1 vinyl chloride monomer (VCM) <1 - <1 <1 <1 K+compounds as K <1 - <1 170 170 Ca+compounds as Ca <1 - <1 150000 150000 Mg+compounds as Mg <1 - <1 210 210 Cr+compounds as Cr <1 - <1 10 10 ClO3-- <1 - <1 130 130 BrO3-- <1 - <1 <1 <1 TOC <1 - <1 980 980 AOX <1 - <1 32 32 Al+compounds as Al <1 - <1 1 1 Zn+compounds as Zn <1 - <1 2 2 Cu+compounds as Cu <1 - <1 <1 <1 Ni+compounds as Ni <1 - <1 <1 <1 CO3-- - - <1 2300 2300 As+compounds as As - - <1 <1 <1 Cd+compounds as Cd - - <1 <1 <1 Mn+compounds as Mn - - <1 <1 <1 organo-tin as Sn - - <1 <1 <1 Sr+compounds as Sr - - <1 <1 <1 organo-silicon - - - <1 <1 benzene - - - <1 <1 dioxin/furan as Teq - - <1 <1 <1 Mo+compounds as Mo - - - <1 <1
15

Table 9 Gross solid waste associated with the production of 1 kg of polyols. (Totals may not agree because of rounding) Emission From From From From Totals fuel prod'n fuel use transport process (mg) (mg) (mg) (mg) (mg)
Plastic containers <1 - <1 <1 <1 Paper <1 - <1 1 1 Plastics <1 - <1 220 220 Metals <1 - <1 110 110 Putrescibles <1 - <1 <1 <1 Unspecified refuse 1200 - <1 <1 1200 Mineral waste 6300 - 270 150000 160000 Slags & ash 23000 8000 100 3400 34000 Mixed industrial -3800 - 11 33000 29000 Regulated chemicals 1500 - <1 45000 46000 Unregulated chemicals 1100 - <1 10000 12000 Construction waste <1 - <1 90 90 Waste to incinerator <1 <1 <1 13000 13000 Inert chemical <1 - <1 590 590 Wood waste <1 - <1 10 10 Wooden pallets <1 - <1 <1 <1 Waste to recycling <1 - <1 170 180 Waste returned to mine 54000 - 10 1600 55000 Tailings 2 - 9 330 340 Municipal solid waste -14000 - - 1 -14000 Note: Negative values correspond to consumption of waste e.g. recycling or use in electricity generation.
16

Table 10 Gross solid waste in EU format associated with the production of 1 kg of polyols. Entries marked with an asterisk (*) are considered hazardous as defined by EU Directive 91/689/EEC Emission Totals (mg)010101 metallic min'l excav'n waste 100000010102 non-metal min'l excav'n waste 100000010306 non 010304/010305 tailings 330010308 non-010307 powdery wastes 10010399 unspecified met. min'l wastes 31000010408 non-010407 gravel/crushed rock 1010410 non-010407 powdery wastes 62010411 non-010407 potash/rock salt 2100010499 unsp'd non-met. waste 5900010505*oil-bearing drilling mud/waste 1400010508 non-010504/010505 chloride mud 1100010599 unspecified drilling mud/waste 1200020107 wastes from forestry 10030399 unsp'd wood/paper waste 1050106*oil ind. oily maint'e sludges 12050107*oil industry acid tars 170050199 unspecified oil industry waste 250050699 coal pyrolysis unsp'd waste 69060101*H2SO4/H2SO3 MFSU waste 5060102*HCl MFSU waste <1060106*other acidic MFSU waste <1060199 unsp'd acid MFSU waste <1060204*NaOH/KOH MFSU waste <1060299 unsp'd base MFSU waste 2800060313*h. metal salt/sol'n MFSU waste 3000060314 other salt/sol'n MFSU waste 430060399 unsp'd salt/sol'n MFSU waste 1000060404*Hg MSFU waste 160060405*other h. metal MFSU waste 540060499 unsp'd metallic MFSU waste 1200060602*dangerous sulphide MFSU waste <1060603 non-060602 sulphide MFSU waste 4060701*halogen electrol. asbestos waste 41060702*Cl pr. activated C waste <1060703*BaSO4 sludge with Hg 17060704*halogen pr. acids and sol'ns 69060799 unsp'd halogen pr. waste 1300061002*N ind. dangerous sub. waste <1061099 unsp'd N industry waste <1070101*organic chem. aqueous washes 330070103*org. halogenated solv'ts/washes <1070104*other organic solv'ts/washes <1070107*hal'd still bottoms/residues 51000070108*other still bottoms/residues 5300070111*org. chem. dan. eff. sludge <1070112 non-070111 effluent sludge 2
continued over …..
17

Table 10 - continued Gross solid waste in EU format associated with the production of 1 kg of polyols. Entries marked with an asterisk (*) are considered hazardous as defined by EU Directive 91/689/EEC 070199 unsp'd organic chem. waste 5800070204*polymer ind. other washes <1070207*polymer ind. hal'd still waste <1070208*polymer ind. other still waste 170070209*polymer ind. hal'd fil. cakes <1070213 polymer ind. waste plastic 72070214*polymer ind. dan. additives 160070215 non-0702130 additive waste <1070216 polymer ind. silicone wastes <1070299 unsp'd polymer ind. waste 170080199 unspecified paint/varnish waste <1100101 non-100104 ash, slag & dust 29000100102 coal fly ash 1400100104*oil fly ash and boiler dust 110100105 FGD Ca-based reac. solid waste <1100113*emulsified hyrdocarbon fly ash 30100114*dangerous co-incin'n ash/slag 14100115 non-100115 co-incin'n ash/slag 110100116*dangerous co-incin'n fly ash <1100199 unsp'd themal process waste 470100202 unprocessed iron/steel slag 410100210 iron/steel mill scales 18100399 unspecified aluminium waste 30100501 primary/secondary zinc slags 1100504 zinc pr. other dust <1100511 non-100511 Zn pr. skimmings <1100899 unspecified o.n.f.m. waste <1101304 lime calcin'n/hydration waste 12110199 unspecified surf. t waste <1130208*other engine/gear/lub. oil <1150101 paper and cardboard packaging 1150102 plastic packaging <1150103 wooden packaging <1150106 mixed packaging 73150110*dan. sub. contam'd packaging <1150202*dan. sub. absorbents <1160807*spent dangerous sub. catalyst <1170107 non-170106 con'e/brick/tile mix <1170405 iron and steel <1170904 non-170901/2/3 con./dem'n waste 90190199 unspecified incin'n/pyro waste <1190905 sat./spent ion exchange resins 590200101 paper and cardboard <1200108 biodeg. kitchen/canteen waste <1200138 non-200137 wood <1200139 plastics 140200140 metals 110200199 other separately coll. frac'ns -5000200301 mixed municipal waste 130200399 unspecified municipal wastes -12000Note: Negative values correspond to consumption of waste e.g. recycling or use in electricity generation.
18
European Diisocyanate and Polyol Producers Association Avenue E. van Nieuwenhuyse Laan 4, 1160 Brussels Belgium Tel: ++32 2 676 7475 Fax: ++32 2 676 7479 Email: [email protected] Website: www.isopa.org ISOPA is an affiliated organisation within the European Chemical Industry Council (Cefic)
Association of Plastics Manufacturers in Europe Avenue E. van Nieuwenhuyse Laan 4, 1160 Brussels Belgium Tel: ++32 2 675 32 97 Fax: ++32 2 675 39 35 Website: www.plasticseurope.org The information contained in this publication is, to the best of our knowledge, true and accurate, but any recommendation or suggestions which may be made are without guarantee, since the conditions of use and the composition of source materials are beyond our control. Furthermore, nothing contained herein shall be construed as a recommendation to use any product in conflict with existing patents covering any material or its use.
19