ECO 311 RESEARCH METHODS - nou.edu.ng!
158
ii ECO 311 RESEARCH METHODS Course Team NATIONAL OPEN UNIVERSITY OF NIGERIA COURSE GUIDE OHIOZE, Wilson Friday (Course Developer) - NOUN Dr. Medunoye, Peter (Course Editor) - Research and Planning Unit, Alausa – Lagos State
Transcript of ECO 311 RESEARCH METHODS - nou.edu.ng!

ii
ECO 311
RESEARCH METHODS
Course Team
NATIONAL OPEN UNIVERSITY OF NIGERIA
COURSE
GUIDE
OHIOZE, Wilson Friday (Course Developer) - NOUN Dr. Medunoye, Peter (Course Editor) - Research and
Planning Unit, Alausa – Lagos State

iii
© 2018 by NOUN Press National Open University of Nigeria Headquarters University Village Plot 91, Cadastral Zone Nnamdi Azikiwe Expressway Jabi, Abuja Lagos Office 14/16 Ahmadu Bello Way Victoria Island, Lagos E-mail: [email protected] URL: www.nou.edu.ng All rights reserved. No part of this book may be reproduced, in any form or by any means, without permission in writing from the publisher. Printed 2018 Printed by NOUN PRESS [email protected] ISBN: 978-978-970-001-1

iv
CONTENTS PAGE
Introduction v Course Content v Course Aims v Course Objectives v Working through This Course vi Course Materials viii Study Units viii Textbooks and References viii Assignment File viii Presentation Schedule ix Assessment ix Tutor-Marked Assignment (TMAs) ix Final Examination and Grading ix Course Marking Scheme x Course Overview x Getting the Most from This Course xi Tutors and Tutorials xiii Summary xiii

v
INTRODUCTION ECO 311: Research Methods is a three-credit and one-semester undergraduate course for Economics student. The course is made up of 19 units spread across 15-lecture weeks. This course guide tells you how important research is to students of economics, and how statistical tools can be applied in solving some basic economic problems. It tells you about the course materials and how you can work your way through these materials. It suggests some general guidelines for the amount of time required of you on each unit in order to achieve the course aims and objectives successfully. COURSE CONTENT This course is basically an introductory course on Research Methods. The topics covered includes definition and meaning of research, focus of research, the research problem, nature of research, data acquisition, data classification, data summarization, information in research, statistical sampling I&II, sampling distribution of mean and proportion, simple estimation, concept of hypothesis, significance level, hypothesis testing, other test of hypothesis, concept of ethics and report writing. As it is, the course will take you through the definition of research to research report writing. COURSE AIMS The aims of this course is to give you in-depth understanding of Research Methods as regards:
i. Fundamental concept and practices of research methods ii. To familiarize students with the purpose and problems inherent in research
issues.
iii. To stimulate students’ understanding of decision making using research methods.
iv. To explain to the students, the use of data in research and how they are sourced.
v. To expose the students to ethics and report writing in research.
COURSE OBJECTIVES To achieve the aims of this course, there are overall objectives which the course is out to achieve though, there are set out objectives for each unit. The unit objectives are included at the beginning of a unit; you should read them before you start working through the unit. You may want to refer to them during your study of the units to check on your progress. You should always look at each unit objectives after completing any. This is to assist you in accomplishing the tasks involved in this course. In this way, you can be sure you have done what was required of you by the units. The objectives serve as study guides; such that student could know if he/she is able to grab an understanding of each unit through the sets objectives. By the end of the course period, you are expected to be able to:

vi
• define research, state it’s important and discuss the problems of research • define data, identify the various sources, explain the data collection
methods, and its measurement • explain data classification, summarization, and its importance to
economics • discuss also the methods of data classification and summarization such as
frequency, pie charts, measures of centre tendencies and dispersions • explain what sampling theory is all about, and the difference between
sample and population in research issues • explain what constitute population in research methods • distinguish between census and samples, and identify the various modes of
sampling • discuss sampling distribution about mean and proportion • examine the applicability of central limit theorem to mean and proportion,
and the essence of expected value and standard deviation in real life situation
• analyse the essence of estimation as a tool of statistical inference, the types, and their properties
• explain the concept of hypothesis and its application in research to arrive at dependable outcomes
• discuss the ethical issues in research, the roles it plays
• discuss research report writing.
WORKING THROUGH THE COURSE To successfully complete this course, you are required to read the study units, referenced books and other materials on the course. Each unit contains self-assessment exercises called Self-Assessment Exercises (SAE). At some points in the course, you will be required to submit assignments for assessment purposes. At the end of the course there is a final examination. This course should take about 15weeks to complete and some components of the course are outlined under the course material subsection.
Course Material The major component of the course, what you have to do and how you should allocate your time to each unit in order to complete the course successfully on time are listed below: 1. Course guide 2. Study unit 3. Textbook 4. Assignment file 5. Presentation schedule

vii
Study Unit There are 19 units in this course which should be studied carefully and thoroughly. Module 1 Concept and Nature of Research Methods Unit 1: Definition and Meaning of Research Unit 2: Focus of Research Unit 3: Research Problem Module 2 Research Writing Unit 1: Research Topic Unit 2: Literature Review Unit 3: Theoretical and Conceptual Frameworks in Research Module 3Data Analysis in Research Unit 1: Collating Data for Presentation Unit 2: Data Collecting Scales Unit 3: Operationalizing and Data Analysis Module 4 A Guide to Statistics in Research Unit 1 Descriptive Statistics Unit 2 Test in Statistical Analysis Unit 3 Central of Tendency and other Higher test in Statistics Module 5 Managing a Research Project: The Research Proposal & Report Unit 1: Planning the Research Project Unit 2: Concepts of Ethics Unit 3: Report Writing Module 6 Referencing System in a Research Report Unit 1: Referencing System Unit 2: Different Citation Links Unit 3: The Reference List/Type Each study unit will take at least two hours, and it include the introduction, objective, main content, self-assessment exercise, conclusion, summary and reference. Other areas border on the Tutor-Marked Assessment (TMA) questions. Some of the self-assessment exercise will necessitate discussion, brainstorming and argument with some of your colleges. You are advised to do so in order to understand and get acquainted with historical economic event as well as notable periods. There are also textbooks under the reference and other (on-line and off-line) resources for further reading. They are meant to give you additional information if only you can lay your hands on any of them. You are required to study the materials; practice the self-assessment exercise and tutor-marked assignment (TMA) questions for greater and in-depth understanding of the course. By doing so, the stated learning objectives of the course would have been achieved.

viii
TEXTBOOK AND REFERENCES For further reading and more detailed information about the course, the following materials are recommended: Aborisade, F. (1997). A Student Handbook. Ibadan. Adegoke, N (2012), Research Methods in Social Sciences. Lagos: Prime Target
Limited. Adeleke, J.O (2010). The Basics of Research and Evaluation Tools.Ogba, Lagos:
Somerest Ventures. Anaekwe, M.C. (2002). Basic Research Methods and Statistics in Education and
Social Sciences. Enugu: Podiks Printing and Publishing Company. Asika, N. (1991). Research Methodology in the Behavioral Sciences. Longman Nig.
Plc, pp90. Babbie, (2001). The Practice of Social Research. Balmont: Wardsowrth Publishing Company Best, J.W. & Ali, A. (1983). Research in Education (7thed.). New Delhi: Prentice
Hall of India, 20-23. Best, J.W.& Kahn, J.V. (2006). Research in Education. Boston: Pearson Education
Inc. Ghosh, B. (1992). Scientific Method and Social Research. New Delhi: Sterling
Educational Publishers: pp183-198. Emeka, I. A. (2004). Basic Steps for Quality Research Projects. Lagos: Noble-Alpha
International. Ikekhua, T.I. & Yesufu, J.F. (1995). Exposing Research Methods in Education Study
and Reporting Aid for Students and Beginning Researchers. Warri: Ar B10 Publishing Limited.
Nkpa, N. (1997). Educational Research for Modern Schikars. Enugu: Fourth Dimension Publishers. Olaitan, S.O. & Nwoke, G.I. (1988). Practical Research Methods in Education. Onitsha: Summer. Osuala, E.C. (1982).Introduction to Research Methodology. Onitsha: Africana-Fep
Publisher. Ujo, A.A. (2000). Understanding Social Research in Nigeria: A non-Quantitative Approach. Nigerian Joyce publishers, pp28 34. ASSIGNMENT FILE Assignment files and marking scheme will be made available to you. This file presents you with details of the work you must submit to your tutor for marking. The marks you obtain from these assignments shall form part of your final mark for this course. Additional information on assignments will be found in the assignment file and later in this Course Guide in the section on assessment. There are four assignments in this course. The four course assignments will cover: Assignment 1 - All TMAs’ question in Units 1 – 8 (Modules 1and 2) Assignment 2 - All TMAs' question in Units 9 – 17 (Module 3 and 4) Assignment 3 - All TMAs' question in Units 18 – 19 (Module 5)

ix
PRESENTATION SCHEDULE The presentation schedule included in your course materials gives you the important dates for this year for the completion of tutor-marking assignments and attending tutorials. Remember, you are required to submit all your assignments by due dates. You are to guide against falling behind in your work. ASSESSMENT There are two types of assessment in this course. First are the tutor-marked assignments; second, there is a written examination. In attempting the assignments, you are expected to apply information, knowledge and techniques gathered during the course. The assignments must be submitted to your tutor for formal assessment in accordance with the deadlines stated in the Presentation Schedule and the Assignments File. The work you submit to your tutor for assessment will count for 30 % of your total course mark. At the end of the course, you will need to sit for a final written examination of three-hour duration. This examination will also count for 70% of your total course mark. TUTOR-MARKED ASSIGNMENTS (TMAs) There are four tutor-marked assignments in this course. You will submit all the assignments. You are encouraged to work all the questions thoroughly. The TMAs constitute 30% of the total score. Assignment questions for the units in this course are contained in the Assignment File. You will be able to complete your assignments from the information and materials contained in your set books, reading and study units. However, it is desirable that you demonstrate that you have read and researched more widely than the required minimum. You should use other references to have a broad viewpoint of the subject and also to give you a deeper understanding of the subject. When you have completed each assignment, send it, together with a TMA form, to your tutor. Make sure that each assignment reaches your tutor on or before the deadline given in the Presentation File. If for any reason, you cannot complete your work on time, contact your tutor before the assignment is due to discuss the possibility of an extension. Extensions will not be granted after the due date unless there are exceptional circumstances. FINAL EXAMINATION AND GRADING The final examination will be of three-hour duration and have a mark of 70% of the total course grade. The examination will consist of questions which reflect the types of self-assessment practice exercises and tutor-marked problems you have previously encountered. All areas of the course will be assessed Revise the entire course material using the time between finishing the last unit in the module and that of sitting for the final examination to. You might find it useful to

x
review your self-assessment exercises, tutor-marked assignments and comments on them before the examination. The final examination covers information from all parts of the course. COURSE MARKING SCHEME The Table presented below indicates the total marks (100%) allocation. Assignment Marks Assignments (Best three assignments out of four that is marked)
30%
Final Examination 70% Total 100% Course Overview The Table presented below indicates the units, number of weeks and assignments to be taken by you to successfully complete the course, Research Methods (ECO 311). Units Title of Work Week’s
Activities Assessment (end of unit)
Course Guide Module 1Concept and Nature of Research Methods 1 Definition and Meaning of Research Week 1 Assignment 1 2 Focus of Research Week 1 Assignment 3 3 Research Problems Week 2 Assignment 3 Module 2Research Writing 1 Research Topic Week 3 Assignment 3 2 Literature Review Week 3 Assignment 3 3 Theoretical and Conceptual
Framework in Research Week 3 Assignment 3
Module 3Data Analysis in Research 1 Collating Data for Presentation Week 4 Assignment 3 2 Data Collection Scales Week 5 Assignment 2 3 Operationalizing & Data Analysis Week 5 Assignment 2 Module 4 A Guide to Statistics in
Research
1 Descriptive Statistics 2 Test in Statistical Analysis 3 Central of Tendency and other Higher
Test in Statistics
Module 5 Managing a Research Project 1 Planning the Research Project Week 6 Assignment 2 2 Concept of Ethics Week 7 Assignment 2 3 Report Writing Week 8 Assignment 2

xi
Module 6 Referencing System in a Research Report 1 Referencing System Week 12 Assignment 2 2 Different Citation Links Week 13 Assignment 3 3 The Reference List/Types Total 13 Weeks GETTING THE MOST FROM THIS COURSE In distance learning the study units replace the university lecturer. This is one of the great advantages of distance learning; you can read and work through specially designed study materials at your own pace and at a time and place that suit you best. Think of it as reading the lecture instead of listening to a lecturer. In the same way that a lecturer might set you some reading to do, the study units tell you when to read your books or other material, and when to embark on discussion with your colleagues. Just as a lecturer might give you an in-class exercise, your study units provides exercises for you to do at appropriate points. Each of the study units follows a common format. The first item is an introduction to the subject matter of the unit and how a particular unit is integrated with the other units and the course as a whole. Next is a set of learning objectives. These objectives let you know what you should be able to do by the time you have completed the unit. You should use these objectives to guide your study. When you have finished the unit you must go back and check whether you have achieved the objectives. If you make a habit of doing this, you will significantly improve your chances of passing the course and getting the best grade. The main body of the unit guides you through the required reading from other sources. This will usually be either from your set books or from a readings section. Some units require you to undertake practical overview of historical events. You will be directed when you need to embark on discussion and guided through the tasks you must do. The purpose of the practical overview of some certain historical economic issues are in twofold. First, it will enhance your understanding of the material in the unit. Second, it will give you practical experience and skills to evaluate economic arguments, and understand the roles of history in guiding current economic policies and debates outside your studies. In any event, most of the critical thinking skills you will develop during studying are applicable in normal working practice, so it is important that you encounter them during your studies. Self-assessments are interspersed throughout the units, and answers are given at the ends of the units. Working through these tests will help you to achieve the objectives of the unit and prepare you for the assignments and the examination. You should do each self-assessment exercises as you come to it in the study unit. Also, ensure to master some major historical dates and events during the course of studying the material. The following is a practical strategy for working through the course. If you run into

xii
any trouble, consult your tutor. Remember that your tutor's job is to help you. When you need help, don't hesitate to call and ask your tutor to provide the assistance.
1. Read this Course Guide thoroughly. 2. Organize a study schedule. Refer to the `Course overview' for more details.
Note the time you are expected to spend on each unit and how the assignments relate to the units. Important information, e.g. details of your tutorials, and the date of the first day of the semester is available from study centre. You need to gather together all this information in one place, such as your dairy or a wall calendar. Whatever method you choose to use, you should decide on and write in your own dates for working breach unit.
3. Once you have created your own study schedule, do everything you can to stick to it. The major reason that students fail is that they get behind with their course work. If you get into difficulties with your schedule, please let your tutor know before it is too late for help.
4. Turn to Unit 1 and read the introduction and the objectives for the unit. 5. Assemble the study materials. Information about what you need for a unit is
given in the `Overview' at the beginning of each unit. You will also need both the study unit you are working on and one of your set books on your desk at the same time.
6. Work through the unit. The content of the unit itself has been arranged to provide a sequence for you to follow. As you work through the unit you will be instructed to read sections from your set books or other articles. Use the unit to guide your reading.
7. Up-to-date course information will be continuously delivered to you at the study centre.
8. Work before the relevant due date (about 4 weeks before due dates), get the Assignment File for the next required assignment. Keep in mind that you will learn a lot by doing the assignments carefully. They have been designed to help you meet the objectives of the course and, therefore, will help you pass the exam. Submit all assignments no later than the due date.
9. Review the objectives for each study unit to confirm that you have achieved them. If you feel unsure about any of the objectives, review the study material or consult your tutor.
10. When you are confident that you have achieved a unit's objectives, you can then start on the next unit. Proceed unit by unit through the course and try to pace your study so that you keep yourself on schedule.
11. When you have submitted an assignment to your tutor for marking do not wait for it return `before starting on the next units. Keep to your schedule. When the assignment is returned, pay particular attention to your tutor's comments, both on the tutor-marked assignment form and also written on the assignment. Consult your tutor as soon as possible if you have any questions or problems.
12. After completing the last unit, review the course and prepare yourself for the final examination. Check that you have achieved the unit objectives (listed at the beginning of each unit) and the course objectives (listed in this Course Guide).

xiii
TUTORS AND TUTORIALS There are some hours of tutorials (2-hours sessions) provided in support of this course. You will be notified of the dates, times and location of these tutorials. Together with the name and phone number of your tutor, as soon as you are allocated a tutorial group. Your tutor will mark and comment on your assignments, keep a close watch on your progress and on any difficulties you might encounter, and provide assistance to you during the course. You must mail your tutor-marked assignments to your tutor well before the due date (at least two working days are required). They will be marked by your tutor and returned to you as soon as possible. Do not hesitate to contact your tutor by telephone, e-mail, or discussion board if you need help. The following might be circumstances in which you would find help necessary. Contact your tutor if you. • do not understand any part of the study units or the assigned readings • have difficulty with the self-assessment exercises • have a question or problem with an assignment, with your tutor's comments on an assignment or with the grading of an assignment. You should try your best to attend the tutorials. This is the only chance to have face to face contact with your tutor and to ask questions which are answered instantly. You can raise any problem encountered in the course of your study. To gain the maximum benefit from course tutorials, prepare a question list before attending them. You will learn a lot from participating in discussions actively. SUMMARY The course, Research Methods (ECO 311), exposes you to the basic concept of research methods wherein issues like definition and meaning of research, focus of research, the research problem, nature of research, data acquisition, data classification, data summarization, information in research, statistical sampling I&II, sampling distribution of mean and proportion, simple estimation, concept of hypothesis, significance level, hypothesis testing, other test of hypothesis, concept of ethics and report writing, will be discussed. Thereafter it shall enlighten you about decision making as regard fundamental economic problems in the society. On successful completion of the course, you would have developed critical research skills with the material necessary for efficient and effective discussion of research issues. However, to gain a lot from the course please try to apply whatever you learn in the course to term papers writing in other aspect of economics courses. We wish you success with the course and hope that you will find it fascinating and handy.

xiv
CONTENTS PAGE Module 1 Concept and Nature of Research Methods 1 Unit 1: Definition and Meaning of Research 1 Unit 2: Focus of Research 7 Unit 3: Research Problem 15 Module 2 Research Writing 20 Unit 1: Research Topic 20 Unit 2: Literature Review 27 Unit 3: Theoretical and Conceptual Frameworks in Research 33 Module 3 Data Analysis in Research 40 Unit 1: Collating Data for Presentation 40 Unit 2: Data Collecting Scales 53 Unit 3: Operationalizing and Data Analysis 60 Module 4 A Guide to Statistics in Research 65 Unit 1 Descriptive Statistics 65 Unit 2 Test in Statistical Analysis 92 Unit 3 Central of Tendency and other Higher Test in Statistics 106 Module 5 Managing a Research Project: The Research
Proposal & Report 118 Unit 1: Planning the Research Project 118 Unit 2: Concepts of Ethics 123 Unit 3: Report Writing 130 Module 6 Referencing System in a Research Report 137 Unit 1: Referencing System 137 Unit 2: Different Citation Links 140 Unit 3: The Reference List/Type 143

1
MODULE 1 CONCEPT AND NATURE OF RESEARCH METHO DS
Unit 1: Definit ion and Meaning of Research
Unit 2: Focus of Research
Unit 3: Research Problems
UNIT I DEFINITION AND MEANING OF RESEARCH
CONTENTS
1.0 Introduction 2.0 Objectives 3.0 Main content
3.1 Meaning of Research 3.2 Economic Research 3.3 Characteristics of Research 3.4 Purposes of Research
4.0 Conclusion 5.0 Summary 6.0 Tutor Marked Assignment 7.0 References and Further Readings
1.0 INTRODUCTION You may be quest ioning in your mind what research is about. You May also have been thinking that research as something out of the normal, not meant for the use of the layman in the society. You may have seen research, just like every other person, as something which carr ies with it the not ion of act ivity usually engaged in by the intelligent, and beyond the capability of the average individual. If you are among the many people who see research as something which is done mainly by persons who are refined, and/or an activity exclusively left for Scholars in the higher institutions of learning, we can confidently say that you have been having the wrong notion.In this piece, you will be exposed to some views about research as an activity which is not far from the routine ritual of all normal thinking of human being. You will see researchby and large as a process of finding out answers to a number of problems. As a result of this, you will understand and see research as a task which is useful. 2.0 OBJECTIVES By the end of this unit, you will be able to:
• explain and conceptually define research • discuss features of research • explain the purposes of research

2
3.0 MAIN CONTENT
3.1 Meaning of Research
Research has been described by many scholars in a lot of ways, according to types and areas. Research is the process of applying reliable solutions to problems through a planned and systematic collection, analysis and interpretation of data (Osuala, 1982). The key words in Osuala’s definition are planned and systematic, and they are vital in the understanding of what research is about. It then implies that; research is considered as a logical scientific thinking. This shows that any study that is undertaken by any person cannot be regarded as a research until it is subjected to some scientific methods of doing research (i.e. following the rules of carrying out researches).
Research can also be considered as a process of seeking answers to imaginary questions using scientific methods of inquiry to produce good result. It therefore shows that, when you use scientific methods of research to solve problems, your outcomes will be more efficient than the one arrived at using either trial-and-error attempts or “short-run” approaches. In this case, the researcher may have violated the rules guiding research organization.
According to Leedy (1997) research is the systematic process of collecting and analyzing information (data) in order to increase our understanding of the phenomenon with which we are concerned or interested. Leedy states further to show what research is not about. That it is not:
• mere information gathering; • mere transformation of facts from one location to another; • mere searching for information; • a catch-word used to get information.
According to Best and Kahn (1995), research is the systematic and objective analysis and recording of controlled observations that may lead to the development of generalizations, principles or theories, resulting in prediction and possibly ultimate control of events. In line with Best and Kahn’s opinion, Fagboungbe (1993) defines research as a quest for new knowledge pertinent to identified interest or problem through the application of the scientific approach or process of investigation.
3.2 Significance of Research
All progress is born of inquiry. Doubt is often better than overconfidence, for this leads to inquiry, and inquiry leads to invention. Increased amounts of research make progress possible. Under this context, the significance of research can better be understood. Explained below are some of the major significances of research:
• The role of research in several fields of applied economics, whether related to business or to the economy as a whole, has greatly increased in modern times. The increasingly complex nature of business and government has focused attention on the use of research in solving operational problems. Research, as an aid to economic policy, has gained added importance, both for government and business.
• Research provides the basis for nearly all government policies in our economic
system. For instance, government’s budgets rest in part on an analysis of the needs and desires of the people and on the availability of revenues to meet these needs. The cost of needs has to be equated to probable revenues and this is an aspect where research is mostly welcomed. Through research we can devise alternative policies and

3
can as well examine the consequences of each of these alternatives. Decision-making may not be a part of research, but research certainly facilitates the decisions of the policy maker. Government has also to chalk out programmes for dealing with all facets of the country’s existence and most of these will be related directly or indirectly to economic conditions. The plight of cultivators, the problems of big and small business and industry, working conditions, trade union activities, the problems of distribution, even the size and nature of defence services are matters requiring investigation. Thus, research is considered necessary with regard to the allocation of nations’ resources.
• Research has its special significance in solving various operational and planning
problems of business and industry. Operations research and market research, along with motivational research, are considered crucial and their results assist, in more than one way, in taking business decisions. Market research is the investigation of the structure and development of a market for the purpose of formulating efficient policies for purchasing, production and sales. Operations research refers to the application of mathematical, logical and analytical techniques to the solution of business problems of cost minimization or of profit maximization or the combination of the two called optimization problems. Motivational research of determining why people behave as they do is mainly concerned with market characteristics. In other words, it is concerned with the determination of drives underlying the consumer (market) behaviour. All these are of great help to people in business and industry who are responsible for business decisions making. Research with regard to demand and market factors has great utility in business. Given knowledge of future demand, it is generally not difficult for a firm, or for an industry to alter its supply schedule within the bounds of its anticipated capacity. Market analysis has become an essential device of making business policy these days. Business budgeting, which eventually results in a projected profit and loss account, is founded primarily on sales estimates which in turn depend on business research. Once an organization is able to project her sales, efficient production and investment programmes can be planned, this will include the purchasing and financing plans. Research, thus, replaces intuitive business decisions by more logical and scientific decisions.
• Research is equally significant for social scientists in studying social relationships and
in seeking answers to various social problems. It provides the intellectual satisfaction of knowing a few things just for the sake of knowledge and also, it has practical utility for the social scientist to know for the sake of being able to do something better or in a more efficient manner. Research in social sciences is concerned with both knowledge for its own sake and knowledge for what it can contribute to practical concerns. “This double emphasis is perhaps especially appropriate in the case of social science.” On the one hand, its responsibility as a science is to develop a body of principles that make possible the understanding and prediction of the whole range of human interactions. On the other hand, because of its social orientation, it is increasingly being looked to for practical guidance in solving immediate problems of human relations.
3.3 Objectives of Research The purpose of any research is to find solutions to problems through the application of scientific procedures. The main purpose of research is to find out the truth which is not

4
known and which is yet to be revealed. Though each research study has its own specific purpose, we may think of research objectives as falling into a number of groups. These include:
• To gain acquaintance with a phenomenon or to have understandings into it (studies with this object in mind are tagged exploratory or formativeresearch);
• To show accurately the features of a particular individual, situation or a group (studies with this objective are known as descriptiveresearch);
• To determine the rate at which something occurs or with which it is associated with something else (studies with this kind of objective in view are known as diagnosticresearch);
• To test a hypothesis of a causal relationship between two or more variables (such studies are referred to as hypothesis-testingresearch).
.
3.4 Characteristics of Research
According to Leedy (1997), Research is not mere collect ion of facts, whether from reference books, from the library, from historical documents, from questionnaire or even from the internet. However, it is when the information gotten from such exercise is organized in such a way to proffer solutions to the problem it is intended to resolve. In view of this, let consider some basic features of research. Anaekwe (2002) listed and explained some basic features of research. These include:
• It is Systematic in nature: That is, the steps taken in carrying out research have to be sequent ial and logical. And these steps can be repeated by another researcher to ascertain the outcomes of the earlier investigation.
• It is objective: This means that data gathered are recorded and presented as obtained. The biases, prejudices, beliefs or interests of the researcher and/or the society are not allowed to affect the research result.
• Its report is precise: Research report does not encourage the use of words that are capable of giving multiple interpretations and misleading outcomes.
• It is tested/measured: Research is not speculative, but definite. It is therefore
imperative that data collected for research must be measurable and tested against a specified hypothesis.
• It is replicated/ verifiable: Results or findings of a research can be verified by
another researcher that is interested in the report. This can be done by going through the data used in the study or the processes involved. The research can be replicated by re-administering the same instrument or similar instrument of data collection to the same subjects or similar group of subjects. Replication of research allows for the authenticity or otherwise of the former outcome.
Inaddition to those features explained above as given by Anaekwe (2002), Best and Kahn (1995), also discussed the characteristics of research to make clearer the meaning of research. According to the duo, the basic features of are as follows:
(i) Research emphasizes the development of generalizations, principles or theories that will be helpful in predicting future occurrences.
(ii) Research is based upon observable experience or empirical evidence. Research

5
demands accurate observation and description (iii)Research involves gathering new data from primary or first-hand source or using
existing data for a new purpose (iv) Research is often characterized by carefully designed procedures that apply rigorous
analysis (v) Research requires expertise (vi) Research strives to be objective and logical, applying every possible test to validate
the procedures employed, the data collected and the conclusions reached. (vii) Research involves the quest for answered to unresolved problems (viii) Research is characterized by patient and activity (ix) Research is carefully reported and recorded (x) Research requires courage.
SELF-ASSESSMENT EXERCISE 1
i. Define Research ii. List and explain five features of research.
iii. List and explain some importance of Research.
4.0 CONCLUSION
You have learnt in this unit that research is a search for solution to problems. It is a process of arriving at dependable solutions to problems through planned, systematic collection, analysis and interpretation of data. Also, you have learnt that, all progress is born of inquiry. Doubt is often better than overconfidence, which leads to inquiry, and inquiry leads to invention. Increased amounts of research make progress possible. All these explain the significances of research. We have discussed in this unit that, one main objective among others is that; research helps to find solution to problems via a scientific process. Also mentioned in this part are the features of Research which as being listed and explained. Once again, it is important to note that, mere collection of facts, whether from reference books, from readings in library historical documents or from questionnaires is not research, unless the information derived from these sources is used in solving problems.
5.0 SUMMARY
In this unit, you have read some of the definitions of research. However, you have to remember that research is one which includes fact that is testable, verifiable, purposeful and activity-oriented. In other words, research can involve those activities or processes which allow one to systematically test and/or obtain a body of information, as knowledge about the issue is required to proffer solution to the identified problems. You also have learnt about the characteristics of research in which you noted that research is objective, precise, testable/measurable, replicable/verifiable etc. You have also seen the various purposes of research in this unit.
6.0 TUTOR MARKED ASSIGNMENT
1. All progress is born of inquiry. Doubt is often better than overconfidence, which leads to inquiry, and inquiry leads to invention. And increase amount of research make progress possible. Discuss?

6
2. Discuss any five characteristics of research as explained by Anaekwe.
7.0 REFERENCES/FURTHER READING
Anaekwe, M.C. (2002). Basic Research Methods and Statistics in Education and Social Sciences. Enugu: Podiks Printing and Publishing Company.
Best, J.W. and Kahn, J.V. (1995). Research in Education (7thed). New Delhi: Prentice Hall of India, 20-23.
Fagbohunbe, O.B. (1993). Research Methodology for Nigeria Tertiary Institutions. Lagos: Kole Consults.
Leedy, P.D. (1997). Practical Research: Planning & Design. N.J. Merrill: Upper Saddle River.
Osuala, E.C. (1982). Introduction to Research Methodology. Onitsha: Africana-Fep Publisher.

7
UNIT 2 FOCUS OF RESEARCH
CONTENTS
1.0 Introduction 2.0 Objectives 3.0 Main Content
3.1 Steps in the Research Process 3.2 Types of Research
3.2.1 On the Basis of Goal 3.2.2 On the Basis of Method 3.2.3 On the Basis of the Kind of Evidence and Analysis used
3.3 Scientific Methods in Educational Research: Limitations 4.0 Conclusion 5.0 Summary 6.0 Tutor-Marked Assignment 7.0 References and Further Reading
1.0 INTRODUCTION
In the preceding unit just concluded (unit 1), the meaning and nature of research methods have been discussed. In this aspect, you shall be looking at the Focus of Research. The Focus of research entails research process, its scope and its diverse nature. It provides a clear understanding of the systematic procedure that is always followed in the course of research studies. As a scientific method of investigation, research uses investigative methods which are consistent with the basic procedures and operating conceptions of science.
In any field of study in the social sciences (Economics, Business, Sociology, etc.) where researches are conducted, the process followed is always an adoption of the basic research process which utilizes the approach of scientific thinking and necessarily goes about its nature of problem analysis in a series of lay down procedures. The major goal of these processes is to arrive at dependable, valid and reliable results to some identified problems in the society.
You will therefore notice that, research in all the various academic fields share in the values of the culture of science. These procedures are logically sequential with one process leading to the other, all for the same purpose.
In this section, you will learn about the steps to be followed in conducting research, the types of research and the relevance of research in Nigeria.
2.0 OBJECTIVES
By the end of this unit, you will be able to:
• explain the steps in the research process
• discuss the types of research
• enumerate the limitations involved in the application of scientific method in research.

8
3.0 MAIN CONTENT 3.1 Steps in Research Process
Any research carried out in any field of study be it applied or basic is understood to be conducted using scientific method. It therefore means that, researchers may take the under listed steps in the course of carrying out any research activities. These steps should not be considered strictly as the only satisfactory sequence. You, as a researcher or research worker or even your institution may adopt some modifications of the research process. Let us now consider these steps:
• Identification of a Problem: This process is cumbersome and difficult step in research process. It involves the discovery and definition of research problem or problems which deals with issues of sufficient consequence to warrant investigation. The problem must be such that can be solved through scientific investigation. It should not be a problem which requires ‘Yes’ and ‘No’ answers. Examples of research problems are: What is the rationale for the persistence deficit budget in Nigeria? Is the Nigerian capital market a barometer for measuring her development?
• Review of Related Literature:
After a problem has being identified, what follows is the review of related literature. Literature review is the detailed understanding of the problem area by consulting some books, magazines, journals, etc. already in existence as regard the identified area. This will enable you get some background information about the problem area. Also the review of related literature will also help you in the following ways: 1 removes replication of what has already been done, 2 guide your formulation of research hypotheses or questions, and 3 sharpen your focus of the study as well as give you insight as to whether the problem is researchable or not and the type of problems you may encounter in the process and how to take care of them.
• Formulating Hypotheses and/or Research Questions:
This calls for clear and concise logical aspects of the problem in an attempt to sharpen your focus on the problem. It involves the conjecturing of the relationship between the concepts and variables identified in the problem. The hypothesis serves as a tentative answer to the problem. It can be from the result of employing logical processes of deduction and induction to formulate an expectation of the outcome of the study.
• Selecting the Research Design: This implies the selection of the appropriate research approach for the investigation. A research design can be a specification of operations for the testing or verification of the hypotheses under a given set of conditions and of procedures for measuring variables. It involves the selection of, persons or things to be studied. Examples can be descriptive survey, experimental, quasi-experimental, factorial designs etc.
• Collection of Data: This stage aims at collecting relevant information for measuring the selected variables and for building up a body of valid and reliable knowledge about the variables or the research topic It involves the construction and administration of the measuring instruments. Prominent among the techniques are interviews, questionnaires, observations, tests, rating scales, documentary sources and records. You will learn more of these as we go on in this course.

9
• Data Analysis and Interpretations: Data analysis implies extracting the required information which will serve to answer the research questions or test the hypotheses from the data collected and presented earlier. The data collected must be reduced, arranged and presented in an organized form for easy analysis, using suitable statistical techniques. This will enable you to generate some research findings from which conclusions and generalizations are drawn. You can employ the use of computers and/or calculators for easy and accurate data analysis.
• Discussion of Research Findings: Research findings from the analysis of data are discussed to justify, interpret, explain and further the development of theories for knowledge. This discussion is done in the context and direction of the information gathered in the process of literature review. You can see that literature review is very important in this respect as it makes for very sound and balanced discussion of findings.
• Conclusion and Recommendations: At this stage, you are expected summarize the whole research and draw conclusions from your findings and to make policy recommendations of your findings as generated from your samples to the larger population. You will have to bear in mind that the generation of valid findings, making of correct generalization and useful recommendations for possible applications in the society brings about progressive development.
• Writing the Research Report: This is the final state of activities in the process of conducting a research. The outcomes of your research activity are made known to the public in a form that is clearly understood. This entails a clear and concise presentation of the research procedures. Research report writing is fully discussed in unit two (2) of module five (5).
SELF-ASSESSMENT EXERCISE List and explain the steps entail in a research. 3.2 Types of Research Research, be it social, economic, business, etc., are of various kinds. These categorizations are done on the basis of goals, methods, evidences and analyses of research. Discussed below are some of the types of research categorized on the basis of methods, goals and others.
3.2.1 On the Basis of Goal Researches that are grouped on the basis of goal are basic and applied research. These are:
• Basic Research: This is a type of research, also known as fundamental research which deals with the gathering of empirical data that can be used to formulate, expand or evaluate theory. Its primary concern is to advance knowledge with no regard to it practical application. It is concerned with the construction and development of theories in all fields of study which may lead to principles formulation and generalization that brings about understanding. It is fundamental because, researches in this category begin from nothing to what adds to knowledge, open new areas of thinking and establishing new principles to organize nature. Outcomes from this type of research may be used to solve both economic and social issues

10
in the society. This type of research is at times refers as pure research.
• Applied Research
As the name implies, it is the application of results (theories and laws) from basic research to solve basic problems in all form of human endeavours. For instance, the application of theory of demand in the field of Health Economics to ascertain the demand for healthcare services in the Nigeria. It is a research performed in relation to actual problems which occur in the field and under the conditions in which they are found in practice. Other categories of researches that can be seen as part of applied research are:
• Action Research: This is a kind of research done by researchers to proffer solutions to practical local problems. A good example is an organization interested in finding solution to her falling sale volume, etc. A researcher could be called to investigate issue, and the problem will be sorted out. This type of research is directed at developing new skills, finding new answers or approaches to solve problems of current concern. It is practical and directly relevant to an actual life situation. It is basically a small-scaled research formed to address limited local issues.
• Evaluation Research: This is another form of research that is employed by organizations, educational outfits, etc., to apprise and assess the various programmes or policies put in place. For instance, a systemic evaluation of the practice of some programmes in the school system may necessitate modifications in the requirements and policies of the education ministry. Also, most business owners would want to ascertain the return on investment (ROI) on their various investments and ventures. This form of research is not as popular as the rest because appraiser and assessment of investments and ventures is always on regular basis not necessarily for the purpose of research. 3.2.2 On the Basis of Method We have just seen above types of research classed according to goal. Now we want to consider researches that are grouped according to the technique analysis (i.e. methodology) engaged. Thus we have:
• Experimental Research This is a case of research where the exogenous (self-regulated) variables are manipulated to observe the effects on the endogenous variables. It serves to determine possible outcomes given certain conditions. There are two groups, the experimental or treatment group and the control group. The experimental group receives the treatment while the control group may not receive any treatment. The difference is noted and used.
• Ex- Post Factor Research In this kind of research, certain variables most especially the exogenous are not easily manipulated either directly or indirectly. In fact, randomization is not even possible. This is because most variable occurred in their natural form. Examples of Such variable are sex, race, intelligence, ability, creativity, personality, socio-economic status, etc. these variables cannot be easily manipulated. At times this type of research is called causal comparative studies.
• Descriptive Research This is a class of research that is concerned with the description and interpretation of
11
existing relationships, attitudes, practices, processes, trends, etc., also with the comparison of variables. In this case, no attempt is made to influence variables. Descriptive research is further classified thus:
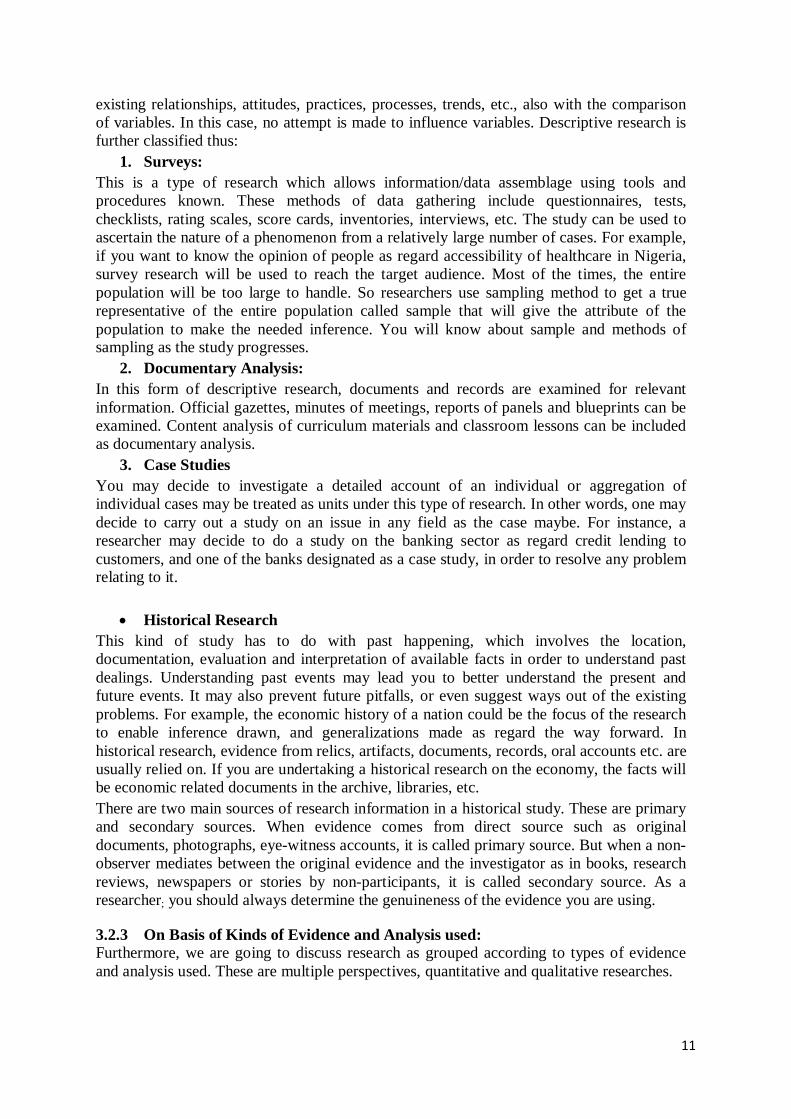
1. Surveys: This is a type of research which allows information/data assemblage using tools and procedures known. These methods of data gathering include questionnaires, tests, checklists, rating scales, score cards, inventories, interviews, etc. The study can be used to ascertain the nature of a phenomenon from a relatively large number of cases. For example, if you want to know the opinion of people as regard accessibility of healthcare in Nigeria, survey research will be used to reach the target audience. Most of the times, the entire population will be too large to handle. So researchers use sampling method to get a true representative of the entire population called sample that will give the attribute of the population to make the needed inference. You will know about sample and methods of sampling as the study progresses.
2. Documentary Analysis: In this form of descriptive research, documents and records are examined for relevant information. Official gazettes, minutes of meetings, reports of panels and blueprints can be examined. Content analysis of curriculum materials and classroom lessons can be included as documentary analysis.
3. Case Studies You may decide to investigate a detailed account of an individual or aggregation of individual cases may be treated as units under this type of research. In other words, one may decide to carry out a study on an issue in any field as the case maybe. For instance, a researcher may decide to do a study on the banking sector as regard credit lending to customers, and one of the banks designated as a case study, in order to resolve any problem relating to it.
• Historical Research This kind of study has to do with past happening, which involves the location, documentation, evaluation and interpretation of available facts in order to understand past dealings. Understanding past events may lead you to better understand the present and future events. It may also prevent future pitfalls, or even suggest ways out of the existing problems. For example, the economic history of a nation could be the focus of the research to enable inference drawn, and generalizations made as regard the way forward. In historical research, evidence from relics, artifacts, documents, records, oral accounts etc. are usually relied on. If you are undertaking a historical research on the economy, the facts will be economic related documents in the archive, libraries, etc. There are two main sources of research information in a historical study. These are primary and secondary sources. When evidence comes from direct source such as original documents, photographs, eye-witness accounts, it is called primary source. But when a non-observer mediates between the original evidence and the investigator as in books, research reviews, newspapers or stories by non-participants, it is called secondary source. As a researcher; you should always determine the genuineness of the evidence you are using.
3.2.3 On Basis of Kinds of Evidence and Analysis used: Furthermore, we are going to discuss research as grouped according to types of evidence and analysis used. These are multiple perspectives, quantitative and qualitative researches.

12
• Quantitative Research: This type of research uses information or data expressed through mathematical signs. Most investigational studies are classified under this type of research. Data collection methods include tests of various types, experiments, questionnaire, rating scales etc. Quantitative data are analyzed using either descriptive or inferential statistics.
• Qualitative Research: This type of research uses information about a phenomenon that is expressed through verbal symbols. It makes use of qualitative data collected through interviews, observations, artifacts, and documentary sources, audio and visual materials among others. Data gathered in this kind of research are analyzed using transcription, coding, historical and philosophical analysis. In most cases, if not all, some elements of subjectivity are used in the explanation of data collected.
• Multiple Perspective Research: Multiple perspective study is a combination of both quantitative and qualitative research also known as mixed. This type of research is more understandable, yielding better results that are more thorough than either quantitative or qualitative research. SELF-ASSESSMENT EXERCISE
i. List and explain the bases for classifying research? ii. Discuss research classification on:
o Evidence and analysis used o Methodology
3.3 Limitations of Scientific Methods of Research Scientific method of research is a way of making inquiring about issues or circumstances that require clarification to Mankind using logic, observation and theory. Science has some basic features such as logical thinking, observed evidences and a theory to explain what is observed. Scientific method of research must make sense and corresponds with what is being observed. A detailed study of steps in research process reveals much about a scientific method of research.
A lot of empirical studies that seem reliable have been carried out in all fields of study, yet, some of these studies have not met with the rules guiding scientific method of research typical of the natural sciences. This is because they have not been able to establish generalizations which are comparable to the theories of the natural sciences on the basis of explanatory power or in their capacity to yield precise predictions. This is because of several limitations that have been identified. These limitations or hindrances are discussed below:
• Nature of Issue Considered: Most phenomena, in which studies are done, their nature are complex and unreliable, unlike those of the natural sciences (like physic, chemistry, etc.). The natural scientist deals with physical laws which are realistic. However, in economics, education, sociology, etc., that focuses on human behaviour and development, both as individuals and as members of a group. In this case, the natures of variables in these phenomena are not realistic and make studies difficult.

13
• Measurement Problems: In the natural sciences, instruments such as tape, wind vane, thermometer, barometer, ruler, weighing balance, ammeter, galvanometer etc., give good and accurate readings. But in social or economic research, you hardly can still find instrument that give accurate readings. As a matter of fact, most data in economics are still not accepted. For instance, data on corruption is still a bone of contention in Nigeria today.
• Difficulties in Observation: Observation is a very important aspect of science, whether social sciences or natural/physical sciences. But, it is more difficult and risky to have perfect observation in some fields of study like economics, education, sociology, etc. this is because; it is more of subjectivity than objectivity. And personal explanations of certain issues cannot be verified.
• Difficulties of Control: Possibilitiesof effective control of experimental conditions are much more limited in social sciences, than in the natural sciences. This is because rigid control of experimental conditions is possible inthe physical science where laboratory exercise is possible. However, in social sciences and education inclusive, where many extraneous variables that is not known to the researcher, affect and influence the outcomes.
• Difficulties of Replication: When two or more chemicals are put together in a test tube, the result of the reaction can be observed and reported objectively. This can be replicated or reproduced to get the same result anywhere in the world. This may not same with phenomenon or issues in social sciences, where cultures and beliefs tend to influence human behaviours. This in a way makes replication of researches done in Nigeria, in any other part of the world difficult.
• Experimental Contamination
The mood of the researcher or investigator can make or mare the outcomes of particular study. This is so because most issues involve social sciences and education are subjective in nature. But in natural sciences, this is not possible. The presence of the researcher cannot impact on the result of a study. For example, the mixture of an acid and alkali will certainly produce salt, no matter the researcher’s disposition. SELF-ASSESSMENT EXERCISE Certain factors confine the use of scientific methods in social research, discuss.
4.0 CONCLUSION In this unit, you have been educated about steps to be taken in the conduct of research. This is referred to as research process. It is an adoption of the basic research process which uses the style of scientific thinking and necessarily goes about its business of problem analysis and/or solving in a series of stages or steps. The vital objective of these series of activities is to search for dependable, valid and reliable solutions to some definite questions or problems in the society. Therefore, we can conclude that scientific method of researches also shares in the values of the culture of science. All the stages and steps of research are in logical sequence with one step leading to another, linked for one common goal. However, scientific method of research cannot be as accurate and perfect as experiments in the physical sciences as a result of certain hindrances.

14
5.0 SUMMARY In this unit, you have learnt about the steps involve in conducting research in any field of academic, most especially in social sciences. Also, you have been exposed to the basis of research classification. Lastly, you have learnt about the obstacles to successful application of scientific methods of research.
6.0 TUTOR-MARKED ASSIGNMENT
1. List and explain the steps involve in scientific method of research process. 2. Itemize obstacles to successful application of scientific technique in social research.
7.0 REFERENCES/FURTHER READING Anaekwe, M.C. (2002). Basic Research Methods and Statistics in Education and Social
Sciences. Enugu: Podiks Printing and Publishing Company.
Ihenacho, E.A (2004). Basic Steps for Quality Research Projects. Lagos: Noble-Alpha International.
Ikekhua, T.I. and Yesufu, J.F. (1995). Exposing Research Methods in Education Study and Reporting Aid for Students and Beginning Researchers. Warri: Ar B10 Publishing Limited.
Nkpa, N. (1997). Educational Research for Modern Statisticians. Enugu: Fourth Dimension Publishers.
Olaitan, S.O. and Nwoke, G.I. (1988). Practical Research Methods in Education. Onitsha: Summer Educational Publishers.

15
UNIT 3 RESEARCH PROBLEM
CONTENTS
1.0 Introduction 2.0 Objectives 3.0 Main Content
3.1 Research Problem Identification 3.2 Problem of Research, Its Avenue 3.3 Guidelines for Choose Research Problems
4.0 Conclusion 5.0 Summary 6.0 Tutor Marked Assignment 7.0 References/Further Readings 1.0 INTRODUCTION In unit 2, you have just learnt about focus of research. In it, you have been exposed to steps taken in conducting research, basis for classifying research, and many more. In this unit, we shall be discussing Research problem. Problem in research isthe centre of attention of every research, and efforts are directed towards it. In every research, there must always be a gap to be filled which is the problem itself, this must be known to justify the reason for the study. It is important because, a lot of the decisions that the researcher will be taken shall be based on the problem already identified. For instance, title of the study should a strong link with the problem of research; also the methodology to be adopted, etc. What bothers researchers and students most is what constitutes a researchable problem? A problem arises when the interplay of two or more factors result in one of three possible problematic outcomes. These are a perplexing state, an undesirable consequence, or a conflict for which the appropriate course of action is controversial. In order to find the problem, solution, classification of perplexing state, elimination or alleviation of the undesirable consequence, or resolution of the conflicts can then be made (Nkpa, 1997). In this section, you will be exposed to all you need to know about research problems. Such as problem selection, sources of the problems, etc. 2.0 OBJECTIVES By the end of this unit, you will be to: • identify a research problem in your area of focus • know the various sources of research problems • Itemize the criteria for selecting research problem.
3.0 MAIN CONTENT
3.1 Research Problem Identification Identification of problem is very vital to the whole process of research. Any undergraduate student or someone reading about research method for the first time can be classified as starting researcher, who will always find it difficult to decide on what a suitable research problem is. You may spend considerable amount of time examining many research problems without being able to make up your mind on which to select. Most people, especially the starting researchers have problems of indecision in identify a particular

16
problem. This is as result of fear of picking complex problem that may not be easily solved. There is difference between the problem of research and the problem area of focus. While the former is any lacuna in the body of knowledge the research is expected to fill, the latter is a more encompass, broader and it house the research problem itself. For example, if you have “fiscal deficit and employment generation in Nigeria”, the research problem maybe, are jobs created in spite of the persistent deficit budget? The title itself would represent the problem area of interest.
For you to identify a good researchable topic and successfully determine the gap i.e. problem of research in the topic, three basic stages of reductive deductions need to be taken into consideration. These include:
1. you need to identify a problem area of focus in your field of specialty, 2. make sure the identified problem is shaped into a form that is able to be handled,
and lastly 3. See that the nature of the problem can be empirically investigated.
These steps as stated above are not easy for a starting researcher. Be that as it may, what is paramount is that, a detailed thinking produces good results. However, know that a good research work is a difficult activity to undertake. There is no study no matter the nature, will require effective thinking and careful planning. Note that, not every investigation or study can be qualified as a research activity. We have earlier on in the course of this study mentioned that all researches are directed at solving problems or providing answers to questions that agitate the minds of the public. It is therefore pertinent to note that, no attempt is made on any study where a gap in knowledge cannot be identified. For a study to be qualified as a researchable work there must be a pressing problem or a need that the study is able to solve.
In addition, research activity in any field of study should be able to contribution to knowledge. For instance, projects undertaken by graduate students of first degree, second degree, and those at PhD level, should be directed at proffer solutions to societal problems. The irony of the whole situation is that; no student is ready to undertake any project work wholly done by him or her. These days, a lot of undergraduate projects and graduate theses can hardly contribute to knowledge. Most of their works are mere gathering of people’s opinion and not necessarily research based.
SELF-ASSESSMENT EXERCISE 1 Distinguished between research problem and problem area of focus. 3.2 Problem of Research: It’s Sources Everything in life has source. For instance, your source of income could be the money you are paid from the little job you are doing, or the pocket money you receive from your uncles/aunties. Even the water you drink has a lot of avenues through which it is gotten. In like manner, research problems have their various avenues through which they could be located or identified. It therefore becomes expedient to discuss the various avenues of locating or identifying research problems. These are:
Experience of the Researcher As an experienced researcher, or lecturer who has lectured for a long time, you definitely

17
would have come across a number of problems, imperfections, or some gaps that require solutions. Even through rubbing of minds with your colleagues in the same profession will enable you discover areas where there are problems and solution required. Review of Existing Literatures This is another good source of identifying problem area of interest or research problem to work on. When you have a detailed review of existing literatures, researchable problems will certainly be identified. Textbooks, thesis and dissertations, research reports in journals and periodicals, conference papers and many others are examples of literatures.
Apart from suggestions for further research available in thesis and dissertations, you may encounter contradictions, inconsistencies and unsatisfactory findings in some areas of investigation. You can then carryout a study to fill in the gaps. Also, a researcher’s study can add to knowledge through improvement in the technique of investigation.
Scholars’ Views Consulting with professionals such as economists, sociologists, educationists, research fellows, thesis advisers or supervisors, in any field of study, can lead you in identifying your problem area. They will assist you in shaping your thinking to achieve a sense of focus and to be articulate and concise in your research topic. This depends on your interest in having an originally thought out problems. It is the duty of a scholar to make out good research problem from collect previous research literatures, periodicals, journals, etc. Published Government Policies Most intended government policies and views on the economy are made known to the public via the various media (i.e. the electronic medium, printing medium, etc.). After a careful review of these views and policies, one could pin-point a good problem area of research and research problem from government identified policies/ programmes. The jettisoned Structural adjustment programme (SAP), is a good instance. The introductionof the policy/programme in1986 and years that follows witness a lot of studies as regard its successes and failures.
Electronic (Internet) Sources If having access to journal publications, conference papers, etc., was a difficult task in the time pass, thanks to inventors of internet services. With internet, you can gain access to libraries in any part of the world to get current and updated information on any field. This will avail you the opportunity of getting current research findings or write-ups on any area of interest. You can read about various approaches employed in solving problems relating to yours and you can adopt it, and apply it in your own circumstances. Uniform Economic Problems Almost all developing nations, Nigeria inclusive are having economic problems. Problems such as poor growth, wars and insurgence, etc. in fact, there are so many common problems facing developing nations. These problems can be a source of good research work to any researcher. Propounded Theories They are statements, hypotheses and individual ideals which have been tested by known means i.e. through scientific method over the years and are found to be true as stated by the proponents. Also there are individuals’ ideals put forward to explain certain situations,

18
issues, events, etc. In fact, theories, laws or principles are generalized statements that needed be applied and validated. Nkpa, (1997), states that, theories are fertile sources of research problem. This is from theories; relationships among variables can be predicted, tested and established.
SELF-ASSESSMENT EXERCISE 2 Briefly discuss the sources of problems in research. 3.3 Guidelines for Choosing Research Problems There is a popular saying that, no area of knowledge or life situation that has not been researched on. Be that as it may, a lot of potential researchable problems still abound. The disturbing issue is how to choose the most appropriate among the lots at a point in time? Listed and explained below are some of the guiding principles for evaluating, and selecting a researchable problem.
(i) Significance of the Problem You we recall that, earlier on in this course, you were told that the essence of research is to advance knowledge by adding to the body of knowledge. So therefore, any study you may need to undertake as starting researcher, must have a research gap in which solution will be sought that will make meaning to human existence. By so doing, contributions have been made to knowledge, and the research has imparted (significance) on the body of knowledge. For instance, studies on the type of budget tobe adopted by the Nigerian government as a major fiscal operation are significant to the nation’s development. (ii) How is Researchable of the Problem? This is another guideline for selecting researchable problems. For a problem to be researchable, it should be able to have links with some existing theories, laws or principles that will serve as foundation for the work to be done. Also, researchable problem should be model that will involve variables which can be defined and measured. A lot of life issues are still yet not researchable because, they possess variables that cannot be estimated (not measurable).
For instance, the effect of corruption on Nigeria’s economic activities is yet to be captured in economics. Corruption as a variable is yet to have an acceptable proxy for capturing it in researches. In most studies where ‘perception index’ has been used, the outcomes are still being contested. This is because, perception in social-economic instances has a lot of issues like reputation of the body doing it, the indictors considered, and many others.
(iii) Problem of Research should be Suitable: You will be able select a problem of research that is capable of being investigated, and fit into the peculiarities of the situation you intend study. Also, suitability of research problem has to do with the availability of require data on the chosen of study. Experience has shown that, a research problem could be significant and suitable for study but, for want of data, it becomes not suitable. Accessibility of respondents and case studies is another problem. That is, the researcher may not have access to some respondents for one reason or the other as regard the study area, as such; the research may be rendered useless for detailed study. (iv) A Research Problem should beViable A research problem should be viable. What this mean is that, any study engaged in should be to create room for further studies as link to the earlier study. Research problem should be

19
viable in that; it should be able to make sense to whoever will have access to it.
SELF-ASSESSMENT EXERCISE 3 List the guidelines for selecting research problems. 4.0 CONCLUSION You have learnt in this unit that identification of research problems and its selection is not an easy task for starting researchers. However, this unit has explained in full how research problems can be identified and guidelines for its selection. A careful and detailed study of this section will make the uphill task a simple one.
5.0 SUMMARY In this unit, you have been presented with a practical approach towards the issue about the research problem. You have learnt that though, it is difficult to select and define a research problem, yet if you locate a general problem area in your field of interest, you pin it down to a manageable size and state it concisely in a form that can be empirically investigated, then, you have solved a lot of the problems. You have equally learnt how research problem could be identified and its usefulness to research. Sources of research problems such as propounded theories, uniform economic problems, scholars’ views, published government policies, electronic sources and a lot more were explained. Also, guidelines for research problem selection like significance of problems of research, viability of the problems, suitability, etc. have been fully discussed. 6.0 TUTOR-MARKED ASSIGNMENT
1. Discuss the various avenues of locating or identifying research problems. 2. Explain some of the guiding principles for evaluating, and selecting a researchable
problem. 7.0 REFERENCES/FURTHER READING
Ali, A. (1996). Fundamental of Research in Education. Awka: Meks Publishers (Nigeria).
Anaekwe, M.C. (2002). Basic Research Methods and Statistics in Educations and Social Sciencies. Enugu: Podiks Printing and Publishing Company.
Ihenacho, E.A (2004). Basic Steps for Quality Research Projects. Lagos: Noble-Alpha International.
Ikekhua, T.I. &Yesufu, J.T. (1995). Exposing Research Methods in Education Study and Reporting aid for Students and Beginning Researchers. Warri: Ar B10 Publishing Limited.
Nkpa, N. (1997). Educational Research for Modern Scholars. Enugu: Fourth Dimension Publishers.
Olaitan, S.O. &Nwoke, G.I. (1988). Practical Research Methods in Education. Onitsha Summer Educational Publishers.

20
MODULE 2 RESEARCH WRITING
Unit 1 Research Topic Unit 2 Literature Review Unit 3 Theoretical and Conceptual Frameworks in Research UNIT 1 RESEARCH TOPICS CONTENTS
1.0 Introduction 2.0 Objectives 3.0 Main Content
3.1 Research Topic 3.1.1 Choosing a good research topic 3.1.2 Process of selecting a research topic 3.1.3 Features of research topics
3.2 Locating a research problem 3.3 Submitting research topic
4.0 Conclusion 5.0 Summary 6.0 Tutor-Marked Assignment 7.0 References/Further Reading 1.0 INTRODUCTION In module one, which focus was ‘concept and nature of research methods,’ you were exposed to the various definitions of research in unit one. In unit two, you learnt about the focus of research, wherein steps in research process, types of research and many more were discussed. Research problem was discussed in unit three, and that closed the discussions on the module one. In this section, module two, we shall be considering “research writing” in which tropical issues such as research topic, literature review, theoretical/conceptual framework and development of research questions and hypotheses shall be entirely discussed. Research Topic, one of the key issues to be considered in this module, shall be discussed in unit one. To make the discussion meaningful and in-depth, sub-topics like meaning of research topic, how to choose a good research topic and a lot more shall be discussed. Choosing a good researchable topic is very vital in academic write-ups. This and many other related sub-topics shall be considered in this unit.
2.0 OBJECTIVES By the end of this unit, you will be able to:
• explain research topic • discuss how to choose a good research topic • explain how to locate research problem.

21
3.0 MAIN CONTENT 3.1 Research Topic The topic of any research work (be it a degree project, MSc thesis or PhD dissertation) is an essential part of a research process. Aborisade (1997) opines that, the topic of a research should encompass the essential elements or concepts involved in the study in a concise form. He proposed further that, the topic should also indicate the scope of the study. Aborisade’s opinion has showed the importance of a research topic to any scholarly study in any field of study be it degree projects, thesis, etc. Aborisade suggests further that, as much as possible, the number of words in any research topics or titles should not be more than twenty. Since the topic of a study is very important in the whole process of research, Emeka (2004) declares that, choosing a research topic is dependent on the research problem and researcher’s interest, be it academic or a professional research. He stressed further that, it is vital to note that the problem and the researcher’s interest would show the direction of the study hence the care in chosen a research topic. In other words, the problem of research to be investigated more often informs the topic of the research, after the area of interest has been identified by the researcher. While the process may be simple for degree/undergraduate final year students, it is definitely not an easy task for the graduate ones (that is, the MSc and PhD students). However, for those in master degree category, they enjoy some air of freedom in the selection of research topics. In most instances, the students are allowed to come up with any researchable topic. Thereafter, they are assigned to individual supervisors accordingly in line with their area of interest. In the case of doctoral students, the responsibility of chosen a topic is wholly that of the student. The student choose a topic based on his/her area of interest, get a prospective supervisor whose area of interest or specialization matches the chosen topic before making an application for admission. Meanwhile, to decide on a suitable research topic, there are no particular ways or methods of arriving at one. However, a good understanding of the guidelines discussed below will greatly assist any student in choosing at a good researchable topic. 3.1.1 How to Choose a Good Research Topic Research differs in scope, magnitude, focus and even the need they satisfy. The different nature of researcher does not affect the necessity of choosing problem areas and articulating good topics from them. Once a researcher has made-up his or her mind to embark on a research, what follows is the selection of topic or title that would make meaning to the audience. Ghosh (1992) recommends some guiding principles for choosing a good topic. These principles are explained below:
• Since the topic of a research is an essential part of any scholarly writing, choosing a topic is of paramount importance. The topic of a research may be based on a number of considerations. It may be based on some real-world situation or by some theoretical and intellectual interest. A research topic could emanate from any burning issues or problems of the period. It may as well be based on the interest and suitability of the investigator. A researcher may be guided by some special consideration of his own choice. The investigator may select a title base on the originality and distinctiveness of the work. A research topic maybe based on the existing information gap in various theories, principles, laws, and the investigator may choose his or her topic to bridge that gap.

22
• At times, a study is done to propose a different and a better law, principle, theory or analysis. Intellectual and scientific curiosity may lead to the investigation of a variety of research topic. The investigator, steered by scholarly inquisitiveness, may take up a topic which is quite unfamiliar to other scholars. To find out some distinctions, scholars explore the contentious area of a study. Researchers are always interested in investigating contradicting topics in order to bring out the actual fact involved in the problem. A researcher could also scrutinize the dynamism of some existing theories, laws and principles on the basis of fresh proofs and data and/or enhanced procedure of analysis.
• Also a topic could be selected so that fresh and more valuable deductions can be
established with the existing facts. In the case of a previously existing, extremely advanced theoretical method, a research topic may be chosen to test specific likelihoods on the basis of the usual principle. It has been pronounced that beliefs play some parts in the choice of a study’s topic. This observation, however, is not always well-thought-out to be factual. Researchers having different thinking of beliefs pick different topics for their studies. In case, however, a topic is selected agreeing with some personal inclination, the researcher must be very careful to guard against the prejudice that is likely to enter into research. Difference societies place premiums on work on diverse topics. An instance is, it is more important to work on automations than on the local transport mode. Occasionally, a research topic is not picked by the researcher but has to select amid the given list of topics of an organization where he/she operates.
• To select a study topic, a researcher will put into consideration a host of other things.
For instance, the ability of a researcher, his/her time, the resources, access to data, and what have you. Recall that research is largely a function of an unbiased objective appreciated by people, organizations, or the nation.
• A research topic should be the one that is researchable. That is, it should be the one
that, the researcher is able to carry out his/her study without getting stock in the process. For instance, when a student or a researcher selects a topic in which he/she would not readily have available information to work with in order to produce an outcome, such topic is termed ‘not researchable’. Also, the topic of study should not be ambitious or tedious. A situation where the research limitations and aims are unachievable, at that point, the researcher can be tagged ‘ambitious’. Where the technical level is not moderated, conducting such a research will be tedious.
• A research topic must be noteworthy. That is, topic should be capable of adding to
the body of knowledge, at the sometime able to resolve problems. 3.1.2 Process of Selecting a Research Topic The flow chart as shown below is a representation of the steps to be taken by any student or researcher before he/she finally comes up with a good and appealing research topic or title.

23
Source: Howard; K. and Sharp, J. A. (1983). The Management of a Student Research Project: in Emeka (2004) pp. 43.
Self-Assessment Exercise 1 1. Briefly outline the guidelines for selecting a research title. 2. Chosen a research topic is dependent on the researchers’ interest and problem,
discuss. 3. When a research is imposed on a student is no longer a research? `
3.1.3 Features of a research topic Somehow we have made some distinctions between how the topics of an undergraduate project are chosen and those of graduate thesis (MSc or PhD). Meanwhile, it is imperative to note that, there are differences between studies being undertaken for the sole purpose of bagging a degree like OND, HND, BSc etc., and researches that are purely academic which are formative and educative such as those undertaking by lecturers for scholarly purposes. Therefore, the features of research topics that we are concerned with in this regard, are in line with academic researches. However, the tips on how to choose a good research topic already discussed are guides to students on how to select a study topic they can start and finish successfully without any hitch. With these understandings in minds, they should ensure that their research titles possess the following features:
• That the research is problem based, which mean it has needs to meet in the society. In other words, there must be a need for any research to meet in any situation or endeavor. In essence, there is existing problem that requires a solution. Once, this is established, the research will be significant.
• The researcher’s choice of topic is very vital in choosing a research topic. This is a very important feature of research topic. If a research topic is from the researcher’s area of interest, the need to sustain the study in face of possible challenges will be very high.
Identify broad area of study
Supervisor Agreed
Initial Selection of topic
Is the research feasible?
Has research sufficient value
Is the research sufficiently symmetrical?
symmetrical?
Is there sufficient scope?
Acceptable topic
Yes
Yes
Yes
Yes
No
No
Yes
No Can topic be appropriatelyrefined?

24
• The research topic should be time focused. No academic study /research can go on without a time frame as regard starting and finishing time. A student researcher should always have at back of his/her mind that he/she has to complete the research within a specified time.
• Any academic research undertaking by any student/young researcher must have a recognized method of analysis. Methodology is very important in any study that is being conducted either to inform or to educate the people. Methodology is all about the ways and manners (i.e. the research design) the researcher tends to carry out the study in order to arrive at dependable results. So, researchers must employ known technique(s) that conforms to the study.
• To engender the future development of a researcher, the direction of research is very important. A research topic shows the researcher’s areas of interest. A researcher who is non-directional in studies he or she has conducted thus far, may not be considered a specialist in a particular field, and could hamper the researcher’s future academic progression or acceleration.
3.2 Locating a Research Problem The research topic chosen by a researcher reveals or means a lot about the study to be conducted. In other words, so much is subsumed in any research topic finally selected. Among these is the problem to be resolved by the research. This problem is often referred to in research as, problem statement or statement of problem. In most cases, project students or young researchers confuse essay topics for research topics. When an essay topic is selected as a research topic, soon in the study, the researcher becomes stock. This is because; it is possible the study has no particular problem in focus. It is important to remark at this stage that, every research is problem focused and most often the center piece of a research topic. One common problem most project students or young researchers are confronted with is how to locate a research problem that will be the focus of a research. To resolve this problem, the following points discussed below will to a large extent act as guide to young researchers to enable them locate a problem of focus for their individual research.
• Using academic, professional or personal skills: These are valuable assets that are vital to any project student’s or young researchers’ ability to locate a problem. Carefully study your area of interest and identify some problem areas that could be researchable. Problem areas can be identified in many ways. One of the ways is that, the researcher should read widely about beliefs in his/her field which he/she thinks are wrong or misleading, then devise a number of questions that will show the nature of the problem. By so doing, the researcher is close to a specific research problem that he/she can focus his/her attention.
• Project students or researchers should be focused: Both the ears and eyes of researchers should be at alert at identifying problems that call for solutions. Most academic studies or reports often give rooms for “further research”. In order words, any young researcher who understands the report or study he/she is reading can be led to identify a research problem via “the need for further research.”
• Have an area of interest in your field of study: This is very important in research, and in locating a research problem. If your area of interest is health economics, focus on that aspect and look for possible research problems in that field through good medium like the hourly news on television and radio, daily or periodical newspapers, research paper, etc. For instance, discussions on any prevailing health or healthcare issues could be on going on a T.V station; your focus should be how you can identify problem area in the discussion that could be the focus of a study.

25
• Gaps in an existing study: Gap or gaps in research, can be likened to problem of a study that any study intends to bridge. In order words, the gap identified gives rise to study problem that requires solution. A gap in an existing study can be identified after an intense and careful review of a study already conducted. Once a gap is identified, a research problem is located. Gap/gaps in a research can be in any forms. It could be in the form of the scope of the study (that is the coverage period), it could be that a policy has been introduced and implemented after a particular study had been conducted. So, such study needs to be up-dated by extending the scope of the existing study. A researcher needs to be skillful and focus when reviewing papers to be able to identify these gaps.
• Improvement on existing study: Identifying the need for improvement in existing studies is another avenue for locating research problem. For instance, some studies might have been done about the Nigerian economy years before the introduction of some economic transformation programmes such as NEEDs, NEPAD, SURE-P and the rest. A skillful project student can decide to incorporate these intervention programmes in any of the study initially conducted before the introduction of any these programmes, in order to determine its effect on economy. By so doing, the researcher has improved on the existing study, and the intervention programme incorporated in the study, becomes the gap when compared with the study before the intervention programme.
3.4 Submitting Research Topic The submission of research topics to the appropriate or designated office for approval is another vital aspect of research writing most especially if it has to do with award of degrees. A view of the flow chart of research process depicted above, acceptance of research topic, which is a formal approval by the would-be supervisor, is always the last exercise before the research proper commences. Submitting research topic for approval can be viewed from two perspectives. There is a perspective which has to do with mere submission of topics, out of which one will selected. The other perspective goes beyond mere submission of topics for approval; this second perspective is cumbersome and more detailed. For an undergraduate student who is in his/her final year must be required to start and conclude the study (i.e. long essay or project) before he/she qualifies for graduation. The process begins with the submission of research topics for approval. The general norm at this stage except for few variations (at both individual and institutional basis); the graduating student (i.e. supervisee) is required to submit at least three researchable topics to the supervisor he/she has been assigned to for formal approval. It is important to note that, the student was not assigned to the supervisor on the basis of area of specialty, and there was no prior submission of topics. The supervisor will then use his/her owns method of topic approval, to formally approve one out the numbers submitted by the supervisee. The same process goes for the intending Master degree graduates. However, there is a slight difference. In the instance, at a point, the categorization of the supervisees under various supervisors is mostly on the basis of the students intending area of interest (specialization). Another variation is that, at master’s level, before any formal approval is made, the supervisor would invite the student to do what is often refer to as ‘oral proposal’. That is, the student would be required to speak the topics as regard the modality of conducting the study. Upon conviction, one out of the topics will be approved by the supervisor for the student to commence investigation.

26
The other perspective has to do with the Doctoral degree. In this case, research topic submission is totally different from the former. The student needs not present any list of research topics for approval, instead, the candidate chooses a topic (guided by the rules) in line with his/her would be field of specialty and then proceed to do a detailed research proposal on the selected topic. It is this proposal that would bring about the would-be supervisor through a process that is somehow not formal. As soon as the intending supervisor develops interest in the proposal after some likely adjustment, and agrees to work with the student, the research topic is then accepted in principle. Self-Assessment Exercise 2
i. Identify a research topic, and discuss its’ characteristics. ii. How is ‘research problem’ related to ‘statement of problem’ in research?
iii. Briefly discuss the modes of research topic submission you have learnt. 4.0 CONCLUSION In this section, you have leant about research topic and all it entails, and the guiding principles for selecting a researchable project or thesis title. You have therefore learnt that, the title of any academic study is an important part of a research. This is so because; it encompasses the vital elements of the research. Likewise, you have learnt about how problem of research can be located or identified. That, identifying or locating a research problem which requires solution, would amount to the researcher to be careful and focused. In rounding-off this section, we considered how topics of researches (i.e. projects, theses or dissertations) are submitted for approval. 5.0 SUMMARY In this unit, we have discussed in-depth all that research topic is about. Among these were, how to choose a researchable topic, features of a good research topic, locating a research problem and how research topics are submitted for approval by project, master or doctorial students. 6.0 TUTOR-MARKED ASSIGNMENT
1. Define research topic. How is a project title a function of research problem? 2. Explain in ‘simple statement’ what you understand by ‘process of selecting a research
topic’. Support your explanation by a ‘flow chart’. 3. On getting to your final year in the university, discuss how you intend to have ‘project
title’ approved for onward investigation. 7.0 REFERENCES/FURTHER READING Aborisade, F. (1997). A student Handbook.(1st ed.). Ibadan. Emeka, A. I. (2004). Basic Steps for Quality Research Project. Lagos: Noble-Alpha
publishers. Ghosh, B. (1992). Scientific Method and Social Research. New Delhi: Sterling publishers.

27
UNIT 2 LITERATURE REVIEW CONTENTS
1.0 Introduction 2.0 Objectives 3.0 Main Content
3.1 Meaning of Literature Review 3.1.1 Purpose of Literature Review 3.1.2 Writing a Good Literature Review
3.2 Types of Literature Review 4.0 Conclusion 5.0 Summary 6.0 Tutor-Marked Assignment 7.0 References/Further Reading 1.0 INTRODUCTION In the just concluded unit (that is unit one), we discoursed research topic, wherein issues like meaning of research topic, how to choose a research topic, location of research problem, and many others have been discussed. In this section, we shall be discussing literature review. The review of literature in any formal academic writing such as journal articles, thesis, research grant proposals, etcetera, is a vital aspect that cannot be over emphasized. As we proceed in this unit, we shall be looking at the meaning of literature review, advantages of literature review and a lot more. 2.0 OBJECTIVES By the end of this unit, you will be able to:
• discuss what literature review is all about • explains literature review • examine the advantages of literature review • discuss the citations in literature review.
3.0 MAIN CONTENT 3.1 Meaning of Literature Review According to university of Wisconsin writing center, a review of literature is a “critical analysis of a segment of a published body of knowledge through summary, classification, and comparison of prior research studies, reviews of literature, and theoretical articles”. In order words, in line with University of Wisconsin writing centre’s definition, literature review requires an in-depth study of formal published studies. It is about acknowledging, surveying and a complete studying of other scholars’ published works that are related to the subject matter. In doing this, the researcher mentions or cites the name of the author and his or her contributions to knowledge. For instance, “Ohioze (2016) opines that, a detailed review of relevant materials relating to the topic under study would enhance the outcome of an investigation.” This is a good example of an author whose work has been acknowledged, surveyed and studied by another researcher. In this example, the author’s name, the date he or she did the study and the contribution(s) to knowledge, are cited by the current researcher.

28
The review of literature is very significant in academic writings. No meaningful academic research is started and concluded without a good review of literature related to the area of study. As a matter of fact, select an acceptable research title or topic, would require a survey of relevant literature. Olayinka & Owumi work (as cited in Olayinka et al, 2006), states that ‘narrowing and zeroing down’ of a research topic is dependent on a quick perusal of literature relating to the propose topic. This quick perusal of literature to arriving at an adequate research topic for any study is known as preliminary scanning of literature (Babbie & Mouton in Olayinka et al, 2006). As soon as a title for a study has been considered or chosen, the review of relevant material related to the subject matter is commenced. This is very important in that; it does not allow the occurrence of what is often referring to in research as ‘re-inventing the wheel.’ Re-inventing the wheel in research is a situation where a study already conducted and concluded is embarked on as if it is a new study. This occurs as a result of inadequate in-depth survey of related literature to the study. For a researcher to have a good grasp of whatever investigation or study he or she is conducting, a detailed review of relevant literature is paramount. Literature review helps to facilitate the critical analysis of similar works that have been carried out by other researchers. In the process of doing a critical analysis of related study, it is possible that the researcher identifies “a study gap.” Self-Assessment Exercise 1
i. Define and explain what literature review is all about ii. Explain how a detail review of literature will not allow re-inventing the wheel in
research. 3.1.1 Purpose of Literature Review As mentioned under the meaning of literature review, review of literature in any academic writing is very significant. That is, its importance in any formal writing cannot be over emphasized. The purpose of literature review in any academic write-up, can be equated to it essence in any published work. The inclusion of this section in a published or on-going study allows for more lights to be thrown on the background to the study. Literature review will also help to further define the problem a researcher is hoping to resolve. The review of literature serves other purposes, such as:
• It provides a conceptual framework for the research: In any academic study, research work to be conducted must be predicated or supported by a known research work related to it that has been done by someone. This is known as framework or foundation. There are three forms of frameworks, these are: conceptual, theoretical and empirical. Where a define theory cannot be linked to the study under consideration, previously related studies are reviewed to underpin the study, where key variables and concepts discussed. Miles and Huberman (1994) defined a conceptual framework as a visual or written product, one that “explains, either graphically or in narrative form, the main things to be studied—the key factors, concepts, or variables—and the presumed relationships among them.”
• Provides an integrated overview of the field of study: Another essence of literature
review in research is that, it allows for an integrated overview of the area of study. In order words, an in-depth evaluation of journals, books, PhD dissertations or MSc thesis and others related to the field of study, would make the researcher have a wider view of the study being conducted.

29
• Helps establish a need for the research: In academic setting, investigations or conducting of research into certain fields of studies must be predicated on reasons that shall be convincing to the would-be audience. That is, the essence of a study must be clearly outlined at the start of any write-up (i.e. the introductory section). This is what the objective of a study represents. A good and clear study’s objective(s) can be derived from a detail review of associated write-ups to the considered research.
• May help clarify the research problem: Statement of problem also known as
research problem is the core of any study. Any study not founded on an identified research problem often refer to as the “research gap,” is meaningless and is not considered an investigative research. Any scientific research is gear towards resolving a problem, and such problem most likely emanates an in-depth review of related studies.
• Researcher’s familiarity with the area of study: A researcher’s understanding of
the studied area can easily be determined or measured via the study’s literature review. A detailed documented literature review section will comprise the various form of literature review (that is, the theoretical, the conceptual and the empirical). This signifies that, the researcher has indeed consulted widely, and has familiarized with the area under consideration.
3.1.2 How to Write a Good Literature Review Having understood the essence or purpose of literature review in any academic written paper, it will be interesting to understand also how a good literature review can be written. Olayinka & Owumi (2006) outlined how a good literature review can be documented, and they are:
• Show the way in which the authority you are reviewing his or her work will be relevant to your own area of study through concept, theory or methodology adopted. Also do an unbiased citation of papers with contrary views.
• Prove that you understand the relationship these studies and paradigms. Where do
they stand in relation to each other? How the study you are undergoing is linked to other studies in that area?
• Studies you are citing should reflect recent work as well as those considered of
seminal importance. Cited scholarships should not be more than ten (10) years old. Also, in making reference to or citing authors, cite studies conducted by authorities in the considered area. This will enhance the quality of your literature review.
• If the research you are carrying out is a comparative or cross-disciplinary, the
researcher would have to explain how the different areas of research can be pulled together in a meaningful manner to make sense.
• If the researcher has done quite a remarkable study in the considered area of study,
he or she is at liberty to cite from those past works, but show moderation. • A good documented literature review should consist of scholarships the researcher
has indeed reviewed, and a good understanding of the authors’ views or ideas. On no account should researches cite work they did read.
• In writing literature review, citing remarks from unpublished and non-peer

30
reviewed studies should be seldom. The reason is that, the source of some unpublished materials can hardly be known for verification. Also, any study not peer reviewed and published, has violated one of the rules of academic published work.
Self-Assessment Exercise 2
i. Outline the purpose of literature review in any scholarly study ii. What are the components of a good scholarly reviewed literature?
3.2 Types of Literature Reviews At the commencement of this unit, we started by define and later explained literature review. Recall, we said literature review is nothing other than acknowledging, surveying and a complete studying of scholarly writings. Having discussed how a good literature can be documented, it is important to look at the various forms of literature reviews in scholarly works. There are six types of literature reviews, there are: Argumentative As the name implies, this type of literature review studies write-ups selectively in order to support or counter an argument, which has been wholly assumed, or philosophical problem already recognized in the literature. The essence is to come up with a study that launches a divergent opinion. Given the value-laden forms of some social science researches, argumentative styles of analysis literature reviews can be a legitimate and important form of discourse. Integrative This type of literature review is very common is social sciences. In this form literature review, previous studies are reviewed, critique, and synthesized in relation to the subject area in an integrated manner such that new frameworks and perspectives on the considered are created. The studies reviewed were those that centre on similar or same assumptions or research problems. A good integrative review is same as primary research which nice rigor, clarity, and replication. Historical Going by its name, historical literature review is about scrutinizing scholarly works over a period of time, often commencing with time an issue, concept, theory; phenomena began, and then tracing its progression within the scholarship of a considered field of study. Historical literature reviews place study in a historical perspective on development of any phenomena and to show the likely directions for future academic enquiry. Methodological This form of literature reviews basically centre on how scholars came about saying what they say about a particular concept or phenomena. In order words, the method of analysis in a study is always the focus. Reviewing methods of analysis provides a framework to understand how researchers went about in their study at arriving at the said outcomes. All these involves documenting scholars’ modes of conducting research as related to a considered field ranging from information gathering to its analysis. This method helps a researcher to identify the approaches that have been used and how he or she should do something quite different from others.

31
Systematic Systematic literature reviews are the type that concentrate on the empirical question embedded in any scholarly write-up. Empirical questions in research focus on the cause and effect of a phenomenon. For instance, “does education ganger cause productivity?” outcomes from this kind of studies are of importance to researchers. Any researcher, who would want to investigate any concept similar to education and productivity, would have to critically review previous findings from related works. This form of literature review is also known as empirical literature review. Theoretical This form of review surveys the number of theory that has gathered in connection to the issue, concept, or phenomena being investigated. The theoretical literature review aids in establishing which theories already exist, their relationships to the considered topic of study. It also helps to develop new hypotheses to be tested in the ongoing study. In addition, this form of review assist researchers to know appropriateness of theories or reveals the inadequate of theories to the research problem already identified. Theoretical review is different from conceptual review in that, while the former centres on known or existing theories, the latter reviews concepts or variables in the considered research. 4.0 CONCLUSION In this section, you have leant about what literature review entails. You have therefore understood in a nut shell that, literature review is the acknowledgement and surveying of scholarly articles. Also, you have learnt about purpose of literature reviews in publications. That, literature reviews provide framework for studies, its shows how familiar a researcher is with the studied area, it also helps the researcher to identify the gap in a study, etc. Besides, you have also learnt about the various forms of literature reviews and their usefulness. In rounding-off this section, you learnt about the three basic kinds of referencing and citation methods. 5.0 SUMMARY In this unit, we have dealt in detail with what literature review encompasses. Among aspects of literature review considered were: the meaning of literature review, the purpose of literature review, the types of literature review and a lot more. 6.0 TUTOR-MARKED ASSIGNMENT 1. Discuss fully what literature review is all about in social sciences. 2. What are the essences of literature review in researches? 3. As student of research methods, itemize what make literature reviews‘good.’ 4. Explain “in text citation” and give two basic examples. 7.0 REFERENCES/FURTHER READING Emeka, A. I. (2004). Basic Steps for quality research projects. Lagos: Noble-Alpha
International. Miles, M. B. & Huberman, A. M. (1994). Qualitative Data Analysis: An Expanded
Sourcebook. SAGE Publication. www.sagepub.com/sites. Accessed 20/06/2016. Olorunnisola, A. O. (2003). Some Essentials of Scientific Research Planning and Execution.

32
Ibadan: Jimson Nigeria Enterprises. Olayinka, A. I & Owumi, B. E. (2006). Preparing a Research Proposal. In A. I. Olayinka, V.
O. Taiwo, A. Raji-Oyedele & I. P. Farai (Eds.), Methodology of Basic and Applied Research, pp. 53 – 81. Ibadan: The Postgraduate School University of Ibadan.
University of Wisconsin writing centre. http://www.uwstout.edu/writingcenter. Accessed
24/06/2016. USC libraries research guides “organizing your social sciences research paper: The literature
Review” www.libraries.usc.edu/researchguides/literaturereviews. Accessed 2/06/2016.

33
UNIT 3 THEORETICAL AND CONCEPTUAL FRAMEWORKS IN RESEARCH CONTENTS
1.0 Introduction 2.0 Objectives 3.0 Main Content
3.1 Theory in Research 3.1.1 Theory 3.1.2 Features of Theory 3.1.3 The Roles of Theory in Research
3.2 Conceptual Framework 3.2.1 Roles Conceptual Framework Plays in Research
3.3 Theoretical Framework 3.4 Distinction Between Conceptual and Theoretical Frameworks
4.0 Conclusion 5.0 Summary 6.0 Tutor-Marked Assignment 7.0 References/Further Reading 1.0 INTRODUCTION We have just rounded-off discussions on literature review. You will recall that, we considered vital parts of literature review such as: meaning of literature review, it purposes in scholarly write-ups, the types of literature review, referencing in researches and many others. In this section, we shall be looking at theoretical and conceptual frameworks in social sciences research. These aspects in any academic research are considered as the foundation on which a study is built. Therefore, this aspect in academic studies cannot be downplayed. As we continue in this section, we shall be discussing theories in research and its roles, theoretical and conceptual frameworks, etcetera. 2.0 OBJECTIVES By the end of this unit, you will be able to:
• explain what he/she understands about theory in research • discuss the role theory plays in research • define theoretical and conceptual frameworks in research • differentiate between theoretical from conceptual.
3.0 MAIN CONTENT 3.1 Theory in Research Recall that in unit one of the first module, we considered some scholars’ understanding of what research is about. Prominent among these is the definition given by Fagboungbe (1993). He defines research as a quest for new knowledge pertinent to an identified interest or problem through the application of the scientific approach or process of investigation. Also, Asika’s definition (as cited in Chartered Institute of Personnel Management of Nigeria (CIPMN) study pack, 2007) sees research as an organized enquiry that aims at providing information for solving identified problems. These two definitions are pointer to the fact that,

34
research is a process by which solutions are proffered to identify problems scientifically.
In giving solution(s) to problems already identify in social sciences, certain lay down rules which guide the processes are strictly adhered to. Among these rules is that, theories or theory should underpin research works. This will lay the foundation for the study which forms the core of any study in social sciences. By so doing, the process becomes scientific and this lay the basis for theory in research.
3.1.1 Theory Since the basis for theories or theory in research has been established, it is therefore necessary to know the meaning of theory and know all it entails in social sciences research. Theory connotes different things to different people, even including individuals’ fields of study. For instance, in social sciences, certain scholars would identify theory with any form of conceptualization, such as employment, growth rate, wages and salaries, politics, crime, conflict and many others. Theory is a statement of how and why specific facts are related (Adegoke, 2012). This definition shows that, theories in scholarly papers explain how concepts of focus are linked together to aid prediction(s). To give credence to this assertion, Stark’s definition (mentioned in Adegoke, 2012) see theory as general statements about how some portions of the World fit together and function; and which bring about predictions that can be verified. The essence of theories or theory in research cannot be overemphasis. In carrying out an investigative study, researchers would need to review some related theories to the field of study to serve as spring-board or framework for the proposed study. There are times researchers engage more than one theory to underpin a particular investigation. This would however depend on the area of specialization. For example, in natural sciences, researchers largely predicate their studies on a single theory. This is however different in the social sciences where scholars engage a combination of two or more theories as framework for in a study. According to Denzin’s work (cited in Ngulube et al, 2015), a combination of more than one theory in a giving research is known as “theoretical triangulation”. Theoretical triangulation is a situation where researcher/researchers use theories (more than one theory) to explain certain occurrence in a study for better understanding. Triangulation of theories in studies by scholars has the possibility of enhancing the researcher’s understanding of the phenomenon under investigation and increasing the validity of the explanations (Ngulube et al, 2015). 3.1.2 Features of Theory Having considered the meaning of theory, and its link with research, it will be best to look at certain things that theory/theories entail. Appelbaum and Chamblis work (mentioned in Adegoke, 2012) outline some features which a good theory will possess. These are explained below:
• A good theory is distinguished by its usefulness in research: In research/researches, basically, it essence is to proffer solution(s) to a particular problem already identified. Going about it, the lay down guides about conducting research must be followed. One of the rules is the design of “research questions” which the investigation needs to answers. To be able to provide these answers, theory/theories become useful means.
• Logical and Consistency: A good should be logical and consistent in research. It means that the description of a theory in any investigative study should be rational in explaining the whole essence of the study. No theory should contradict itself that is from start to the end, there should consistency in a theory to underpin a study.

35
• Testability: Any conclusion/conclusions that are reached as a result of the involvement of a theory as a framework should be testable. That is, outcomes from such study are not capable of being refuted when subjected to further investigations.
• Simplicity: A good theory should be as simple as possible. Certain theories can be complicated in underpinning a study. When this occurs, researchers at times find it hard to progress with such a study. So, one of the characteristics of a theory is that, it must be simple to explain the subject matter.
• Dynamism: One vital feature of a theory is that; it must be dynamic. By being dynamic, it means that theory/theories overtime change as more information and new empirical evidences are available to subject to further reviews. As these reviews take place, the frontiers and scope of the theory changes to accommodate current happenings.
Self-Assessment Exercise 1
1. One basic rule in research is that, theory/theories are used to underpin investigations. Explain this in relation to “theory in research”.
2. Define theory. How are theories triangulated in a study? 3. Being dynamic is an important aspect of theories. Discuss.
3.2.2 The Roles of Theory in Research Having established the link of theories in research and it outstanding characteristics, the onus is now on us to consider the roles play by theory in research. If theories are used as framework in researches, what purpose does it serve in research? See discussions below:
• Theories incorporate discrete data to make sense: Discrete data are disconnected information or observations which make no meaning when standing separately. However, when this disconnected information is incorporated into theories, and analyzed, it transforms into results that enable conclusions to be drawn. This makes unrelated observations makes sense.
• Theories produce hypotheses: Because research is about bridging the gaps that exist in the body of knowledge, hypotheses play a vital role in this regard. These hypotheses which are consistent with theories are therefore derived and are subjected to test. There are two kinds of hypotheses known. These are the ‘null’ and the ‘alternative’ hypotheses. These shall be discussed in details in unit four (4) of this module.
• Research induces theory: Most researches are carried-out basis on personal observations. When this happened, conclusions therefore emanate which over periods of time can be tested. After periods of consistent result which can be generalized, that consistent result or hypothesis can be translated into a theory.
• Theories as yardstick for research findings: Apart from theories being used as framework around which studies are built, it also serves as measuring stick for outcomes of studies. Every research finding is usually interpreted in line with known theory/theories in that field. For instance, where outcome from a research is not in consonant with a theory, the onus will then rest on the researcher to deplore reasonable explanations to support the outcome.
• It provides structure for a study: Researches, most especially in social sciences are theoretically supported in the course of an investigation. Theory/theories in any research are structures around which the whole set-up of a study is built. Like the physical foundation that supports any erected building, so are theories in researches. Theories help to theoretically explain a study.

36
3.2 Conceptual Framework In considering the roles theory plays in research, it was found that theory provides structure for the phenomenon being studied. The structure mentioned in the context, can be likened to a supporting frame around which walls are built. This is commonly referred to as “framework” in scholarly write-ups. There are two known frameworks in research, especially in social sciences. These are: conceptual and theoretical frameworks. The two have been identified as part of the critical elements for a successful research work (Badiru, 1996). Conceptual framework also known as analytical framework, is seen as simply as a lens to describe and understand the world, like it counterpart (the theoretical framework). Also, the two are different in nomenclature, though, they are both interpretive frameworks (Ngulube, 2015). As a result of this interpretative nature of both frameworks in research, they are seeing as being fundamental to the success of any investigative phenomenon. Conceptual is derived from the word concept, and concepts are labels ascribe to elements of the real world. Also, concepts are ideas or abstract expressions from realities. It equally assists researchers to understand the studying phenomena. Jabareen’s study (as cited in Ngulube et al, 2015) declares that, conceptual frameworks provide understanding, rather than offering a theoretical explanation. Jabareen’s view shows that, conceptual framework is about the description of concepts as they relate to the investigating phenomenon. Ideally some scholars have expressed their views about what conceptual framework stands for in research. Scholars views stated here are mentioned in Ngulube et al,2015. In Jabareen’s view, “conceptual framework is a network, or a plane, of interlinked concepts that together provide a comprehensive understanding of a phenomenon or phenomena”. This view shows that; conceptual framework is a broad understanding about the issues being studied with the aid of the interlinked concepts. Also, Ravitch and Riggan (2012) see “conceptual framework, as both a process and a framework that helps to direct and ground researchers, is “an argument about why the topic of a study matters, and why the methods proposed to study it are appropriate and rigorous”. Simply, the duo’s submission reveals that, a well detailed conceptual framework opens up the issue being studied clearly to the researcher(s). “A conceptual framework explains either graphically or in a narrative form, the main dimensions to be studied − the key factors or variables and the presumed relationships. A framework can be rudimentary or elaborate, theory driven orcommonsensical, descriptive or causal” (Van der Walt, 2003). Van der Walt’s definition or view about conceptual framework explains why in some fields of studies like in natural sciences, flowcharts are employed to conceptualized investigating phenomenon. Robson’s work (as mentioned in Ngulube et al, 2015) declares that where flowcharts are used to represent notions is known as concept maps, integrative diagrams, systems or Venn diagrams, and conceptual modelling. These charts or concept mapping links, differentiates, and relates these notions to each another (Daley & Torre, 2010). What Daley and Torre indicate is that the key concept (the dependent variable) is captured at the top of the chart. Other concepts (the independent variables) which are related to the key concept of interest are recognized and linked to each to the main concept.
3.2.1 Roles Conceptual Framework Plays in Research Having considered the meanings and all that is involved in conceptual framework, it will be of importance to look at the strategic roles conceptual frameworks play in researches.
37
According toRavitch and Riggan’s work (cited in Ngulube et al, 2015), they submit that, conceptual frameworks in researches clarify, explain and justify methodological decisions. For example, a good and well-drawn concept map can reveal to a layman what a particular study is about. This best explains Ravitch and Riggan’s understanding about the role play by conceptual frameworks in researches. Other roles are:
• It makes research coherent: the dictionary means of coherent are clear, logical, lucid, and many others. Research is all about putting together facts, thoughts, ideas and information in such a manner that its outcomes will both be clear and logical in conclusion. For this to be achieved in any investigative study, conceptual framework comes handy.
• Research is made explicit: one of the ways conceptual framework can be utilized to underpin studies is through concept mapping. Concept mapping by definition is the visual representation or display of an investigating phenomenon. It is an instrument that supports the usefulness of conceptual framework in researches. When the constructs or concepts entail in a study are pictorially or diagrammatically shown, the study becomes clearer and explicit even to the ordinary man.
• The selection of key variables is possible: in every research, there are basic concepts that important to a study. With the aid of a well-designed and explained conceptual framework, these key works are carefully selected and prioritized in the study.
• Coherency between empirical and conceptual results is made possible: since research is about solving societal problems, outcomes that result from the process should be made clear to the public. This is where conceptual frameworks harmonize both the empirical and conceptual findings to a form that will be simple and logical in its interpretations.
Self-Assessment Exercise 2 i. Theories are measuring sticks for research output, discuss.
ii. Explain this statement “concepts are abstraction from real world” in relation to conceptual framework.
iii. According to Ravitch and Riggan, “conceptual frameworks in researches clarify, explain and justify methodological decisions.” What can you make out from this statement?
3.3 Theoretical Framework Models are building blocks for theories (Ngulube et al, 2015). Inferring from Ngulube et al’s submission, it means that theories originate from models. In social sciences domain, specifically in the field of Economics, models are visual or mathematical representation of experiences from real world. These models in conjunction with numerical data are then subjected to empirical test which produce testable and verifying outcome(s). Thereafter, these outcomes are tested and generalized in the form of hypothesis. After the hypothesis outcomes have been generalized and accepted, the model is then formed into a theory. Generally, scholars have come to the conclusion that, theories are abstractions from reality. There are really no clear-cut distinctions between a model and a theory. However, be that as it may, unlike model that merely describes a phenomenon, a theory has the ability to explain and predict a phenomenon. Also, while a theory is verified through a preposition, using a known methodology, this is not the case with a model. Theoretical framework is derived from theory. A theory is a research structure around which an investigation on a phenomenon is built. Research methods dictate how a study is
38
conceptualized and interpreted; the theoretical framework informs its methods (Ngulube et al, 2015). Most methodologies or methods used in researches are informed by the nature of the theory that underpins a study. Theoretical frameworks have been variously defined by scholars. Let us consider few of these definitions. According Borgatti (1996) “A theoretical framework is a collection of interrelated concepts, like a theory but not necessarily so well worked-out. A theoretical framework guides your research, determining what things you will measure, and what statistical relationships you will look for.” This definition by Borgatti has further gave credence to Ngulube et al’s submission that, the form of a theory that underpins any research, dictates the methodology to be used. And that many key concepts which are interrelated are embedded in the framework. Also, University of Southern Carolina (2012) defines theoretical framework “as the structure that can hold the theory of a research study. The theoretical framework introduces and describes the theory which explains why the research is being conducted.” By this definition, what theoretical framework does in a study is to fully explain and describe the theory itself, and how it relates to the investigative phenomenon. Ennis (1999) sees theoretical framework “as a structure that identifies and describes the major elements, variables, or constructs that organize your scholarship”. From the perspective of Ennis, theoretical framework is more of a structure which gives shape to a scholarly study. In a nut shell, the meanings of theoretical framework examined as opine by various scholars describe the nature and roles play by theoretical framework in research. 3.4 Distinction between Conceptual and Theoretical Frameworks In social Sciences, both theoretical and conceptual frameworks play key roles in conducting a research. Researchers, especially in social sciences are generally obsessive about knowing the real social world and how man relates with it. This is possible by means of concepts and theories involved in a study to explain certain phenomenon. According to Aworh et al, (2006), “researchers are expected to explain whatever phenomenon they are interested in, only from extant theoretical perspectives”. Therefore, the distinction between the two can easily be derived from the explanations thus given. However, be that as it may, we shall make effort to outline few differences between the theoretical and the conceptual frameworks. While theoretical framework provides a disarticulated guided and inconclusive explanation about the reality of the social world, the conceptual framework synthesizes various theoretical standpoints which lead to new framework. Whereas conceptual frameworks are best explained by means of diagrams, arrows and the likes, to relate the links between the dependent and independent variables, this is not often possible with theoretical frameworks. Instead, models are commonly used. While the theoretical frameworks are predicated on one principal theory, the conceptual frameworks are based on various theories, concepts and constructs as embedded in the investigative issue. Self-Assessment Exercise 3
i. Define theoretical framework. ii. Theories underpin research discuss.
4.0 CONCLUSION In this aspect, vital issues relating to theoretical and conceptual frameworks have been considered. Sub-topics like meaning of theory, the role theory plays in research, theory in research, and a lot of others. Besides, theoretical and conceptual frameworks were deeply discussed. We looked at the distinctions between the two, the role they play in researches, and many more.

39
5.0 SUMMARY In this unit, we have considered in detail theoretical and conceptual frameworks. Among the aspect of theoretical framework and conceptual framework fully discussed were: the meaning of theory, the role of theories in researches, conceptual and theoretical frameworks and their roles, and many others. All these issues discussed fully explained what the topic of the unit is about. 6.0 TUTOR-MARKED ASSIGNMENT 1. Both conceptual and theoretical frameworks underpin any academic study. However,
they differ in orientation. Discuss these differences. 2. List and explain the characteristics of theories. 7.0 REFERENCES/FURTHER READING Adegoke, N. (2012). Research Methods in Social Sciences. Lagos: Prime Targets Limited. Badiru, A. B. (1996). Project Management for Research: A guide for Engineering and
Science. London: Chapman and Hall. Chartered Institute of Personnel Management of Nigeria (CIPMN). (2007). Business
Statistics and Social Research Methods: Intermediate 1. Lagos: Ngulube, P., Mathipa, E. R & Gumbo, M. T. (2015). Theoretical and conceptual framework
in the social sciences. In E. R. Mathipa & M. T. Gumbo (Eds.),Addressing research challenges Making headway in developing researchers, pp 43 – 66. Noordywk: mosala-MASEDI Publishers. Dio: 10.13140/RG.2.1.3210.7680.

40
MODULE 3 DATA ANALYSIS IN RESEARCH Unit 1 Collating data for Presentation Unit 2 Data collection Scales Unit 3 Operationalizing and Data Analysis UNIT 1 COLLATING DATA FOR PRESENTATION CONTENTS 1.0 Introduction 2.0 Objectives 3.0 Main Content
3.1 Nature and Sources of Data 3.1.1 Primary Data 3.1.2 Secondary Data 3.1.3 Internal Source of Data 3.1.4 External Source of Data
3.2 Data Collection Techniques 3.3 Measurement of Data 3.4 Management of Data Quality
3.4.1 Sampling 3.4.2 Sampling Error
4.0 Conclusion 5.0 Summary 6.0 Tutor-Marked Assignment 7.0 References/Further Readings 1.0 INTRODUCTION In unit 4 of the just concluded module, you leant about research topic and guidelines for chosen a researchable topic. In one of the guiding principles, it was stated that a researcher or project student should select that research topic or project topic in which ‘data’ are easily available. In essence, availability of data is very crucial to the researcher and the studied area. Because of the strategic nature of data in research, in this unit, you will learn about ‘data acquisition’ and all that is entails. Data acquisition is simply the process of gathering the needed information about a phenomenon under investigation. In fact, you are about to study another interesting unit, where you learn about the nature and sources of data, data collection methods, etc. 2.0 OBJECTIVES By the end of this unit, you will be able to:
• define data • identify the various sources of data • list the data gathering methods • explain data measurement

41
3.0 MAIN CONTENT 3.1 Data Collation Data collation cannot be wholly understood without first understanding what ‘data’ are in research. The term data are vital to social and natural sciences research, especially when undergoing economic studies. What are data?A lot of understanding and meaning has been adduced to data by various scholars. Data are values of qualitative or quantitative variables, belonging to a set of items. They are abstract concept that can be viewed as the lowest level of abstraction from which information and follow by knowledge are derived (Gertrudes, 2007).From this simple definition, we can deduce the differences between data and information. Unprocessed data (raw ones for that matter) make no meaning to the researcher until they are worked on (i.e. processed). This is the basic distinguishing factor between data and information. In the interim, our focus is on data collation not information. However, the row of data in social and natural sciences cannot be overemphasis as information and knowledge are dependent on it. Little wonder Neter el ta (1978) opines that, data are facts or figures from which conclusions may be drawn. And that data are raw material of statistics, in which without it no statistical analysis can be done. The procedure for putting these data together by researches in order to draw conclusion is known as ‘data collation.’ It is important to understand that, data collation is not synonymous with ‘data collection’, and it cannot be used interchangeably. While data collection is all about WHO, WHAT, WHERE, WHEN, WHY and HOW data are gathered, data collation is the preparation and summation of data from the same data elements, but from the different sources or the summation of data from identical source but over a period of time (Gertrudes, 2007). For example, the purpose of data collation is to obtain information to keep on record, to make decisions about important issues, or to pass information on to others. The collation of data is procedural. By this, it means that, after the collection or gathering of raw data from various sources, using various tools and from various strata of the population, these data would have to be organized in a form that would enable conclusions to be drawn, and decisions made. The organization of these data into a form that would be useful to the researcher will require some statistical analyses or procedures such as data grouping, data tabulation, data tally, data frequency and a lot more. All these processes put that data in a collation form which makes it presentable to provide information require for a purpose. 3.1.1 Nature and Sources of Data Collated We have understood in simple term what data collation in research method is all about. At this juncture, it is very important to discuss the nature and the sources of the data collated. Data are either qualitative or quantitative. It is qualitative when not countable or measurable. For instance, attitude of an individual, colour, sex, qualification, etc., are good examples of qualitative data. On the contrary, quantitative data are countable and measurable. This allows for the correct value(s) to be ascertained. This day, research is going numerical. This implies that, seemingly intangible concepts such as intelligence, anxiety, etc., can now be assigned numerical values. In the past, these intangible concepts were seen as qualitative because expressed characteristics were merely described and explained. There is the need to understand that the nature of data collated for a particular study is dependent on the following: the purpose of research, population and sample of subject, and the problem-focus

42
of the research.Project students or researchers do collate research data as regard the study they are undertaking. However, what guides them towards the type, volume, population, sample, and so on of information require determines the nature of the data guided by the aforementioned factors.
Two main sources of data collated in research exist. These are the internal and the external, and data gathered from these sources can further be categorized into primary and secondary data. This is in line with the method employed in collecting these data.
3.1.1.1 Internal Sources of Data These are data that are generated within the confine of an establishment, in the course of its day-to-day task. For instance, Business firms like those of financial institutions produce a large financial data such as volume of transactions, balance sheets, data on income statement, data on its staff, etc. In the same vain, higher institutions of learning generate and keep data on internally generated income, enrolment figures per session, subventions from government, and a lot more. Peretomode et al (2010) conclude that, when an organization works on its own created data and publishes same, which acts as its own source data, such is recognized as internal data.
3.1.1.2 External Sources of Data They are data sources other than the internal sources. These are data that are utilized by researcher(s) or organization(s) that do not generate them. They (external data) are numerous and varied as they are gotten from published documents. External data source is further is grouped into ‘primary’ and ‘secondary’ sources. Primary source data is one of the ways external data can be obtained. It is the gathering and publication of data generated by the collecting body. For example, population figures collected and published by National Population Commission (NPC). While secondary data source in external data, is the publication of data different from the one originally gathered by the organization. According Richmond cited in Peretomode et al (2010) ‘primary data’ are those collected by the analyst or the agency; and it is ‘primary source’ of data when the agency or the individual publishes them in a publication. In the same vain, when an individual uses data already compiled in a publication published elsewhere, the individual uses ‘secondary data’. However, if an organization which did not part-take in the original gathering and collation of the data but published the data, they are refer to as ‘secondary source’ of data.
3.1.1.3 Primary Data A lot of times, studies are geared towards achieving a specific purpose and these studies may involve that the individual concerned creating his own data. At time, there are cases where there are no data to assist the researcher or where the information available is not adequate for the study; this may necessitate the generation of data for the purposes of the study. Primary data gathering is known to be connected with field observations, questionnaires, personal interviews and experiments. These methods allow the data to be collated in line with need of the study. 3.1.1.4 Secondary Data They are data that had been collected and processed by an individual or organizations and only extracted for use by researchers. Such data are usually gotten from either unpublished or published sources like books, journals, office reports and statistics, newspapers, magazines, institutions records, government gazettes, National Bureau of Statistics (NBS), Central Bank

43
of Nigeria (CBN), National Population Commission (NPC), Nigerian University Commission(NUC), WAEC, NECO, etc. Information under this category is ready made; such that users have no control over it. Researchers are therefore advised to be cautious about their use. The reason is that at times these data may be obsolete or may have been tampered with. Self-Assessment Exercise 1
i. What are data? ii. List and explain the two basic data source.
iii. Data collation is not synonymous with collection data, discuss. 3.2 Categorical and Numerical Data The fact that data in this modern time is fast becoming numerical, it’s still remains an undeniable truth that numerical data are part of class of data. Data are classified into to two categories both in natural and social sciences research. These categorizations are ‘Numerical and Categorical’ data (see fig 3.1). These are explicitly discussed below: 1.2.1 Categorical Data In statistics, categorical data are statistical data which consisting of categorical variables or, they are data which have been transformed into a form, such as grouped data. Therefore, categorical variable (also known as nominal variable) is one that has two or more classes with no intrinsic ordering to the groupings. A good instance is gender. Gender is a categorical variable having two categories (male and female) with no intrinsic ordering to the categories. Another visible example is colour. Colour has numbers of classes or categories these are white, black, red and many more known. A purely categorical variable permits researcher to assign categories but cannot clearly order the variables. In fact, there is no acceptable means of ordering the variables from highest to lowest or vice vasa.
Categorical variables can equally be referred to as discrete or qualitative variables. They (categorical variables) can take on exactly two values known as dichotomous variable and polychotomous variable. Dichotomous variables are also nominal variables; these variables have just two levels. A perfect example is the case of gender as mentioned earlier. In that instance, an individual we would most probably be categorized as either "male" or "female". On the other hand, polychotomous variable is variable that can have more than two values. It can be ordered, unordered, or sequential: Instances of these data include blood type such as blood group A, B, AB, O and many others.Variable or data that have more than two possible values are all classed under polychotomous except for binary variables. Categorical data or variables are not onlydichotomous and polychromous, they are also nominal, ordinal, interval and ratio data or variables. These are discussed under measurement of data.
1.2.1.1 Measurement of Data
Data measurement in both natural and social science studies is the recording of observations that are gathered in the course of conducting research. It equally entails assigning values to the human behaviour under investigation. This involves the sorting, classification, categorization of the properties and qualities of the human behaviours (Adegoke, 2012). The assigned values can be in numbers, symbols or values of unit analysis. There are four measurement scales in valuing research data or variables.
• Nominal variables are variables that have two or more categories (that is dichotomous or polychromous) but do not have any basic order. For example, an estate agent in Abuja could classify the building properties under his/her control into categories such

44
as mini flat, 2-bedrooms, 3-bedroms or duplex. This shows that, the type of building property is nominal in nature because it has four (4) categories. It is pertinent to note that, the different categories of a nominal variable can also be called levels of the nominal variable. Also, classifying people according to their various states of origin in Nigeria is another good instance of nominal variable.
• Ordinal variables are variables that have two or more categories like nominal variables; however, these categories can be ordered or ranked unlike in nominal variables. For instance, suppose a question is asked about “economic policies in Nigeria” and we have responses such as ‘very impactful’; ‘OK’ and ‘not very much.’ This is a case of ordinal variable. The “economic policies in Nigeria” is an ordinal variable with three categories of responses such as ‘very impactful’; ‘OK’ and ‘not very much. These responses can be ranked from the most positive (very impactful), to the middle response (OK), to the least positive (Not very much). Yes, the responses can be ordered or ranked; however, values cannot be assigned to them. For example, the response ‘OK’ cannot mean to be trice or twice as positive as ‘very impactful or ‘not very much.’
• Interval variables are similar to ordinal variables, however,their distinctive feature are that they can be measured along a range and have numerical value assigned to it. Time is a good example of an interval variable or scale with known incremental values. These interval values are consistent and measurable. Another good instance is the temperature gauge calibrated in degrees Celsius or Fahrenheit. The difference between the degrees Celsius (100Cand 200C, 800C and 900C) is of constant interval. In this instance, 100C is the constant interval. However, the shortcoming with interval scales/variables is that, they don’t have a “true zero”, and it is not possible to compute ratios because it is only addition and subtraction that are possible with interval data. Multiply or divide interval data is highly impossible.
• Ratio, it a version of data measurement scale and it is the highest level of data measurement in research. This is because; it possesses the attributes of nominal, ordinal and interval variables/data. Variables such as weight, area, speed, velocity, and many more are sets of variables which no other scale is appropriate except the Ratio. Ratio has an absolute or natural zero (“0”) which has realistic implication. When a measure is zero on a ratio level, it indicates that the variable has none of the things being measured. All the operations in mathematics (addition, subtraction. multiplication and division) are only possible on a ratio because of the absolute zero.
1.2.2 Numerical Data Recall we mentioned earlier that data are fast becoming numerical. However, no matter what, some data are still categorized as categorical (i.e. nominal, ordinal, interval and ratio). Numerical data are generated from numerical variables (variable is a property, or a characteristic, of a data that may vary from one item to another or over time, while features of data are described by collection of variables). Numerical variables are also quantitative in nature. That is, numerical and quantitative are synonymous, and can often be used interchangeability. By understanding, numerical or quantitative variables are variables measured on a numeric scale. That is, they have values attached which are numerate in nature such as Height, weight, response time, temperature, and examination scores are good examples of numerical variables. Numerical variables are differentiated from categorical (also known as qualitative) variables such as gender, sex, state of origin, and nationality where there is no ordering or measuring involved. Numerical data come in form of a

45
measurement or counting. Supposing a conversation ensue between two individuals, and we have statement such as what is height and weight, and the other individual responded by saying 3.8m and 67kg. Or what numbers or volumes of shares you ownin First Bank PLC, how many pairs of shoes have you in store over there? The answers to these will always be in counting form such as 10000 shares and 12 pairs of shoes. These are numerical data. Numerical data can be further broken into two groups, they are discrete and continuous.
• Discrete data is sub-set of numerical data. It represents things that can be numbered; they take on possible values that can be listed out. That is, variables whose values are whole numbers (counts) are called discrete. Discrete data is further sub-divided into finite and countably infinite. It is finite data when the possible values are fixed. For instance, the number of ones in 2 dice cast takes on values from 0 to 12. However, countably infinite data are possible values which can be counted up to infinity. For example, the number of flips needed to get 100 tails takes on values from 100 on up to infinity (if you never get to that 100th tails).
• Continuous data represent possible values of items which cannot be counted and can only be described using intervals on the real number line. In simple term,continuous data are variables that may contain any value within some range. A good instance is, the actual amount of petrol (motor spirit) bought at the filling station at a price for cars with 17 litres. It is a continuous data because, it counts from 0 or 1 liter to 17 litres, which is represented by the interval [0, 17], inclusive. As a buyer, you could decide to purchase 2.80 litres, 4.52 litres, 6.12566 litres, or any possible volume as far as it falls within the range of 0 or 1 to 17. You might pump 8.40 gallons, or 8.41, or 8.414863 gallons, or any possible number from 0 to 20.
Fig 3.1: Chart showing the class of Data
Self-Assessment Exercise i. What are the basic classes of data you know?
ii. Blood groups belong to a class of data, discuss.
Class of Data
Categorical Numerical
Continuous Discrete Nominal Ordinal Interval Ratio

46
3.3 Analysis and Presentation of Categorical Data From the foregoing, it is clearly evident that you now understand what categorical data are all about, going be what you have learnt thus far about data and its nature. Recall we have mentioned that, categorical variables or data are also qualitative in form. That is, they are with no intrinsic value(s). They are unlike numerical data which are quantitative in nature, which have intrinsic values (that is, countable). The onus on us is to show or describe how these data (categorical) can be analyzed and presented in-order to convey the require information the public to aid decisions.
To clearly analyze and present categorical data that would assist top executive management in strategic decision making, some statistical tools such as Frequency table, Graphs (frequency graph, bar graph, histogram, etc.), Chi square, Spearman rank correlation, Contingence table, and a lot of others shall be a perfect instrument in this regard. For instance, information about Nigerians’ blood groups can be gathered from medical centres across the nation, and the most popular of these groups would want to be ascertained. To do this, frequency table comes handy as a good statistical tool to show the blood group with the highest number (that is, the most frequent/occurring among the blood groups). Frequency distribution or table consists of counting number of scores which fall into various response groups, such as blood groups A, B, AB, and O. Where people do not fully understand the information presented in the table, further analytical step could be taken to make to information clearer. At this juncture, frequency graph, histogram or bar graph is employed to present the information in a picture form for better understanding. Graphs are simply defined as pictorial representation of figures.
Furthermore, there are instances when researchers would want to establish if there are possible links between two or more categorical variables. For example, a researcher may be interested in knowing if there could be any possible association between the kinds of blood group that human- beings have base on sex (male and female). To analytically carryout this study, the researcher could use Chi square or Spearman rank correlation as a statistical tool to analyze the data collected. Chi square and Spearman rank correlation are statistical instruments utilized to establish any possible link between categorical variables. These tools (Chi square and Spearman rank correlation) are fully discussed in module four.
See a hypothetical example of how Chi square is applied to establish links between two categorical variables. A group of students were classified in terms of personality (introvert or extrovert) and in terms of colour preference (red, yellow, green or blue) with the purpose of ascertaining if there any nexus (relationship) between personality and colour preference. Data was collected from 400 students and presented in the 2 (rows) x 4 (columns) contingency table below:
(Observed counts) Colours
Red Yellow Green Blue Totals Introvert personality 20 6 30 44 100
Extrovert personality 180 34 50 36 300
Totals 200 40 80 80 400
Suitable null and alternative hypotheses might be:

47
• H0: Colour preference is not associated with personality • H1: Colour preference is associated with personality
To perform a chi-squared test, the number of students expected in each cell of the table if the null hypothesis is true, is calculated.
Calculated
The expected numbers (under the null hypothesis) in each cell are equal to
Thus for the introvert/red cell the expected number is
To calculate the chi-squared (�2) statistic the value of
needs to be known for each cell in the table. For instance, the introvert/red cell is
The chi-square statistic is calculated to be total of these values
(Expected counts) Colours
Red Yellow Green Blue Totals
Introvert 50 10 20 20 100
Extrovert 150 30 60 60 300
Totals 200 40 80 80 400
From these expected and the observed values, the chi-squared test-statistic is calculated, and the resulting p-value (probability value) is examined.

48
Note: The p-value is printed as .000. The general rule (rule of thumb) when using probability value is, if p-value > 0.001, H0 (null hypothesis)is not rejected. That is, you accepted the H0, and if otherwise, you rejected H0, and accept the H1 (i.e. alternative hypothesis).
Results
The chi-squared test statistic is 71.20 with an associated p < 0.001.
The null hypothesis is rejected, since p-value < 0.001, and a conclusion is made that colour preference is associated with personality. This is line with the hypotheses stated earlier. Looking at the data, is noted that more introverts prefer blue Colours than expected and less preferred red. The extroverts tend to favour red more than blue.
Apart from that we have been able to analyze categorical data using Chi-Square, frequency graph (or bar chart) can be used to analyze the data. Recall, it mentioned earlier that bar graph is engaged to present the information in a pictorial form for better understanding. Consider the bar graph below
Fig: 3.2: Bar chart showing the relationship between personality type and colour preference
3.4 Contingency Table Outside the chi-square applied to analyze a hypothetical instances of the relationship between two categorical variables, another interesting statistical instrument that can be used to analyze categorical variables/data is the contingency table. Contingency table is an exhibition of the observed frequencies of two or more categorical variables, which are arranged in rows usually denoted by letter ‘r’ and in columns also denoted by the alphabet ‘c’. The whole of the observed frequencies of the two variables being considered is referred to as the sample size, and mostly represented by small letter ‘n’. Shown below is a typical format of a contingency table. However, before considering a hypothetical contingency table, it is very important to understand the procedural process of ascertaining the Chi-square from a contingency table. Consider the test procedure itemized below step by step. It is very important especially for

49
research students (final year students in Colleges of Education, Polytechnics, Universities, etc.) to familiarize themselves with these steps. Analysis Process:
1. Remember to state the hypotheses. That is, the null and the alternative. Students should learn more on how to state the null and alternative hypotheses between two mutually exclusive variables.
2. The randomly selected sample, which is the observed frequencies (values) should be enter/recorded in each cell of the contingency table, and the row, column and grand totals estimated.
3. Thereafter, evaluate the expected frequencies often called E-values for each cell. 4. Determine the valueof the test – statistic (that is, the Chi-square value). 5. Having done step 4, proceed to calculate the degrees of freedom (df). This is very
crucial in arriving at the final decision. Therefore, df = (r – 1) (c – 1), where r and care both numbers of rows and columns in the contingency table.
6. Then use the significant level as given, usually α = 5%/0.05 or otherwise stated and df, determine the critical value (as known as table value) ��� , and
7. Compare the table value (���) and the calculated value of χ2, and decide on the variable dependency using decision rule. Decision Rule:
• Do not reject H0 if χ2 is less than ��,�(r-1)(c-1).
• Reject H0 if χ2 is greater than ��,�(r-1)(c-1).
Contingency Table Format
Variable Y Variable Z Total Z1 Z2 . . . Zc
Y1 O11 O12. . . O1c R1 Y2 O21 O22. . . O2c R2 . . .. . . . . . . . . . . . . . . . . . . . .
Yr Or1 Or2 . . . Orc Rr Total C1 C2 . . . Cc n
From the contingency table formant shown above, we can by inference deduce a lot. For instance, the two categorical variables proxy by ‘Y’ and ‘Z’ are mutually exclusive. That is, they have nothing in common. For example, a researcher may decide to investigate into ‘colour’ and ‘human personality.’ These are two categorical phenomena from simple understanding do not have any thing in common. Other inferences that can be drawn from the table are: (i) Both the numbers of rows and columns that make up the table can be ascertained (it is a
table where items or figures are arranged in rows and in columns). Even, the sample size can equally be known. This is always denoted by the grand total.
(ii) The figures or values of the observed frequencies can be determined via the intersection of the individual rows and columns.
(iii) The totals of each row and column, is the summation of the frequencies that make-up the rows and columns.
(iv) The expected frequency, which in this case is represented by Eij is the observed frequency in row i and column j in various cell of the table estimated thus:

50
Eij = T T
T
Row ColumnSample×
This formula will be used to estimate the expected frequency in the various cells. These cells
are likened to E11, E12, E21 and E 22 as calculated below.
Let consider an imaginary instance using contingency table. Supposing 400 students, 260 boys and 140 girls were interviewed about their affection for two major vehicles Brands in Nigeria: Toyota and Honda. The results reveal that, while 160 preferred Toyota, 100 liked Honda in the boys’ group. In girls’ category, while 90 liked Toyota, Honda was the choice of 50. The question now is, do these classes of people (boys and girls) vary in their affection for the brands of vehicles?
Solution: There is the need to design the “observation table” to show both the rows ‘r’ and columns ‘c’, and then proceed to state the two hypotheses (i.e. the null and the alternative). Thereafter, we shall determine the “contingency table” using the expected frequency formula( )ijE . From
there, we compute the chi-square ( )2χ test statistic; compare the outcome with the critical of
the table value, and decision can be inferred from that.
Observation table
H0: Sex and vehicles brand are independent
H 1 : Sex and vehicles brand are dependent of one another.
The estimated expected frequencies using the E ij formula are as state below:
E11= 162.5 E12= 97.5
E21= 87.5 E 22 = 52.5
Having estimated the expected frequencies from the observed frequency table, we shall therefore design an expected contingency table using the figures.
Vehicles Brand
Sex Toyota Honda Total
Boys 160 100 260
Girls 90 50 140
Total 250 150 400

51
Contingency table
Toyota Honda Total
Boys 162.5 97.5 260
Girls 87.5 52.5 140
Total 250 150 400
Therefore, the computed chi-square test statistic employing the tables, the observed and the contingency tables, we shall have the figure below as the chi-square calculated:
( )2
2 0 E
Eχ −
= Σ = 0.43.
The degree of freedom (df) for the contingency table is given thus: (number of rows – 1)
(number of columns – 1) is equal to (2-1) (2-1) is equal to 1. At 2
0.05,1χ = 3.84. Therefore,
since the calculated value (0.43) is less than the table or critical value (3.84), we do not reject the null hypothesis. Hence, we conclude that sex and vehicle brand is independent.
Self-Assessment Exercise 3 1 Briefly explain the importance of Chi-Square in analyzing categorical data. 2 Frequency table comes handy as a good statistical tool when analyzing categorical
data in social science research, discuss.
4.0 CONCLUSION So far, we have discussed what data collation is all about. It is thus clear that, data collation and data collection cannot be used interchangeably. The various sources of data collation have also been discussed, where we looked at both internal and external sources. We equally discussed categorical data. We have seen its categories, how they are measured, and their presentation and analysis. The section was rounded off discussing contingency table, and it can be used to analyze categorical data.
5.0 SUMMARY Having studied categorical data/variables, and they are analyzed, it is pertinent to know that categorical variables such as colour, personality and others can be analyzed like the numerical variable or data. 6.0 TUTOR-MARKED ASSIGNMENT
1. What are data? Explain the two main data sources you have read about. 2. Data collation is essential in research, list and explain any five mode of data collation. 3. In quality data management, three main issues come to mind. List and explain them.
7.0 REFERENCES/FURTHER READING Adegoke, N (2012), Research Methods in Social Sciences, Prime Target Limited, Lagos.
Adeleke, J.O (2010). The Basics of Research and Evaluation Tools.Ogba Lagos: Somerest Ventures,

52
Afonja, B., Olubusoye, O. E., Ossai, E & Arinola, J. (2014). Introductory Statistics: A Learner’s Motivated Approach. (Revised edition). Ibadan: Evans Brothers (Nigeria Publishers) Limited.
Ihenacho, E. (2004). Basic Steps for Quality Research Project. Lagos: Noble-Alpha publishers.
Neter, J., Wasserman, W. & Whitmore, G.A (1979). Applied Statistics.Massachusetts, U.S.A.:Allyn and Bacon, Inc.
Peretomode, V.F., Peretomode, O, & Ibeh, A.E (2010). Statistical Methods in the Behavioural Sciences and Education: A Systematic Approach. Somolu, Lagos: Onosomegbowho Ogbinaka Publishers.
53
UNIT 2 DATA COLLATION SCALES CONTENTS
1.0 Introduction 2.0 Objectives 3.0 Main Content
3.1 Likert Scale 3.2 Semantic Differential Scale 3.3 Thurston Scale
4.0 Conclusion 5.0 Summary 6.0 Tutor-Marked Assignment 7.0 References/Further Reading 1.0 INTRODUCTION In the foregoing section, we considered data collation, the source, categorical data, presentation and analysis of categorical data, and a lot of others. We have learnt that, in social and natural sciences, the collation of data is not synonymous with data collection. Recall also that, in the summary preceding unit, we had mentioned that categorical data like numerical data can be estimated. The estimation of categorical variable is made possible by virtue of the scale used. In this part, we shall be looking at collection scales such as Likert, semantic differential, and others used in social sciences research.
2.0 OBJECTIVES
By the end of this unit, you will be able to: • discuss at least one scale used in social sciences research • apply at least one of the scales in your research.
3.0 MAIN CONTENT 3.1 The Likert Scale As already discussed, categorical variables are indeed qualitative in nature. They basically have to do with issues like personality traits, attitudes, behavioural change, perceptions, values and a lot more. These variables are not easily measured or captured when it has to be examined. Until the advent of Likert scale as a means of measuring qualitative variables, various non-convincing methods have been used to quantify values and attitudes. In both social sciences and natural sciences researches, qualitative studies, that have to do with categorical variables, need be analyzed. To be able to carry out the analysis effectively, these variables (i.e. qualitative) require transformation for easy of presentation and analysis. In this transformation lays the difficulties. In order to overcome these difficulties, scaling of qualitative variables becomes essential and helpful. One of such scales is the “Likert Scale.” Rensis Likert in 1932 developed what is now commonly known as Likert Scale. This he did as a response to the difficulty in measuring qualitative items like values, personality traits, perceptions, etc. By definition, Likert scale is a composite of a series of Likert-type items that are combined into one composite score/variable when analyzing data. Meanwhile, Likert-type item is a single question that uses some aspect of the original Likert response substitutes. According to Clason & Dormody (as mentioned in Boone & Boone, 2012) originally, Rensis Likert used a series of questions with five response alternatives like strongly approve,

54
approve, undecided, disapprove, and strongly disapprove. However, it is now commonly stated as strongly agree, agree, undecided, disagree, and strongly disagree. This is what is usually referred as the Five-Likert scale. We shall discuss more of the forms of Likert scales soon in this section. A good understanding Likert scale shows that, there is always a positive-to-negative or a negative-to-positive dimension to most qualitative variables or items such as attitude, personality traits, behavioural changes, etc. That is, a case of two extremes to an issue such as attitude. For instance, we can say Willy has a ‘good attitude’ when compare to Bola whose ‘character is bad.’ In between these two extremes (good and bad), we have strongly good, undecided/neutral, and strongly bad. See diagram below for detailedillustration. Positive Neutral Negative
Sources: Adapted from Johns, R. (2010). Likert items and Scales, University of Strathclyde
Looking at the diagram, from whichever direction we go/move, the two extremes (that is positive-to-negative and negative-to-positive) described earlier above must be attained.
Self-Assessment Exercise 1
Define and explain Likert scale.
Data Collection Methods
The methods employed in the gathering of data by any researcher in the process of undertaking a study is a function of the research design take on by the researcher. That is, the set of data that will be collected in any study to be carried out will be in line the research designs’ requirements and purposes. It is worth of note to know that the system of information gathering has a serious effect on the research outcome.
The modalities of data collection are discussed below. Meanwhile, any of the modalities discussed here under that best suits the research design could be adopted by the researcher.
(a) Questionnaire Approach: This approach is the commonest form of data collection in research. In fact, Neter et al (1979) describe questionnaire as the vehicle which aids data collection. It involves the distribution of question items that are expected to produce important information from the targeted audience. These responses are later transformed into computer readable form known as data through a process called ‘codification’. Codification is a process in which answers to question item in questionnaires are transformed into a form to be understood by the machine (computer). Three different means to administer questionnaire are:
(i) Questionnaires directly administered to the targeted audience by the researcher or the research assistances.
Strongly
Agree
Agree Undecid
ed
Disagre
e
Strongly
disagre
e

55
(ii)Postal Questionnaires: The questionnaires are sent to the respondents via the mail, and the respondents in turn return the questionnaires back to the researcher.
(iii) Questionnaires filled by the field officers who serve as interpreters in highly technical aspect of the questionnaires, the field officers are permitted to help fill the questionnaires on-behalf of the respondents because they know the questions better than they do.
(b) Observation Approach: this is the direct watching or noting of a phenomenon in an ongoing event. In the non-experimental systems such as this, personal observation is a necessary sin-qua-nor. Data are collected directly and used for research purpose. This approach is advantageous in that, it caters for problems such as incomplete and distorted recall. However, the approach allows for bias as result of human nature.
(c) Interview Approach: It is a method where the interviewer asks questions that are already prepared in a questionnaire form and record the respondent’s response in a space provided in the questionnaire. The interview system is most appropriate when structured. The organized interview has standardized questions that are formal and questions to all respondents must be precisely the same and even arranged in the same way. This permits for uniform gathering of data from all the respondents and as a result is easier compare to the unorganized interview. The organized interview can be used to test hypothesis; it is not so the unorganized type.
(d) Report Approach: This technique of data gathering has a link with the secondary source of data. It is a situation where already documented information is pooled together for a study purpose. Data collected through the secondary sources fall under this category. These forms of data are commonly used but could be misleading in most instances.
(e) Telephone Approach: It is another method of gathering information (data) for a particular research. It is a process where questions are asked by the interviewer and the respondent responds via a medium known as the telephone. In this case, the interviewer asks the respondents questions and records them as approximately as possible. These responses are subsequently used to generate the research data.
(f) Results of Experiments Approach: The experimental designs in research studies produce a1ot of information. The information gotten from these experiments are regular happenings in researches.
Self-Assessment Exercise 2
Identify and discuss briefly techniques of data gathering known to you.
3.3 RESEARCH DATA MEASUMENT
Data are gathered using research tools in the course of undertaking a study. The graduations of these tools are peculiar to the kind of research design embraced by the researcher. The graduation of these tools is dependent on the measurement parameter and design of the tools. According to Adegoke (2012), measurement of research data is the observation and recording of observations that are gathered in the course of the study. It equally entails assigning values to the human behaviour under investigation. This measurement involves sorting,

56
classification, categorization of the properties and qualities of the human behaviours. These assigned values are numbers, symbols or values of unit analysis. There are four levels of measurement in research data. These are discussed shortly.
Nominal Level: Nominal level is the lowest level of measurements obtained in research studies. It is a scaling measurement that assigns numerical values to attributes exhibit by human behaviour under investigation. For instance, the sex of a human entity (if Male=1, otherwise=0); State of Origin (Aba=1, Adamawa=2 ...Zamfara=36); Marital status (married=1, single=2, separated=3, divorced=4, widowed=5); etc. It should be noted that numerical names are just labels for identification which cannot be ordered or added.
Ordinal Level: Ordinal level has features similar to the nominal level but added to this is the element of rank ordering in terms of highest to lowest or biggest to smallest. Ordinal level is a scaling measurement which ranks the perception of an individual as regard issues under study. A good example of ordinal level is the Likert scale use in questionnaires. Two types of Likert scales exist. Thèse are the five-point and the four-point scales :
Statement: Research method will not be helpful to me in the course of furthering my studies. Response options: . 5. Strongly Agree . 4. Agree . 3. Undecided . 2. Disagree . 1. Strongly Disagree A case of 5-point Likert scale. Statement: English is no longer useful to me in course of my studies. Response option: . 4. Strongly Agree . 3. Agree . 2. Disagree . 1. Strongly Disagree A case of 4-point Likert scale. Ordinal scales cannot be added or subtracted.
Equal — interval or interval Level:
This measurement scale (Equal-interval) also possesses the features of the earlier discussed data measuring scales (nominal and ordinal levels). This in a way has made the interval scale a higher-order scale which can be utilized in more sophisticated measurements. On an interval scale, the distances are numerically equal and they also represent equal distances on the property being measured. Unlike the ordinal scale, Interval scales can be added and subtracted. A good instance of the use of interval scale is the measurement of temperature.
Ratio Level: This version of data measurement scale (Ratio scale) is the highest level of data measurement in research. This is so because, it has the features of nominal, ordinal and interval scales. Some variables such as weight, area, speed, velocity, and many more are sets of data which no other scale is appropriate except the Ratio scale. The ratio scale has an absolute or natural zero (“0”) which has realistic implication. When a measure is zero on a ratio scale, it indicates that the variable has none of the things being measured. All the

57
operations in mathematics are only possible on a ratio scale because of the absolute zero (addition, subtraction. multiplication and division). Ratio scales are better used in the laboratory. In the case of questionnaires where there is no absence of opinion, Ratio scale will be useless.
Self-Assessment Exercise 3
List and explain the various data measurement scales you have studied.
3.4 Management of Data Quality
Thus far we have look at the various scales of measuring data meant for the purposes of a study. We have identified four measurement levels such as Nominal, Ordinal, Interval and Ratio levels. Meanwhile, quality research data for analysis are necessary- sin- qua- nor for dependable result. We have earlier on discussed that, the purpose of undertaken a study is to proffer solution to identified problems in any society. For this to be possible there is the need for quality data that are gathered using the required measuring scale instruments. Poor quality data can mislead and could bring about disastrous outputs if conclusions are drawn from it (Ihenacho, 2004). Therefore, data quality is important and should be taken serious when undertaken a study. When data quality management is discussed, three major issues come to mind and these are: measuring instrument, validity of design, and reliability of design. For the purposes of knowledge and understanding, these three major terms are discussed below.
Measuring Instrument
Poor data quality is a function of disastrous results in some studies. To mitigate this occurrence of these disastrous outcomes in researches, there is the need for management of data in which measuring instrument is key. Measuring instruments are different and depend solely on the nature of study and the research design of in place. There are different kinds of research, and each requires a particular measuring instrument. For instance, an experimental research requires a weighing instrument; a survey research will need a questionnaire, while an observation schedule is needed in observational research. In carrying out a study, a suitable and accurate choice of measuring instrument in line of with the research design is very essential. Data quality is extremely susceptible to failure when an erroneous instrument is used for data collection. A case in point is survey research where a rating scale is more suitable than a questionnaire.
Validity
Validity is a very important feature in a measuring instrument. It is the extent to which a test measures what it is meant to measure. Validity is a personal judgment that centres on experience and realistic indicators. In research, validity can be described in two ways namely: validity of design, and validity of measurement (instrument and data).
Validity of Design
A design is said to be valid if it able to produce the right reactions from sample subjects; otherwise it is a defective design and may not produce the right outcomes. Asika (1991) tags it validity of findings. Validity of design consists of two vital issues associated with designs and that may result to problems; these are internal validity of design and external validity of design. While the former finds out whether the research design actually stimulates the require

58
responses for which it was designed, the latter (external validity) is concerned with whether the sample design is a true representative of the whole target population and the problems caused by external factors.
Validity of Measurement
It is the ability of an instrument to measure that which is meant to measure. That is, a research tool accurately measuring what it is detailed to measure. For example, a test in a study which is done to measure the reading skills of students in Junior Secondary Schools instead measures factors affecting reading cannot be adjudge a valid measurement. For a measurement to be valid, it must be able to measure accurately what it is meant to measure. The validity known are; content validity, construct validity, face validity, etc.
Reliability of Design
By definition, reliability is the extent to which a test is repeatable and yields consistent outcomes. It is important to note that, in order to be valid, a test must be reliable; however, reliability does not guarantee validity. Research by its nature sometimes requires that data need to be collected over and over again for the purpose of consistent results.
Reliability is understood to be the consistency between independent measurements of the same phenomenon. Reliability is therefore the steadiness, constancy and sureness of a measurement tool. For instance, using multiple-choice exam question to assess individual student’s academic capability would not be considered a reliable basis for grading students’ academic differences. Instead, many questions could be asked varying forms which can assist in getting a dependable assessment. There are several kinds of reliability known in reliability measurement, these are; split-half reliability, alternative/parallel form, test-retest reliability, etc.
4.0 CONCLUSION
So far, we have defined data and had discussed the methods of gathering data in researches. You now understand the avenues of sourcing information for any research being undertaken. Meanwhile, there are two kinds of data (the Primary and the Secondary data). Any of the two in use in a particular study will depend on the nature of the study. Some element of scaling, and various scaling measurements have been treated. Be reminded that whatever tool use in a study, it must be reliable and valid.
5.0 SUMMARY
Having now got our meaning of data and how they are being collected, we shall now proceed on to the next level to discuss data classification and all it entails.
6.0 TUTOR-MARKED ASSIGNMENT 1. What are data? Explain the two main data sources you have read about. 2. Data collation is essential in research, list and explain any five mode of data collation. 3. In quality data management, three main issues come to mind. List and explain them.
7.0 REFERENCES/FURTHER READING

59
Adegoke, N. (2012).Research Methods in Social Sciences.Lagos:Prime Target Limited.
Adeleke, J.O (2010). The Basics of Research and Evaluation Tools.Ogba Lagos:Somerest Ventures.
Ihenacho, E. (2004). Basic Steps for Quality Research Project. Lagos: Noble-Alpha publishers.
Neter, J., Wasserman, W. & Whitmore, G.A (1979). Applied Statistics, Allyn and Bacon, Inc. Massachusetts, U.S.A.
Peretomode, V.F., Peretomode, O, & Ibeh, A.E (2010). Statistical Methods in the Behavioural Sciences and Education: A Systematic Approach, Onosomegbowho Ogbinaka Publishers. Somolu, Lagos.

60
UNIT 3 OPERATIONALIZATION AND DATA ANALYSIS CONTENTS 1.0 Introduction 2.0 Objectives 3.0 Main Content
3.1 Operationalization 3.2 Analyzing OpinionData 3.3 Analyzing Facial Data 3.4 Analyzing Data for a cause and effect Relationship 3.5 Analyzing Data for an association Relationship
4.0 Conclusion 5.0 Summary 6.0 Tutor-Marked Assignment 7.0 References/Further Readings 1.0 INTRODUCTION Assumptions or hypotheses made for studies are not bad, rather they require clarification and strengthening to be deem fit. This process of operationalization narrows down attributes so that therepresentative of the wider group is more clearly defined. Then a definable and measurable variable, forming part of the research problem and hypothesis is selected. Data is collected based of the defined and well-measured variable for analysis. By this, the process must have undergone an operationalization period. 2.0 OBJECTIVES By the end of this unit, you will be able to:
• understand the need for operationalization • differentiate between opinion and factual data • understand cause and effect given two or more variables • analyse the relationship between variables
3.0 MAIN CONTENT 3.1 Operationalization
Operationalization is a process of defining the methodology which is a step-by-step to be followed by a researcher to reach conclusion. A derail in methodology will result in failure of operationalization and as a result the outcome of a research is not standardized. This means that operationalization entails the used of exact measuring method which allows researchers to follow the same methodology. Loseke (2017) defines operationalization as the process of deciding what particular data will indicate the presence of a particular concept. The outcome of the process of operationalization is refer to as operational definition. This outcome can also be called indicators because they tell what in the physical world will indicate the presence of a concept (Loseke, 2017). Hence, operational definitions are used to bridge the gap between the physical concept and abstract concept. There are series of classifications or types of operationalization. However, Loseke (2017) has classified operationalization into the following three basic types;
i. Operationalization as Criteria for classifying what people say Data for social science researches often comes from what people say or what was written. As instance of this type of operationalization stem from answers to questions asked during interviews or survey. For example:

61
The investigation of the relationship between the concepts of “exposure to teen film” and “gender related believe and attitude” of the mean of two girls. How do we define and measure the abstract concept of “exposure to teen film”? Researcher often operationalized this by asking participants to look a list of teen movies and indicate how many of the movies they had seen, owned (for instance on DVD) and /or had seen for more than once.
ii. Operationalization as a criterial for classifying what people do Operationalization can be in form of the criteria for categorizing behaviours since social research data can be measured based on what people do. For example; Researchers can operationalize concepts through experimental manipulation of what people do. In this instance, the question of operationalization is; how do we hear, having one member in a social group doubted?
iii. Operationalization as a criterial for classifying the Content of Document of Other Physical Objects
Researches in social sciences can include content of government (for example, government transcript, magazines, etc) and other physical objects. For example: Research on “Alcoholic references on undergraduate males’ Facebook Profile” explore the fairly concrete concept of “references to alcohol” o the Facebook pages of male college students. Personal picture which is one of the measurement can be operationalized as; “picture that clearly contained labelled alcohol beverages.
3.2 Analyzing Opinion Data Opinion data are generated from public opinion polls. Opinion data analysis is carried out by conducting a series of questions and then extrapolating generalities in ratio or within a given confidence interval with the aim of reaching conclusion on what is best for the population.Opinion data is best used for survey research method. Prior to this contemporary times, opinion data used for analysis has often been gotten through telecommunications or in person-to-person contact. However, with innovations springing up, technological innovations have also influenced survey methods such as the availability of electronic clipboards and Internet based polling (Rowley et al. 2006). A major setback of opinion data analysis is that there is a great tendency that analysis done using opinion data may be erroneous. This is because the data for the analysis is gotten from opinion poll of respondent and opinions is based on respondent perception which may be far from reality of the factual situation. Therefore, conclusion from analysis of opinion data may be erroneous making it difficult to be used as a working tool for decision making. Opinion data can be generated from the followings; Benchmark Poll: A benchmark poll is the first poll or data taken (for instance, in a campaign ). In the case of political pursuit, it is done before a candidate announces their bid for office. This make it a short and simple survey of likely voters. A benchmark poll will give a political candidate for instance, a picture of where they stand with the electorate before any campaigning takes place. Tracking Polls: Tracking poll also refers to as rolling poll are data in which responses that formed the data are obtained in a number of consecutive periods (for example; daily), and then results are calculated using a moving average of the responses that were gathered over a fixed number of the most recent periods, for example the past five days. Brushfire polls:Brushfire polls are polls or data taken during the period between the benchmark poll and tracking polls. These polls usually focus on the perceived likely voters and the length of the survey depends on the number of messages being tested.
3.3 Analyzing Factual Data By definition, facts are irrefutable, as a result, any person involved in factual analysis should

62
be able to agree upon them. This is because factual data are information based on verifiable facts. An example of analysis of factual data can be empirical research (especially with secondary data).
3.4 Analyzing Data for a cause and effect Relationship The analysis of data for cause and effect relationship is rest on the use of independent variable (cost) to dictate the outcome of the dependents variable (effect). This is best measured with the regression analysis. The regression analysis is a widely used technique which is useful for evaluating independent variable(s). As a result, it is particularly useful for assess and adjusting, and at the same time assessing the presence of effect modification. The regression analysis can be simple or multiple. It is simple when it involves one dependent variable and one independent variable. On the other hand, it is a multiple regression when it involves one dependent and more than one independent variables. For the purpose of simplicity, we will be looking at a simple regression analysis. Simple Regression analysis When we have a single continuous dependent variable (cause) and a single independent variable (effect), the analysis is called a simple linear regression analysis. This analysis assumes that there is a linear relationship between the two variables. For instance, where the quantity demand of a commodity (Y) is a function the price of the commodity (X). This is a simple linear regression equation and it can be expressed as:
Where is the predicted or expected value of the outcome, X is the predictor, b0 is the estimated Y-intercept, and b1 is the estimated slope. The Y-intercept and slope are estimated from the sample data so as to minimize the sum of the squared differences between the observed and the predicted values of the outcome, i.e., the estimates minimize:
These differences between observed and predicted values of the outcome are called residuals. The estimates of the Y-intercept and slope minimize the sum of the squared residuals, and are called the least squares estimates. Based on the observed data, the best estimate of a linear relationship will be obtained from an equation for the line that minimizes the differences between observed and predicted values of the outcome. The Y-intercept of this line is the value of the dependent variable (Y) when the independent variable (X) is zero. The slope of the line is the change in the dependent variable (Y) relative to a one unit change in the independent variable (X). The least squares estimates of the y-intercept and slope are computed as follows:
�� ∑ � �∑ � ∑ ∑ ����∑ �)� and �� � �∑ � � � ∑ �)

63
Where n is the number of periods, An illustration is shown below.
X Y X2 XY Y2 3 8 9 24 64 6 10 36 60 100 7 15 49 105 225 7 18 49 126 324 9 20 81 180 400
32 71 224 495 1113
�� �5�495) � �32�71)�5�224) � 32�
�� 2475 � 22721120 � 1024
�� 20396
�� 2.1
�� 15 [71 � �2.1�32)]
�� 15 [71 � 67.2]
�� 3.85
�� 0.76 The regression equation can be restated by the below equation: � 0.76 + 2.1� The value of the intercept which is ��=0.76 indicates the value of Y when there is no X or when X is zero. Also, b1=2.1 which is the parameter of the independent variable (cause) showing the effect of the independent variable on the dependent variable (effect). The value of 2.1 shows there is a positive relationship between X and Y. also, a change in X will result to aproportional change of 2.1 in Y.

64
3.5 Analyzing Data for an association Relationship The analysis of data for association relationship between variables is aimed at establishing the nature and extent of relationship between variables. The association relationship between variables can be proportional (positive) or inverse (negative). Also, the relationship between variables can be strong or weak. For a simple association relationship, the Pearsons Product Moment Correlation Coefficient is well known for such estimation. For the purpose of a wider emphasis, the Correlation Coefficient will be discussed under Module 4 (Unit 3). 4.0 CONCLUSION You have learnt in this unit that operationalization is a thorough adherence to the methodology of research and a derail from the step-by step of the methodology will affect the standard of the outcome of the research. Also, you must have been able to distinguish between analyzing opinion and analyzing factual data knowing that opinion data is based on what the respondent feel which may be right or wrong while factual data is right irrespective of what anybody feels. The simple linear regression equation which spells out the cause and effect relationship between variables and its simple estimation process was demonstrated. Finally, the association relationship between variables which will be further emphasized using the correlation coefficient inModule 4 (unit 3) was introduced. 5.0 SUMMARY While you have read about operationalization and data analysis in this chapter, you have to bear in mind that operationalization is to follow strictly the rules and regulations of methodology. This is expected to guide you in the type of data (either opinion or factual or both) you will be analyzing and also the appropriate choice of statistical tools required for estimation in your research. 6.0 TUTOR-MARKED ASSIGNMENT
1. A derail in methodology will result in failure of operationalization and as a result the outcome of a research is not standardized. Discuss.
2. Differentiate between opinion data and factual data. 7.0 REFERENCES/FURTHER READING
Loseke, D. R. (2017). Methodological thinking: Basic Principles of Social Research Design. SAGE: LA, pp71-86.
Rowley,G., Barker, K. and Callaghan, V. (1986). “The Market Research Terminal & Developments in Survey Research”, European Journal of Marketing, Vol. 20 Issue: 2, pp.35 - 39.
65
MODULE 4: A GUIDE TO STATISTICAL RESEARCH Unit 1: Descriptive Statistics Unit 2: Test in Statistical Analysis Unit 3: Central of Tendency and other Higher test in Statistics UNIT 1: DESCRIPTIVE STATISTICS CONTENT 1.0 Introduction 2.0 Objectives 3.0 Main Content
3.1 Data Distribution
3.1.1 Tabular Presentation of Data 3.1.2 Frequency Distribution 3.1.3 Histogram 3.1.4 Cumulative Frequency 3.1.5 Frequency Polygon 3.1.6 Diagrammatic Data Presentation
3.2 Measure of Central Tendency
3.2.1 Arithmetic Mean (Mean) 3.2.2 Median 3.2.3 Mode
3.3 Measure of Variability 3.3.1 Range 3.3.2 Mean Deviation 3.3.3 Standard Deviation 3.3.4 Variance 3.3.5 Coefficient of Variation
3.4 Inferential Statistics 4.0 Conclusion 5.0 Summary 6.0 Tutor-Marked Assignment References/Further Readings 1.0 INTRODUCTION Statistical can involve a large data, so to bring the data to easy understanding, the descriptive statistics is used. A descriptive statistic according to Mann (1995) is a summary statistic that quantitatively describes or summarizes features of a collection of information. This means that each worked out value from a given range of data is used to describe the basic feature of the data in study. The important of descriptive statistics is that quantitative descriptions are presented in a manageable manner. That is from the combination of data computed, a value can be yield to depict the entire data. For instance, a CGPA of 3.5 which is the outcome of the computation of the data of the results of a student can indicate the overall performance of such student. Descriptive analysis cuts various aspects of statistics which some of them will be looked at in the units of this module.

66
2.0 OBJECTIVES
By the end of this unit, you will be able to: • explain the various types and methods of descriptive statistics. • define measures of central tendency and explain the various forms of measures of
central tendency such as mean, median, mode, and others • differentiate between measure of central tendency and measure of variability.
3.0 MAIN CONTENT 3.1 Data Distribution
Having gathered a large mass of data through any of the instruments discussed in the preceding unit, there is need to understand how to structure the data properly to make some essential statistical meanings. However, for these data to make sense, they need to be distributed and then tabulated. By definition, data distribution deals with grouping of raw data gathered which possess noticed characteristics. It (data distribution) enhances summarization of data, ease of comparison as well as displaying their noticeable characteristics. Data distribution can be done in so many ways such as; distribution according to geographical location, distribution according to chronology, distribution according to quantity and distribution according to quality.
3.1.1 Tabular Presentation of Data
This entails the showing of the categorized data in a table form. A table is an array of data in rows and columns. Tabulation allows summarization of volume of data into a form that brings out a distinct pattern in data as well as making the data attractive to whosoever is interested in it. Tabulated data makes comparison among the classes of data possible, and it occupies less space when compare to data presented in descriptive form. Also, conclusions can easily be drawn from data in a table form and publication of important figures in this form is equally advantageous. A good table should be neat and easy to understand. The followings discussed below are parts of a table.
1. A Title A title is usually written at the top of the table that shows what the table is all about. The title should be brief, concise and all-inclusive enough to describe the content of the table.
2. The Caption The caption is the column heading. It is the upper part of the table which gives the description of the various columns. This should be stated clearly.
3. The Stubs These are the row headings. The extreme left of the table are meant for this. They should also be clearly done. If they are numerical classes they should be properly constructed so that there is no overlapping of classes. There should be no gaps between two consecutive classes.
4. Footnote A footnote is brief explanatory information about the table which in most instances indicates the source of the data. It is usually stated at the bottom of the table.
5. Units of Measurement This should be clearly specified. These are usually placed at the top right hand corner of the table.

67
6. The Source The source of information is usually specified below the table and may sometimes be the footnote.
7. The Body The body is the major part of the table that displaces the compressed data.
Specimen of Table:
Imports of Salt into Nigeria in 1976-1979
Year 1976 1997
Commodity Caustic Soda
Caustic Potash Halogen and Sulphur
Quantity Value’ (N) Quantity Values (N) 2231225 356307 143216 421666 259389 143772 455039 281554
440 8240 1120 1061
Source: Nigeria Trade Summary, Federal Office of Statistics.
Tab 2.1
SELF-ASSESSMENT EXERCISE 1
i. Define data classification ii. Itemize the importance of a tabulated data.
3.1.2 Frequency Distribution
The frequency distribution of a bulk of data is the arrangement of data in a tabular form which shows the data along with the number of times each of the data occurs. The number of times the data occur is the frequency. In so doing, a number of data is made compact and reduced to a convenient form. Frequency distribution gives a pictorial nature of the tabulated data.
For instance, if 10 females bought yams in the market in the following way: 2, 3, 1, 2, 4, 3, 2, 3, 2, 1. these data could be arranged to indicate the various numbers of yams bought per female. The amount of yams bought by the individual female represents the frequency which is limited to 1, 2, 3, and 4. However, this information show that out of the 10 females, those who bought 2 yams each were 4, those who bought 3 each were 3, those who bought 1tuber each were 2, while just 1 person bought 4tubers. This information can be arranged in a table form as shown below in Table 2.2. When information (data) is so arranged in a form so attractive, they are said to be grouped.
Frequency Distribution Table
Value (X) Frequency (F) 1 1 2 4 3 3 4 1
Total f = 10 Tab 2.2.
The organization of data into frequency distribution which take the form of a table is called, “frequency”, or in a graphical form, is known as “frequency graphs”. Frequency graphs are

68
mostly depicted in the forms of bar graphs, histograms, pie graph, frequency polygons and line graphs. See detailed discussions on some of these below.
i) Frequency Table
The data collected in the in the cause of undertaken a study is known as raw data. Assume a Tutor records raw scores of 50 undergraduates in Economics continue assessment (C.A) as follows:
79 55 81 79 85 58 69 32 45 72 41 85 43 60 61 75 85 69 56 49 57 87 89 49 92 45 69 75 73 61 25 56 67 58 84 52 32 57 69 68 65 42 65 15 74 58 36 78 68 58
When these data are organized in ascending or descending order we have an array of data as follows:
15 25 32 32 36 41 42 43 45 45 49 49 52 55 56 56 57 57 58 58 58 58 60 61 61 65 65 67 68 68 69 69 69 69 72 73 74 75 75 78 79 79 81 84 85 85 85 87 89 92
From these arrays of data, we can have what is referred to as range. It is the difference between the highest and lowest numbers in an array of data. In this case, the highest number is 92 and the lowest is 15. Therefore, the range = highest number – lowest number = 92 – 15 = 77.
We can also arrange these data in a tabular form into groups or classes. Usually we use between 5 and 20 classes. The scores of the undergraduate students are then tabulated using classes 11-20, 21-30, 31-40, 41-50 etc. Then, we use tallies to group the data into the various classes to form the table. Tallies are strokes used for counting and a value of 5 tallies is denoted by 4 vertical strokes and one diagonal stroke as ΙΙΙΙ. This makes counting ease. The table below is a good example of frequency table for the undergraduate students’ marks obtained in Economics.
Frequency Distribution of Scores of Students in Economics for a Class of 50
Classes Tally Frequency 11-20 Ι 1 21-30 ΙΙ 2 31-40 ΙΙΙ 3 41-50 ΙΙΙΙ ΙΙ 7 51-60 ΙΙΙΙΙΙΙΙ Ι 11 61-70 ΙΙΙΙΙΙΙΙ Ι 11 71-80 ΙΙΙΙ ΙΙΙ 8 81-90 ΙΙΙΙ ΙΙ 7 91-100 Ι 1
Tab 2.3
Characteristics of the Frequency Table
Frequency tables possess certain features which differentiate it from any other form of table, and provide more information about the data. Class interval, class limits, class boundaries,

69
class size, midpoint, and class frequency are the basic features of a frequency table. All these we shall discuss shortly.
(a) Class Interval: We have said that, data which are massive in nature are usually compressed by arranging them into arbitrarily defined grouping call class interval. A class interval such as 81-90 is the width of the class, in other words is the difference between the class limits. The end digits of the class intervals are known as the class limits. With table 2.3 above, the class limits include 11, 21, 31, 41, 51, 61, 71, and so on. Digits on the left side of the class interval are referred to as the lower class limitslike 11, 21, 31, 41 while those on the right side are known as the upper class limitssuch as 20, 30, 40, 50, 60, and so on.
(b) Class Frequency It is the number of times an observed number falls into a class interval. It is always written in the right-hand column of the frequency table.
(c) Class Mark It is the midpoints of class intervals which is obtained by adding the lower and the upper class limits of that class, and divide it by 2. Thus the class mark of the class intervals in Table 2.3 will be 15.5, 25.5, 35.5, 45.5, and so on.
(d) Class Boundaries Class boundaries in most literatures are referred to as exact limits. Most observations whether continuous or discrete are most often documented as discrete values. When observations are documented in discrete form and the variable is a continuous one, we simply imply that the value recorded represents a value falling within certain limits. These limits are often taken as half of unit (1/2) or 0.5 above and below the value reported. For instance, if we document the value of an observation to be 10litres, we are saying in other words that if a more accurate measurement was engaged, the result gotten would be between the limits 9.5 and 10.5 litres.
With reference to the above table 2.3, the first class has a lower class boundary, or exact lower limit of 10.5 and an upper class boundary or exact upper limit of 20.5. In other words, if we consider the lower and upper values of 10.5 and 20.5; 20.5 and 30.5, and so on the total volume fill is then 10.5 and 20.5. It therefore means that, the class interval of 11-20 contains all figures greater than or equal to 10.5 and less than 20.5.
(e) Class Size This is the difference between the lower class boundary and exact upper limit. The class size or width is the range of values the class interval can accommodate. Looking at the class interval of 11-20, the width, size or length of the class is 10.5-20.5 = 10. This shows that, the frequency distribution of the students’ marks in Economics has class intervals of 10.
The table below shows the frequency distribution of the level assimilation of a given set of rehabilitated young miscreants showing the class intervals, class boundaries, class frequencies and class marks.

70
Class Intervals, class limits, and class marks for frequency
distribution of Level of assimilation of young miscreants
Class Interval Class Limits Midpoint (X) Frequency (F)
230-234 229.5 – 234.5 232.0 1 225-229 224.5 – 229.5 227.0 1 220-224 229.5 – 224.5 222.0 3 215-219 214.5 – 219.5 217.0 6 210-214 209.5 - 214.5 212.0 7 205-209 204.5 - 209.5 207.0 12 200-204 199.5 – 204.5 202.0 16 195-199 194.5 – 199.5 197.0 7 190-194 189.5 – 194.5 192.0 17 185-189 184.5 – 189.5 187.0 5 180-184 179.5 – 184.5 182.0 15 175-179 174.5 – 179.5 177.0 6 170-174 169.5 – 174.5 172.0 3 165-169 164.5 – 169.5 167.0 1
Tab 2.4
SELF-ASSESSMENT EXERCISE 2
i. Explain what you understand by frequency distribution. ii. Itemize the features of a frequency table.

71
3.1.3 Histogram Histogram is comparable to a simple bar chart except that in bar chart, the bars are separated from one another. Histogram is the most common of all the ways of depicting frequency distribution. It is also a graphical presentation of statistical data. It consists of columns, each having as its base one class interval and as its height equals to the number of frequency in that class interval. To construct a histogram, the class boundaries of each class are represented on the x-axis while the class frequencies are represented on the y-axis. The bars that make up the histogram are formed by drawing rectangles whose bases equal the class interval and the lengths (heights) are determined by the equivalent class frequencies. Consider the data in the following table below:
No. of children 5 2 3 4 6 Families 1 2 3 4 5
Fig 2.1
3.1.4 Cumulative Frequency The cumulative form of a frequency distribution is known as the cumulative frequency distribution. And cumulative frequency is the successive addition of individual frequency as correspond to the class intervals. When the cumulative totals of successive frequencies of a distribution are plotted against the corresponding class boundaries we have a cumulative frequency curve also known as ogive. Cumulative frequency distribution is essential in research in that it helps to determine the proportion of elements of data set values above or below certain levels.
It is important to note that a cumulative frequency curve either rises or remain level, and cannot drop down towards the x-axis. To construct an ogive, you first compute the upper class boundaries of each class interval on the x-axis, and then plot the cumulative frequencies on the y-axis against the upper class boundaries of the individual class.
1 2 3 4 5 6 7 1
2
3
4
5
6

72
3.1.5 Frequency Polygon
The frequency polygon is another form of frequency graph often used with continuous variables. In statistics, the frequency polygon is occasionally used. The construction of the graph involved plotting the class frequencies on the y-axis against the midpoint of each class interval on the x- axis. For instance, the midpoint of the 8-10 class intervals is 9 and that of 11-13 is 12, etc. Generally, a dot is placed at the coordinates and the successive points are then linked together through straight lines as shown below. Also, the frequency polygon can be drawn by joining the midpoint of the top of one bar to the other in a Histogram.
Class Mid-Points Fig 2.2
3.1.6 Diagrammatic Data Presentation
Another and most popular way of depicting classified data is the use of diagrams (graphs and charts). Diagrams are appealing to the eye and are therefore useful in passing on significance messages as contained in the data. Diagrams also readily show the trend of a time series, together with the nature of fluctuations (seasonal and cyclical). Explained below are examples of diagrammatic data presentation.
Pictogram
Pictogram is a good instance of representing data in visual form (diagram) which help in conveying messages. The information presented in a pictogram is easily readable and understandable without any doubt. In pictogram, the symbols are generally of equal size, and are organized to form the shape of a horizontal bar diagram. The data in a pictogram are proportional to the number of diagrams drawn in line with the scale used. Pictogram is also called pictograph.
40
35
30
25
20
15
10
5
0
2 7 12 17 22 27 32 37 42
X
Y

73
Population of Nigeria, 1960-2000
Year 1980 1985 1990 1995 2000 Population (in millions) 65 76 87 100 112
Representing the above data in the form of a pictogram, we will have:
1980 65 million Each figure represents 20 million 1985 76 million
1990 87 million
1995 100 million
2000 112 million
Tab 2.4
A pictogram is very easy to understand by everybody, but it is not an accurate way of representing data.
Pie Charts
A pie chart is circular in shape. And it consists of a circle divided by radial lines into subdivisions such as slices of a cake or pie; which necessitate the name (pie chart), so that the area of each subdivision is proportionate to the size of the figure represented.
A pie chart is a graph used to indicate the parts of the whole frequently refers to as the total. The pie chart also known as pie graph as mentioned earlier is circular in form contains 3600
and the total figures being considered equals the number of degrees that make-up the circle namely 3600.
Nigeria’s Visible Exports (Hypothetical)
Finished manufactured goods 150.5 Semi-finished goods 91.5 Minerals, fuels and lubricants 72.5 Basic materials 8.8 Food etc. 25.4 Unclassified items 11.3
Table 2.5

74
Fig 2.3
Bar Chart
It is also known as bar graph a very common method of data representation. Bar chart is more generally appropriate than line diagram because it is used to series varying, either over time or over space. It is somehow similar to histogram because it has bars whose heights are proportional to the frequencies of the classes and the widths are equal, same as that of the histogram. The width of the bar as long as it does not overlap can take on any convenient size. However, the bar diagram is different from the Histogram in that the bars that constitute the diagram stand separately from one another.
Bar chart is of different forms. These are: the simple, the multiple and the component bar charts.
Example
Domicile of Students Attending University of Lagos, 1972 – 1976 (Hypothetical)
Year Total Students Domicile in Nigeria West East North 1972 115 81 32 2 1973 135 85 46 4 1974 161 90 62 9 1975 150 77 59 14 1976 215 97 90 28
Table 2.6
Finished manufactured goos
Semi-finished goods
Minerals, fuels and
lubricants
Basic materials
Food etc.
Unclassified items

75
Fig 2.4
3.2 Measure of Central Tendency
Going by the meaning of the term, they are measures that attempt to pinpoint where all the bulk of data is placed. It also known as “measures of location”, “measures of central values” or “measurement of position”, largely designated by the word “Average”. An average is a value that is representative of a set of data and is located at the central of the said set of data. Averages that are commonly used in research are the Arithmetic Means, the Median, the Mode, etc.
3.2.1 The Arithmetic Mean (Mean)
The arithmetic mean or average of a set of items is the addition of all the items divided by the number of items. Arithmetic mean is the most commonly used of all the measures of central tendency. For instance, imagine that a set of N numbers of items are represented by the symbols X1 X2 X3 X4 …………… XN, the average (mean) is then stated in algebraic form thus:
�# = x1+x2+x3+x4……..xn
The formula of the average as stated above can be explained thus,
�# = the mean of the value of X (read as “X-bar”)
Σ = the sum of the variables (read as sigma) N
1i=∑ = shows that the summation extends from i = 1 to i = 1, i = N where I is the
subscript indicating the ith number.
X = a variable or value
N = overall frequency
0
50
100
150
200
250
1972 1973 1974 1975 1976
Nu
mb
er
of
Stu
de
nts
Year

76
Though, in most cases the means is simply written as
�# $%&
In statistics, a bar above a symbol generally signifies the average. As a result, �# means the mean of a variable Y.
Self-Assessment Exercise 1
• Defined and explain the measures of central tendency. The Mean from Ungrouped Data The mean for unorganized data (raw data not arranged) is determined using the formula as given above. Let us consider the scores of six Pupils who sat for entrance examination into Gracewil private school. The scores recorded are as follows: 50, 46, 55, 60, 60, and 35. The average score of these Pupils will be:
�# $%&
�# = '�()*(''(*�(*'(+'*
�# = +��*
�# = 51.8 The Mean from Grouped Data A grouped data represents the organization of items or observations with frequency of occurrence attached to the values. The mean for a grouped data is determined by multiplying individual value of the item by the number of frequency of occurrence of that value, adding together the products and then dividing by the summative number of items. Let assume that we have X1, X2, X3, X4 … XN with individual frequency f1, f2, f3,……………… fn. The mean will be:
�# ,��� + ,��� + ,+�+ … … … … ,�&
∴ �# = 1
n
i
fx
N=∑
Where N = Σfi.
Let look at the scores of ten students of Research Methods in an oral test; 10, 10, 11, 15, 15, 17, 18, 20, 20, 20. The item 10 shows 2 times, 11 occurred 1 time, 15 occurred 2 times, 17 occurred 1 time, 18 occurred 1time and 20 shows 3 times. These items are arranged in a frequency table as shown below.

77
X1 f1 f1 X1
10 2 20 11 1 11 15 2 30 17 1 17 18 20
1 3
18 60
Total 10 156 = Σ f1 X1
Applying the formula �# /01�12
�# �'*��
�# 15.6 In rounding up, to determine the mean for a grouped data, the below listed steps are recommended:
i. Form a frequency distribution table of the observations with x and f representing the values and frequencies of the observations respectively. These are organized in the 1st and 2nd columns.
ii. Let fx form the 3rd columns which is the product of f and x. iii. Sum up the products (fx) of for all the observation whether grouped or ungrouped. iv. Then, divide the summation Σfx by the total number of observations. The result gives the
mean of the distribution.
Features of the Arithmetic Mean
1. The mean is the most common measure of central tendency known to all. 2. It is always unique in the sense that a set of numerical data has only one mean at a time. 3. It accounts for each individual item or observation. 4. The sum of deviations of all the items or observations in a set from their mean is zero. 5. It is unwise to use the mean as average if the distribution is an open ended. 6. It sometimes gives rise to ridiculous figures such as 5.7 individuals.
3.2.2 The Median
This is another measure of central tendency known. It is simply defined as that value which lies at the centre of items. The median of set of observations is arranged in any form, either ascending or descending order. It is the 50th percentile in a group of items. That is, it separates the arranged items into two halves, such that half of the items fall above it and half below it.
For instance, when the number of arrangement N is an odd number, the most centred item is selected as the median.
X: 5 4 3 6 7 10 13 Rank Order 3 4 5 6 7 10 12

78
In the above scenario, the middle item or value is 6 as it corresponds to the middle rank, with three items lying above the median and three below it. In the case of n odd numbers, to ascertain the location of the median in a ranked order, it can be done by using the formula 3(�� th. For example, n odd numbers such as 41, 35, and 5, the values of their medians will be
21st, 18th and 3rd observations respectively. These are arrived at thus:
For n = 41, the median will be �)�(�)� = 21st
For n = 35, the median will be �+'(�)� =18th
For n = 5, the median will be �'(�)� = 3rd.
Meanwhile, when the number of an arrangement of observations is even, to determine the median, take the average of the two middle numbers. Let us consider the following scenario:
X: 7,9,4,1,5,3,10,8. Rank Order 1,3,4,5,7,8,9,10.
The median is given as �'(4)� = 6.
The value of 6 can be taken as the median.
Self-Assessment Exercise 2
• Find the mean of 2.3, 5.4, 0, 6.2, 7.9, 8.1, 0, and 3.4. • Determine the median of 6, 4, 1, 9, 8, 3, 7, 10, and 5.
The Median from Grouped Data
Finding median from a grouped data mean the siting of a value of the variable such that one half below from a set of data arranged in class intervals and frequencies. Listed below are ways to be followed in computing the median.
• Set the data into intervals • Determine the frequency for each interval • Then find the cumulative frequency for each interval from the frequency
• Determine the value 56�7which represents one-half of the number of observations.
• Site the class interval in which one-half 56�7of the observations falls. This is done by
finding which of cumulative frequencies is close or equal to the value 56�7. • Interpolate between the exact limits of the interval to find a value above and below
which 56�7 falls. This will give the value of the median.

79
The above listed steps are summarized in the formula below:
Median (Md) = L1 + 89��:;<; =C
Thus: L1 = lower class boundary of the median class.
N = is the total frequency.
Cm = is the cumulative frequency of the class just before the median class.
fm = frequency of the median class.
C = is the class size.
Let us now apply the above stated formula using a hypothetical situation. Find the median for the distribution of students’ scores in ECO 206 (Mathematics for Economics2) in year 2, Economics Department, National Open University of Nigeria (NOUN).
Computation of media for the distribution of scores In Eco 206 (Math for Economists 2)
Class Boundary Frequency Cum.
Frequency 0.5-9.5 1 1 9.5-19.5 2 3 19.5-29.5 4 7 29.5-39.5 3 10 39.5-49.5 4 14 49.5-59.5 2 16 59.5-69.5 13 29 69.5-79.5 10 39 79.5-89.5 8 47 89.5-99.5 7 54
Total 54 Tab 2.7
To determine the median, we will apply the formula as giving. Since the number of students is 54, the median class is where the 54th /2 score is located. That is, the 27th score is located in the 60-69 which is the median class, with 59.5 as the lower class boundary of 59.5.
Therefore: L1 = 59.5, C = 10, Cm, = 16, Fm = 13
(Md) = L1 + 89� �:;<; =C
(Md) = 59.5 + 5�4��*�+ 7×10
= 59.5 + 5���+7×5
= 59.5 + 8.5
Md = 68 Ans.

80
The median is 68. This is to say that, if the scores of students in Eco 206 are arranged in either ascending or descending order, 68 as a score will be located in the middle of the array of marks.
Properties of the Median
• It is the central item of the numerical data. • Unlike the mean, the median can be employed to define the central of a number,
objects, properties, or qualities, which do not permit a quantitative description. • It can be estimated from incomplete data. • The Median is usually subject to greater chance fluctuations than the mean. This
explains why the mean is the most reliable in problems of inference such as estimation and prediction.
• The median of a set of observation always exist. • It gives the actual value for a set of discrete and odd observations.
SELF-ASSESSMENT EXERCISE 3
State the formula of finding the median of a grouped data, and explain every item that is contained in the formula.
3.2.3 The Mode
It is another familiar measure of central tendency used. It is the highest occurring item in a set of observation. A basic property of the mode is its suitability as a measure of relative standing, which can be used for both quantitative and qualitative data. For instance, the yearly FIFA footballer of the season, where one player is chosen to be the best, shows that the number of players and coaches who like the chosen player is greater than those who do not like him or her.
If we consider ten children and the age at which they gained entrance into any of the Nigerian higher institutions in 2010, we have the following information: 14, 15, 16, 16,16,16,17,18,13,and 15. Here children of age 16 gained more admission into higher institutions in 2010. This is so because 16 occurred most frequent in the information given. As such, 16 is the mode.
In the study of mode, two adjacent item of an observation could have the same occurrence, which is possibly higher than any other item in the observation. In this case, the mode is arrived at by finding the mean of the two most frequent items. For example, supposing we have following information 6,6,9,9,10,10,11,11,12,12,12,13,13,13. We can see that 12 and 13 have highest occurrence, and are equal in the information provided. The mode is therefore, the average of the two items (12+13)/2 = 12.5. However, where the two items are non-adjacent, in that case the value of each may be taken as a mode. Thus such a given set of observations has two modes, which is referred to as bimodal.
Hypothetically, we can assume the following as scores recorded for twelve students in Principle of Economics: 30,30,30,30,40,40,50,5.5,60,60,60,60. Here the values of 30 and 60 are considered as modes of the data. This is a good instance of a bimodal distribution. Note that, the discussions thus far are cases of ungrouped.
Finding the Mode of a Grouped Frequency Distribution

81
Like the determination of mean and median for grouped data, the mode for the grouped data is computed using known statistical formula. Thus, to find the mode of grouped data, a number of steps have to be followed. If La – Lb is the modal class of a frequency distribution; and F represents the frequency of this class, that for the class above it is fa and the frequency for the class below it is fb then the mode the distribution will be ascertained using the formula stated below.
Mode: Mo = L1 + ⟨ ?1@1(@�⟩C
Where L1 = the lower class boundary of the modal class, d1 = frequency of the modal class - frequency of next lower class, d2 = frequency of the modal class – frequency of next upper class. C = class width or size of the modal class interval.
The information below shows the distribution of suspended particulate matter in samples of air taken from 60 large cities. Determine the mode.
Frequency distribution of the Particulate matter from 60 large cities
Class interval
Frequency
10-19 5 20-29 19 30-39 10 40-49 13 50-59 6 60-69 4 70-79 3 Total 60
Tab 2.8
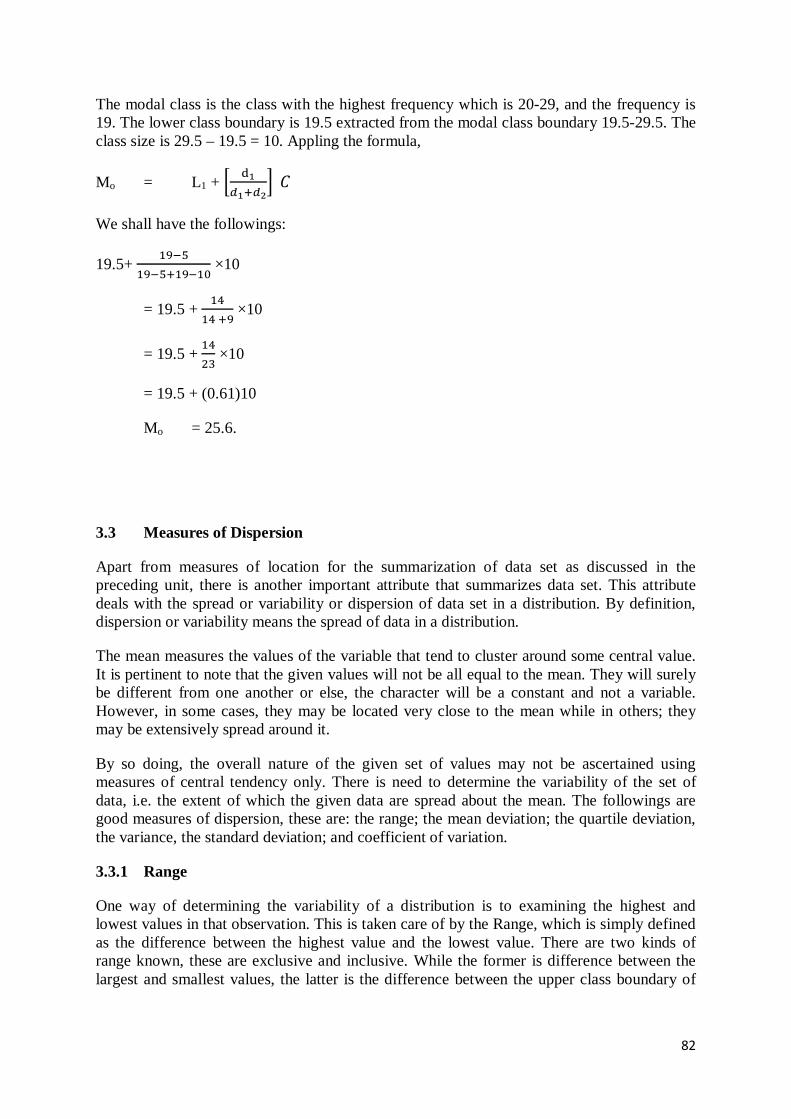
82
The modal class is the class with the highest frequency which is 20-29, and the frequency is 19. The lower class boundary is 19.5 extracted from the modal class boundary 19.5-29.5. The class size is 29.5 – 19.5 = 10. Appling the formula,
Mo = L1 + 5 ?1@1(@�7 B
We shall have the followings:
19.5+ �C�'�C�'(�C��� ×10
= 19.5 + �)�) (C ×10
= 19.5 + �)�+ ×10
= 19.5 + (0.61)10
Mo = 25.6.
3.3 Measures of Dispersion
Apart from measures of location for the summarization of data set as discussed in the preceding unit, there is another important attribute that summarizes data set. This attribute deals with the spread or variability or dispersion of data set in a distribution. By definition, dispersion or variability means the spread of data in a distribution.
The mean measures the values of the variable that tend to cluster around some central value. It is pertinent to note that the given values will not be all equal to the mean. They will surely be different from one another or else, the character will be a constant and not a variable. However, in some cases, they may be located very close to the mean while in others; they may be extensively spread around it.
By so doing, the overall nature of the given set of values may not be ascertained using measures of central tendency only. There is need to determine the variability of the set of data, i.e. the extent of which the given data are spread about the mean. The followings are good measures of dispersion, these are: the range; the mean deviation; the quartile deviation, the variance, the standard deviation; and coefficient of variation.
3.3.1 Range
One way of determining the variability of a distribution is to examining the highest and lowest values in that observation. This is taken care of by the Range, which is simply defined as the difference between the highest value and the lowest value. There are two kinds of range known, these are exclusive and inclusive. While the former is difference between the largest and smallest values, the latter is the difference between the upper class boundary of

83
the class interval that contains the largest value and the lowest class boundary of the class interval that contains smallest value. Thus, Range = Highest value – Lowest value
Consider the table below, and compute the range.
Revenue of a Bottling Company for 15 Weeks
Week Revenues (N) 1 40 2 56 3 45 4 60 5 42 6 74 7 52 8 40 9 55 10 52 11 50 12 50 13 40 14 30 15 60
Here, if x denotes revenue in x, then
xmax = 74 and xmin = 30
So that,
Range = xmax - xmin = 74 – 30
= N44 million.
3.3.2 Mean Deviation
We have seen that range makes use of two extreme values (the highest and lowest values) in the observation or distribution. However, the mean deviation as a measure of spread depends on all the values in the distribution. That is, every item that makes up the distribution is involved when determining the spread of variable using mean deviation. Mean Deviation (M.D) is simply the arithmetic mean of the absolute deviation from the mean. The absolute value of number is the number without regard to algebraic signs, and it is indicated by two vertical bars. Therefore, the absolute deviation from the mean is denoted by │x – D# │.
If b is the mean of the variable x, then x1 – b is the deviation of the ith given value of x from the mean. Certainly, the bigger the deviation x1 – b, x2 – b, x3 – b, --- xn – b in magnitude, the greater is the variability of x. however, the simple arithmetic mean of the deviations cannot be used as a good means to determine variability, since the addition of the deviations, and consequently the mean, may be small even when all the deviations are large, the positive and negative deviations invalidating each other. As a matter of fact, the addition will be zero, if b is the arithmetic mean of x. In order to avoid this, the absolute values of the deviations are

84
taken; in this case, the magnitude alone and not the signs will be taken into account. The mean deviation of b is thus,
MD? 1n H|x� � b|3LM�
Or
MD? Σ/x � x#/n
Where x – x#is the deviation from the mean, /x – x#/ is the absolute deviation from the mean in which the negative and the positive signs are not considered in the computation. As a matter of fact, the concept of absolute values means that you take the value as being positive. For instance, ̸ -4 ̸ = 4, / 0 / = 0, / 18 / = 18 and / -120 / = 120.
Ungrouped Frequency Distribution:
It is a distribution of data set which is not organized in such a way to have class interval, class size, and others, but has frequency. The formula in this case will be slightly different the one above. Thus, the mean deviation for ungrouped frequency distribution, we have,
MDd = / /f x x
f
−∑∑
Consider the follow distribution and compute the mean deviation: 20, 12, 10, 14 and 24.
Solution:
The mean ( x# ) is 20 12 10 14 24
5
+ + + + = 80
5 = 16
∴ MDd = / 20 16 / /12 16 / /10 16 / /14 16 / / 24 16 /
5
− + − + − + − + −
= 4 4 6 2 8
5
+ + + + = 24
5 = 4.8.
The mean deviation is only useful in giving some indications of the extent of the spread in terms of all the values in a data set.
Grouped Frequency Distribution:
If the distribution is of a grouped frequency, then the data will be organized in such a way that, the distribution will have class interval, class width, etc.
Compute the mean deviation of the data

85
Class 1 - 5 6 - 10 11 - 15 16 - 20
Frequency 4 10 6 3
Solution:
To solve this problem, it is easier when we set up the working in a table as shown below,
The mean = fx
f∑∑
= 224
23 = 9.7
MDd = / /f x x
f
−∑∑
= 88.5
23 = 3.85.
Class interval Midmark (X)
f fX x – x# /x – x# / f/x – x#/
1 - 5 3 4 12 -6.7 6.7 26.8
6 - 10 8 10 80 -1.7 1.7 17
11 - 15 13 6 78 +3.3 3.3 19.8
16 - 20 18 3 54 +8.3 8.3 24.9
23 224 88.5

86
SELF-ASSESSMENT EXERCISE 1
i. Find the mean deviation of the data.
x 0 2 4 6 8
f 11 5 9 3 7
ii. Explain the superiority of Mean Absolute Deviation over Range.
3.3.3 The Variance
Range is not an adequate measure of variability because; it makes use of two extreme values in the data set. To this end, Mean deviation became a more suitable measure overrange. This is because mean deviation involves all the data in the distribution in the determination of the variability in a data set. The issues of absolute values which form the basis for mean deviation as a measure of variability are not suitable for further statistical analysis. Consequent upon this, a technique known as variance was developed to overcome this shortcoming. By definition, variance is the sum of squares of deviations about the mean.
There are two techniques of calculating the variance generally known in statistics. These are: i) the variance is ascertained by dividing the sum of squares of deviations about the mean by N, which is the number of cases involved and is noted thus:
S2 = Σ �O�O#)�
2
ii) The variance is defined by dividing the sum of squares of the deviations about the mean by N-1 rather than N only. This is denoted by
S2 = Σ �O�O#)�
2��
Though, both formulae are widely used in statistics however, it is important to make known the difference that exists between N and N-1. The difference between the two is a matter of sample values and population values. While the former is about sample estimate, the latter talks of parameter. The two formulae provide estimates of population variance denoted by P�. Note that, as the sample size N increases i.e. n > 30, the sample variance approximates the population variance.
Deviation scores of the type x – x# tell us about the variation in a set of data. We would discover that the sum of the deviation from the mean is positive while others are negative, thus making the summation of deviations equal to 0. The use of absolute deviation eliminates the issue of sum of the deviations equal to zero. This was found not suitable in statistics analysis, and permanent means of solving the problem known in mathematical analysis is to square up the deviations about the mean, sum these squares and use this sum of squares of define a measure of variation. The outcome is the statistic known as variance.

87
Consider the following case:An experiment was carried out, where 6 animals were fed with special diet for three weeks and the outcomes as per weight gained are as follows: 7, 9, 5, 8, 6, and 11. Determine the variance for this sample.
Solution:
Variance = Σ �O�O#)�
2��
Since it is a sample.
Mean ( x# ) = 7 9 5 8 6 11
6
+ + + + + = 46
6 = 7.7 ≈ 8
∴ Variance (S2) = 2 2 2 2 2 2(7 8) (9 8) (5 8) (8 8) (6 8) (11 8)
6 1
− + − + − + − + − + −−
= 24
5 = 4.8
≈
3.3.4 The Standard Deviation
Recall that the variance was an improvement on the mean absolute deviation, in that it (the variance) corrects the anomaly associated with the mean deviation. The result of the variance is the square of the units of measure of the item under investigation. This outcome (in square form) is like blowing a situation out of proportion. To make these measures real and normalize the result gotten from variance, standard deviation is employed.
It (standard deviation) is another and a good measure of variability. It is defined as the positive square root of the variance, and is often labeled as the root-mean-square deviation from the mean. The standard deviation is symbolically expressed as s or Q, and is derived by adding the square of the deviations of the individual values from the mean of the distribution, and dividing this sum by the number of items in the distribution. We then find the square root of the quotient. Algebraically, this can be written as:
Q RΣ �O � O#)�
For a set of data, and
RΣ< �O � O#)�Ʃ0
for a distribution with frequency.
The standard deviation could be adjudged the most important of the measures of variability, this is as a result of its mathematical properties (especially in sampling theory), rather than its graphic features (own to its nature of giving vivid understanding of a distribution). Clearly, the greater the values of individual items differ from the mean, the more will be the square of these differences and therefore the greater the sum of the squares. Evidently, the greater this sum, therefore, the larger will s be. Therefore, the greater the variability, the larger the

88
standard deviation will be. One must know that if there is no dispersion at all – (i.e. if all the values are the same) then the standard deviation will be zero.
Computation of Standard Deviation:
Find the Standard Deviation of the figures: 11, 13, 16, 22 and 30.
X (x – x#) (x – x#)2
11 11 – 18 = -7 49 13 13 – 18 = -5 25 16 16 – 18 = -2 4 20 20 – 18 = 2 4 30 30 – 18 = 12 144
Σx = 90 Σ (x - x#)2 = 226
XT 90 5U = 18
Q RΣ �O � O#)� = R��*' = √45.2 = 6.72.
As in the case of the mean, if the data is in the form of a grouped frequency distribution, this method will not be applicable.
Grouped Frequency Distribution:
Example: Find %̅ and Q of the following
Kilometers Frequency 20 – under 24 4 25 – under 29 6 30 – under 34 15 35 – under 39 20 40 – under 44 9 45 – under 49 5
Kilometers Mid-mark (X)
f fX (x – x#) (x – x#)2 f(x – x#)2
20 – under 24 22 4 88 -8 64 256 25 – under 29 27 6 162 -3 9 54 30 – under 34 32 15 480 2 4 60 35 – under 39 37 20 740 7 49 980 40 – under 45 42 9 378 12 144 1296 45 – under 49 47 5 235 17 289 1445
Σf = 59 Ʃfx = 1,783
Σf(x – x#)2 = 4,091

89
x#= fx
f∑∑
= 1,783
59 = 30.2 ≈ 30Km
Q2 = 2( )f x x
f
−∑∑
= 4, 091
59 = 69.34Km
Q = 2( )f x x
f
−∑∑
= R),�C�'C = √69.34 = 8.33Km
3.1.5 Coefficient of Variation
Coefficient of variation is a measure of relativity of variability. By relativity of variability, we mean the comparison of two distributions of variables of two separate kinds (units) with respect to their variability. Coefficient of variation is defined as the ratio of the standard deviation of the mean expressed as a percent. Standard deviation by its nature is a measure of the absolute variabilityin a set of items. However, to measure and compare the spread of the distribution, relative variability is a more significant measure. Hence coefficient of variation is a sure way to do just that
Thecoefficient of variation is mathematically expressed thus:
Standard deviation × 100 %
Mean 1
If the mean and standard deviation of the scores of students in Eco 311 are 85 and 12 respectively, while in Eco 306, the same set of students’ mean and standard deviation are 65 and 6 respectively. In which course had the students performed better?
Solution:
The way out of this world problem is to use the coefficient of variation which measures and compares relative variability of distribution.
For Eco 311, the C of V
12 100
85 1× = 14.12%
In the case of Eco 306,
6 100
65 1× = 9.23%.
The students did better in Eco 306 than Eco 311, because the c of v obtained in Eco 306 is lower which mean a better performance than the other course (Eco 311). 3.4 Inferential Statistics So far in this unit, emphasis have been placed on statistical summaries which are derived

90
from descriptive statistics. However, many a times, making conclusions from general population of a study is difficult because of the inability to reach the entire population. In order to solve this problem, sample is drawn from the population making it easy for the statistician or researcher to draw a conclusion. Any conclusion drawn on the sample size will be generalized on the population. This process is referred to as inferential statistics. Inferential statistics is therefore a branch of statistics that deal with drawing conclusions and making decision about a given population based on the sample data. While conclusion on sample data is generalized on the population, a peculiar problem that will first arise is how to extract the adequate sample size that will give a good representation of the population. The means through which a sample is obtained from a population is refers to as PROBABILITY. Probability is the proportion of an outcome of the total possible outcome. For instance, given an outcome A, the probability of A can be expressed as;
���) ������ �� ������� ������ ������ �� �������� ��������
Where P(A) is the probability of outcome A. The range of the probability is that P(A) is greater than zero but less than or equals to one. It is expressed below as;
0 < ���) ≤ 1 If P(A) = 0, the outcome of A is impossible If P(A) = 1, the outcome of A is certain. For probability to be accurate, the outcome must be randomly selected, thereby, making the sample a random sample. A random sample is a sample free of bias. That is, all selections have equal chance of being selected. Also, a constant probability will exist given more than one selection. This is a case of sampling with replacement. 4.0 CONCLUSION In this unit, you have learned descriptive statistics as the summaries of statistics that summarizes the key features of information collected. We have discussed the components of descriptive statistics in their grouping which include, measure of central tendency and measure of variability. Also, inferential statistics have been emphasized. 5.0 SUMMARY Before embarking on descriptive statistics estimations, it is necessary to distribute the data based on frequency distribution, histogram, and pie chart etc. measure of central tendency include; mean, median, and mode. Measure of variability include; mean deviation, variance, and standard deviation. Also, the inferential statistics which emphasized the used of sample data to reach conclusion on the general population.
6.0 TUTOR-MARKED ASSIGNMENT
1. Differentiate the variance form the mean deviation 2. Consider the data set 5, 15, 14, 16, 18, and compute the S2

91
7.0 REFRENCES/FURTHER READING
Adedayo, O. A (2006). Understanding Statistics. Akoka –Lagos: JAS Publishers.
Adeleke, J.O (2010). The Basics of Research and Evaluation Tools. Ogba Lagos: Somerest Ventures.
Deborah, J. R. (2016).Statistics for Dummies.(2nd ed.). ISBN: 978-1-119-29352-1
Ihenacho, E. (2004). Basic Steps for Quality Research Project. Lagos: Noble-Alpha publishers.
Loto, M.A, Ademola, A.A &Toluwase, J.A. (2008). Statistics Made Easy. Palmgrove, Lagos Concept publication limited.
Mann, Prem S. (1995). Introductory Statistics. (2nd ed.). Wiley. ISBN 0-471-31009-3.
Neter, J., Wasserman, W. & Whitmore, G.A (1979). Applied Statistics.Massachusetts, U.S.A Allyn and Bacon, Inc.
Peretomode, V.F., Peretomode, O, & Ibeh, A.E (2010). Statistical Methods in theBehavioural Sciences and Education: A Systematic Approach.Somolu, Lagos: OnosomegbowhoOgbinaka Publishers.

92
UNIT 2 TESTS IN STATISTICAL ANALYSIS CONTENTS 1.0 Introduction 2.0 Objectives 3.0 Main Content
3.1 Parametric Tests 3.1.1 The t-test 3.1.2 Analysis of Variance
3.2 Non-Parametric Test 3.2.1 The Chi-Square test 3.2.2 The Binomial test
4.0 Conclusion 5.0 Summary 6.0 Tutor-Marked Assignment 7.0 References/Further Reading 1.1 INTRODUCTION In most studies, the process of testing the stated hypothesis takes a form that is unique. A hypothesis testing is a statistical process and procedure that utilizes sample information to estimate the credibility of the stated hypothesis. Hypothesis test attempts to show the different between two ideas about the sample data. In hypothesis testing, what researchers basically test for is the null hypothesis. It is like the control experiment in the Biological sciences that tells the direction of the experiment. In this instance, only the null hypothesis is directly tested by statistical procedures. To test for null hypothesis, the researcher employs the use of parametric and non-parametric test statistics. Parametric test involves particular population parameters as well as certain fundamental axioms about sample estimators or the nature of the population. While the non-parametric test statistic is concerned population parameters that can’t be assigned numerical values. In this regard, the common parametric and non-parametric test statistics that shall be used to test our null hypothesis are the student t-test, Analysis of Variance (ANOVA), Chi-square test, and Binomial Test.
2.0 OBJECTIVES By the end of this unit, you will be able to:
• establish what hypothesis testing is • explain the types of parametric and non-parametric test • examine the appropriate test of hypothesis to be used at any situation.
3.0 MAIN CONTENT 3.1 Parametric Test 3.1.1 The t-Test The t-test which is also refers to as the Student Test is used to compare two means so as to determine if they are different from each other. The t-test also tells if the difference or equality of the means being compared happened by chance or they are significant. Therefore, a statistical significant of t-test makes it clear if a difference between the means of two group will unlikely exist due to the fact that the samples are typical.

93
The Null Hypothesis (H0) follows that there is no significant difference between the two mean while the Alternative Hypothesis (H1) is that there is significant difference between the two means.Going by rule-of-thumb, either of the hypothesis is accepted comparing the t-test calculated value and critical or tabulated values based on the level of significance often 5% and degree of freedom. Also, every t-value has a p-value to go with it. A p-value is the probability that the results from your sample data occurred by chance. P-values are from 0% to 100%. They are usually written as a decimal. For example, a p value of 5% is 0.05. Low p-values are good because they indicate your data did not occur by chance. For example, a p-value of .01 means there is only a 1% probability that the results from an experiment happened by chance. In most cases, a p-value of 0.05 (5%) is accepted to mean the data is valid. A t-test can be classified into three types which are;
i. One sample t-test tests the mean of a single group against a known mean. ii. Independent Samples t-test compares the means for two groups.
iii. Paired sample t-test compares means from the same group at different times.
The t-test is given below as;
Where ΣD: Sum of the differences (Sum of X-Y from Step 2) ΣD2: Sum of the squared differences. (ΣD)2: Sum of the differences squared. Calculation of Student t-test
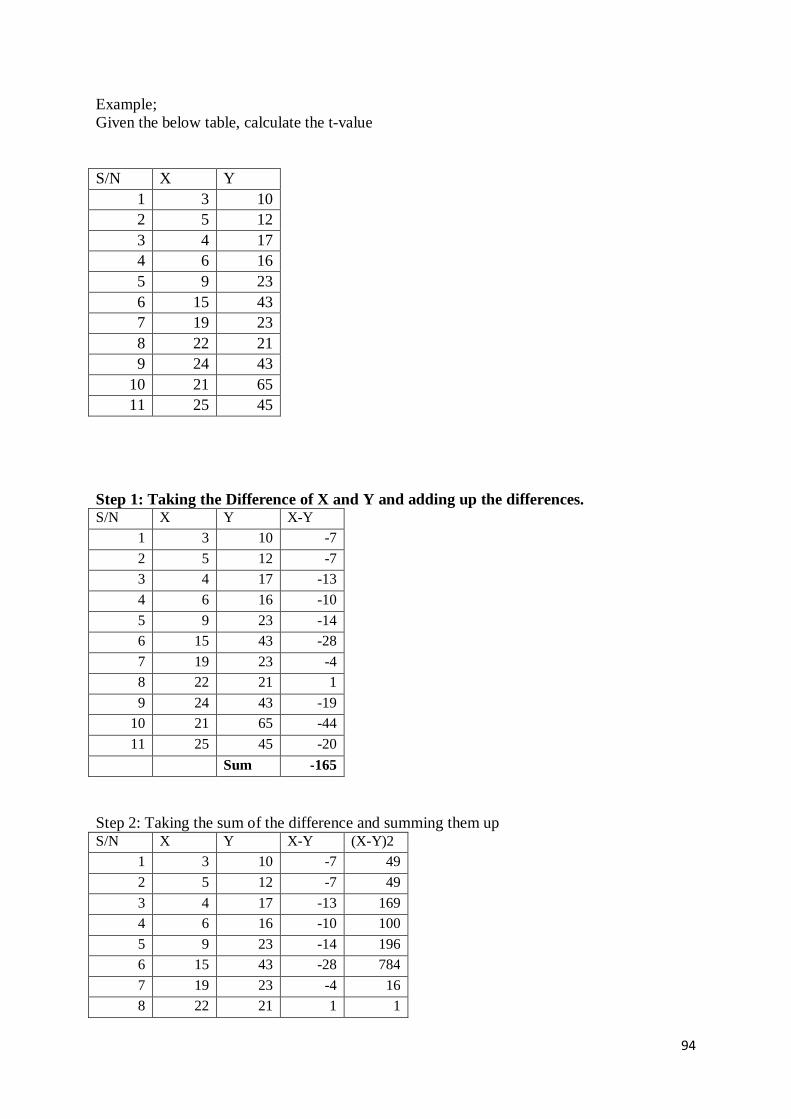
94
Example; Given the below table, calculate the t-value S/N X Y
1 3 10 2 5 12 3 4 17 4 6 16 5 9 23 6 15 43 7 19 23 8 22 21 9 24 43
10 21 65 11 25 45
Step 1: Taking the Difference of X and Y and adding up the differences. S/N X Y X-Y
1 3 10 -7
2 5 12 -7 3 4 17 -13
4 6 16 -10
5 9 23 -14 6 15 43 -28
7 19 23 -4 8 22 21 1
9 24 43 -19 10 21 65 -44
11 25 45 -20
Sum -165
Step 2: Taking the sum of the difference and summing them up S/N X Y X-Y (X-Y)2
1 3 10 -7 49
2 5 12 -7 49
3 4 17 -13 169 4 6 16 -10 100
5 9 23 -14 196 6 15 43 -28 784
7 19 23 -4 16 8 22 21 1 1
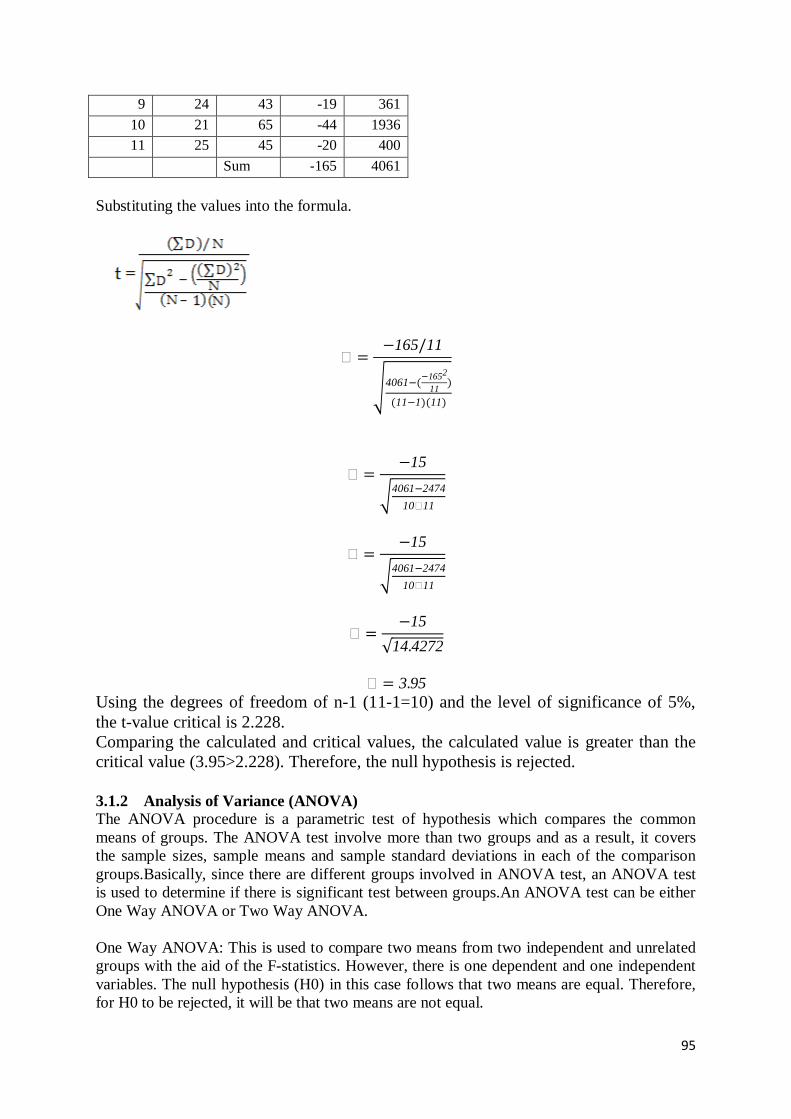
95
9 24 43 -19 361
10 21 65 -44 1936 11 25 45 -20 400
Sum -165 4061
Substituting the values into the formula.
� �165/11
Z4061��[1652
11)
�11�1)�11)
� �15
R4061�2474
10�11
� �15
R4061�2474
10�11
� �15√14.4272
� 3.95
Using the degrees of freedom of n-1 (11-1=10) and the level of significance of 5%, the t-value critical is 2.228. Comparing the calculated and critical values, the calculated value is greater than the critical value (3.95>2.228). Therefore, the null hypothesis is rejected. 3.1.2 Analysis of Variance (ANOVA) The ANOVA procedure is a parametric test of hypothesis which compares the common means of groups. The ANOVA test involve more than two groups and as a result, it covers the sample sizes, sample means and sample standard deviations in each of the comparison groups.Basically, since there are different groups involved in ANOVA test, an ANOVA test is used to determine if there is significant test between groups.An ANOVA test can be either One Way ANOVA or Two Way ANOVA. One Way ANOVA: This is used to compare two means from two independent and unrelated groups with the aid of the F-statistics. However, there is one dependent and one independent variables. The null hypothesis (H0) in this case follows that two means are equal. Therefore, for H0 to be rejected, it will be that two means are not equal.
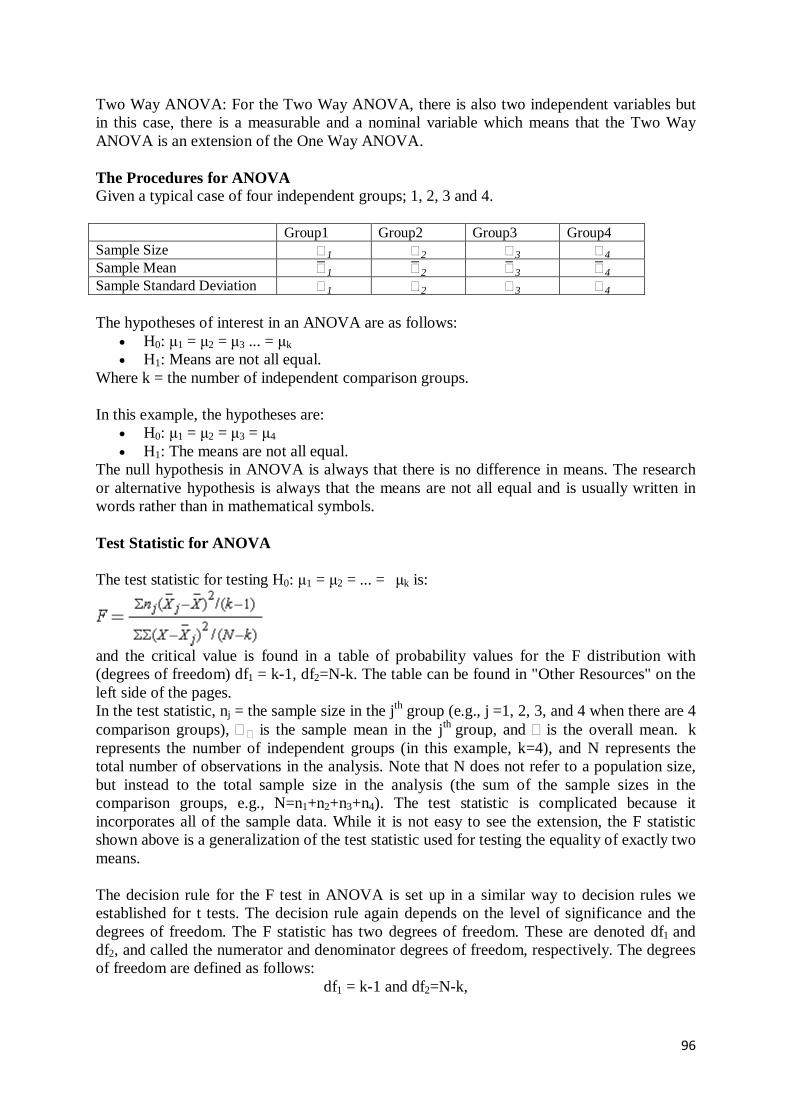
96
Two Way ANOVA: For the Two Way ANOVA, there is also two independent variables but in this case, there is a measurable and a nominal variable which means that the Two Way ANOVA is an extension of the One Way ANOVA. The Procedures for ANOVA Given a typical case of four independent groups; 1, 2, 3 and 4. Group1 Group2 Group3 Group4 Sample Size �1 �2 �3 �4 Sample Mean �T 1 �T 2 �T 3 �T 4 Sample Standard Deviation �1 �2 �3 �4 The hypotheses of interest in an ANOVA are as follows:
• H0: µ1 = µ2 = µ3 ... = µk • H1: Means are not all equal.
Where k = the number of independent comparison groups. In this example, the hypotheses are:
• H0: µ1 = µ2 = µ3 = µ4 • H1: The means are not all equal.
The null hypothesis in ANOVA is always that there is no difference in means. The research or alternative hypothesis is always that the means are not all equal and is usually written in words rather than in mathematical symbols. Test Statistic for ANOVA The test statistic for testing H0: µ1 = µ2 = ... = µk is:
and the critical value is found in a table of probability values for the F distribution with (degrees of freedom) df1 = k-1, df2=N-k. The table can be found in "Other Resources" on the left side of the pages. In the test statistic, nj = the sample size in the jth group (e.g., j =1, 2, 3, and 4 when there are 4 comparison groups), �� is the sample mean in the jth group, and � is the overall mean. k represents the number of independent groups (in this example, k=4), and N represents the total number of observations in the analysis. Note that N does not refer to a population size, but instead to the total sample size in the analysis (the sum of the sample sizes in the comparison groups, e.g., N=n1+n2+n3+n4). The test statistic is complicated because it incorporates all of the sample data. While it is not easy to see the extension, the F statistic shown above is a generalization of the test statistic used for testing the equality of exactly two means. The decision rule for the F test in ANOVA is set up in a similar way to decision rules we established for t tests. The decision rule again depends on the level of significance and the degrees of freedom. The F statistic has two degrees of freedom. These are denoted df1 and df2, and called the numerator and denominator degrees of freedom, respectively. The degrees of freedom are defined as follows:
df1 = k-1 and df2=N-k,

97
Where k is the number of comparison groups and N is the total number of observations in the analysis. If the null hypothesis is true, the between treatment variation (numerator) will not exceed the residual or error variation (denominator) and the F statistic will small. If the null hypothesis is false, then the F statistic will be large. We will then illustrate the ANOVA procedure using the five step approach. Because the computation of the test statistic is involved, the computations are often organized in an ANOVA table. The ANOVA table breaks down the components of variation in the data into variation between treatments and error or residual variation. Statistical computing packages also produce ANOVA tables as part of their standard output for ANOVA, and the ANOVA table is set up as follows:
Source of Variation Sums of Squares (SS) Degrees of Freedom (df)
Mean Squares (MS)
F
Between Treatments
k-1
Error (or Residual)
N-k
Total
N-1
Where
• X = individual observation,
• = sample mean of the jth treatment (or group),
• = overall sample mean, • k = the number of treatments or independent comparison groups, and • N = total number of observations or total sample size.
The ANOVA table above is organized as follows. • The first column is entitled "Source of Variation" and delineates the between
treatment and error or residual variation. The total variation is the sum of the between treatment and error variation.
• The second column is entitled "Sums of Squares (SS)". The between treatment sums of squares is
and is computed by summing the squared differences between each treatment (or group) mean and the overall mean. The squared differences are weighted by the sample sizes per group (nj). The error sum of squares is:
and is computed by summing the squared differences between each observation and its group mean (i.e., the squared differences between each observation in group 1 and the group 1 mean, the squared differences between each observation in group 2 and the group 2 mean, and so on). The double summation (SS) indicates summation of the squared differences within each treatment and then summation of these totals across treatments to produce a single value. (This will be illustrated in the following examples).
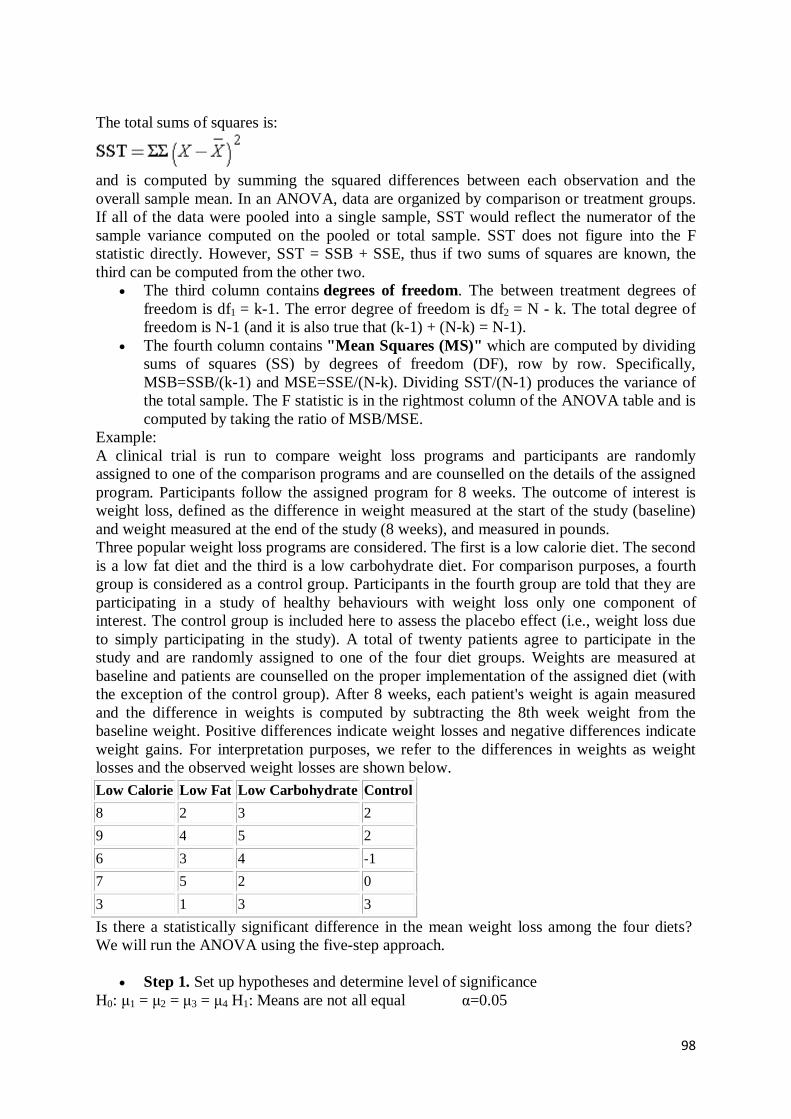
98
The total sums of squares is:
and is computed by summing the squared differences between each observation and the overall sample mean. In an ANOVA, data are organized by comparison or treatment groups. If all of the data were pooled into a single sample, SST would reflect the numerator of the sample variance computed on the pooled or total sample. SST does not figure into the F statistic directly. However, SST = SSB + SSE, thus if two sums of squares are known, the third can be computed from the other two.
• The third column contains degrees of freedom. The between treatment degrees of freedom is df1 = k-1. The error degree of freedom is df2 = N - k. The total degree of freedom is N-1 (and it is also true that (k-1) + (N-k) = N-1).
• The fourth column contains "Mean Squares (MS)" which are computed by dividing sums of squares (SS) by degrees of freedom (DF), row by row. Specifically, MSB=SSB/(k-1) and MSE=SSE/(N-k). Dividing SST/(N-1) produces the variance of the total sample. The F statistic is in the rightmost column of the ANOVA table and is computed by taking the ratio of MSB/MSE.
Example: A clinical trial is run to compare weight loss programs and participants are randomly assigned to one of the comparison programs and are counselled on the details of the assigned program. Participants follow the assigned program for 8 weeks. The outcome of interest is weight loss, defined as the difference in weight measured at the start of the study (baseline) and weight measured at the end of the study (8 weeks), and measured in pounds. Three popular weight loss programs are considered. The first is a low calorie diet. The second is a low fat diet and the third is a low carbohydrate diet. For comparison purposes, a fourth group is considered as a control group. Participants in the fourth group are told that they are participating in a study of healthy behaviours with weight loss only one component of interest. The control group is included here to assess the placebo effect (i.e., weight loss due to simply participating in the study). A total of twenty patients agree to participate in the study and are randomly assigned to one of the four diet groups. Weights are measured at baseline and patients are counselled on the proper implementation of the assigned diet (with the exception of the control group). After 8 weeks, each patient's weight is again measured and the difference in weights is computed by subtracting the 8th week weight from the baseline weight. Positive differences indicate weight losses and negative differences indicate weight gains. For interpretation purposes, we refer to the differences in weights as weight losses and the observed weight losses are shown below.
Low Calorie Low Fat Low Carbohydrate Control
8 2 3 2
9 4 5 2
6 3 4 -1
7 5 2 0
3 1 3 3
Is there a statistically significant difference in the mean weight loss among the four diets? We will run the ANOVA using the five-step approach.
• Step 1. Set up hypotheses and determine level of significance H0: µ1 = µ2 = µ3 = µ4 H1: Means are not all equal α=0.05

99
• Step 2. Select the appropriate test statistic. The test statistic is the F statistic for ANOVA, F=MSB/MSE.
• Step 3. Set up decision rule. The appropriate critical value can be found in a table of probabilities for the F-distribution. In order to determine the critical value of F we need degrees of freedom, df1=k-1 and df2=N-k. In this example, df1=k-1=4-1=3 and df2=N-k=20-4=16. The critical value is 3.24 and the decision rule is as follows: Reject H0 if F > 3.24.
• Step 4. Compute the test statistic. To organize our computations, we complete the ANOVA table. In order to compute the sums of squares we must first compute the sample means for each group and the overall mean based on the total sample.
Low Calorie Low Fat Low Carbohydrate Control
n 5 5 5 5
Group mean 6.6 3.0 3.4 1.2
If we pool all N=20 observations, the overall mean is = 3.6. We can now compute
So, in this case:
Next we compute,
SSE requires computing the squared differences between each observation and its group mean. We will compute SSE in parts. For the participants in the low calorie diet:
Low Calorie (X - 6.6) (X - 6.6)2
8 1.4 2.0
9 2.4 5.8
6 -0.6 0.4
7 0.4 0.2
3 -3.6 13.0
Totals 0 21.4
Thus, For the participants in the low fat diet:
Low Fat (X - 3.0) (X - 3.0)2
2 -1.0 1.0
4 1.0 1.0
3 0.0 0.0
5 2.0 4.0
1 -2.0 4.0
Totals 0 10.0

100
Thus, For the participants in the low carbohydrate diet:
Low Carbohydrate (X - 3.4) (X - 3.4)2
3 -0.4 0.2
5 1.6 2.6
4 0.6 0.4
2 -1.4 2.0
3 -0.4 0.2
Totals 0 5.4
Thus, For the participants in the control group:
Control (X - 1.2) (X - 1.2)2
2 0.8 0.6
2 0.8 0.6
-1 -2.2 4.8
0 -1.2 1.4
3 1.8 3.2
Totals 0 10.6
Thus,
Therefore, We can now construct the ANOVA table.
Source of Variation Sums of Squares (SS)
Degrees of Freedom (df)
Means Squares (MS)
F
Between Treatmenst
75.8 4-1=3 75.8/3=25.3 25.3/3.0=8.43
Error (or Residual) 47.4 20-4=16 47.4/16=3.0
Total 123.2 20-1=19
• Step 5. Conclusion.
We reject H0 because 8.43 > 3.24. We have statistically significant evidence at α=0.05 to show that there is a difference in mean weight loss among the four diets. 3.2 Non-Parametric Test

101
3.2.1 The Chi-square The Chi-square test is a statistical tool used to determine if there is a significant relationship between two nominal or categorical variables. Chi-square is statistical instrument utilized to establish any possible link between categorical variables. For example, if a researcher wants to examine the relationship between gender (male vs. female) and empathy (high vs. low). Given this situation, the null hypothesis (H0) will be; there is no relationship between gender and empathy. On the other hand, the alternative hypothesis (H1) is that; there is a relationship between gender and empathy. See a hypothetical example of how Chi-square is applied to establish links between two categorical variables. A group of students were classified in terms of personality (introvert or extrovert) and in terms of colour preference (red, yellow, green or blue) with the purpose of ascertaining if there any nexus (relationship) between personality and colour preference. Data was collected from 400 students and presented in the 2 (rows) x 4 (columns) contingency table below:
(Observed counts) Colours
Red Yellow Green Blue Totals
Introvert personality 20 6 30 44 100
Extrovert personality 180 34 50 36 300
Totals 200 40 80 80 400 Suitable null and alternative hypotheses might be:
• H0: Colour preference is not associated with personality • H1: Colour preference is associated with personality
To perform a chi-squared test, the number of students expected in each cell of the table if the null hypothesis is true, is calculated. Calculated The expected numbers (under the null hypothesis) in each cell are equal to
Thus for the introvert/red cell the expected number is
To calculate the chi-squared (c2) statistic the value of
needs to be known for each cell in the table. For instance, the introvert/red cell is
The chi-square statistic is calculated to be total of these values (Expected counts) Colours
Red Yellow Green Blue Totals Introvert 50 10 20 20 100 Extrovert 150 30 60 60 300
Totals 200 40 80 80 400 From these expected and the observed values, the chi-squared test-statistic is calculated, and the resulting p-value (probability value) is examined.
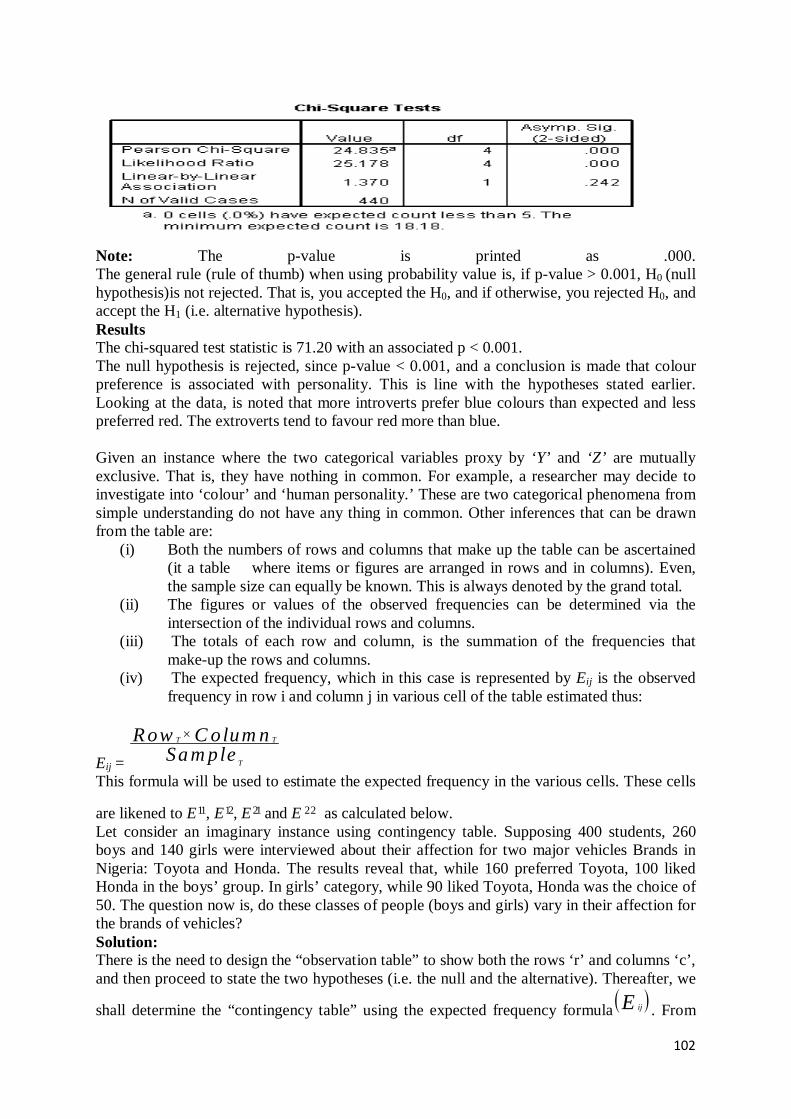
102
Note: The p-value is printed as .000. The general rule (rule of thumb) when using probability value is, if p-value > 0.001, H0 (null hypothesis)is not rejected. That is, you accepted the H0, and if otherwise, you rejected H0, and accept the H1 (i.e. alternative hypothesis). Results The chi-squared test statistic is 71.20 with an associated p < 0.001. The null hypothesis is rejected, since p-value < 0.001, and a conclusion is made that colour preference is associated with personality. This is line with the hypotheses stated earlier. Looking at the data, is noted that more introverts prefer blue colours than expected and less preferred red. The extroverts tend to favour red more than blue. Given an instance where the two categorical variables proxy by ‘Y’ and ‘Z’ are mutually exclusive. That is, they have nothing in common. For example, a researcher may decide to investigate into ‘colour’ and ‘human personality.’ These are two categorical phenomena from simple understanding do not have any thing in common. Other inferences that can be drawn from the table are:
(i) Both the numbers of rows and columns that make up the table can be ascertained (it a table where items or figures are arranged in rows and in columns). Even, the sample size can equally be known. This is always denoted by the grand total.
(ii) The figures or values of the observed frequencies can be determined via the intersection of the individual rows and columns.
(iii) The totals of each row and column, is the summation of the frequencies that make-up the rows and columns.
(iv) The expected frequency, which in this case is represented by Eij is the observed frequency in row i and column j in various cell of the table estimated thus:
Eij =
T T
T
Row C olum nSam ple
×
This formula will be used to estimate the expected frequency in the various cells. These cells
are likened to E11, E12, E21 and E 22 as calculated below. Let consider an imaginary instance using contingency table. Supposing 400 students, 260 boys and 140 girls were interviewed about their affection for two major vehicles Brands in Nigeria: Toyota and Honda. The results reveal that, while 160 preferred Toyota, 100 liked Honda in the boys’ group. In girls’ category, while 90 liked Toyota, Honda was the choice of 50. The question now is, do these classes of people (boys and girls) vary in their affection for the brands of vehicles? Solution: There is the need to design the “observation table” to show both the rows ‘r’ and columns ‘c’, and then proceed to state the two hypotheses (i.e. the null and the alternative). Thereafter, we
shall determine the “contingency table” using the expected frequency formula( )ijE . From

103
there, we compute the chi-square ( )2χ
test statistic; compare the outcome with the critical of the table value, and decision can be inferred from that. Observation table H0: Sex and vehicles are independent
H 1 : Sex and vehicles brand are dependent of one another.
The estimated expected frequencies using the E ij formula are as state below:
E11= 162.5 E12= 97.5
E21= 87.5 E 22 = 52.5 Having estimated the expected frequencies from the observed frequency table, we shall therefore design an expected contingency table using the figures. Contingency table
Toyota Honda Total Boys 162.5 97.5 260 Girls 87.5 52.5 140 Total 250 150 400
Therefore, the computed chi-square test statistic employing the tables, the observed and the contingency tables, we shall have the figure below as the chi-square calculated:
( )22 0 E
Eχ −
= Σ = 0.43.
The degree of freedom (df) for the contingency table is given thus: (number of rows – 1)
(number of columns – 1) is equal to (2-1) (2-1) is equal to 1. At
2
0.05,1χ
= 3.84. Therefore, since the calculated value (0.43) is less than the table or critical value (3.84), we do not reject the null hypothesis. Hence, we conclude that sex and vehicle brand is independent. Self-Assessment Exercise
1 Briefly explain the importance of Chi-Square in analyzing categorical data. 2 Frequency table comes handy as a good statistical tool when analyzing categorical
data in social science research, discuss. 3.2.2 Binomial Test A Binomial test is a test for significance used to test for the difference between a given proportion and a sample proportion. The Binomial test is regarded as the simplest and easest to understand statistical test because it tests for only one parameter and it has an easy to understand distribution. Although it follows strictly the rules of probabilities.
Vehicles Brand Sex Toyota Honda Total Boys 160 100 260 Girls 90 50 140 Total 250 150 400

104
Assumption of Binomial Test The assumption of binomial test follows that the answer given by any respondent must be independent of the answer given by any other respondent. The formula of the Binomial test is given as:
��� �) \��
]���1 ��)���
Where n is the number of trials (sample size); k is the number of successes; p is the probability of success for a single trial or the (hypothesized) population proportion. ^��
_ �!�!����)!Where ! is factorial.
Example: A Ludo player prefers to play his own die believing it is not biased while the opponent player wants to test for the biasness of the die. The die is to be tossed a hundred time to confirm the un-biasness. Solution It should be noted that a die has six (6) faces. Therefore the probability of getting any of the 6
faces is1
6 0.17.
When the player tossed the die 100 times, it was observed that 6 appeared 20 times. That is, 20% or 0.2. Number of time tossed (n) = 100 Total Number of success (k) = 20 So,
��� 20) \100
20] 0.220�0.8)80
��� 20) 0.0997
The binomial test indicates that the probability of getting 6 on a die 20 times is found to be 0.0997 which differs than ideal value 0.17. Thus, the opponent player concluded that the die was biased. 4.0 CONCLUSION In this unit, you have learnt about statistical test and the need for it. The two major categories of statistical test and their various types have been emphasized. Also, you have learnt the conditions that necessitates the use of the various types of the statistical test. As a result, the need for statistical test in a research cannot be over emphasized due to the need to test for a theory or confirmed the assumptions that surrounds the research. 5.0 SUMMARY In this unit, we discussed test in statistics and differentiated between the two categories of statistical test which are parametric and non-parametric test. The parametric test include tests like Student t-test, Analysis of Variance (ANOVA) etc. on the other hand, the non-parametric

105
test include Chi-Square, Binomial test etc. 6.0 TUTOR-MARKED ASSIGNMENT
1. Differentiate between the two categories of statistical tests. 2. When is the t-test most suitable? 3. Why the binomial test is regarded as simplest and easiest?
7.0 REFERENCES AND FURTHER READINGS Adegoke, N (2012), Research Methods in Social Sciences.Lagos:Prime Target Limited.
Adeleke, J.O (2010). The Basics of Research and Evaluation Tools.Ogba, Lagos:Somerest Ventures.
Ihenacho, E. (2004). Basic Steps for Quality Research Project.Lagos: Noble-Alpha publishers.
Neter, J., Wasserman, W. & Whitmore, G.A (1979). Applied Statistics.Massachusetts, U.S.A.:Allyn and Bacon, Inc.
Rutherford, A. (2001). Introducing ANOVA and ANCOVA: A GLM approach. Thousand Oaks, CA: Sage Publications.
Toothacker, L. E. (1993). Multiple Comparisons Procedures. Newbury Park, CA: Sage Publications.
Tsangari, H., & Akritas, M. G. (2004). “Nonparametric ANCOVA with two and three covariates.”Journal of Multivariate Analysis, 88(2), 298-319.
Turner, J. R., & Thayer, J. F. (2001). Introduction to analysis of variance: Design, analysis, & interpretation. Thousand Oaks, CA: Sage Publications.
Wilcox, R. R. (2005). “An approach to ANCOVA that allows multiple covariates, nonlinearity, and heteroscedasticity.”Educational and Psychological Measurement, 65(3), 442-450.
Wildt, A. R., & Ahtola, O. T. (1978). Analysis of covariance. Newbury Park, CA: Sage Publications. View.
Wright, D. B. (2006). “Comparing groups in a before-after design: When t test and ANCOVA produce different results.”British Journal of Educational Psychology, 76, 663-675.

106
UNIT 2 CENTRAL OF TENDENCY AND OTHER HIGHER TEST IN STATISTICS CONTENTS 1.0 Introduction 2.0 Objectives 3.0 Main Content
3.1 Other Measures of Central Tendency 3.1.1 Geometric Mean 3.1.2 Harmonic Mean 3.2 The Median Test 3.3 The Mann-WhitneyTest 3.4 Correlation
4.0 Conclusion 5.0 Summary 6.0 Tutor-Marked Assignment 7.0 References/Further Reading 1.0 INTRODUCTION Some other measures of central tendency exist aside the ones already discussed and also other test in statistics. This shall be looked at in this unit. 2.0 OBJECTIVES By the end of this unit, you will be able to:
• discuss other higher measure of central tendency • state other higher test in statistics.
3.0 MAIN CONTENT 3.1 Other Measures of Central Tendency Outside mean, median and mode already discussed as measures of central tendency, other measures of central tendency are geometric mean and harmonic mean discussed below.
3.1.1 Geometric Mean
It is the nth root of the product of n numbers. If X1, X2, X3…XN are observations then geometric mean, G is given by
G 1 2 3...NNx x x x (a)
Suppose X1, X2, X3, X4…XN is a set of item, its geometric mean, as mentioned before can be computed by taking the Nth root of the product. Thus,
G = 1 2 3...NNx x x x (b)
Now,

107
GN = X1 X2 X3 X4…..XN
We now take the log of both sides to obtain
log GN = log (X1 X2 X3 X4…..XN)
Appling the laws of logarithm, we have
N log G = logX1 + logX2 + logx3 + logX4 +…logXN
Log G = 1 2 3...log log log log
N
N
x x x x+ + +
Log G = logx
N∑
So
G = log
logx
AntiN
∑
Consider the following: compute the geometric mean of 6, 8, 5, and 9.
We can solve this by using any of the two formulas (a) and (b).
Method a:
G =4 6 8 5 9× × ×
=4 2,160
= 6.817.
Method b:
G =log
logx
AntiN
∑
No Log
6 0.77815125
8 0.90389987

108
G = 3.335263883
log4
Anti
= Antilog (0.83381597) = 6.821.
In the case of distributions with corresponding frequencies, the geometric mean will be determined thus,
Log G = 1 21 2log log ... log
NN
N
f f fx x x+ + +
Log G = logf x
f∑∑
In summary, geometric mean is very useful in determine the rate of increase and decrease in a set of item. It is used mainly in the construction of index numbers and averaging of ratios.
3.1.2 Harmonic Mean
Harmonic mean as a measure of location is useful when a data set comprises values which signify rates of change. Harmonic meanof a set of items is the reciprocal of the arithmetic mean of the reciprocals of the specific data. For a set of item X1, X2, X3, …XN, its harmonic mean will be:
H = 11 1N x∑
= 1
N
x∑
Determine the harmonic mean of 5, 7, 8, and 9.
H = 41 1 1 15 7 8 9+ + +
H = 4
0.2 0.143 0.125 0.1111+ + +
H = 4
0.5791
H = 6.907.
5 0.698970004
9 0.954242509
3.335263883

109
3.2 The Median Test The median test is used to test if there is difference in the median of two groups. That is the median test will help tell if the two groups emanate from the population of the same median. The null hypothesis in this case is that the two population have the same median. The formula is given below as:
Where a, b, c, and d are obtained from contingency table which will be illustrated later and n is the total sample size. The chi-square statistic shown on the left side of the table is synonymous to the one which would have been obtained in a contingency table with nominal data except for the factor (n / 2) used in the numerator as a correction for continuity. This is because a continuous distribution is used to approximate a discrete distribution. Example A secondary school principal is trying to find out if the satisfactory levels of students from different class of Art and Commercial department about a new English teacher are the same. A random sample of 20 students from each of the classes were questioned concerning the teachings of the teacher and their perceptions were placed on an ordinal scale statement. A sake of 1 stands for very dissatisfying and a scale of 5 stands for very satisfying. The table below shows the compiled responses from each group of the students.
Art Dept Commercial Dept
79 85
86 80
40 50
50 55
75 65
38 50
70 63
73 75
50 55
40 45
20 30
80 85
55 65
61 80
50 55

110
80 75
60 65
30 50
70 75
50 62
The following steps are taking in Median test. Step 1:Arrange the combined data of both the groups in the descending orderthereby ranking them from the highest to the lowest.
Descending Order
Rank Descending Order Rank
86 85 85 80 80 80 80 79 75 75 75 75 73 70 70 65 65 65 63 62
1 2.5 2.5 5.5 5.5 5.5 5.5 8 10.5 10.5 10.5 10.5 13 14.5 14.5 17 17 17 19 20
61 60 55 55 55 55 50 50 50 50 50 50 50 45 40 40 38 30 30 20
21 22 24.5 24.5 24.5 24.5 30 30 30 30 30 30 30 34 35.5 35.5 37 38.5 38.5 40
Step 2: Select the middle most observed and derive the grand median. In this case, the median is the average of 20th and 21st observation in the array that has been arranged in the descending order. Therefore, the Grand Median is observation (62+61)/2 =61.5. It should be noted that whenever scores are tied, the average rank is taken. Step 3: Construct a Contingent table of rows and column. Contingent Table
Art Dept
Science Dept
Marginal Total
Above Grand
8(a) 12(b) 20(a+b)

111
Median
Below Grand Median
12(c) 8(d) 20(c+d)
Marginal Total
20(a+c) 20(b+d)
40(a+b+c+d)
= n
The cells represent the number of observations that are above and below the grand median in each department. Also, whenever some observations in each group coincide with the median value, the accepted practice is to first count the observations that are strictly above grand median and the rest are put under below grand median. H0: There is no difference between the Art Department and Commercial Department in the perceived satisfaction level. H1: There is difference between the Art Department and Commercial Department in the perceived satisfaction level. Substituting the values into the formula;
The critical chi-square for 1 degree of freedom at 5% level of significance is 3.84. Since the calculated chi-square(0.90) is less than critical chi-square(0.90<3.84), we accept the null hypothesis (H1). Thus the data are consistent with the null hypothesis that there is no difference between the Art Department and Commercial Department in the perceived satisfaction level. 3.3 The Mann-Whitney test The Mann-Whitney test also refers to as the U-test is nonparametric test used to test the equality of the mean in two independent samples. The U-test can compare two sample means emerging from the same population by testing for their equality. The assumption of the U-test is based on the ordinal approach which is a situation when the criterial or conditions for t-test are not met. The Mann-Whitney test is based on the below assumptions;
i. The ordinal conditions or measurements is assumed. ii. The sample is randomly drawn from population. iii. Mutual independency is assumed within the samples. That is, an
observation in one group cannot be in the other. The Mann-Whitney is most used in the field of psychology because it is best at comparing attitude or behavior of individuals. It can also be used for businesses to determine the preferences of various people and to ascertain if changes of preferences depends on location. The Mann-Whitney test is given by the formulas;

112
Where; U=Mann-Whitney U test n1 = sample size one n2= Sample size two Ri = Rank of the sample size. The formula can be further split into;
The U-test is performed on a two-side test and as a result the research hypothesis shows that the populations are not equal as opposed to specifying directionality. The null hypothesis and alternative are given below as; H0: The two populations are equal and H1: The two populations are not equal A way to using the U-test is by;
i. pooling the observations from the two samples into one combined sample, ii. keeping track of which sample each observation comes from, and iii. then ranking lowest to highest from 1 to n1+n2, respectively.
Example Investigate the effectiveness of a new drug to reduce symptoms of asthma. A total of 10 participants are randomly selected to receive either the new drug or a placebo with participants are asked to record the number of episodes of shortness of breath over a week period following receipt of the assigned treatment. The data are shown below.
New Drug 3 6 4 2 1 Placebo 7 5 6 4 12
Non-parametric is appropriate since the sample is small (n1=n2=5). So the question is; is there a difference in the number of episodes of shortness of breath over a week period in participants receiving the new drug as compared to those receiving the placebo? Hypothesis H0: The two populations are equal. H1: The two populations are not equal. If the H0 is true, it will be expected that similar numbers of episodes of shortness of breath in each of the two treatment groups, and we would expect to see some participants reporting few episodes and some reporting more episodes in each group.
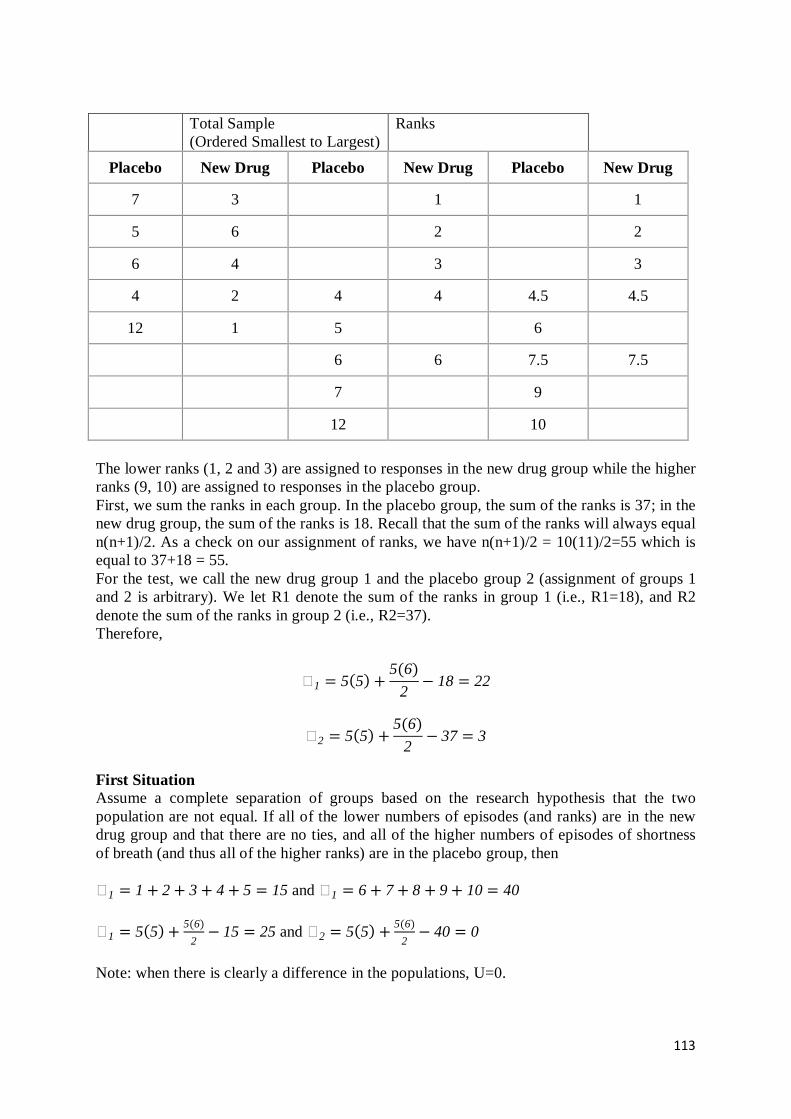
113
Total Sample
(Ordered Smallest to Largest) Ranks
Placebo New Drug Placebo New Drug Placebo New Drug
7 3 1 1
5 6 2 2
6 4 3 3
4 2 4 4 4.5 4.5
12 1 5 6
6 6 7.5 7.5
7 9
12 10
The lower ranks (1, 2 and 3) are assigned to responses in the new drug group while the higher ranks (9, 10) are assigned to responses in the placebo group. First, we sum the ranks in each group. In the placebo group, the sum of the ranks is 37; in the new drug group, the sum of the ranks is 18. Recall that the sum of the ranks will always equal n(n+1)/2. As a check on our assignment of ranks, we have n(n+1)/2 = 10(11)/2=55 which is equal to 37+18 = 55. For the test, we call the new drug group 1 and the placebo group 2 (assignment of groups 1 and 2 is arbitrary). We let R1 denote the sum of the ranks in group 1 (i.e., R1=18), and R2 denote the sum of the ranks in group 2 (i.e., R2=37). Therefore,
�1 5�5) + 5�6)2
� 18 22
�2 5�5) + 5�6)2
� 37 3
First Situation Assume a complete separation of groups based on the research hypothesis that the two population are not equal. If all of the lower numbers of episodes (and ranks) are in the new drug group and that there are no ties, and all of the higher numbers of episodes of shortness of breath (and thus all of the higher ranks) are in the placebo group, then �1 1 + 2 + 3 + 4 + 5 15 and �1 6 + 7 + 8 + 9 + 10 40
�1 5�5) + 5�6)2
� 15 25 and �2 5�5) + 5�6)2
� 40 0
Note: when there is clearly a difference in the populations, U=0.

114
Second Situation Assume where low and high scores are approximately evenly distributed in the two groups, following the null hypothesis that the groups are equal. If ranks of 1, 3, 5, 7 and 9 are assigned to the numbers of episodes of shortness of breath reported in the new drug group, and ranks of 2, 4, 6, 8 and 10 are assigned to the numbers of episodes of shortness of breath reported in the placebo group. Then, �1 1+ 3+ 5+ 7+ 9 25 and �1 2+ 4+ 6 + 8+ 10 30
�1 5�5) + 5�6)2
� 25 15 and �2 5�5) + 5�6)2
� 20 10 Note: if there is clearly no difference between populations, then U=10. Where the smaller values of U support the research hypothesis, and larger values of U support the null hypothesis. The critical value of U can be found in the table below. To determine the appropriate critical value, we need sample sizes (for Example: n1=n2=5) and our two-sided level of significance (α=0.05). For instance, the critical value is 2, and the decision rule is to reject H0 if U < 2. We do not reject H0 because 3 > 2. We do not have statistically significant evidence at α =0.05, to show that the two populations of numbers of episodes of shortness of breath are not equal. However, in this example, the failure to reach statistical significance may be due to low power. The sample data suggest a difference, but the sample sizes are too small to conclude that there is a statistically significant difference. 3.5 Correlation Correlation analysis s used to show the relationship between variables. The parameter of a correlation analysis refers to as correlation coefficient (r) is used to depict the nature and extent of relationship between variables. The Pearson Product Moment correlation coefficient is generally known for this purpose although there exist some other coefficient determination tools. The range of a correlation coefficient is -1 to +1. The negative or minus sign says there is a negative or inverse relationship between the variables. That is given variables X and Y, the higher variable X, the lower will be variable Y and vice versa. On the other hand, the positive or plus sign says there is a positive or proportional relationship between the variables. That is also given variables X and Y, the higher variable X, the higher variable Y and vice versa. Also, correlation coefficient ranging from -0.1 to -0.4 depicts negative and string relationship and 0.1 to 0.4 depicts positive strong relationship. Correlation coefficient of -0.5 to -1 means negative and strong relationship and similarly, 0.5 to 1 means positive and strong relationship. Also, a correlation coefficient of zero (0) means there is no relationship between the variables. Although there may be a non-linear association between two continuous variables, but computation of a correlation coefficient does not detect this. Therefore, it is always important to evaluate the data carefully before computing a correlation coefficient. The formula for the correlation coefficient is given below as;
Where

115
are sample variance of X and Y defined as;
Example Calculate the correlation coefficient and interpret the answer of the scores in the table below. Subject Score 1 Score 2 1 3 20 2 3 13 3 3 13 4 12 20 5 15 29 6 16 32 7 17 23 8 19 20 9 23 25 10 24 15 11 32 30 Solution
Score 1 (X)
Score 2 (Y)
(X-�T ) (Y-�T ) (X-�T )(Y-�T ) (X-�T )2 (Y-�T )2
3 20 -12.1818
-1.81818
22.14876 148.3967 3.305785
3 13 -12.1818
-8.81818
107.4215 148.3967 77.76033
3 13 -12.1818
-8.81818
107.4215 148.3967 77.76033
12 20 -3.18182
-1.81818
5.785124 10.12397 3.305785
15 29 -0.18182
7.181818
-1.30579 0.033058 51.57851

116
16 32 0.818182
10.18182
8.330579 0.669421 103.6694
17 23 1.818182
1.181818
2.14876 3.305785 1.396694
19 20 3.818182
-1.81818
-6.94215 14.57851 3.305785
23 25 7.818182
3.181818
24.87603 61.12397 10.12397
24 15 8.818182
-6.81818
-60.124 77.76033 46.4876
32 30 16.81818
8.181818
137.6033 282.8512 66.94215
�T=15.182
�T=21.818
Sum=347.3636
Sum=895.6364
Sum=445.6364
�����,�) 347.363611 � 1
�����,�) 34.73636
��2 895.6364
11�1 and ��2 445.6364
11�1
��2 89.56364 and ��
2 44.56364
� 34.73636√89.56364 � 44.56364
� �.���� From the correlation coefficient of 0.5498, it means that there is a positive and strong relationship between variables X and Y. 4.0 CONCLUSION So far in this unit we have come to the understanding that there are other measures of central tendency aside the already known mean, median and mode and also higher test in statistics

117
aside the ones already emphasized in unit 2 earlier. Most of these test fall under the non-parametric test and they are applied in unique cases. 5.0 SUMMARY 1. Aside the already know measures of central tendency (mean, median, and mode), you have learnt other higher measures like the Geometric mean and Harmonic mean. 2. You have learnt some higher test in statistics like Median test and Mann-Whitney U-test. 3. Also, you have learnt about the correlation coefficient as a tool used to determine the nature and extent of relationship between variables. 6.0 TUTOR-MARKED ASSIGNMENT Illustrate the procedures for carrying out a median test. 7.0 REFERENCES/FURTHER READING
Adedayo, O. A (2006).Understanding Statistics. Akoka-Lagos: JAS Publishers.
Adeleke, J.O (2010). The Basics of Research and Evaluation Tools.Ogba Lagos:SomerestVentures.
Ihenacho, E. (2004). Basic Steps for Quality Research Project. Lagos: Noble-Alpha publishers.

118
MODULE 5 MANAGING A RESEARCH PROJECT: RESEARCH
PROPOSAL AND REPORT Unit 1 Planning the Research Project Unit 2 Concept of Ethics in Research Unit 3 Report Writing UNIT 1 PLANNING THE RESEARCH PROJECT CONTENTS 1.0 Introduction 2.0 Objectives 3.0 Main Content
3.1 The Research Proposal 3.2 Field Work 3.3 Research Project Content
4.0 Conclusion 5.0 Summary 6.0 Total Marked Assessment 7.0 References/Further Readings 1.0 INTRODUCTION The word research within academia is not used in its everyday sense goes beyond merely gathering information. It presupposes a hypothesis; a situation based at first on limited evidence. The hypothesis is set out in a specific research question or series of questions. The research is an attempt to prove or disprove it. Therefore, a good research plan will aid in achieving this. Planning a research project then follows chosen a topic to writing and presenting a proposal of the research topic chosen before embarking on field work through which conclusion is reached. 2.0 OBJECTIVES By the end of this unit, you will be able to:
• Explain research topic • Discuss basis on how to choose a good research topic • Know how to locate research problem • Develop a research proposal • Know how and when to proceed for research field work.
3.0 MAIN CONTENT 3.1 The Research Proposal Proposal is an important aspect of a project research. Before writing a proposal, the researcher must have chosen a topic. In choosing a research topic it is important for the researcher to think carefully before embarking on.Already, the content of research and what is expected of a research had been emphasized in module to, this unit in module five will try to give a clearer summary of what is required for research proposal, and the body before the field work.
119
In choosing research topic, the researcher may consider going for new or covered topics. Very new topic for which there will be a limited research literature but new areas can sometimes be tackled if the general field is well researched. On the other hand, well covered topic may be hard finding something different to say. Some universities assessed the proposal as part of the overall mark because it allows the supervisor to assess feasibility. It also essentially for a plan but can be changed as work progresses. The length of most academic proposal is often 1500words. Structure The structure of a proposal is essentially cut-down form of full project and it should include;
• Background and rationale for the research • Research question(s) • Brief review of previous academic research • Proposed method • Feasibility.
To get started, first the researcher tries to list significant, interesting questions, and write them down as aims and objectives which together make up the strategy. The aims and objectives will be re-stated in the project itself. The followings should be noted by the researcher;
i. Be realistic about what you can accomplish in the time given other commitments. ii. Justify your choice of the data collection and analysis method; never perfect since
always constrained by resources, so state what constraint you foresee. iii. Mention any ethical, moral or practical issues likely to impinge on your research.
3.2 Field Work The field work of a research comes after the methodology for a research has been set. The methodology will help specify the nature of the research, the method and source of data collection and estimation technique for the research. This will only be possible after literatures have been reviewed which will further help the research in setting up an adequate methodology which will guide the field work. The field work of a research surrounds gathering of data for analysis. The nature and scope of the research will determine the intensity of the field work. The field work may be primary or/and secondary means of data collection. That is, data collection may be data gotten through survey with the use of data collection instruments like the questionnaire, interviews, etc and the data will be required to go through proper presentations using percentage or/and frequency table, or the bar chart and pie chart. After the field work, data collected are processed and prepared for analysis. It is after the analysis of data that findings and conclusions about research project are made. 3.3 Research Project Content The research project contains the prefixes, then from the chapter one of the research to chapter five and the appendixes. The Prefaces a. Title Page b. Declaration c. Abstract The aim of this is to give the reader an overview of the work contained in the dissertation. It should be no longer than one page of A4, single spaced and should make reference to the

120
aims and objectives, the methods of investigation, the main findings and the conclusions reached. It is NOT a description of you contents page. d. Acknowledgements You should refer to those people who have assisted you in your research. For example, your supervisor, advisors, and those who completed questionnaires and interviews etc. Please ensure you spell names correctly and ensure that you conform with ethical issues (do not name any individuals or companies who have provided you with data or personal information) e. Contents Page Your contents page should list the sections and subsections of your dissertation followed by references and then appendices. You should provide the title of each appendix and it is common practice to number the pages in the appendix A1, A2, A3 etc. Pages in the contents table are normally numbered in small case Roman numerals. f. List of Tables and Figures List all, figures, tables and diagrams by number, title and page number g. List of abbreviations Abbreviations should be listed. In the text, the abbreviation should only be used after its first mention, which should be written in full. Chapter One: Introduction (word length guide 1,500 words) This should set the scene and give the reader a complete overview of what you intend to do. It should include a general introduction, a rationale for doing the research which is based on secondary data, an aim and three to four supporting objectives and/or hypotheses, the proposed methodology, limiting and delimiting factors and an outline of the organization of the study. Chapter Two: Literature Review (word length guide 5,000 words) A literature review is “an interpretation and synthesis of published work” and it is not simply an extended essay. As such your literature review should involve the following processes: Searching for sources Searching for references is a standard part of your dissertation and should be done as early as possible. Search tools are available and include:
• internet search engines such as Business Source Premier (EBSCO), Emerald, Google other databases
• bibliographic databases such as the Web of Science and OCLC (check with ISD through the University web site and the information desk in Clifford Whitworth).
Quality of information Information overload has become a familiar term recently but it is a concept that is likely to be clear to you after your search. Your problem may not be finding the information, but selecting what you should use (particularly with Internet searches). Internet sources are of very variable quality; you need to be particularly critical in your use of these sources. It is often worth asking yourself: who supplied this information and why did they supply it? An evaluation of, say, Customer Relationship Management software from a peer-reviewed journal may carry more weight than one offered by the leading supplier of that type of software. Use of information At this level, it is essential that you observe scholarly conventions for the attribution of the work of others. Please read the notes on plagiarism in your student handbook. References are

121
those sources (written and unwritten) which were consulted in the course of your research and which are actually referred to in your text. During the literature search of your dissertation topic, you will find published material (books, book chapters, scientific articles, magazine articles, press articles, commercial reports, etc.). It is essential to refer to your source when quoting actual text, when referring to numerical data, and when using a diagram or figure found in the literature. Figures (pictures, diagrams, models, maps, etc) and tables (numerical data usually) should be clearly labelled and of a sufficient size to be readable. The source of each map, picture, diagram or statistical table should be clearly acknowledged. Thus each figure or table should have: * a number (so that you can refer to it as an explanation or illustration of your argument in the main text - reciprocally, all figures and tables should be referred to and used in the text); * a title; * the source, if the figure or table has been found in a book, article or report (if it is a result of your own work, it does not need a source). Chapter Three: Methodology (word length guide 1,000 to 1,500 words) You must give reasoned arguments for your choice of research methodology, including any alternate methods that have been deemed less suitable. Selections of your sample should be discussed along with details of how you implemented your methodology (how? where? when? who? why?) information on pilot studies should be included, together with details of any changes made as a result. You must discuss and justify how the field work was undertaken, what happened, and the methods used to analyze data. Reliability and validity issues should be discussed including the steps you have taken to ensure your findings may be relied on by others as accurate and trustworthy. The main emphasis of this chapter is on justifying what you have done and the process you have applied in data collection and analysis. Chapter Four: Results and Discussion (word length guide 4,000 words) The results should be presented in a logical manner using tables and figures as necessary. You should discuss the meaning of the results as you present them. Remember to relate your results back to your aim and objectives and literature review. This section should not be just a description of your results but should include a discussion and evaluation of the findings you have made. Chapter Five: Conclusions and Recommendations (word length guide 1,000 to 1,500 words) Your conclusions are a summary of your overall findings and should relate to your original aim, objectives and hypotheses. The conclusions should be based on your results and discussions section but should NOT be a regurgitation of this section. The key parts of the literature must be revisited in this section and where appropriate your conclusions should assess implications of your work. Your recommendations should be based on your conclusions chapter. Where appropriate, your recommendations should include aims, implementation strategies, resource costs and resource benefits. 4.0 CONCLUSION This chapter have discussed the planning of research project and what is required of a good research project. The ability to choose a topic which stem from problem identified, and the procedure to go about writing a proposal for the research project and the research project
122
proper should contain. 5.0 SUMMARY In this unit, you have learnt; i. About planning for a research project. ii. How to choose a research topic. iii. How to develop a proposal for research project. iv. The content of a research project and how to develop them. 6.0 TOTAL MARKED ASSESSMENT
1. Distinguish between a research project and a research proposal. 2. What are the major content of a research proposal?
7.0 REFERENCES/FURTHER READING Aborisade, F. (1997). A student Handbook.(1st ed.). Ibadan. Emeka, A. I. (2004). Basic Steps for Quality Research Project. Lagos: Noble-Alpha
publishers. Ghosh, B. (1992). Scientific Method and Social Research. New Delhi: Sterling publishers.

123
UNIT 2 CONCEPT OF ETHICS CONTENTS 1.0 Introduction 2.0 Objective 3.0 Main Content
3.1 Concept of Ethics 3.2 Development of Ethics in Research 3.3 Codes of Ethics in Research 3.4 Ethics of Researchers 3.5 The Roles of Ethics in Research
4.0 Conclusion 5.0 Summary 6.0 Tutor-Marked Assignment 7.0 References/Further Reading 1.0 INTRODUCTION
In module four (4) just finished, we discussed hypothesis formulation and testing. In it that is, hypothesis as a concept, we learned a lot of things from the start to the end. In a nut shell, we can conclude that hypothesis as a concept is centre to any research. However, in this module, we shall be considering two main issues; these are ethics and report writing in social research. In this very part that is unit one (1) of this module, we shall be discussing ‘ethics’. There are ethical considerations involved in all research studies. It is therefore vital to consider likely harm to young minds in research that might arise from their participation. Most often, there are things that scholars might want to administer in experiment studies present hazards. According to Babbie (2001), he opines that we will all possibly see that it is wrong to carryout studies which require children to be tortured.
1.0 OBJECTIVES
By the end of the unit, you will be able to:
• define and explain ethics
• itemize and discuss some ethical issues in research
• discuss the importance of ethics in research.
3.0 MAIN CONTENT
3.1 Concept of Ethics
Ethics is a very significant concept in research. Babbie (2001) sees ethics as having a close relationship with morality and that both terms have to deal with matters of right and wrong. He stated that the sources of the distinction between the two vary from one person to the other. It may be religious, political ideologies, law or the practical observation of what seems to work or not. According to Website Encyclopedia of Dictionaries cited in Babbie (2001), it defines ethics as relating to morals or moral principles and the philosophy which teaches human character and conduct to distinguish between right and wrong, moral duty and

124
obligations to the community. It further sees ethics as conforming to the standards of conduct of a given profession or group.
According to Babbie, this meaning of ethics as given above might discourages those in research of moral absolutes. That what will constitute ethics and morality in our day to day life is a case of what we agree on amongst ourselves as a group. In essence, the issues of ethics and moral can be likened to the popular saying that, ‘one man’s meat is another’s poison.’ In applying this, it then means that, if we have several professional bodies, the rules and regulations guiding their conducts will assuredly not be the same. And what will constitute ethics or moral in these bodies will definitely not be same.
In social research, the issue of ethics has become so significant. As the scope of the social research becomes enlarged and our techniques of research and analysis have become trendier and analytical, ethical issues arise from the kinds of problems social scientists explore and the modes used to obtain valid and reliable data.
SELF-ASSESSMENT EXERCISE 1
i. Define Ethics
ii. Explain how Ethics is matter of agreement between personalities that constitute the group.
3.2 Development of Ethics in Research
Ethics in research became an issue of discuss in social research just after the World War II. It was during the Nuremberg Trial after the world war that the public became conscious of the now disgraceful research that had been conducted in the concentration camps by German physicians, research which often ended with the death of the research subjects and did not meet even the most fundamental concepts of medical research ethics of the time (Best and Kahn 2006). The issue of medical research, and subsequently the Nuremberg trial lead to the formation of a code of ethics in 1949, which begins with the conditions that all research participation must be voluntary. Also, another known instance of study that was conducted without any adherence to ethics in that area was the Tuskegee Syphilis Study (Jones 1993). In 1932, an investigation was done to ascertain the effects of syphilis. In that investigation, 399 African-America individuals infected with syphilis were not allowed treatment and were informed that they had bad blood. The study has been portrayed as a bad statement concerning racism and ethics as misconducts.
The American Psychological Association (APA) in 1953 came up with the first known code of ethics for psychologists. By 1963 the code of ethics was reviewed. The Board of Directors of the Association in 1970 appointed an Ad Committee on Ethical Standards on psychological Research to update the 1963 code of ethics in the light of changes in the sciences, in the profession and in the broader social context in which psychologists practice then. Ever since then, a lot of professional association had reviewed their code of ethics to take care of the major moral concerns of their various fields. A good instance was the code of Ethics on the practice of Sociology was approved by the Association’s members in 1989. Subsequently, it then follows that every research project involving human subjects should be followed by careful assessment of predictable risks in comparison with foreseeable benefits to the subject or the others. The rights of the research subject to protect his/ her integrity must be respected. Every precaution should be taken to respect the privacy of the subject and to

125
minimize the impact of the study on the subject’s physical and mental integrity and on the personality of the subject.
From the various accounts given above, we can now understand and fully discuss the historical perspective of the evolutions of ethics in social research. Also, these accounts have provided important lessons for understanding what could happen if the ethical issue in research is not considered holistically within the search process.
SELF-ASSESSMENT EXERCISE 2
Account for the evolution of code of ethics.
3.3 Codes of Ethics in Research
Discussed below are some of the fundamental principles of ethics in research.
� Voluntary participation It is one of the fundamentals of the principles of ethics in social research. It is case of one freely or intentionally taking part in an event. In research, voluntary participation means that no individual should be forced into partaking in a research. Taking part in any research should be from a researcher’s free will. In medical sciences, one of the ethics is that taking part in any experiment should be voluntary. This is applicable in social sciences too. No individual should be forced against his/her will to participate in any research. This code of ethics is more of a theory than in practice. For instance, if a lecturer in Economics direct his/her students fill a questionnaire, all the students would have no choice than to comply with the directive, for fear of failure or something worse. This is not a case of free will. Indirectly, the students may have been forced to voluntary part take of the activity.
� Anonymity
This is a case of facelessness. This is another basic code of ethics in research. In this regard, the Researcher remains inconspicuous by separating the identity of individuals from the information they give (Nachmias & Nachmias, 1996). An individual that partook in a research is considered unknown if the researchers are not able to identify any information with a particular contributor. It is a situation whereby researchers are unable to associate a name with any particular data even if sensitive information may be revealed.
� No Harm to the participation In undergoing an investigation, there is need for the researcher to ascertain if there is any harm that we affect the participants in the course of carrying out the investigation. One of the ethics of research is that, no harm should be done to participant(s) whether or not they volunteer their services. A lot of time, certain treatments that the investigator may want to administer in experimental studies present risks. A good instance is, some research psychologists often expose investigational teams to risk. After the experimentation, most often a lot of individuals in the team suffer some mental distress because of the exposure. Another good example is that, in the process of exploring sensitive traits (e.g. relationships with abusive persons) might cause investigator to focus on them again after the exercise. This may course the some of the participants another round of concern, restlessness, etc.
The ethical code that there should be no harm to the participants in practice means that no information about any individual who partook in the exercise should be divulged to the public
126
that could lead to embarrassment on their part, including their attitudes, demeaning characteristics or even questions referring to abnormal behavior. Hence, the principal issue is that the investigated individual(s) must be protected from both physical and mental harm.
� Confidentiality This is another key norm of ethics in research. The respondents have a right to have information gathered about them to be kept secret. The investigators have a commitment not to make open the information to any person except the identities of the respondent are hidden. Even though researchers have a strict moral and professional responsibility to keep information private, there are situations in which this code of ethics is highly impossible to observe. A good instance is a situation where issues arise, and information about it is subjected to judicial scrutiny backed by law, that information which ought to private would have to be made public.
To improve on this principle without compromising the right of the respondent, over the year a number of modus operandi have been put in place by Scholars. These include Deletion of Identifiers: it is an instance where the researcher is allowed to remove the names, social security numbers and street address from the information given about any respondent. Crude Report Categories:in this case, the researcher can release data on any respondent that has to do with the person’s local or country rather than neighborhood data, year of birth rather than specific date, profession but not professional specialization, etc. Micro Aggregation:This is, constructing “average persons” from data on participants and releasing this information rather than the original information about the participant. Error Inoculation:as the name implies, the researcher can intentionally put in some errors into the record of the respondent just to confuse the would-be users on one hand, and protect the respondent’s privacy on the other hand. Meanwhile, the original information about the respondent still remains the same.
� Consent The duo of Eduard and Risk cited in Adegoke (2012), see consent as a practice where people choose whether to partake in an inquiry after being educated about the facts that would be likely to influence their decision. This involves four elements: competence, voluntarism, full information and comprehension. The principle of consent in research states that, participating individuals must be educated about the significances of participating in the exercise (i.e. the investigation). This research ethics does not preclude the conduct of social scientific research that involves risk but it does require the use of informed participants. When research participants are exposed to pain physical or emotional injury, invasion of privacy or physical or psychological stress or when they are asked to temporally surrender their autonomy, informed consent must be fully guaranteed. The idea of consent stems from cultural values and legal consideration. It is entrenched in the high value we attach to freedom and to self-determination.
� Secrecy
In carrying out planned research, most often, the secrecy (privacy) of the respondents is often violated. This code of ethics (i.e. secrecy) is the freedom of any person to pick and choose for him or herself the time and circumstance under which and most notably, the event to which his/her attitudes, beliefs, behavior and opinions are to be shared with or without help from others.
There are three different dimensions of privacy.

127
I) The sensitivity of information being given. It refers to how personal or potentially threatening the information is that the researcher wishes to collect. Sensitive issues such as religion, sexual, racial discrimination, income, etc. is classified as sensitive information. The more sensitive information is, scholars are advised to protect the secrecy of the respondents.
II) The setting being observed. The setting where the investigation is being carried out may be private or sometimes public, depending on the study and its intention. For instance, issues at home are considered one of the most secretive settings in most culture and incursion into people’s home without consent are forbidden by law.
III) Spread of information. This has to do with the ability to equal personal information with the identity of the respondents.
These three aspects of secrecy a code of ethics must be given serious consideration when a researcher is planning to conduct a research.
SELF-ASSESSMENT EXERCISE 3
Secrecy a code of ethics emphasizes on three aspects of privacy that must be given serious consideration. What are they?
3.4 Ethics of Researchers
Apart from the codes of ethics discussed above, researchers have their own codes of ethics that guard their own modus operands. These are explained below:
� Honesty:it is a state of one being upright in whatever he/she is engaged in. applying this to investigation, a researcher must not lie. He/she must be faithful with himself/herself, respondents, focused community, and to report the outcomes with utmost uprightness.
� Reliability:This has to do with one keeping to promises and agreements as reached.
Researchers should make sure that acting with sincerity and striving for consistency of thought and action should be their watch word.
� Respect:This code obliges researchers to protect the respondent’s fundamental human
and civil rights.
� Communality: This principle has a link with faithfulness. This rule requires that precise report methods, purpose, motives and consequences should be done by the investigators. This code of ethics obliges researchers to make their research findings known to the focused population willingly and freely.
� Disinterestness:this requires that the researcher’s personal gain should not be the
overriding interest for carrying out a study.

128
3.5 The Roles of Ethics in Research
We have seen what ethics is all about in social research. Let examine the roles ethics plays in social research. These are discussed as follows:
� The principles behind research ethics support the aims of research such as knowledge, truth and avoidance of error. For instance, a researcher has to be honest in reporting study outcomes.
� Codes of ethics inspire peaceful writing relationship between the researchers and the respondents. On the part of researcher/authorship, intellectual property is protected while respondents are not named in order to avoid crisis.
� Social research ethics make ensure that the researchers are answerable to the public to allow for contributions or criticisms. A good example is the case of research that was carried out in the concentration camps by German physicians during World War II was publicly condemned.
� It aids to build support for research since it is known that research is carried out with the aim of advancing knowledge to benefits for mankind.
� The principles of ethics uphold a range of other key moral and social values such as human rights, animal welfare, and social responsibility, compliance with the law, and health and safety.
SELF-ASSESSMENT EXERCISE 4
Itemize researchers’ rules of engagement in conducting research. 4.0 CONCLUSION We have once again discussed another vital aspect of social research called ethics. We have basically discussed rules guiding the conduct of researches in social sciences. From our study, we can conclude that an understanding of the ethics of research by researchers will make studies outcomes valid and reliable. 5.0 SUMMARY In this unit, we have dealt with the description of ethics, the underpinning of ethical issues in research, codes of ethics in social research and the significant of ethics in research. 6.0 TUTOR-MARKED ASSIGNMENT
1. What are ethics? 2. Give reasons why ethics are significant in research? 3. List and explain researchers’ ethics.

129
7.0 REFERENCES/FURTHER READING Adegoke, N (2012). Research Methods in Social Sciences.Lagos:Prime Target Limited.
Best, J.W.and Kahn, J.V. (2006).Research in Education. Boston: Pearson Education Inc.
Babbie, (2001).The practice of Social Research.Balmont:Wardsowrth Publishing Company
Ghosh, B. (1992). Scientific Method and Social Research. New Delhi. Sterling publishers: pp183-198.
Nachimas, F. &Nachmias, D. (1996).Research methods in Social Sciences.(5th ed). New York: St. Martin’s Pre.

130
UNIT 3 REPORT WRITING CONTENTS 1.0 Introduction 2.0 Objective 3.0 Main Content
1.1 Report Writing: nature and forms 3.1.1 Forms of Reports
1.2 Report Writing: Features 3.3 Research Report Writing: It’s Structure
2.0 Conclusion 3.0 Summary 4.0 Tutor-Marked Assignment 7.0 References/Further Reading 1.0 INTRODUCTION
Introducing the just concluded unit which is about Ethics, we said two main issues ethics and report writing in social research shall be discussed. Ethics which is one of the two issues has just being discussed. Our focus in this section shall be on Report writing. A report is a comprehensive account of events or activities that took place during an enquiry, probe, visit or investigation. A very significant part to be considered by the author of a report is to determine the form it should take. Therefore, the report will look different, depending on the nature preparation. That is, is it for instruction, professional scientists or the audience?
2.0 OBJECTIVES
By the end of this unit, you will be able to:
• define and discuss report writing
• present and organize a research report
• identify and use research documentation.
3.0 MAIN CONTENT
3.1 Report Writing: nature and forms
In social research, the nature/way of documenting investigation procedures and outcome is quite different from any other form of report writing. In social research, reports are cautiously set out accounts of facts gotten from studies. The report writing makes findings of research studies accessible to others. Basic elements are present in all kind of report; the way in which the reports are constructed different according to their ultimate purpose and intended audience.Reports are written on the state of an organization, the progress made by a company on some projects or the cause of social problems. Also, reports writing are form of Doctorial theses, Masters’ dissertations, Bachelor’s degree projects and articles published in scientific journals.
Report writing is a specialized form of communication and it is of various forms. A good report must be readable and the tone formal. The language used should conform to lay down

131
standard and style or traditions of the association concerned.
3.1.1 Forms of Reports
A lot of kinds of reports exist. Discussed below are the main ones amongst many. According to Winimer and Dommicks in Adegoke (2012), the first steps in writing a report is to clearly identify your intended audience, purpose and the organization.
� Periodic Reports
Periodic reports are written on the activities, conditions and prospects of an organization or a division of an organization. These are written at some specified interval, for example, weekly, monthly, quarterly, annually or bi-annually.
� Research Reports
Research reports usually take the form of a thesis, dissertation, projects, journal article or paper to be read at a professional meeting. Dissertations, theses and projects are part of post graduate studies requirement. The essence of dissertations is for students to show their research skills and prove that they can successfully undertake research unaided. The research reports are the main stay of most academic journals. When writing for an academic or professional journal, the key to success lies in the ability to write concisely, that is, briefly and to the point.
� Progress Report
Unlike research reports, but similar to periodic reports, progress reports are written at regular intervals. Going by the name, progress reports are done on the development made on a particular activity up to the period they cover. Latter reports provide up to date accounts of work on the remaining stages of the project.
� Commissioned research
This form of report writing is referred to as realistic research where a practically identified problem needs to be fixed. Commissioned research is fundamentally contract based with agencies, organizations, ministries, and a lot more that is specifically hired to fix the problem. Commissioned research is not limited to policy but is also used for appraising current practices and resolving problems in the workplace. Presentation of a commissioned report is much more flexible than the other types of reports.
� Mass media report
Media report trend to be very short compared to other forms of report already discussed. In media reports, details about the studies are not reported. The importance is on the research findings, what it is all about and its implications on human existence. In media report, the language is civil because of the publics.
� Investigative Reports
Investigative reports are reports based on the inquiry on social phenomena. They are report predicated on specially approved investigation. Among the subjects usually covered by the reports are the causes and the prevention of accident, crime, epidemics, flood, workers and

132
students unrest, etc. also, investigative reports usually provide information to fellow investigators working on a case, to supervisors and administrators who may need to allocate resources for a case and to the prosecuting attorney who may try the case. Reports may also be used in the court, to outline a case to the injury. Investigative reports help to unravel the hidden truth while the case last in court.
SELF-ASSESSMENT EXERCISE 1
Differentiate between periodic report writing and progressive reporting.
3.2 Report Writing: Features
A good report must possess some fundamental qualities embedded in it. These qualities, also known as characteristics are sometimes referred to as the basic rules of effective report writing. See these features below:
� Completeness: This means that the written report has all relevant information in it. A report should contain both good and bad outcomes. A complete report makes it easier for an individual who was not at the scene of the occurrence to understand what really transpired.
� Conciseness: As the name implies, it means only the information that is necessary
and important is reported brief and straight to point. Berg and Horgan in Adegoke (2012) opine that reports should be as succinct as possible while containing the essential features and details in a manner that is understandable to the reader. Reports should be written as narratives but should exclude non-essential modifiers or descriptors. It language should be kept simple and direct and in active voice rather than passive.
� Clarity: The Oxford Advanced Learners Dictionary defines clarity as the ability to think about or understand something clearly. A report must clearly explain to the would-be reader accurately what the scholar observed. Short, active voice sentences lead to clear meaning and understanding. Clarity can best be accomplished by the use of Standard English including good sentences structure, correct punctuation, accurate spelling, proper capitalization and standard paragraphing.
� Accuracy: In writing a report, accuracy is very essential. The scholar should be straight to point and avoid generalities. The scholar should avoid mistakes in reporting his/her investigation or study.
� Gender Neutrality: A neutral or inclusive wording can usually describe the event or situation without creating a gender atmosphere. The use of non-gender base language is further assisted by the use of the proper names rather than the pronoun he or by the use of the expression he or she, him or her etc. gender–specific references can be avoided completely by writing in the third–person, plural and using proper nouns only.
� Language: A good research report should be written in a language which the would-be readers will understand. For example, researchers should write their reports using civil languages that the general publics would be able to understand. The readers may

133
not be an expert in that area. But he/she should be able to read and understand a report.
� Presentation: This has to do with the report outlook. The layout and style of
presentation should make it easy for the readers to read and find what they require. A report will be more easily reached if the content and structure are clearly labeled. Separate chapter titles, section and subsection headings and labels on tables and figures all play a significant role.
� Graphs, Charts and Tables: This aspect is vital in report writing. Graphs and table
are crucial means of showing statistical data to a layman on the street. However, we should make sure that they are clearly and properly explained and that attention of reader will be drawn to vital message from our analysis. It is important to ensure that all graphs, charts and tables are referred to in the text.
SELF-ASSESSMENT EXERCISE 2
i. A good report must possess certain qualities, discuss.
ii. Why are graphs, charts and tables vital in report presentation?
3.3 Research Report Writing: It’s Structure In research report writing or presentation, it is universally the same, except on very real occasions. For instance, investigative settings the layout for report writing may depend on the controlling Body. Be that as it may, research reporting still has a general structure even though the presentation may vary according to the nature and design of each individual research.
� The Title Page The title page of a research report document is the front page that indicates to the would-be reader the subject matter. The page also bears the name(s) of the researcher(s) as well as the name(s) of the individual(s) or organization to which the report is being submitted. The date of submission is also shown on the page.
� Forward The forward is a short introduction at the very beginning of the report by someone who knows the start of the report and also familiar with the author(s)
� Acknowledgements
This part of research report is where the researcher acknowledges the contributions of earlier authors, and everyone who has contributed significantly or who has assisted in some other ways to make the writing of the report possible. Acknowledgments should be clearly written with everyone who has aided the study one way or the other name mentioned.
� Contents page
134
The content page refers to the table of contents. It is a list of all headings used in the report, each with the number of page on which the relevant section or subsection starts. The contents page is meant to serve as a guide to the reader.
� Table of charts The table of charts shows sections where charts, graphics, tables, diagrams etc. can be found in the report written.
� Abstract (or Summary) It is simply the summary or the executive summary (in the case of official study) but very brief account of the entire study. It is a brief account that rages between 350 - 500 words at the beginning of the report. It provides an account of the objectives, context, methods, findings, conclusion and recommendations contained in the report. It tells the reader what will be found in the report.
� Introduction The introduction section of a report provided the background information on the problem of study and the possible effects of the research problem on the society or organizations. It prepares the reader for the total content of the report. It usually includes information on matters such as the justification for the study. The justification of the study is what makes such a report a necessity.
� Objectives The purpose of the study makes research wishes to be accomplished or find out at the end of the study. These purposes are clearly stated in the report.
� Literature Review/Theoretical Framework Like a house that is built on a well laid foundation, a study must be supported with theory or theories. In the same vain, reviewing of literature helps to introduce the researcher to what others have done in the area and the current state of knowledge in the particular area of study. The researcher must ensure that the literature review covers where the problems emanates from, what is already known about the problem and what other methods have been used to solve the problem as well as their outcome.
� Methodology This deals with process of collecting and analyzing the required data in the course of the study. A detailed account of the adopted techniques should be given within the body of the report but detailed technical sections are better discussed. It is to be noted that data can be collected through interviews, questionnaires, test, experiments, etc. and the data collected can be analyzed by any of the statistical means.
� Findings This aspect is concerned with the presentation and discussion of the outcomes. The outcomes must be clearly set out, easily reached, and demonstrate that they are adequately supported by the investigation evidence. In this part, tables, diagrams and charts used are logically presented.
� Conclusion

135
The purpose of the conclusion is to close the study. It also presents an opportunity to make suggestion for further study base on what you have discovered. Often times, it is helpful to link the discussion with other literature on the topic but the conclusion should not present significant new material that cannot be found in the body of the report. This section may be only a paragraph long but without it the study lacks closure.
� Recommendation This part is significant because it gives the research opportunity to suggest to the organization, government or the general public what they can do to solve the problem studied on the basis of the conclusions drawn from the findings. It is advisable for the researcher to list the suggestions, although they are not bound to be accepted.
� References
This is the list of literature (books journals, internet sources etc.) accessed by the researcher or referred to in the study. It is placed in a separate section at the end of the report.
� Appendix
The appendix is an affix section in which all other information that cannot be accommodated in the main body of the report is presented. Such information usually has to do with items such as regression output, fitted graphs, letters, photographs, questionnaire and statistical details that may be too voluminous for inclusion in the study. In most instances, they are information that is not actually required for the understanding of the report.
SELF-ASSESSMENT EXERCISE 3
Why is structure vital in report writing?
4.0 CONCLUSION
We have again study another significant aspect of social research tagged report writing. That a good report writing boils down to application of scientific style of report writing. This implies that the style and tone should be set to their level of expertise, that the write up should be logical and clear and that the researcher should stick to the rules. Also, researchers should bear in mind that their reputation is at stake if their reports are filled with incorrect spelt and unclear use of words.
5.0 SUMMARY
In this unit, we have looked at report writing in research, we have dealt with forms of report writing, the features of a good report and the structure of report.
6.0 TUTOR-MARKED ASSIGNMENT
1. Discuss the features of a good report 2. Itemize the parts of a research report writing

136
3. Distinguished between theoretical framework and review of literature
7.0 REFERENCES/FURTHER READING Adegoke, N (2012). Research Methods in Social Sciences. Lagos:Prime Target Limited.
Best, J.W.& Kahn, J.V. (2006). Research in Education. Boston: Pearson Education Inc.
Collins, K.J. (2000).Researcher in the Social Sciences. Pretoria: University of South Africa.
Ghosh, B. (1992). Scientific Method and Social Research. New Delhi: Sterling publishers.
Offiongodon, A.M. (1999).Research Method for Manpower Decisions. Owerri: Afrika Link Book.

137
MODULE 6 REFERENCING SYSTEM IN A RESEARCH REPORT Unit 1 Referencing System Unit 2 Different Citation Links Unit 3 The Reference List/Types UNIT 1 REFERENCING SYSTEM CONTENTS 1.0 Introduction 2.0 Objective 3.0 Main Content 3.1 Types of Referencing System 3.2 When to use Reference 3.3 Features of Reference 4.0 Conclusion 5.0 Summary 6.0 Tutor-Marked Assignment 7.0 References/Further Reading 1.0 INTRODUCTION When you are writing an essay, report, dissertation or any other form of academic writing, your own thoughts and ideas inevitably build on those of other writers, researchers or teachers. It is essential that you acknowledge your debt to the sources of data, research and ideas on which you have drawn by including references to, and full details of, these sources in your work. The main reasons for referencing are to:
• distinguish your own ideas and findings from those you have drawn from the work of others; and
• follow up in more detail the ideas or facts that you have referred to.
2.0 OBJECTIVES By the end of this unit, you will be able to:
� discuss the essence of referencing � explain systems of references � state when to reference � identify features of a good reference.
3.0 MAIN CONTENT 3.1 Types of Referencing System There are two main systems of referencing. They are: Footnotes/End Notes System:It can also be referred to as the Oxford system. They are subscript number in the text and a reference at the bottom of the page (or at the end of the main text of the research project). An example is; Bibliographic details at the bottom page or all together at the end of document. In-Text Citation: It is also referred to as the Harvard system. They are citations in the body of the text. For example; new research on worm has revealed some remarkable behavior

138
(Wilson, 2016). It should be noted that every entry in the references list mist have at least one corresponding citation in the main text and vice versa. 3.2 When to Use Reference Your source should be acknowledged every time the point that you make, or the data or other information that you use, is substantially that of another writer and not your own. As a very rough guide, while the introduction and the conclusions to your writing might be largely based on your own ideas, within the main body of your report, essay or dissertation, you would expect to be drawing on, and thus referencing your debt to, the work of others in each main section or paragraph. 3.3 Features of Reference Whenever you read or research material for your writing, make sure that you include in your notes, or on any photocopied material, the full publication details of each relevant text that you read. These details or features should include:
• surname(s) and initial(s) of the author(s); • the date of publication; • the title of the text; • if it is a paper, the title of the journal and volume number; • if it is a chapter of an edited book, the book's title and editor(s) • the publisher and place of publication*; • the first and last page numbers if it is a journal article or a chapter in an edited book.
For particularly important points, or for parts of texts that you might wish to quote word for word, also include in your notes the specific page reference. It should be noted that the publisher of a book should not be confused with the printer. The publisher's name is normally on a book's main title page, and often on the book's spine too. 4.0 CONCLUSION Referencing system is an important aspect of an academic research. The reference system will help the researcher distinguish his/her ideas from those drawn from the work of others and also follow up in more detail the ideas. 5.0 SUMMARY In this unit, you have learnt understood the need for referencing, when to insert a reference(s), and the characteristics of a reference. 6.0 TUTOR-MARKED ASSIGNMENT
1. List and explain the two main systems of references. 2. List the characteristics of a good references.
7.0 REFERENCES/FURTHER READING Berry, R. (2004).The Research Project: How to Write It. London and New York: Routledge. Gash, S. 1999: Effective Literature Searching for Students.(2nd ed.). Aldershot: Gower. Gibaldi, J. 2004: MLA Handbook for Writers of Research Papers. (6th ed.). New York: The

139
Modern Language Association of America.University of Wisconsin writing centre. http://www.uwstout.edu/writingcenter. Accessed 24/06/2016.
USC libraries research guides “organizing your social sciences research paper: The literature
Review” www.libraries.usc.edu/researchguides/literaturereviews. Accessed 2/06/2016.

140
UNIT 2 DIFFERENT CITATION LINKS CONTENTS 1.0 Introduction 2.0 Objective 3.0 Main Content 3.1 Book references 3.2 Papers or articles within an edited book 3.3 Journal articles 4.0 Conclusion 1.0 Summary 2.0 Tutor-Marked Assignment 7.0 References/Further Reading 1.0 INTRODUCTION Referencing comes from various citations these various citation determines the originality of the source of any reference. Different sources vary in their presentations of referencing although they still maintain the type/listing of referencing format which will be discussed in the unit. 2.0 OBJECTIVE By the end of this unit, you will be able to:
• identify different citation links of referencing • state the format used in them.
3.0 MAIN CONTENT 3.1 Book references The simplest format, for a book reference, is given first; it is the full reference for one of the works quoted in the examples above. Knapper, C.K. and Cropley, A. 1991: Lifelong Learning and Higher Education. London: Croom Helm. The reference above includes:
• the surnames and forenames or initials of both the authors; • the date of publication; • the book title; • the place of publication; • the name of the publisher.
The title of the book should be formatted to distinguish it from the other details; in the example above it is italicized, but it could be in bold, underlined or in inverted commas. When multi-authored works have been quoted, it is important to include the names of all the authors, even when the text reference used was et al.

141
3.2 Papers or articles within an edited book A reference to a paper or article within an edited book should in addition include:
• the editor and the title of the book; • the first and last page numbers of the article or paper.
Lyon, E.S. 1992: Humanities graduates in the labour market. In H. Eggins (ed.), Arts Graduates, their Skills and their Employment. London: The Falmer Press, pp. 123-143. 3.3 Journal articles Journal articles must also include:
• the name and volume number of the journal; • the first and last page numbers of the article.
The publisher and place of publication are not normally required for journals. Pask, G. 1979: Styles and strategies of learning. British Journal of Educational Psychology, 46, pp. 128-148. Note that in the last two references above, it is the book title and the journal name that are italicized, not the title of the paper or article. The name highlighted should always be the name under which the work will have been filed on the library shelves or referenced in any indexing system. It is often the name which is written on the spine of the volume, and if you remember this it may be easier for you to remember which the appropriate title to highlight is.
3.0 CONCLUSION
References come from various citation links and these links have a unique way they are presented. The link of referencing shows its originality.
4.0 SUMMARY
In this unit you have learnt that references come from various links which the journal article, paper article, book references etc. these various link reserved its own format of presentation as already shown.
5.0 TUTOR-MARKED ASSIGNMENT
List and discuss the three reference citation links.

142
6.0 REFERENCES/FURTHER READING
Berry, R. (2004).The Research Project: How to Write It. London and New York: Routledge.
Gash, S. 1999: Effective Literature Searching for Students. (2nded.). Aldershot: Gower.
Gibaldi, J. (2004).MLA Handbook for Writers of ResearchPapers. (6th ed.). New York: The
Modern Language Association of America.
Watson, G. (1987). Writing a Thesis: A Guide to Long Essays and Dissertations. London:
Longman.

143
UNIT 3 THE REFERENCE LIST/TYPES CONTENTS 1.0 Introduction 2.0 Objective 3.0 Main Content 3.1 American Psychological Association (APA) Style 3.2 Harvard Style (Name and Year) 3.3 Chicago Style (Kate Turabian Style 4.0 Conclusion 4.0 Summary 5.0 Tutor-Marked Assignment 7.0 References/Further Reading 1.0 INTRODUCTION List of referencing is very importance in any scholarly work. It shows the source of information documented in an academic report. Where the list of references is not included in a report, the report looks empty and may not be considered a good work. Any scholarly work cited in course of writing a paper, especially in the “Background to the Study or Literature Review” must be listed in the referencing section. There are numerous styles of referencing. Institutions of higher learning like the universities always give instructions on the form of referencing that is preferred. However, three referencing styles are commonly used. These are: 2.0 OBJECTIVE By the end of this unit, you will be able to differentiable between the American Psychological Association (APA) Style, Harvard Style (Name and Year), and Chicago Style (Kate Turabian Style). 3.0 MAIN CONTENT 3.1 American Psychological Association (APA) Style This referencing style is the form commonly used in most journals and adopted by some institutions of higher learning. The APA style emphasizes the use of surname (last name) of the author, the year of publication and if need be the page number(s) of the material consulted within a text. Though, this style has evolved over time. It is currently on sixty APA. For instance, (Ohioze, 2016:09)… this happens when the name appears at the end of a quotation. The name, year and if possible the page number(s) are encircled in a bracket. But, if the name comes before a statement, it will be: Ohioze, W. F. (2016). In this case, only the year and probability the page number(s) will be bracketed. However, the ends of chapter or book references are specially done in the APA way. Let consider some instances: a. Ohioze, W. F. (2016). Population Growth, Conflicts and Food Production: Is Nigeria Food Secure? Journal of Review, 1, 100 – 110. b. Ohioze, W. F. (2016). Population Growth, Conflicts and Food Production: Is Nigeria Food Secure? Okpuje press. Note: A above represents APA style of referencing journal or periodical, while B is a

144
book reference. 3.2 Harvard Style (Name and Year) It is important to note that, the APA style of referencing modified the Harvard style. It was done to improve on the quality of Harvard referencing style. Before the modification, the order of author’s names in text citation was not accord the necessary recognition. For instance, the names of an author in citation could be mixed-up without identifying which was the surname. Besides, articles dates of publication were not that necessary then, compare to what was obtainable in APA style. This method (Harvard style) of referencing is about the inclusion of name(s) of author and the year publication in the text when citing any scholarly write-up, for example, “Ohioze (2016)”. Where a paper was co-authored by the individuals, for instance Ohioze and Grace, the citation will be, “Ohioze and Grace (2016)”. However, there are times articles have than two authors, maybe three, four or more, the citation take the form “Ohioze et al. (2016)”. In the reference section, all the authors who co-authored the paper shall appear separately in the List of References. 3.3 Chicago Style (Kate Turabian Style) Outside the first two styles that is APA and Harvard already discussed, the third in this category is the “Chicago Style”. It is also referred to as Kate Turabian Style. Kate Turabian is the name of the person that came up the idea of this referencing method. She came up with this form of citation to do away with the cumbersome nature inherent in footnotes. Kate therefore, suggested end of chapter referencing with the following modifications: i) That, every supporting statement and data should be numbered sequentially, ii) That, at the end of the chapter, all the numbered statements sequentially in the text, should be noted and the corresponding sources written. 1Ohioze, W. F. (2016). Population Growth, Conflicts and Food Production: Is Nigeria Food Secure? Journal of Review, 1, 100 – 110 2Ohioze, W. F., Grace, A. O. and Ohioze, G. A. (2016). Population Growth, Conflicts
and Food Production: Is Nigeria Food Secure? Okpuje press. 4.0 CONCLUSION After this unit, you have learnt the different types/list of references and the ideas behind them and their presentations. 5.0 SUMMARY In this unit, you have learnt about the three list/types of referencing. Also you have learnt what makes the referencing types unique on their own. 6.0 TUTOR-MARKED ASSIGNMENT 1. List three types of reference. 2. Explain how Chicago style of referencing is different from that of APA style. 7.0 REFERENCES/FURTHER READING Emeka, A. I. (2004). Basic Steps for quality research projects. Lagos: Noble-Alpha
International.

145
Miles, M. B. & Huberman, A. M. (1994). Qualitative Data Analysis: An Expanded Sourcebook. SAGE Publication. www.sagepub.com/sites. Accessed 20/06/2016.
Olorunnisola, A. O. (2003). Some Essentials of Scientific Research Planning and Execution.
Ibadan: Jimson Nigeria Enterprises. Olayinka, A. I & Owumi, B. E. (2006). Preparing a Research Proposal. In A. I. Olayinka, V.
O. Taiwo, A. Raji-Oyedele & I. P. Farai (Eds.), Methodology of Basic and Applied Research, pp. 53 – 81. Ibadan: The Postgraduate School University of Ibadan.
University of Wisconsin writing centre. http://www.uwstout.edu/writingcenter. Accessed
24/06/2016. USC libraries research guides “organizing your social sciences research paper: The literature
Review” www.libraries.usc.edu/researchguides/literaturereviews. Accessed 2/06/2016.


![sqrt(2x-10)+sqrt(3x+10)=sqrt(2x-17)+sqrRadical Equation ...jan.getko.sweb.cz/f6v/Symbolab.pdf · 311 + 3011 21 2111 2] 311 3011 Expand 311 + 311 + — ab + ac 210 ons: a. 311 30 -](https://static.fdocuments.us/doc/165x107/5f935ddb2ac6007d6d2672ec/sqrt2x-10sqrt3x10sqrt2x-17sqrradical-equation-jangetkoswebczf6v.jpg)