
ECCRRBB oMMaarrkke ett rMMonniittoorriinngg …ea599656-72de-4ca7-88c1... · Table 14 Electricity...
89
ECRB Market Monitoring Report 2015 Electricity and Gas Markets in the Energy Community – Contracting Parties & Georgia – Reporting Period 2014 Publication date April 2016
-
Upload
nguyenquynh -
Category
Documents
-
view
215 -
download
1
Transcript of ECCRRBB oMMaarrkke ett rMMonniittoorriinngg …ea599656-72de-4ca7-88c1... · Table 14 Electricity...
EECCRRBB MMaarrkkeett MMoonniittoorriinngg RReeppoorrtt 22001155
EElleeccttrriicciittyy aanndd GGaass MMaarrkkeettss iinn tthhee EEnneerrggyy CCoommmmuunniittyy
– Contracting Parties & Georgia –
Reporting Period 2014
Publication date April 2016

2
Content
INTRODUCTION ............................................................................................................................. 3
1. About ECRB ............................................................................................................................ 6
2. Background ............................................................................................................................. 6
3. Scope ...................................................................................................................................... 6
4. Methodology............................................................................................................................ 7
WHOLESALE MARKETS ............................................................................................................... 9
A. ELECTRICITY ........................................................................................................................ 9
1. Market Integration ................................................................................................................... 9
1.1. Price convergence .................................................................................................................. 9
1.2. Balancing .............................................................................................................................. 12
2. Market concentration ............................................................................................................ 14
3. Cross border trade - utilization of cross border capacity ...................................................... 19
B. GAS ..................................................................................................................................... 29
1. Wholesale gas market characteristics and prices................................................................. 29
2. Market dominance ................................................................................................................ 36
3. Transmission tariffs and network access regimes ................................................................ 37
4. Utilization of underground gas storage ................................................................................. 47
RETAIL MARKETS ....................................................................................................................... 49
A. ELECTRICITY ...................................................................................................................... 49
1. Electricity retail market characteristics .................................................................................. 49
2. Switching behavior ................................................................................................................ 54
3. End- user electricity prices .................................................................................................... 57
4. Regulation of electricity end-user prices ............................................................................... 63
B. GAS ..................................................................................................................................... 65
1. Gas retail market characteristics........................................................................................... 65
2. Switching behavior ................................................................................................................ 69
3. End-user gas prices .............................................................................................................. 70
4. End- user gas price regulation .............................................................................................. 73
CONSUMER PROTECTION AND CUSTOMER EMPOWERMENT ............................................ 76
1. Background ........................................................................................................................... 76
2. Supplier of last resort and disconnections ............................................................................ 76
3. Vulnerable customers ........................................................................................................... 80
4. Customer information ............................................................................................................ 83
5. Customer complaints ............................................................................................................ 88

3
List of figures
Figure 1: Evolution of wholesale electricity prices of Contracting Parties – 2010-2014 (Euros/MWh) ...... 9 Figure 2: Wholesale electricity price differential in Contracting Parties 2010-2014 (Euros/MWh) ........... 10 Figure 3: Price convergence between Bosnia and Herzegovina and Montenegro compared to D-1 commercial nominations from Bosnia and Herzegovina to Montenegro – 2013-2014 (MWh and Euro/MWh) .............................................................................................................................................. 11 Figure 4: Price convergence between Ukraine and Moldova compared to D-1 commercial nominations from Ukraine to Moldova – 2013-2014 (MWh and Euro/MWh) ............................................................... 11 Figure 5: Evolution of balancing electricity prices in Contracting Parties – 2013-2014 (Euros/MWh) .... 12 Figure 6: Balancing electricity price differential in Contracting Parties 2013-2014 (Euros/MWh) ............ 13 Figure 7: Electricity load and consumption characteristics in Contracting Parties – 2010-2014 (MW and MWh) ...................................................................................................................................................... 14 Figure 8: Evolution in numbers of electricity market participants in Contracting Parties – 2010-2014 .... 14 Figure 9: Market share of largest power generating company in Contracting Parties and Georgia – 2014 (%) .......................................................................................................................................................... 17 Figure 10: Herfindahl-Hirschman Index (electricity) - 2014 ..................................................................... 18 Figure 11: Electricity traded through bilateral contracts as a percentage of the amount of total consumption in Contracting Parties 2010-2014 (MWh, %) ...................................................................... 19 Figure 12: Evolution of the quarterly level of commercial use of electricity interconnections (day-ahead) as a percentage of NTC values – 2012-2014 (%) ................................................................................... 21 Figure 13: Percentage of NTC used in the “right direction” in the presence of significant price differentials - Bosnia and Herzegovina, Moldova, Montenegro and Ukraine borders – 2012-2014 (%) .. 22 Figure 14: Percentage of months in a year with net day-ahead nominations against price differentials per border – 2012-2014 (%) .......................................................................................................................... 22 Figure 15: Volumes of net D-1 commercial nominations against price differentials per border – 2012-2014 (MWh) ............................................................................................................................................ 23 Figure 16: Month-ahead cross-border electricity transmission capacity allocation as a percentage of declared NTC – 2012-2014 ..................................................................................................................... 23 Figure 17: Level of electricity intraday cross-border trade: absolute sum of net intraday nominations for a selection of Contracting Parties– 2012-2014 (MWh) ............................................................................... 25 Figure 18: Level of electricity day ahead cross-border trade: absolute sum of net day-ahead nominations for a selection of Contracting Parties– 2012-2014 (MWh)....................................................................... 25 Figure 19: Evolution of annual level (average values) of commercial use of electricity interconnections (day-ahead and intraday) as a percentage of NTC values for Contracting Parties' borders – 2012-2014 (%) .......................................................................................................................................................... 26 Figure 20: Total amount of electricity balancing energy contracted abroad by Serbia, FYR of Macedonia and Montenegro – 2010-2014 (MWh) ..................................................................................................... 26 Figure 21: Electricity balancing energy activated abroad as a percentage of the amount of total balancing energy activated in national balancing markets of Serbia and Montenegro 2013-2014 (%) ... 27 Figure 22: Electricity - congestion revenues (Euros) – 2012-2014 .......................................................... 27 Figure 23: Curtailed capacities and number of curtailment cases per year - 2012-2014 ........................ 28 Figure 24: Gross inland gas consumption (in TWh/year) ........................................................................ 29 Figure 25: Gross inland gas consumption without Ukraine (in TWh/year)............................................... 30 Figure 26: Gas consumption growth rates 2014/2013 ............................................................................ 30 Figure 27: Gas wholesale prices in 2013 (in EUR/MWh) ........................................................................ 31 Figure 28: Gas wholesale prices in 2014 (in MWh) ................................................................................. 32 Figure 29: Average gas wholesale price (in EUR/MWh) ......................................................................... 32 Figure 30: Average yearly price of gas at the border of importing countries (in EUR/MWh) ................... 33 Figure 31 Estimated border prices of gas imported from Russia, hub and LNG prices in selected EnC CPs and EU MSs in 2014 ....................................................................................................................... 34 Figure 32 Monthly gas demand in comparison to storage withdrawals in Ukraine ................................. 47 Figure 33 Monthly gas demand in comparison to storage withdrawals in Serbia ................................... 48 Figure 34 Total electricity sale to final customers in GWh 2011-2014 ................................................... 49 Figure 35 Total electricity sale to final customers in GWh 2011-2014 (excluding Ukraine) .................... 50 Figure 36 Electricity demand growth rate 2013 to 2014 .......................................................................... 50 Figure 37 Are electricity TSO networks used by more than one supplier? .............................................. 52 Figure 38 Are electricity DSO networks used by more than one supplier? ............................................. 52 Figure 39 Electricity prices for households in second semester of 2014, EUROSTAT Band DC: 2500kWh < consumption < 5000 kWh (EUR cent/kWh) ......................................................................... 58

4
Figure 40 Structure of household electricity prices (Band DC: 2500kWh < consumption < 5000 kWh (EUR cent/kWh) ...................................................................................................................................... 59 Figure 41 Electricity prices for industry in second semester of 2014, EUROSTAT Band IC: 500MWh < consumption < 2000 MWh (EUR cent/kWh) ........................................................................................... 61 Figure 42 Comparison of end- user electricity prices for households (Band DC) and industry (Band IC)- second semester of 2014 (EUR cent/kWh) ............................................................................................. 61 Figure 43 Structure of industry electricity prices (Band IC: 500MWh < consumption < 2000 MWh (EUR cent/kWh)) ............................................................................................................................................... 62 Figure 44 Total sale to final gas customers in GWh ............................................................................... 65 Figure 45 Total sale to final gas customers in GWh (excluding Ukraine) ............................................... 66 Figure 46 Growth rates of gas demand 2013 to 2014 ............................................................................. 66 Figure 47 Average annual gas consumption per household in kWh ...................................................... 67 Figure 48 Gas prices for households, EUROSTAT Band D2: 20GJ < consumption < 200 GJ (EUR cent/kWh) ................................................................................................................................................ 71 Figure 49 Gas prices for industry, EUROSTAT Band I3: 10 000 GJ < consumption < 100 000 GJ (EUR cent/kWh) ................................................................................................................................................ 72 Figure 50 Comparison of end- user gas prices for households (Band D2) and industry (Band I3)- second semester of 2013 (EUR cent/kWh) ......................................................................................................... 73 Figure 51 Share of household disconnections due to non-payment in % of household metering points- electricity- 2014 ....................................................................................................................................... 79 Figure 52 Share of vulnerable customers in the Contracting Parties (in % of household metering points, status on 31
st December 2014) ............................................................................................................... 83
Figure 53 Minimal number of days in advance that household consumers are informed about energy price changes .......................................................................................................................................... 84 Figure 54 Information on electricity bills- 2014 (number of jurisdictions) ................................................. 85 Figure 55 Share of households with electricity smart meters (in %), status 31.12.2014. ........................ 87 Figure 56 Processing time set for service providers to deal with complaints related to electricity bills and time service providers usually need for processing these complaints ..................................................... 89 Figure 57 Processing time set for service providers to deal with complaints related to electricity connections and time service providers usually need for processing these complaints .......................... 89
List of tables
Table 1: Data sources related to wholesale electricity market analysis .................................................... 7 Table 2: List of wholesale electricity market indicators ............................................................................. 8 Table 3: Estimated wholesale gas level of gross welfare losses per EnC CP average household in 2014 ................................................................................................................................................................ 35 Table 4 HHI for wholesale gas markets in the Contracting Parties and Georgia, calculated for shares in 2014 ........................................................................................................................................................ 36 Table 5 Dominance of wholesale supply companies in gas markets of the Contracting Parties and Georgia in 2014 ...................................................................................................................................... 37 Table 6 Average yearly gas transmission tariffs in 2014 (in EUR/GWh) ................................................. 38 Table 7 Principles of gas transmission tariffs calculation in the Contracting Parties and Georgia .......... 39 Table 8 Gas cross- border capacity utilization in the Contracting Parties and Georgia in 2014 .............. 41 Table 9 Number of active suppliers in retail electricity markets in 2014 .................................................. 51 Table 10 Electricity retail market concentration and market opening in 2014 ......................................... 54 Table 11 Annual switching rates in electricity markets in 2014 (in %) ..................................................... 55 Table 12 Electricity prices for households in second semester of 2014, EUROSTAT Band DC: 2500kWh < consumption < 5000 kWh (EUR cent/kWh) .......................................................................................... 57 Table 13 Breakdown of household electricity prices into their main components (Band DC: 2500kWh < consumption < 5000 kWh (EUR cent/kWh) ............................................................................................. 59 Table 14 Electricity prices for industry in second semester of 2014, EUROSTAT Band IC: 500MWh < consumption < 2000 MWh (EUR cent/kWh) ........................................................................................... 60 Table 15 Breakdown of industry electricity prices into their main components (Band IC: 500MWh < consumption < 2000 MWh (EUR cent/kWh)) .......................................................................................... 62 Table 16 Number of non- households supplied at non-regulated electricity prices in 2014 .................... 63 Table 17 Number of active gas suppliers in 2014 ................................................................................... 68 Table 18 Retail gas market concentration in 2014 .................................................................................. 69 Table 19 Gas prices for households, EUROSTAT Band D2: 20GJ < consumption < 200 GJ (EUR cent/kWh) ................................................................................................................................................ 70

5
Table 20 Gas prices for industry, EUROSTAT Band I3: 10 000 GJ < consumption < 100 000 GJ (EUR cent/kWh) ................................................................................................................................................ 72 Table 21 Number of non- households supplied at non-regulated gas prices .......................................... 74 Table 22 Functions of the supplier of last resort in the Energy Community – 2014 ................................ 77 Table 23 Minimum duration of disconnection process for non-paying consumers across Energy Community Contracting Parties and Georgia .......................................................................................... 78 Table 24 Measures to protect vulnerable customers in the Contracting Parties and Georgia - 2014 ...... 81 Table 25 Number of household customer complaints received by different companies/institutions, for both electricity and gas- 2014 ................................................................................................................. 88

6
INTRODUCTION
1. About ECRB
The Energy Community Regulatory Board (ECRB) operates based on the Energy Community
Treaty. As an institution of the Energy Community1 the ECRB advises the Energy Community
Ministerial Council and Permanent High Level Group on details of statutory, technical and
regulatory rules and makes recommendations in the case of cross-border disputes between
regulators.2
2. Background
Market monitoring is a core element of regulatory responsibilities. Only in-depth knowledge of
market performance, stakeholder activities and development trends allow regulators to create
an effective market framework that balances the needs of market players and is able to
promote competition, customer protection, energy efficiency, investments and security of
supply at the same time. The relevance of regulatory market monitoring is not only recognized
by the Energy Community acquis communautaire but is also since years a central ECRB
activity.
Based on a workshop held in 2014 with the support of the Agency for the Cooperation of
Energy Regulators (ACER), ECRB decided to prepare a Market Monitoring Report that
assesses the gas and electricity markets in the Energy Community Contracting Parties (CPs)
and Georgia, mirroring the related activity of ACER,.
3. Scope
The present report covers the Energy Community Contracting Parties Albania, Bosnia and
Herzegovina, FYR of Macedonia, Kosovo*, Moldova3, Montenegro, Serbia and Ukraine
4
as well as the Observer Country Georgia. It describes the status quo of electricity and gas
markets both on retail and wholesale level with the aim to identify potential barriers and
discuss recommendations on potential improvements. Data presented in this report refers to
the year 2014.
1 www.energy-community.org. The Energy Community comprises the EU and Albania, Bosnia and Herzegovina,
Macedonia, Kosovo*, Moldova, Montenegro, Serbia and Ukraine. Armenia, Georgia, Turkey and Norway are Observer Countries. [*Throughout this document the symbol * refers to the following statement: This designation is without prejudice to positions on status, and is in line with UNSCR 1244 and the ICJ Opinion on the Kosovo declaration of independence]. 2 For more information about ECRB consult www.energy-community.org – about us – institutions – regulatory board.
3 Only for gas wholesale markets.
4 Excluding Crimea.

7
4. Methodology
Data and analysis provided in this report is based on information provided by the regulatory
authorities of the analyzed markets, data collected from ENTSO-E5 and the SEE CAO
6
databases about country profiles, cross-border capacity calculation and allocations volumes
as well as on the EUROSTAT database on energy prices. Where information origins from the
2014 Annual Implementation Report of the Energy Community Secretariat7, this is explicitly
mentioned in the text.
Indicators used for the presented assessments orientate on those used for the 2012 and 2013
ACER/CEER Annual Report on the Results of Monitoring the Internal Electricity and Natural
Gas Markets adjusted to data availability and market development in the analyzed markets.
Table 1: Data sources related to wholesale electricity market analysis
Type of
source8
Source Data items
Made
available
through
Format
98% NRAs • Detailed data on wholesale markets and Cross Border electricity trade through data collection forms
• Contribution to data checks
Bilateral E-mail exchange
XLS
1% ENTSO-E • Generation, demand/load data
• Limited contribution to data checks
Website XLS
1% SEE CAO • Auction results
• Limited contribution to data checks
Website PDF/XLS
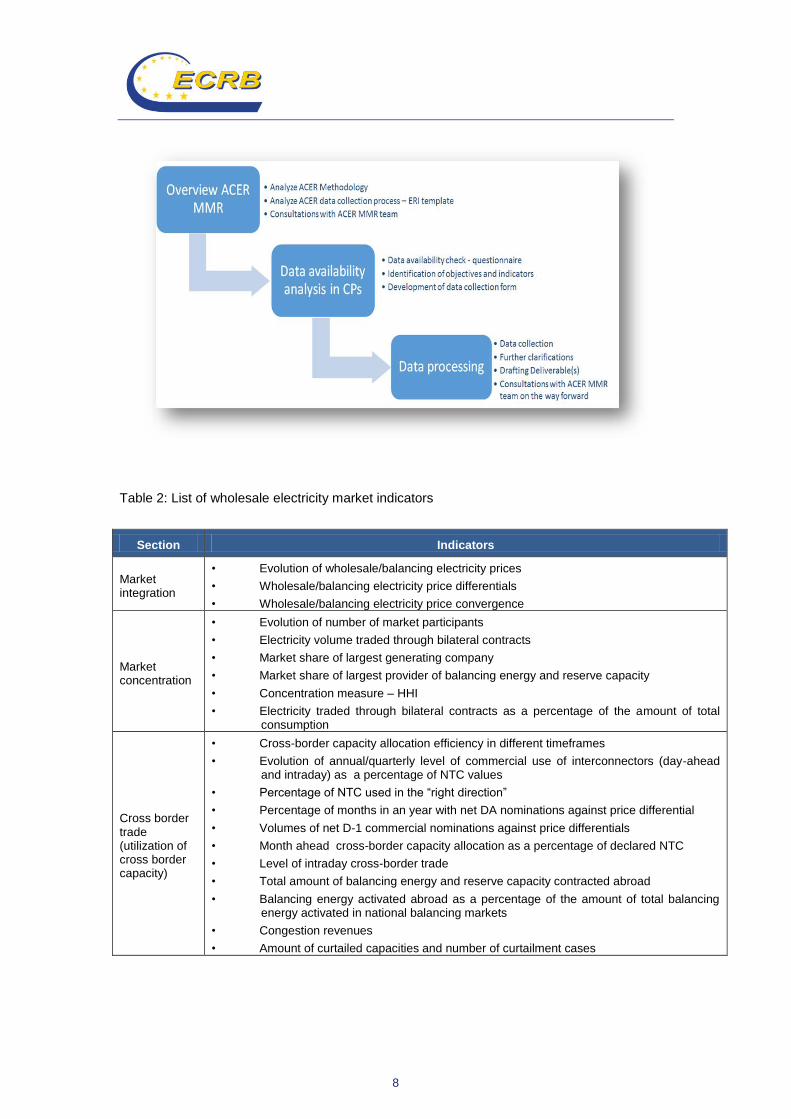
The process description of how the analysis was developed is presented below.
5 www.entsoe.eu.
6 www.seecao.com.
7 http://www.energy-community.org/pls/portal/docs/3356393.PDF.
8 Percentage of data acquisition only represents rough indications of used data sources.
8
Table 2: List of wholesale electricity market indicators
Section Indicators
Market integration
• Evolution of wholesale/balancing electricity prices
• Wholesale/balancing electricity price differentials
• Wholesale/balancing electricity price convergence
Market concentration
• Evolution of number of market participants
• Electricity volume traded through bilateral contracts
• Market share of largest generating company
• Market share of largest provider of balancing energy and reserve capacity
• Concentration measure – HHI
• Electricity traded through bilateral contracts as a percentage of the amount of total consumption
Cross border trade (utilization of cross border capacity)
• Cross-border capacity allocation efficiency in different timeframes
• Evolution of annual/quarterly level of commercial use of interconnectors (day-ahead and intraday) as a percentage of NTC values
• Percentage of NTC used in the “right direction”
• Percentage of months in an year with net DA nominations against price differential
• Volumes of net D-1 commercial nominations against price differentials
• Month ahead cross-border capacity allocation as a percentage of declared NTC
• Level of intraday cross-border trade
• Total amount of balancing energy and reserve capacity contracted abroad
• Balancing energy activated abroad as a percentage of the amount of total balancing energy activated in national balancing markets
• Congestion revenues
• Amount of curtailed capacities and number of curtailment cases

9
WHOLESALE MARKETS
A. ELECTRICITY
This section reports on key developments in electricity wholesale markets, including an
assessment of the level of wholesale market integration and its benefits.
1. Market Integration
1.1. Price convergence
Figure 1 presents recent trends for wholesale electricity prices in the Contracting Parties. In
2012 a significant price hike was observed in Ukraine and Moldova9. In 2014 wholesale
electricity prices decreased in Ukraine and Bosnia and Herzegovina while in other Contracting
Parties the price level remained at the same level. The price difference between Ukraine /
Moldova and other Contracting Parties is still significant.
Figure 1: Evolution of wholesale electricity prices of Contracting Parties – 2010-2014
(Euros/MWh10
)
9 Wholesale price increase in Moldova was due to import price increase from Ukraine (Moldova being dependent on
Ukraine imports). Explanations for the price hike in Ukraine were not provided. 10
Mega Watt Hour.

10
Wholesale price convergence and price differential are indicators for market integration, even
though an optimal level of market integration does not necessarily require full price
convergence. The figures below provide an overview of the convergence of monthly average
wholesale electricity prices in the Contracting Parties over the last years11
. According to
Figure 2, the price differential increased in 2012 as prices had significantly increased in
Ukraine and Moldova. Despite a general downwards trend since 2012, price differentials
still remain significant. According to the data analysed, the lowest wholesale prices exist in
Kosovo, the highest in Moldova. Wholesale price convergence in recent years increased
between Bosnia and Herzegovina, FYR of Macedonia and Montenegro in 2014. Another
important element explaining the persistence of only limited price convergence is still the very
extensive level of price regulation and cross-subsidisation within Contracting Parties as well
as the lack of a reference price for electricity in the Region which both hinder formation of
competitive wholesale prices.
Figure 2: Wholesale electricity price differential in Contracting Parties 2010-2014
(Euros/MWh)
The figures below show the correlation between available export capacities from Bosnia and
Herzegovina to Montenegro and from Ukraine to Moldova as well as the level of monthly price
convergence in the respective Contracting Parties. Highlighted areas show interesting
example of correlation between the indicators. As commercial nominations decrease
wholesale price differential increases. This example shows the impact of market integration
on price convergence.
11 Price differentials are calculated as the difference between the maximum and minimum wholesale prices of the
assessed Contracting Parties during a specific month within a year. Only a month with maximum differential is selected.

11
Figure 3: Price convergence between Bosnia and Herzegovina and Montenegro compared to D-1 commercial nominations from Bosnia and Herzegovina to Montenegro – 2013-2014 (MWh and Euro/MWh)
Figure 4: Price convergence between Ukraine and Moldova compared to D-1 commercial
nominations from Ukraine to Moldova – 2013-2014 (MWh and Euro/MWh)

12
In this context, it is worth mentioning the unique situation of the Moldavian electricity market
with only few participants and limited electricity supply options making price convergence
more sensitive to interconnector capacity utilization.
1.2. Balancing
Electricity system balancing includes all actions and processes performed by a Transmission
System Operator (TSO) in order to ensure that the total electricity withdrawals12
equal the
total injections in a control area at any given moment. Among other elements, adequate
imbalance settlement and cross-border balancing exchanges are key elements for ensuring
that systems are balanced in the most efficient way. An integrated cross-border balancing
market aims at maximizing the efficiency of balancing by using the most efficient balancing
resources. The following figures show the level of balancing market integration in the
Contracting Parties and Georgia.
Balancing electricity price levels and their convergence can be treated as an indicator of
regional balancing cooperation. Figure 5 provides an overview of the development of
balancing energy prices over the last years.
Figure 5: Evolution of balancing electricity prices in Contracting Parties – 2013-2014 (Euros/MWh)
The balancing energy price increase in FYR Macedonia coincided with the increase of
average prices paid for contracted balancing reserve capacity. The regulatory authority of
12 Including losses; it is to be noted that losses are normally not part of balancing but balanced out before.

13
FYR of Macedonia in yearly price decisions approves prices for balancing capacity provided
by the national generation company (ELEM) that is obliged to meet public services obligation
and system services for the TSO. The main reason for the increase of balancing
energy/capacity prices were an increase of fixed costs of ELEM for system services in recent
years.
Figure 6 shows the quarterly average price differences between highest and lowest balancing
prices in the Contracting Parties. Big differences indicate low balancing market cooperation
between countries. Substantial price differences are caused by high balancing energy prices
in Bosnia and Herzegovina13.
Figure 6: Balancing electricity price differential in Contracting Parties 2013-2014 (Euros/MWh)
One of the main explanations for the price differentials is also that there is no separate
procurement of balancing reserves and energy in the analysed countries, except Bosnia and
Herzegovina. Consequently low balancing energy prices most probably result from either
cross-subsidizing of the energy component through reserve payment or price regulation. Only
the separate procurement of both elements in a competitive market can lead to competitive
prices for both services.
13 Data about the market share of the largest provider of balancing energy is not available for Bosnia and
Herzegovina; therefore, no in-depth analysis on the correlation between high balancing prices and market concentration could be performed for the purpose of the present report. It is worth mentioning that Bosnia and Herzegovina does not carry out balancing energy/capacity contracting abroad.

14
2. Market concentration
Gross electricity consumption in the Energy Community Contracting Parties decreased
on average from 2011 to 2014 by almost 6%, except Moldova. Reasons for such decrease
may differ among countries14
also following the general trend on EU level. The figures below
present aggregate consumption and load characteristics together with the evolution of market
participants in the EnC Contracting Parties.
Figure 7: Electricity load and consumption characteristics in Contracting Parties15
– 2010-2014 (MW and MWh)
Figure 8 and table 3 provide an overview of the market participants. A constant increase of
market participants is observed in all markets. In 2014, a rapid increase of eligible
consumers was caused by partial market opening in FYR of Macedonia and increase of
eligible market participants in Ukraine.
Figure 8: Evolution in numbers of electricity market participants in Contracting Parties16
–
2010-2014
14 Detailed related analysis for the individual assessed markets was not performed for the purpose of this report.
15 Albania, Bosnia and Herzegovina, FYR Macedonia, Kosovo*, Moldova, Montenegro, Serbia and Ukraine.
16 Albania, Bosnia and Herzegovina, FYR Macedonia, Kosovo*, Montenegro, Montenegro, Serbia and Ukraine.

15
Table 3: Electricity market participants in Contracting Parties and Georgia – overview
2010 2011 2012 2013 2014
Albania
Generator 0 1 2 6 7
Supplier 1 9 10 15 14
Trader (other than supplier) 1 9 10 17 20
Eligible consumer 0 1 8 8 9
Bosnia and Herzegovina
Generator 3 3 3 3 3
Supplier 3 3 3 3 3
Trader (other than supplier) 10 10 11 15 15
Eligible consumer 2 0 1 1 2

16
2010 2011 2012 2013 2014
Georgia
Generator 56 56 57 61 67
Supplier 3 3 3 3 3
Trader (other than supplier)17
NAP18
NAP NAP NAP NAP
Eligible consumer 10 9 7 7 8
Kosovo*
Generator (>1MW) 5 5 5 6 6
Supplier 1 1 1 1 1
Trader (other than supplier) 18 14 12 7 4
Eligible consumer - - - - -
FYR of
Macedonia19
Generator 1 1 3 3 3
Supplier 2 2 2 2 7
Trader (other than supplier) 9 7 4 8 17
Eligible consumer 9 9 9 9 234
Moldova
Generator 4 4 4 4 4
Supplier20
1 1 1 1 1
Trader (other than supplier) N/A N/A N/A N/A N/A
Eligible consumer 4 4 4 4 4
Montenegro
Generator 1 1 1 1 2
Supplier 2 2 2 2 2
Trader (other than supplier) 0 0 0 0 0
Eligible consumer 0 0 0 0 0
Ukraine
Generator 71 95 120 146 161
Supplier 110 121 128 127 133
Trader (other than supplier) NAP NAP NAP NAP NAP
Eligible consumer N/A N/A N/A N/A N/A
It is important to check the market share of the largest players in the industry. Figures 9 and
10 characterize the level of electricity production/reserve capacity market concentration in the
Contracting Parties. Although a common academic standard on which percentage of a market
share indicates a concentrated industry does not exist, general observation consider values
higher than 20% a concern for the competition level. A value of > 40% may suggest a
dominant position on the market. A value of > 50% can be understood as dominant position
on market.21
17 In Georgia distribution licensees (exists 3 distribution licensees) are the only supplier within their area. According to
the secondary legislation small power plants are also authorized to supply electricity to retail consumers but in practice it doesn’t work. 18
Not applicable. 19
Only shows active market participants in FYR of Macedonia. 20
Holder of license for electricity supply other than non-regulated tariffs. 21
Introduction to electricity markets, textbook developed by ERRA, 2008.

17
The market share of the largest generating company varies among the Contracting
Parties, while the reserve capacity market is dominated by one balancing
energy/capacity provider.
- According to the results, electricity markets in Montenegro, Kosovo*, Moldova and
FYR Macedonia are dominated by one large generating company22
.
- As regards balancing energy and reserve capacity for all types of reserve, mostly only
one provider in the market was reported by parties.
Figure 9: Market share of largest power generating company in Contracting Parties and Georgia – 2014 (%)
23
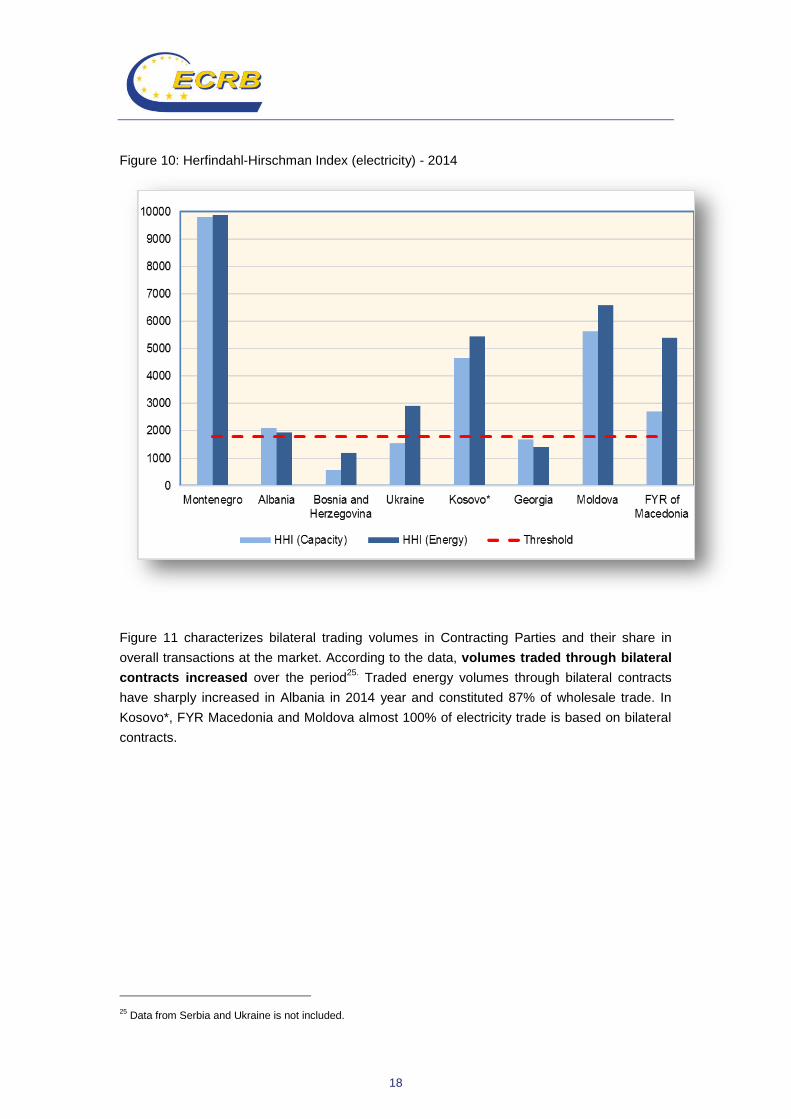
Market concentration is one of the elements for assessing the performance of wholesale
markets. The Herfindahl-Hirschman (HHI) index is more responsive to outstanding values
than the simple market share figure above and its value ranges between 0 and 10,000. The
usual trigger levels for the index are as follows: HHI≤1000 – not concentrated;
1000<HHI≤1800 - moderately concentrated; 1800<HHI – concentrated24
. HHI is calculated as
sum of squared market shares (in %) of all generating companies supplying a market for both
– energy and capacity.
.
22 Annual production of the largest generator is compared to the gross production (import is not taken into account).
23 Data for Serbia not available.
24 Introduction to electricity markets, textbook developed by ERRA, 2008.
18
Figure 10: Herfindahl-Hirschman Index (electricity) - 2014
Figure 11 characterizes bilateral trading volumes in Contracting Parties and their share in
overall transactions at the market. According to the data, volumes traded through bilateral
contracts increased over the period25.
Traded energy volumes through bilateral contracts
have sharply increased in Albania in 2014 year and constituted 87% of wholesale trade. In
Kosovo*, FYR Macedonia and Moldova almost 100% of electricity trade is based on bilateral
contracts.
25 Data from Serbia and Ukraine is not included.

19
Figure 11: Electricity traded through bilateral contracts as a percentage of the amount of total
consumption in Contracting Parties 2010-2014 (MWh, %)
3. Cross border trade - utilization of cross border capacity
In order to achieve an efficient exchange of cross-border and balancing services, common
standard products must be defined by TSOs and an adequate level of harmonization of core
aspects of cross border capacities and balancing mechanisms should be defined. This would
allow those products to achieve sufficient liquidity and adequate competition in the markets
where they are traded. Coordinated allocation of cross-border capacities is one of the
cornerstones for starting to harmonise market participation requirements in order to integrate
national markets while aiming to reduce transaction costs, increase competition and
transparency. It is important to analyze to which extent Contracting Parties are using
harmonized methods or timeframes for cross-border transfer capacity calculation/allocation
and to what extent the total transfer capability is utilized during commercial cross-border
trade. In the following table the Contracting Parties’ cross-border capacity calculation
methods and timeframes are summarized.

20
Table 4: Cross-border capacity calculation methods in electricity
Contracting Party
Frequency of capacity
calculation
Capacity calculation methods
Limitation of cross-border
capacity
TTC with neighbouring CPs
(MW)
Bosnia and Herzegovina
Month ahead Fully coordinated
NTC26
No 4400
Montenegro Year ahead, Month
ahead and day ahead
Fully coordinated NTC
No 4810
Serbia Year ahead
Month ahead
Fully coordinated NTC
monthly NTC is calculated in order to
solve congestion inside TSO control area
4822/540127
Ukraine
Capacity is calculated for year ahead (month ahead and day-ahead in case of unscheduled
change of network)
Pure bilateral NTC No
-
FYR Macedonia
year ahead, month ahead, week ahead,
day-ahead
Fully coordinated NTC
- 5425
The following figures provide an update on the use of existing cross-border transmission
capacity for several timeframes and thereby present the level of commercial use of
interconnections. Figure 12 shows the evolution of the commercial use of cross-border
capacities at the day-ahead timeframe (for both directions on each border) over the last 12
quarters28
. According to this figure, the use of cross border capacity has slightly
increased. This could be due to a combination of reasons but it does not necessarily imply an
efficiency increase in cross-border capacity utilization as it also includes cross-border power
flows against price differentials. Nevertheless, it highlights the increasing importance of
closer to real-time trade, a trend that was already observed in the Energy Community’s
more developed electricity markets.
26 Net Transfer Capacity, ie transmission capacity for import and export across borders which can be safely made
available. 27
Two values refer to summer/winter limits. 28
The percentages of use of the interconnections are calculated for every border and direction as follows: all the hourly D-1 net nominations (which usually include the sum of nominations coming from day-ahead trade and long-term trade) are added and divided by the total amount of capacity offered to the market (NTC). The results are shown in aggregated form for all borders. The used methodology differs from the one used by ACER in its Market Monitoring Reports to the extent that ACER computes both directions of an interconnector, so in practice the maximum possible use would be only around 50%. According to the method used in the present report, calculation of capacity usage based on one average NTC was adopted due to lack of data for CPs compared to data availability for ACER´s methodology. For the methodology used in the present 100% use of the capacity would be possible as calculation assumption

21
Figure 12: Evolution of the quarterly level of commercial use of electricity interconnections
(day-ahead) as a percentage of NTC values – 2012-2014 (%)29
Price coupling eliminates “wrong way”30
flows and hence improves the use of cross-border
capacities for trade. In the Contracting Parties market coupling has not been implemented
yet, hence when prices diverge across a border, the full utilization of the cross-border
capacity in the “right direction” is essential for achieving efficient use of an interconnector. The
graph below shows a slightly declining trend of this indicator over the recent years for the
selected parties.
29 Data from Albania, Kosovo*, FYR Macedonia and Moldova is not included.
30 A “wrong-way flow” means the case where the final net nomination on a given border takes place from the higher
to the lower price zone.

22
Figure 13: Percentage of NTC used in the “right direction” in the presence of significant price differentials - Bosnia and Herzegovina, Moldova, Montenegro and Ukraine borders – 2012-2014 (%)
Figures 14 and 15 show the evolution of “wrong way” flows across the selected Contracting
Parties’ borders that are used to describe utilization efficiency of cross-border transfer
capacities. Despite the fact that this tendency has decreased significantly over years, it is
still present at the Ukraine-Moldova border. “Wrong flows” on the Ukraine-Moldova border are
due to the dependence of the Moldavian power system on electricity imports and partially also
due to the absence of harmonized cross-border capacity allocation instruments.
Figure 14: Percentage of months in a year with net day-ahead nominations against price differentials per border – 2012-2014 (%)
23
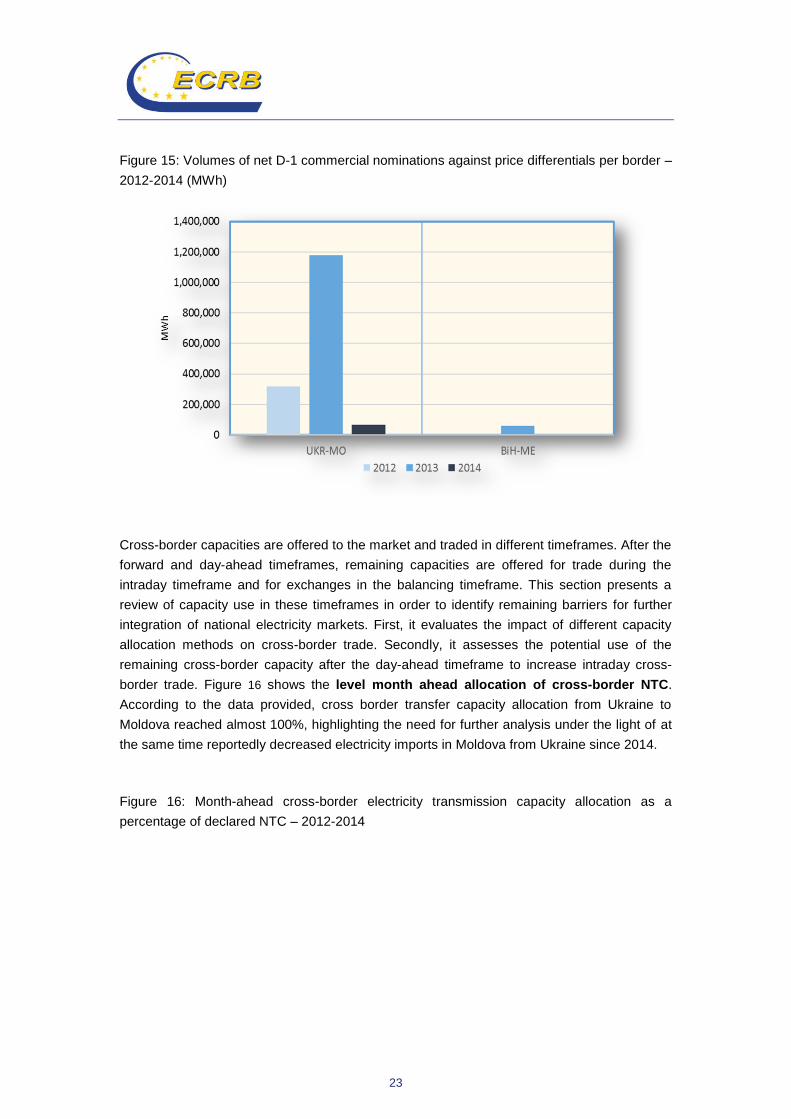
Figure 15: Volumes of net D-1 commercial nominations against price differentials per border –
2012-2014 (MWh)
Cross-border capacities are offered to the market and traded in different timeframes. After the
forward and day-ahead timeframes, remaining capacities are offered for trade during the
intraday timeframe and for exchanges in the balancing timeframe. This section presents a
review of capacity use in these timeframes in order to identify remaining barriers for further
integration of national electricity markets. First, it evaluates the impact of different capacity
allocation methods on cross-border trade. Secondly, it assesses the potential use of the
remaining cross-border capacity after the day-ahead timeframe to increase intraday cross-
border trade. Figure 16 shows the level month ahead allocation of cross-border NTC.
According to the data provided, cross border transfer capacity allocation from Ukraine to
Moldova reached almost 100%, highlighting the need for further analysis under the light of at
the same time reportedly decreased electricity imports in Moldova from Ukraine since 2014.
Figure 16: Month-ahead cross-border electricity transmission capacity allocation as a
percentage of declared NTC – 2012-2014

24
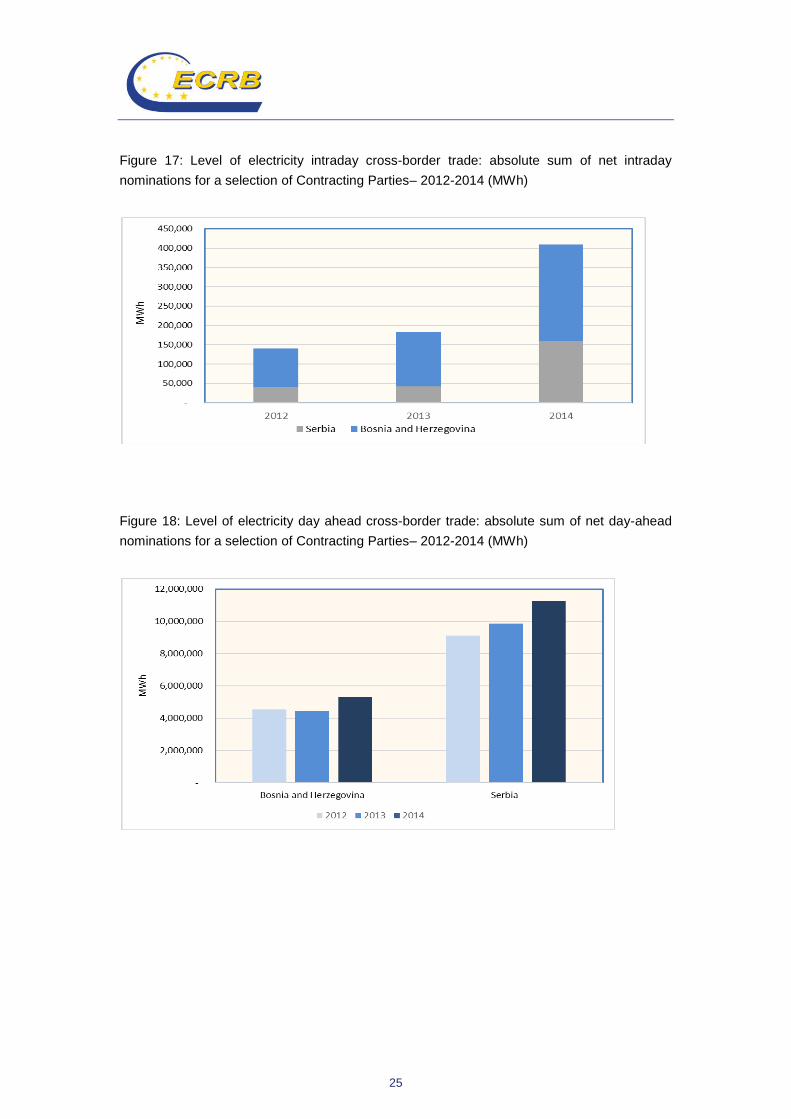
The level of liquidity in intraday trade is a key element in achieving well-functioning intraday
markets and efficient cross-border intraday trading. Figures 17 and 18 show the day-ahead
and intraday cross border trade level for Serbia and Bosnia and Herzegovina. According to
the figures, low utilization levels of intraday cross border capacities compared to the
day-ahead timeframe are obvious, despite increasing volumes at intraday timeframes.
Increasing intraday trade is also essential for the development of intermittent power sources
in order to incentivize them in the same way as conventional generation to reduce their
imbalances.
25
Figure 17: Level of electricity intraday cross-border trade: absolute sum of net intraday
nominations for a selection of Contracting Parties– 2012-2014 (MWh)
Figure 18: Level of electricity day ahead cross-border trade: absolute sum of net day-ahead
nominations for a selection of Contracting Parties– 2012-2014 (MWh)
26
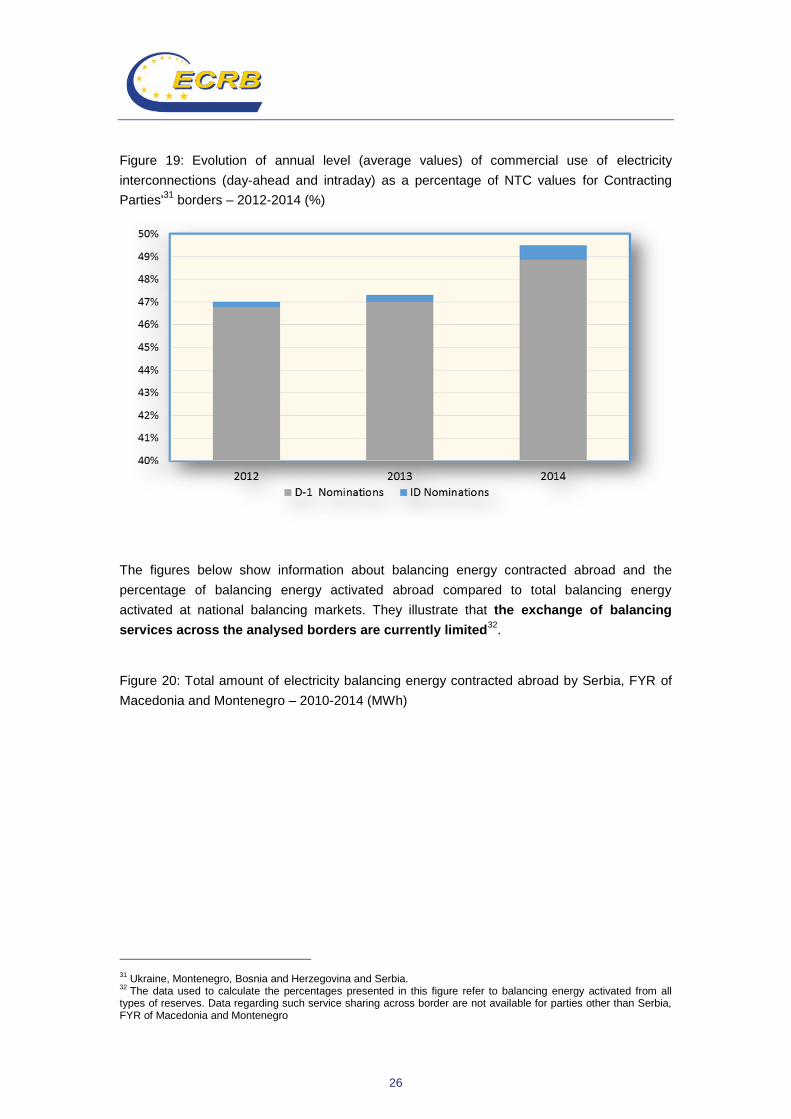
Figure 19: Evolution of annual level (average values) of commercial use of electricity
interconnections (day-ahead and intraday) as a percentage of NTC values for Contracting
Parties'31
borders – 2012-2014 (%)
The figures below show information about balancing energy contracted abroad and the
percentage of balancing energy activated abroad compared to total balancing energy
activated at national balancing markets. They illustrate that the exchange of balancing
services across the analysed borders are currently limited32
.
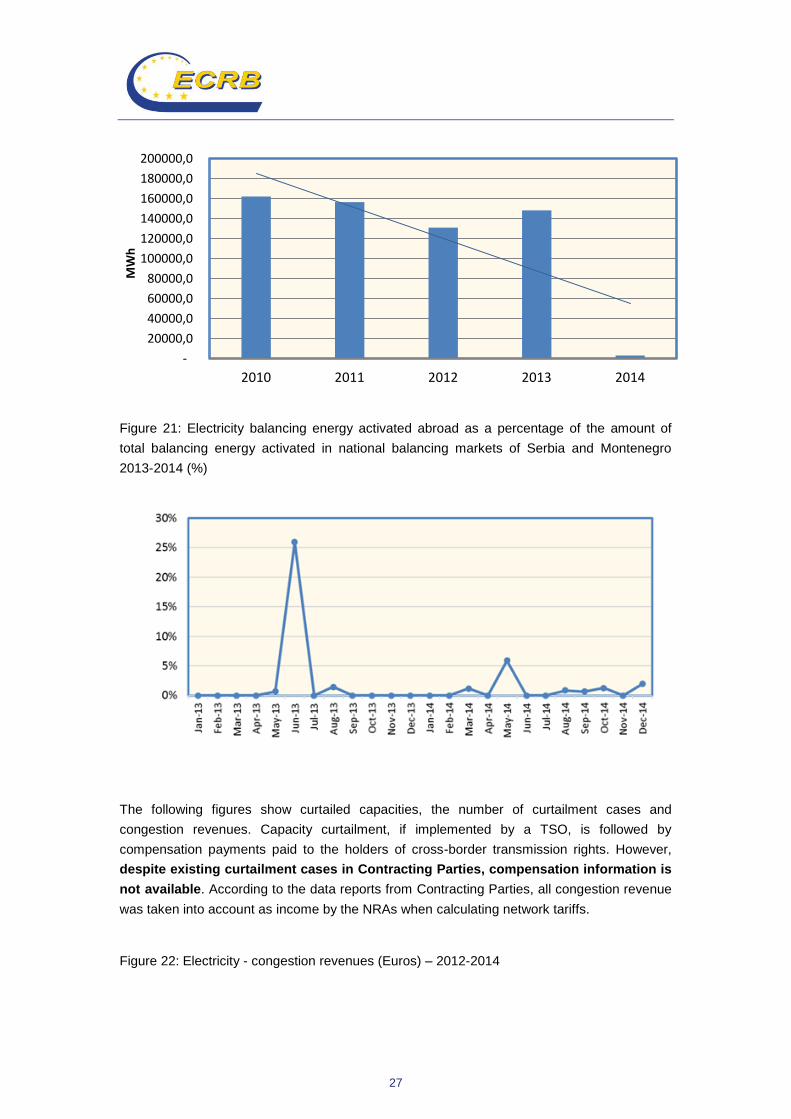
Figure 20: Total amount of electricity balancing energy contracted abroad by Serbia, FYR of
Macedonia and Montenegro – 2010-2014 (MWh)
31 Ukraine, Montenegro, Bosnia and Herzegovina and Serbia.
32 The data used to calculate the percentages presented in this figure refer to balancing energy activated from all
types of reserves. Data regarding such service sharing across border are not available for parties other than Serbia, FYR of Macedonia and Montenegro
27
Figure 21: Electricity balancing energy activated abroad as a percentage of the amount of
total balancing energy activated in national balancing markets of Serbia and Montenegro
2013-2014 (%)
The following figures show curtailed capacities, the number of curtailment cases and
congestion revenues. Capacity curtailment, if implemented by a TSO, is followed by
compensation payments paid to the holders of cross-border transmission rights. However,
despite existing curtailment cases in Contracting Parties, compensation information is
not available. According to the data reports from Contracting Parties, all congestion revenue
was taken into account as income by the NRAs when calculating network tariffs.
Figure 22: Electricity - congestion revenues (Euros) – 2012-2014
-
20000,0
40000,0
60000,0
80000,0
100000,0
120000,0
140000,0
160000,0
180000,0
200000,0
2010 2011 2012 2013 2014
MW
h

28
Figure 23: Curtailed capacities and number of curtailment cases per year - 2012-2014
29
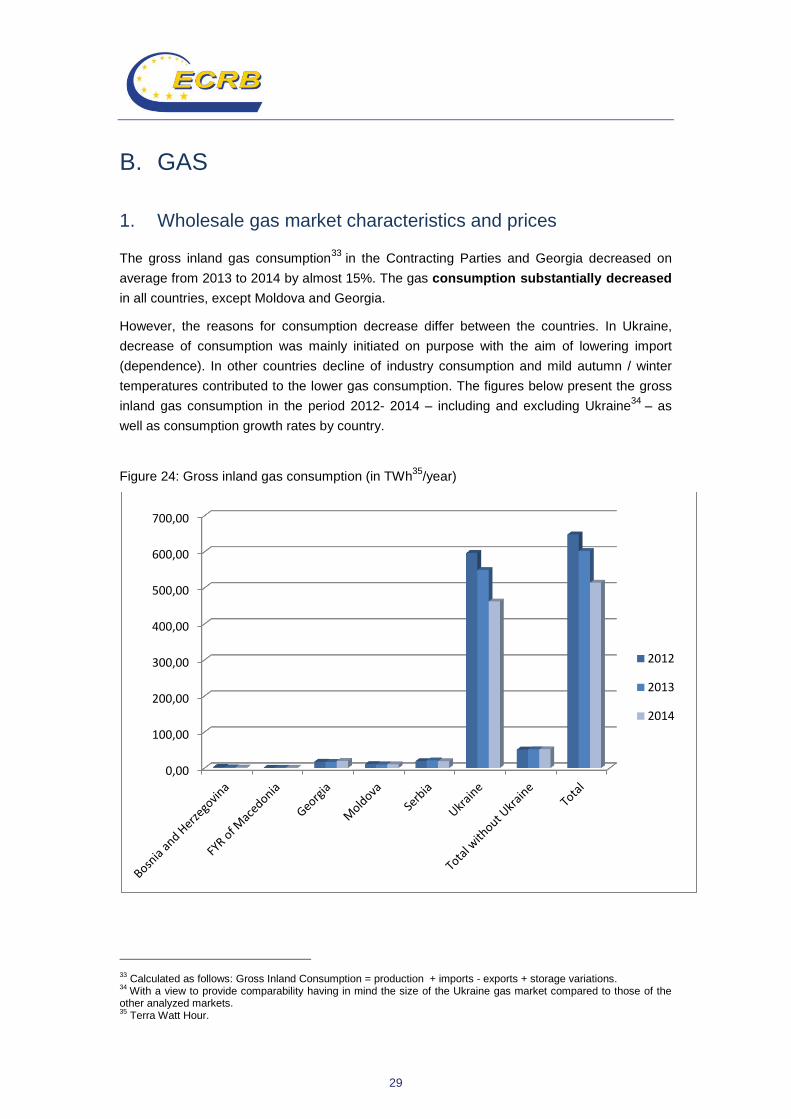
B. GAS
1. Wholesale gas market characteristics and prices
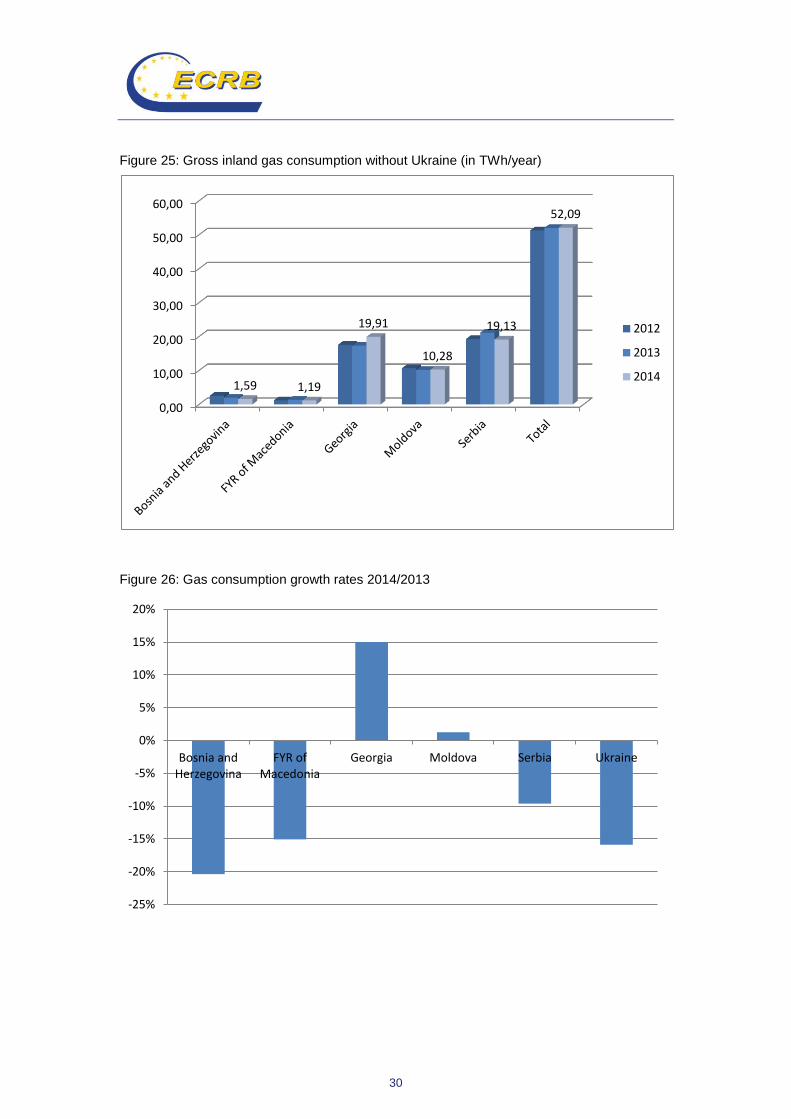
The gross inland gas consumption33
in the Contracting Parties and Georgia decreased on
average from 2013 to 2014 by almost 15%. The gas consumption substantially decreased
in all countries, except Moldova and Georgia.
However, the reasons for consumption decrease differ between the countries. In Ukraine,
decrease of consumption was mainly initiated on purpose with the aim of lowering import
(dependence). In other countries decline of industry consumption and mild autumn / winter
temperatures contributed to the lower gas consumption. The figures below present the gross
inland gas consumption in the period 2012- 2014 – including and excluding Ukraine34
– as
well as consumption growth rates by country.
Figure 24: Gross inland gas consumption (in TWh35
/year)
33 Calculated as follows: Gross Inland Consumption = production + imports - exports + storage variations.
34 With a view to provide comparability having in mind the size of the Ukraine gas market compared to those of the
other analyzed markets. 35
Terra Watt Hour.
0,00
100,00
200,00
300,00
400,00
500,00
600,00
700,00
2012
2013
2014
30
Figure 25: Gross inland gas consumption without Ukraine (in TWh/year)
Figure 26: Gas consumption growth rates 2014/2013
0,00
10,00
20,00
30,00
40,00
50,00
60,00
1,59 1,19
19,91
10,28
19,13
52,09
2012
2013
2014
-25%
-20%
-15%
-10%
-5%
0%
5%
10%
15%
20%
Bosnia and Herzegovina
FYR of Macedonia
Georgia Moldova Serbia Ukraine

31
Natural gas is mainly imported to the Contracting Parties and Georgia. In Bosnia and
Herzegovina and FYR of Macedonia import represents 100% of the final consumption, in
Georgia and Moldova more than 99%, in Serbia between 70% and 80%. In Ukraine 46% of
the gas consumed in 2014 depended on imports with the majority of gas imported from
Russia, 25% of imported gas in 2014 originated from EU countries. In the case of Georgia
90% of total imports originated in 2014 from Azerbaijan, the rest was imported from Russia.
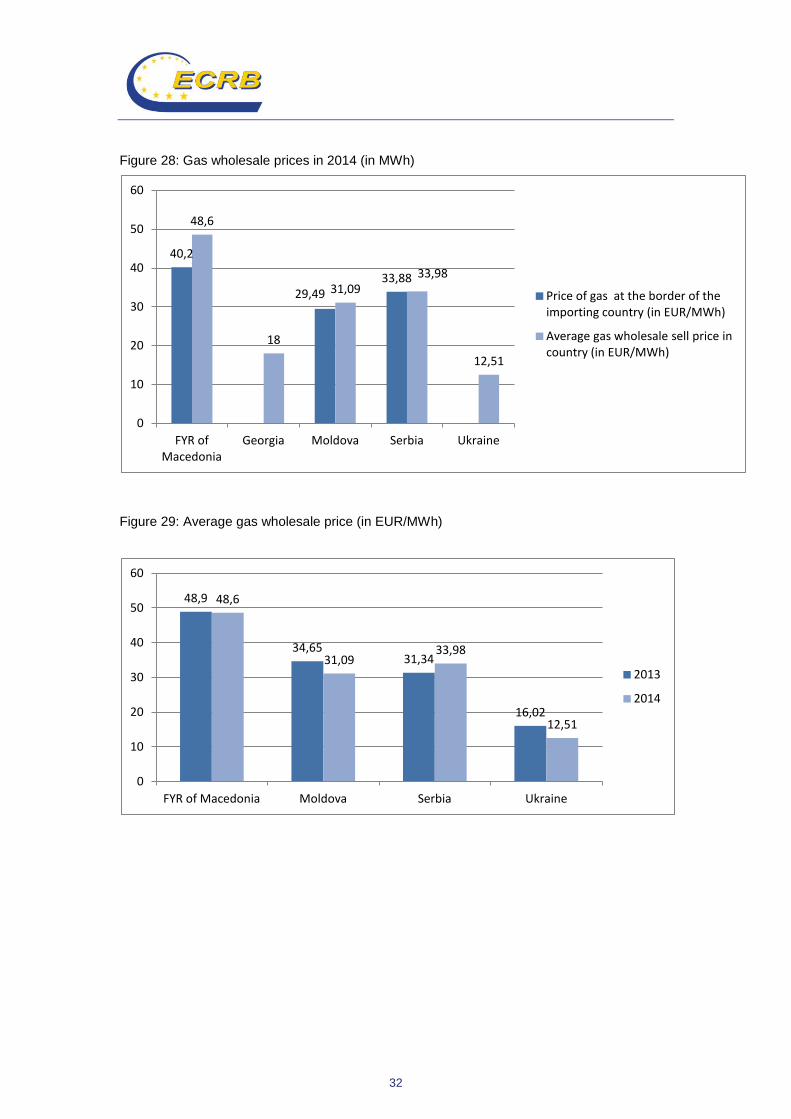
For the countries where related information is available, average yearly prices at the borders
of the importing countries as well as the average wholesale sell prices for the years 2013 and
2014 are shown in the figures below. The average weighted price of gas imported from EU
countries to Ukraine in the last quarter of 2014 amounted to 26,7 EUR/MWh36
. Unsurprisingly,
in countries with 100% import dependence, wholesale prices are higher than border prices; in
Serbia these two prices are almost the same, while in Ukraine the average wholesale price is
substantially lower due to the low price of domestically produced gas. Average border prices
decreased from 2013 to 2014 only in FYR of Macedonia, while in Moldova it slightly rose.
Figure 27: Gas wholesale prices in 2013 (in EUR/MWh)
36 Recalculated based on the information published at http://naftogaz-europe.com/article/en/StatisticsGasPrices.
41,6
29,19
48,9
34,65 31,34
16,02
0
10
20
30
40
50
60
FYR of Macedonia
Moldova Serbia Ukraine
Price of gas at the border of the importing country (in EUR/MWh)
Average gas wholesale sell price in country (in EUR/MWh)
32
Figure 28: Gas wholesale prices in 2014 (in MWh)
Figure 29: Average gas wholesale price (in EUR/MWh)
40,2
29,49 33,88
48,6
18
31,09 33,98
12,51
0
10
20
30
40
50
60
FYR of Macedonia
Georgia Moldova Serbia Ukraine
Price of gas at the border of the importing country (in EUR/MWh)
Average gas wholesale sell price in country (in EUR/MWh)
48,9
34,65 31,34
16,02
48,6
31,09 33,98
12,51
0
10
20
30
40
50
60
FYR of Macedonia Moldova Serbia Ukraine
2013
2014

33
Figure 30: Average yearly price of gas at the border of importing countries (in EUR/MWh)
Wholesale price regulation is abandoned in all analyzed markets with the exception of
Ukraine where prices for gas produced in state owned production companies are regulated by
the national regulator, NEURC, and updated once a year37
.
Gas exchanges do not exist in the analyzed markets. Traders and suppliers active on those
markets also do not buy gas on any other gas exchanges but all gas is provided via long-term
and short-term bilateral supply contracts38
. The exact quantities of gas provided via such
contracts are usually not available to the regulatory authorities39
. However, it is known that
50% of gas demand in Georgia is covered by long-term contracts. The number of shippers
active at the interconnection points varies from one in Bosnia and Herzegovina and Moldova
to two in FYR of Macedonia (where also two customers buy gas directly at the interconnection
point), three in Serbia, five in Georgia and 17 in Ukraine.
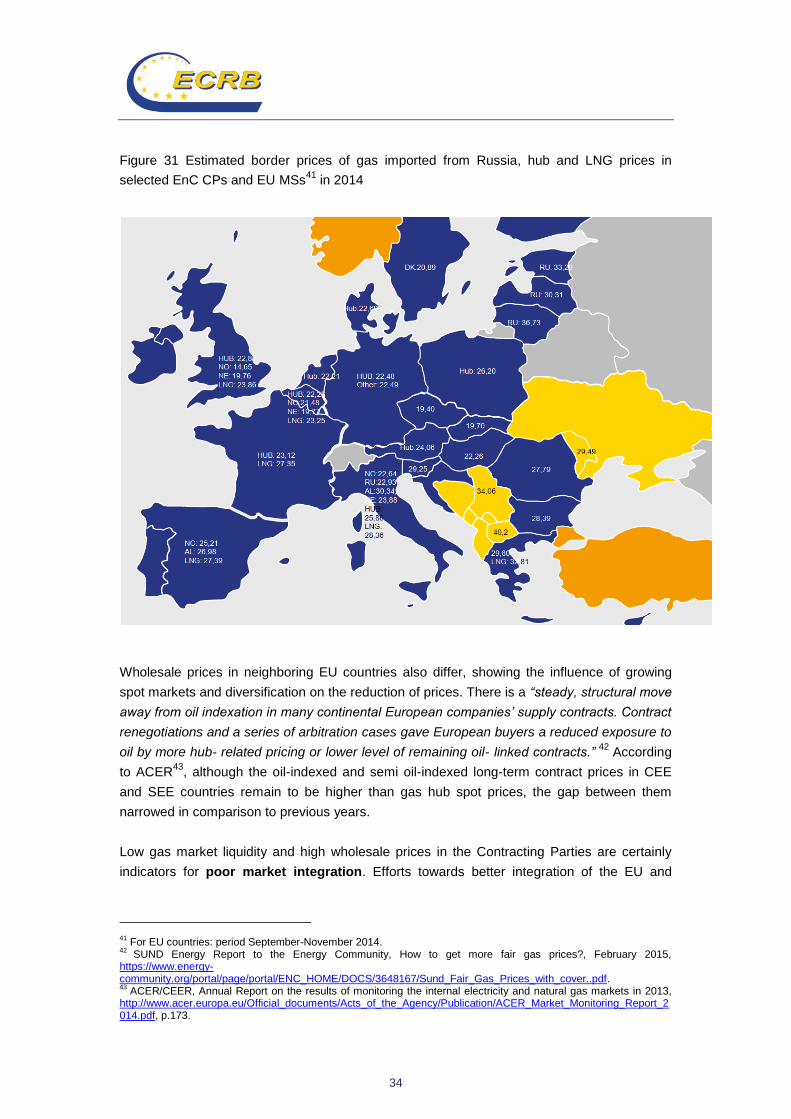
Underdeveloped competitive market conditions – caused by lack of interconnection
infrastructure and diversification of sources on one side but also by not fully developed
legislative and functional preconditions on the other side – contribute to higher average
yearly prices at the borders of importing countries compared to wholesale gas prices in
the neighboring EU countries. The figure below presents the average yearly border prices for
Contracting Parties in 2014 in comparison with estimated border prices for gas from Russia in
the period September to November 2014 in a number of neighboring EU countries40
.
37 With the application of the new Gas Law implementing the 3
rd Energy Package this practice changed in 2015: only
production price of gas dedicated to fulfilling public service obligation is regulated. 38
Long- term contracts are those with duration of more than 1 year. 39
With the exception of the Serbian NRA. 40
Source for estimated border, hub and LNG prices in EU countries is the Quarterly Report on European Gas Markets, published by DG Energy’s Market Observatory for Energy, for the fourth quarter of 2014: https://ec.europa.eu/energy/sites/ener/files/documents/quarterly_report_on_european_gas_markets_2014_q4.pdf. The comparison is only provisional, due to the lack of comparable data for the Energy Community Contracting Parties. Additionally, it has to be noted that 9 months time lag between oil and gas prices exists in the most of the long term gas contracts and gas hub prices mostly follow oil prices immediately.
41,6
29,19
40,2
29,49
33,88
0
5
10
15
20
25
30
35
40
45
FYR of Macedonia Moldova Serbia
2013
2014
34
Figure 31 Estimated border prices of gas imported from Russia, hub and LNG prices in
selected EnC CPs and EU MSs41
in 2014
Wholesale prices in neighboring EU countries also differ, showing the influence of growing
spot markets and diversification on the reduction of prices. There is a “steady, structural move
away from oil indexation in many continental European companies’ supply contracts. Contract
renegotiations and a series of arbitration cases gave European buyers a reduced exposure to
oil by more hub- related pricing or lower level of remaining oil- linked contracts.” 42
According
to ACER43
, although the oil-indexed and semi oil-indexed long-term contract prices in CEE
and SEE countries remain to be higher than gas hub spot prices, the gap between them
narrowed in comparison to previous years.
Low gas market liquidity and high wholesale prices in the Contracting Parties are certainly
indicators for poor market integration. Efforts towards better integration of the EU and
41 For EU countries: period September-November 2014.
42 SUND Energy Report to the Energy Community, How to get more fair gas prices?, February 2015,
https://www.energy-community.org/portal/page/portal/ENC_HOME/DOCS/3648167/Sund_Fair_Gas_Prices_with_cover..pdf. 43
ACER/CEER, Annual Report on the results of monitoring the internal electricity and natural gas markets in 2013, http://www.acer.europa.eu/Official_documents/Acts_of_the_Agency/Publication/ACER_Market_Monitoring_Report_2014.pdf, p.173.
35
Energy Community gas markets should contribute to increased liquidity and convergence of
prices.
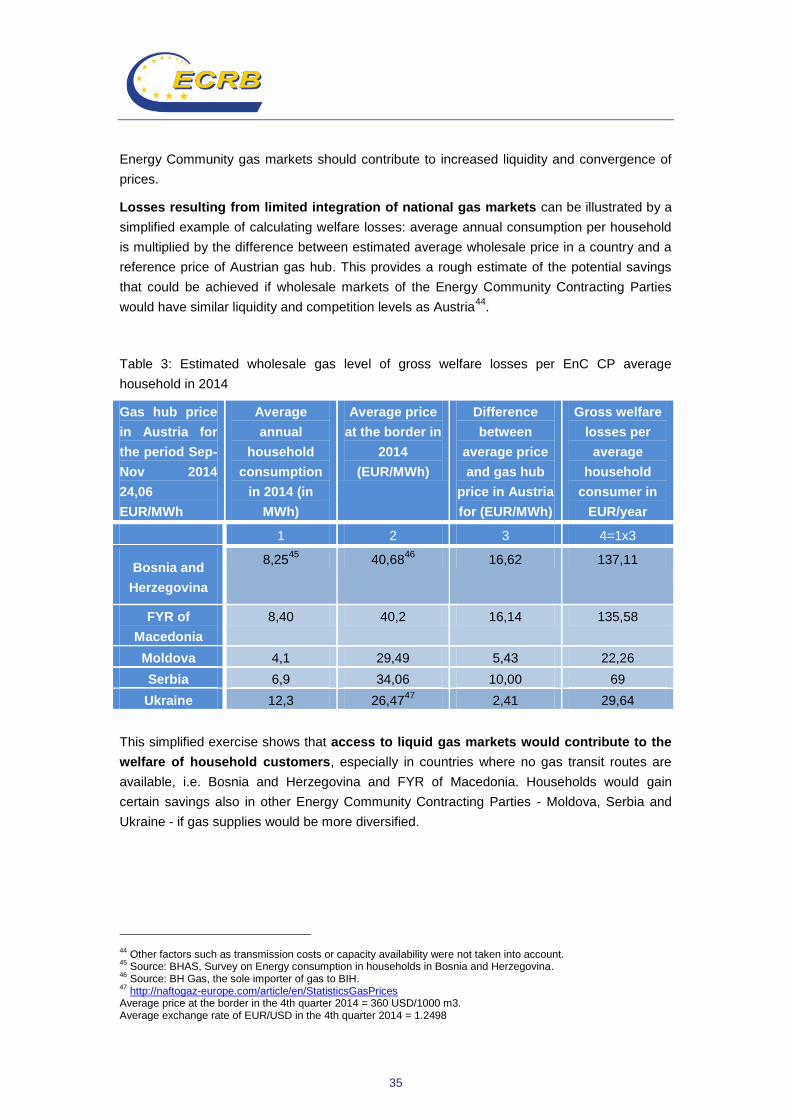
Losses resulting from limited integration of national gas markets can be illustrated by a
simplified example of calculating welfare losses: average annual consumption per household
is multiplied by the difference between estimated average wholesale price in a country and a
reference price of Austrian gas hub. This provides a rough estimate of the potential savings
that could be achieved if wholesale markets of the Energy Community Contracting Parties
would have similar liquidity and competition levels as Austria44
.
Table 3: Estimated wholesale gas level of gross welfare losses per EnC CP average
household in 2014
Gas hub price
in Austria for
the period Sep-
Nov 2014
24,06
EUR/MWh
Average
annual
household
consumption
in 2014 (in
MWh)
Average price
at the border in
2014
(EUR/MWh)
Difference
between
average price
and gas hub
price in Austria
for (EUR/MWh)
Gross welfare
losses per
average
household
consumer in
EUR/year
1 2 3 4=1x3
Bosnia and
Herzegovina
8,2545
40,6846
16,62 137,11
FYR of
Macedonia
8,40 40,2 16,14 135,58
Moldova 4,1 29,49 5,43 22,26
Serbia 6,9 34,06 10,00 69
Ukraine 12,3 26,4747
2,41 29,64
This simplified exercise shows that access to liquid gas markets would contribute to the
welfare of household customers, especially in countries where no gas transit routes are
available, i.e. Bosnia and Herzegovina and FYR of Macedonia. Households would gain
certain savings also in other Energy Community Contracting Parties - Moldova, Serbia and
Ukraine - if gas supplies would be more diversified.
44 Other factors such as transmission costs or capacity availability were not taken into account.
45 Source: BHAS, Survey on Energy consumption in households in Bosnia and Herzegovina.
46 Source: BH Gas, the sole importer of gas to BIH.
47 http://naftogaz-europe.com/article/en/StatisticsGasPrices
Average price at the border in the 4th quarter 2014 = 360 USD/1000 m3. Average exchange rate of EUR/USD in the 4th quarter 2014 = 1.2498

36
2. Market dominance
Market concentration is an important indicator for assessing the performance of wholesale
markets. In its European Gas Target Model 48
ACER included the Herfindahl-Hirschmann
Index (HHI) in the list of market health metrics and set a threshold of ≤ 2000 above which
markets are considered as concentrated. HHI is calculated as sum of squared market shares
(in %) of all different upstream companies supplying a market at import level (i.e. sourcing the
gas into the country, not by the shares of the companies buying this gas in a country). The
table below summarized HHIs for Contracting Parties.
Table 4 HHI for wholesale gas markets in the Contracting Parties and Georgia, calculated for
shares in 2014
Country Herfindahl- Hirschmann Index
Bosnia and Herzegovina 10.000
FYR of Macedonia 10.000
Moldova 9.980
Serbia 10.000
Ukraine 4.33349
Georgia 3.769
Other indicators showing dominance on the gas market are the number of companies selling
at least 5% of available gas and the market share of the three biggest companies. Relevant
results for the assessed markets are shown hereinafter.
48 http://www.acer.europa.eu/Events/Presentation-of-ACER-Gas-Target-Model-
/Documents/European%20Gas%20Target%20Model%20Review%20and%20Update.pdf. 49
Calculated based on: http://www.theinsider.ua/rus/business/kto-i-otkuda-postavlyal-gaz-v-ukrainu; NRA cannot confirm this information.
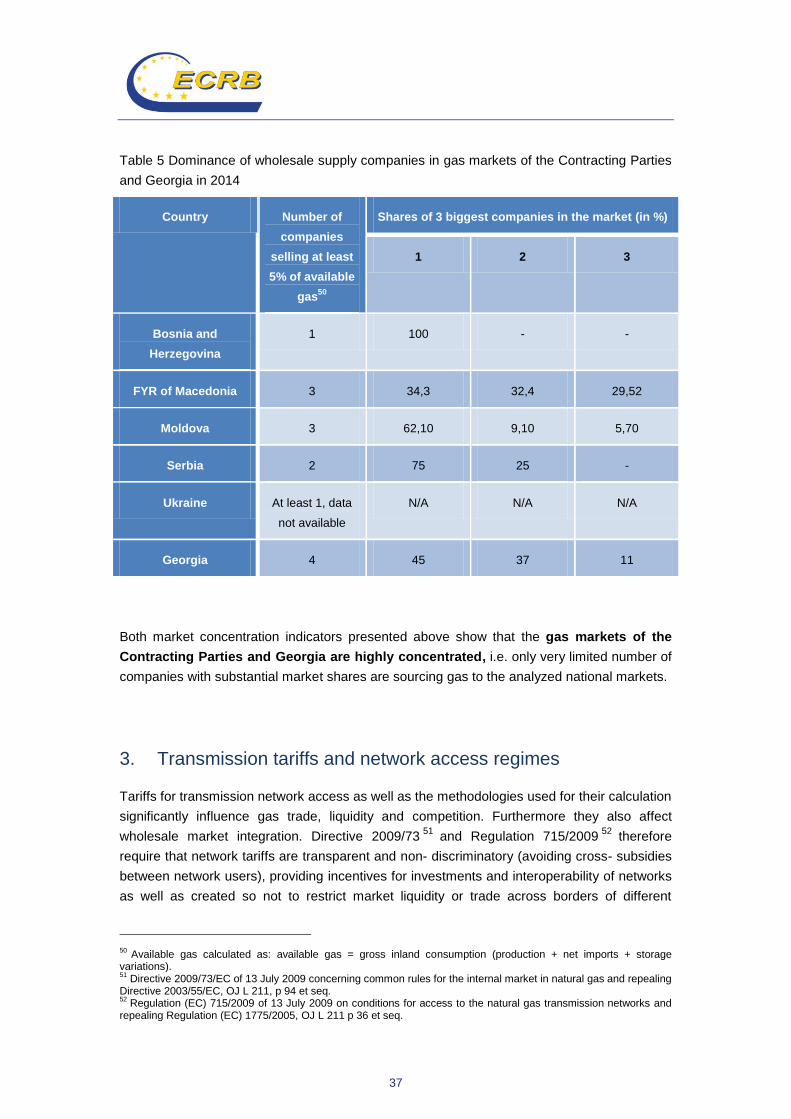
37
Table 5 Dominance of wholesale supply companies in gas markets of the Contracting Parties
and Georgia in 2014
Country Number of
companies
selling at least
5% of available
gas50
Shares of 3 biggest companies in the market (in %)
1 2 3
Bosnia and
Herzegovina
1 100 - -
FYR of Macedonia 3 34,3 32,4 29,52
Moldova 3 62,10 9,10 5,70
Serbia 2 75 25 -
Ukraine At least 1, data
not available
N/A N/A N/A
Georgia 4 45 37 11
Both market concentration indicators presented above show that the gas markets of the
Contracting Parties and Georgia are highly concentrated, i.e. only very limited number of
companies with substantial market shares are sourcing gas to the analyzed national markets.
3. Transmission tariffs and network access regimes
Tariffs for transmission network access as well as the methodologies used for their calculation
significantly influence gas trade, liquidity and competition. Furthermore they also affect
wholesale market integration. Directive 2009/7351
and Regulation 715/200952
therefore
require that network tariffs are transparent and non- discriminatory (avoiding cross- subsidies
between network users), providing incentives for investments and interoperability of networks
as well as created so not to restrict market liquidity or trade across borders of different
50 Available gas calculated as: available gas = gross inland consumption (production + net imports + storage
variations). 51
Directive 2009/73/EC of 13 July 2009 concerning common rules for the internal market in natural gas and repealing Directive 2003/55/EC, OJ L 211, p 94 et seq. 52
Regulation (EC) 715/2009 of 13 July 2009 on conditions for access to the natural gas transmission networks and repealing Regulation (EC) 1775/2005, OJ L 211 p 36 et seq.

38
transmission systems53
. Still not obliged to set tariffs for each entry and exit point separately
in 201454
, TSOs and NRAs of the analyzed markets were implementing post stamp
methodologies for calculation of transmission tariffs whereby all costs are allocated to
system users at their exits from the transmission system and expressed in monetary unit per
m3 or m3/day/year (the latter only in Serbia, where certain proportion of costs is allocated to
capacity) on yearly basis. Average transmission tariffs in 2014 are presented in the table
below.
Table 6 Average yearly gas transmission tariffs in 2014 (in EUR/GWh)
Country Average transmission
tariffs in 2014 (in
EUR/GWh)
Share of transmission costs in the end-
user price of gas (in %)
industry households
FYR of Macedonia 2487 N/A N/A
Moldova 110 0,38 0,34
Serbia 992 2,6 2,4
Ukraine 671,98 N/A 4
Georgia 564 1,7-2,2 3,6
Average gas transmission tariffs in 2014 differ a lot among Contracting Parties, starting
from only 110 EUR/GWh in Moldova to 2487 EUR/GWh in FYR of Macedonia. Without
detailed investigation of costs included in the allowed revenue or transmission tariff
structures, it is not possible to explain precisely the reasons for such differences. However, in
the case of FYR of Macedonia the huge investment costs in relation to still low usage of
transmission network contribute to the very high transmission tariffs. The current shares of
transmission tariffs in the end-user prices of gas are estimated to 2-4% in Georgia, Serbia
and Ukraine. However the transmission network charges are per se more stable than gas
commodity prices, i.e. the shares fluctuate with the changes in gas prices.
The main principles of transmission tariff settings as well as tariff structures are presented in
the table below.
53 In order to facilitate development of such tariffs and tariff methodologies, ACER published Framework Guidelines
on harmonized Transmission Tariff Structure on whose ground ENTSO-G prepared and submitted to the European Commission a related Network Code. 54
Contracting Parties were obliged to transpose the Third Energy Package by 1 January 2015.

39
Table 7 Principles of gas transmission tariffs calculation in the Contracting Parties and Georgia
Country Cost allocation
methodology
Price control
mechanism
Role of NRA in tariff
setting
Role of TSO Tariff recovery basis
Post
stamp
other55
Price
cap
Revenue
cap
Fixing
methodology
Approval
of tariffs
Methodology
proposal
Calculation
of tariffs
Capacity
(%)
Commodity
(%)
Bosnia and
Herzegovina
x
FYR of
Macedonia
x x x x x x 0 100
Moldova x x x x 100
Serbia x x x x x 30 70
Ukraine x x x x x 0 100
Georgia x x x x 0 100
55 E.g. Locational signals considered, capacity weighted distance.

40
Capacities are not offered for periods shorter than one year, therefore there are no
multipliers for calculating short-period tariffs.
In all countries except Moldova tariff methodologies are fixed by the regulatory
authorities56
, tariffs are calculated by the TSOs and finally approved by the regulators. In the
Contracting Parties there are no dedicated transit pipelines with particular conditions. The
exception is the Ananiev – Tiraspol – Izmail (ATI) Pipeline in Moldova. In Georgia, a section
of the South Caucasus Pipeline (or Baku - Tbilisi –Erzurum pipeline) is a transit pipeline that
is operated by BP, not the Georgian TSO. Through one interconnection point the South
Caucasus Pipeline is linked to the Georgian transmission system.
Beside capacity tarification, transparent and non-discriminatory capacity allocation
harmonized on interconnection points between TSOs is another important prerequisite for
having liquid and competitive wholesale gas markets. On EU level Regulation (EC)
984/201357
requires harmonized allocation procedures and standardized product duration at
cross-border IPs to enhance hub liquidity and facilitate gas. Said Regulation, alongside with
other EU Third Package related Network Code Regulations58
, is still not applicable for the
interconnection points between EU Member States and Energy Community Contacting
Parties59
as well as between the Energy Community Contracting Parties. It goes without
saying that capacity allocation harmonization among all European countries would bring
benefits for gas trade and market development.
Before providing an overview of the capacity allocation and congestion management
procedures implemented in the Energy Community Contracting Parties, it is worth noting the
capacity utilization at interconnection points between those countries.
56 In FYR of Macedonia the methodology is proposed by the TSO.
57 Regulation (EC) 984/2013 establishing a Network Code on Capacity Allocation Mechanisms in Gas Transmission Systems and supplementing Regulation (EC) No 715/2009 of the European Parliament and of the Council (OJ L 273 of 15.10.2013, p 5 et seq) 58
On balancing, interoperability as well as on congestion management mechanisms. 59
Unless a NRA of an EU MS decides that at its particular IPs with EnC CPs NC provisions are implemented.
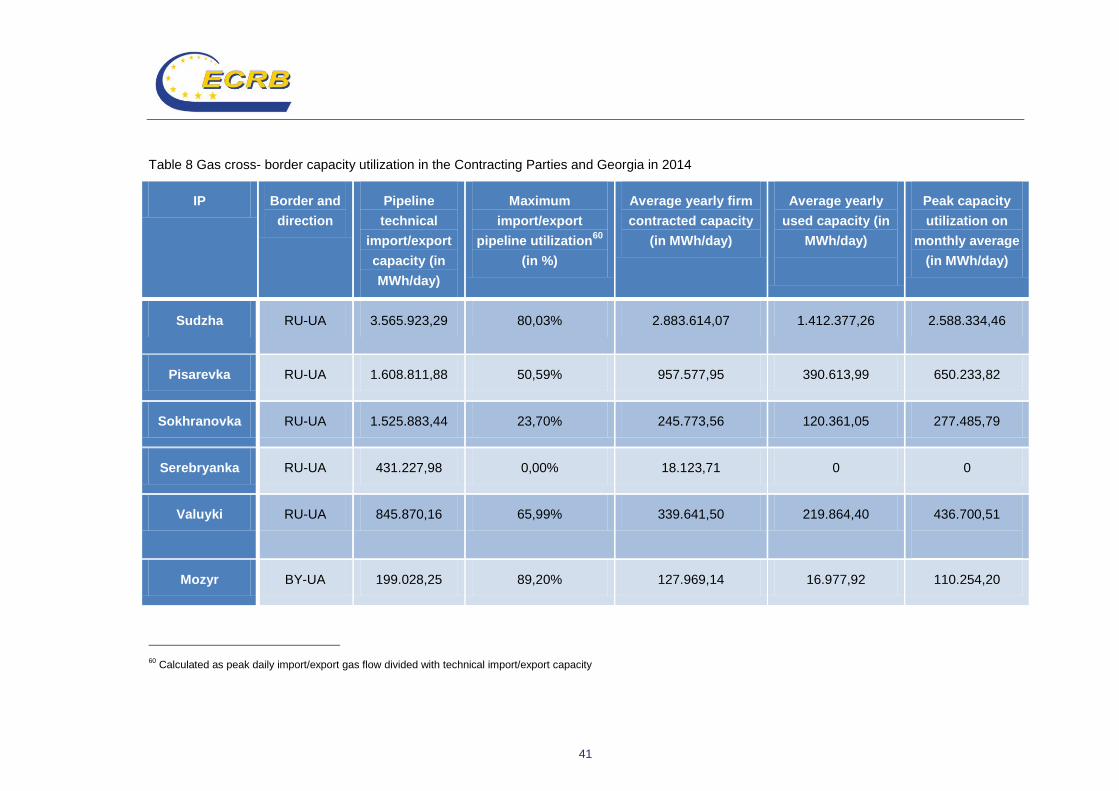
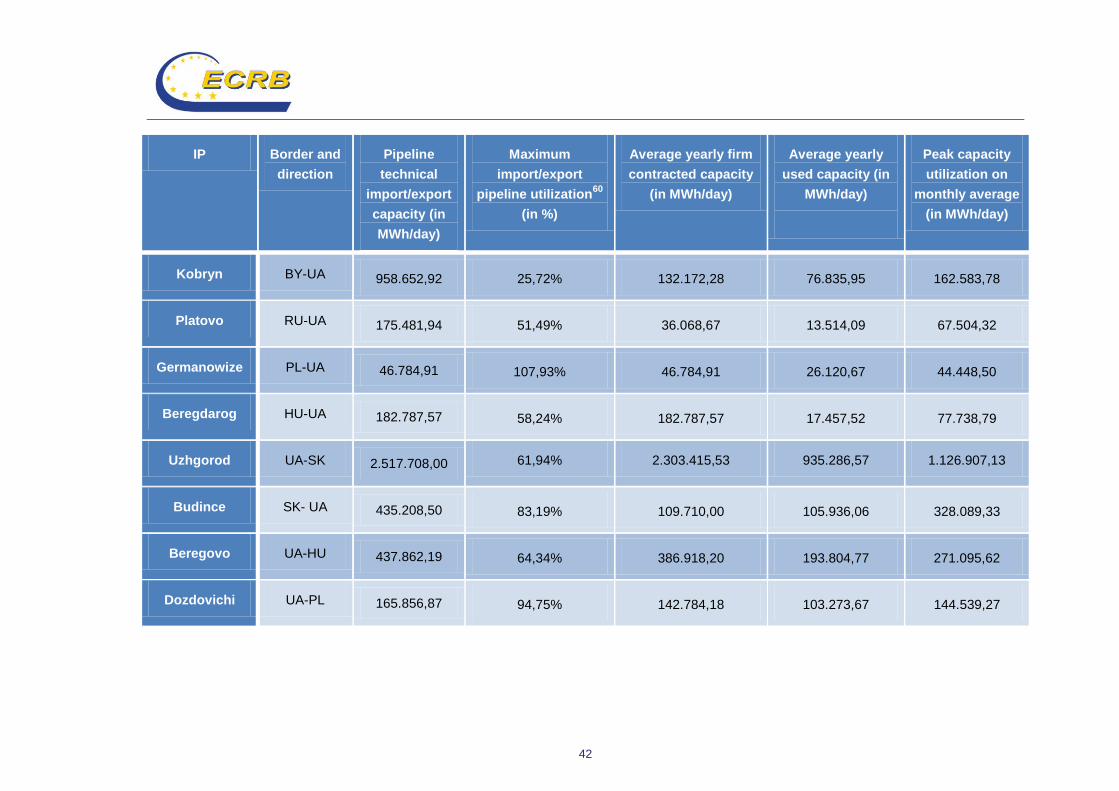
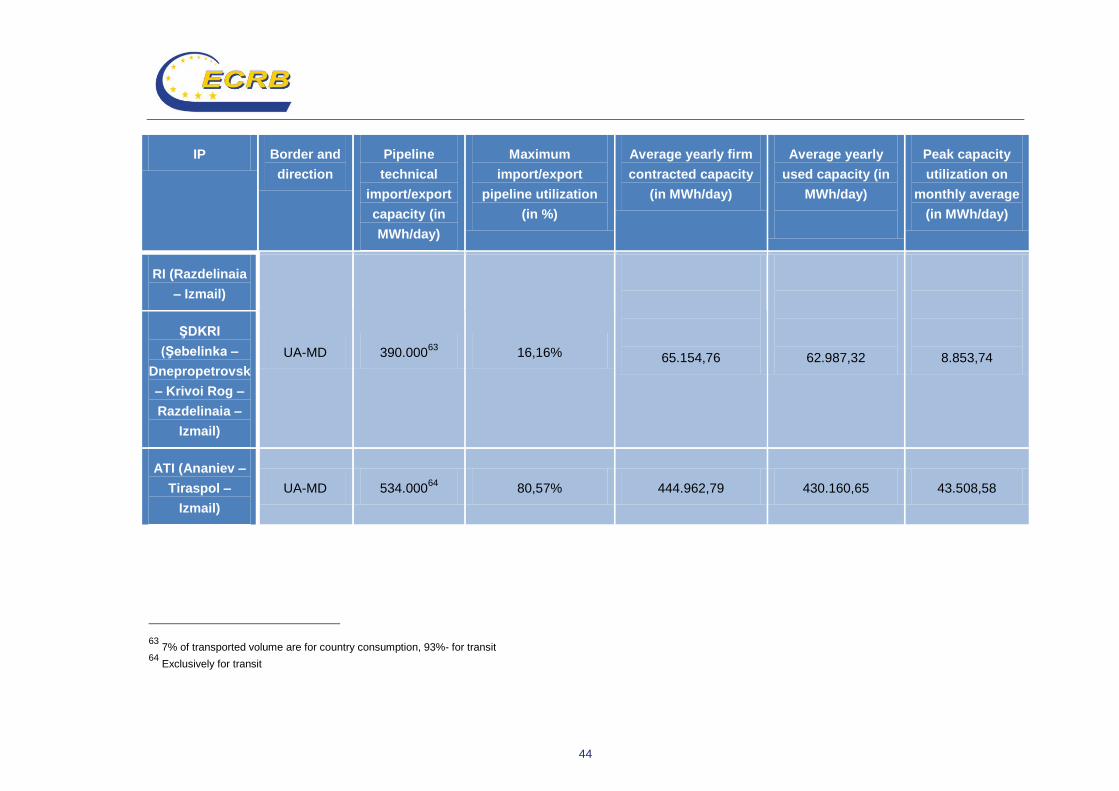
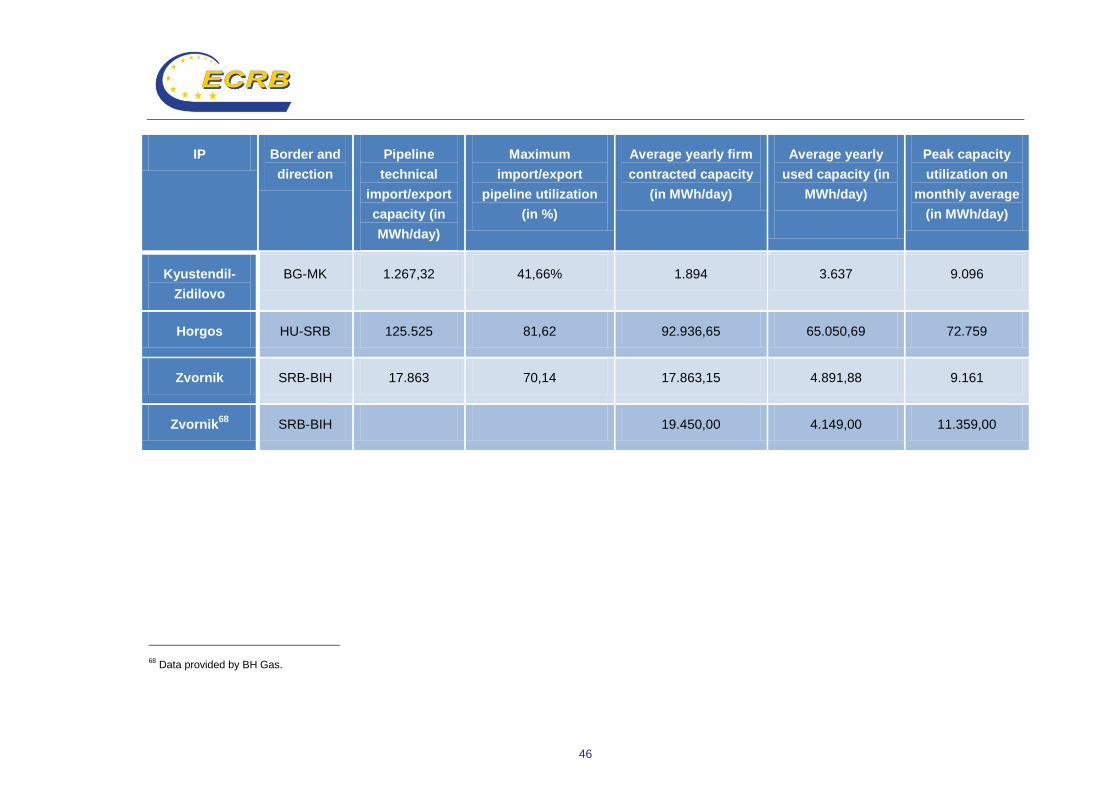
41
Table 8 Gas cross- border capacity utilization in the Contracting Parties and Georgia in 2014
IP Border and
direction
Pipeline
technical
import/export
capacity (in
MWh/day)
Maximum
import/export
pipeline utilization60
(in %)
Average yearly firm
contracted capacity
(in MWh/day)
Average yearly
used capacity (in
MWh/day)
Peak capacity
utilization on
monthly average
(in MWh/day)
Sudzha RU-UA 3.565.923,29 80,03% 2.883.614,07 1.412.377,26 2.588.334,46
Pisarevka RU-UA 1.608.811,88 50,59% 957.577,95 390.613,99 650.233,82
Sokhranovka RU-UA 1.525.883,44 23,70% 245.773,56 120.361,05 277.485,79
Serebryanka RU-UA 431.227,98 0,00% 18.123,71 0 0
Valuyki RU-UA 845.870,16 65,99% 339.641,50 219.864,40 436.700,51
Mozyr BY-UA 199.028,25 89,20% 127.969,14 16.977,92 110.254,20
60 Calculated as peak daily import/export gas flow divided with technical import/export capacity
42
IP Border and
direction
Pipeline
technical
import/export
capacity (in
MWh/day)
Maximum
import/export
pipeline utilization60
(in %)
Average yearly firm
contracted capacity
(in MWh/day)
Average yearly
used capacity (in
MWh/day)
Peak capacity
utilization on
monthly average
(in MWh/day)
Kobryn BY-UA 958.652,92 25,72% 132.172,28 76.835,95 162.583,78
Platovo RU-UA 175.481,94 51,49% 36.068,67 13.514,09 67.504,32
Germanowize PL-UA 46.784,91 107,93% 46.784,91 26.120,67 44.448,50
Beregdarog HU-UA 182.787,57 58,24% 182.787,57 17.457,52 77.738,79
Uzhgorod UA-SK 2.517.708,00 61,94% 2.303.415,53 935.286,57 1.126.907,13
Budince SK- UA 435.208,50 83,19% 109.710,00 105.936,06 328.089,33
Beregovo UA-HU 437.862,19 64,34% 386.918,20 193.804,77 271.095,62
Dozdovichi UA-PL 165.856,87 94,75% 142.784,18 103.273,67 144.539,27

43
IP Border and
direction
Pipeline
technical
import/export
capacity (in
MWh/day)
Maximum
import/export
pipeline utilization60
(in %)
Average yearly firm
contracted capacity
(in MWh/day)
Average yearly
used capacity (in
MWh/day)
Peak capacity
utilization on
monthly average
(in MWh/day)
Orlovka UA-RO 888.993,01 88,68% 603.628,21 536.137,38 669.921,13
Tekovo UA-RO 149.271,18 37,85% 48.290,30 1.324,67 8.825,27
Moldova (all)61
UA-MD 116.099,81 152,59% 94.493,88 84.740,21 137.967,41
ACB (Aneniev-
Cernauti-
Bogorodceni)
UA-MD 267.00062
10,32% 28.490,37 27.542,60 4.504,28
61 Data provided by Ukrainian NRA and TSO.
62 Used in direction UKR-MD, 82.6% of volume is for the national market, the rest for transit.
44
IP Border and
direction
Pipeline
technical
import/export
capacity (in
MWh/day)
Maximum
import/export
pipeline utilization
(in %)
Average yearly firm
contracted capacity
(in MWh/day)
Average yearly
used capacity (in
MWh/day)
Peak capacity
utilization on
monthly average
(in MWh/day)
RI (Razdelinaia
– Izmail)
UA-MD 390.00063
16,16%
65.154,76
62.987,32
8.853,74
ŞDKRI
(Şebelinka –
Dnepropetrovsk
– Krivoi Rog –
Razdelinaia –
Izmail)
ATI (Ananiev –
Tiraspol –
Izmail)
UA-MD 534.00064
80,57% 444.962,79 430.160,65 43.508,58
63 7% of transported volume are for country consumption, 93%- for transit
64 Exclusively for transit

45
IP Border and
direction
Pipeline
technical
import/export
capacity (in
MWh/day)
Maximum
import/export
pipeline utilization
(in %)
Average yearly firm
contracted capacity
(in MWh/day)
Average yearly
used capacity (in
MWh/day)
Peak capacity
utilization on
monthly average
(in MWh/day)
ACB (Aneniev-
Cernauti-
Bogorodceni)
MD-UA 266.963,3165
1,74% 4.189,12 4.655,84 593,61
RI (Razdelinaia
– Izmail)
MD-UA 389.766,4366
15,03% 60.480,46 58.585,10 8.151,55
ŞDKRI
(Şebelinka –
Dnepropetrovsk
– Krivoi Rog –
Razdelinaia –
Izmail)
ATI (Ananiev –
Tiraspol –
Izmail)
MD-UA 533.926,6267
80,43% 444.171,93 429.415,82 43.384,98
65 Used in direction UKR-MD, 82.6% of volume is for the national market, the rest for transit.
66 7% of transported volume are for country consumption, 93% for transit.
67 Exclusively for transit.
46
IP Border and
direction
Pipeline
technical
import/export
capacity (in
MWh/day)
Maximum
import/export
pipeline utilization
(in %)
Average yearly firm
contracted capacity
(in MWh/day)
Average yearly
used capacity (in
MWh/day)
Peak capacity
utilization on
monthly average
(in MWh/day)
Kyustendil-
Zidilovo
BG-MK 1.267,32 41,66% 1.894 3.637 9.096
Horgos HU-SRB 125.525 81,62 92.936,65 65.050,69 72.759
Zvornik SRB-BIH 17.863 70,14 17.863,15 4.891,88 9.161
Zvornik68
SRB-BIH 19.450,00 4.149,00 11.359,00
68 Data provided by BH Gas.

47
In 2014 transmission capacity was still allocated bundled with gas quantities transported.
Rules for congestion management were also not in place in 2014. However, as shown in
table 8 in many Contracting Parties network capacities are underused. On the other hand, on
several interconnection points between Ukraine and its neighboring gas markets, namely
Poland and Moldova, available capacities were utilized more than 100% in 2014 in peak
situations which strongly calls for efficient congestion management procedures.
No market based balancing rules were implemented in the Contracting Parties and Georgia
in 2014. Furthermore imbalance charges were not calculated and only linepack was used as
source for balancing gas.
Transparency of network access conditions is a crucial prerequisite for well functioning gas
markets - only when access to relevant information is provided in fair and non-discriminatory
manner to all existing and potential network users, entry barriers can be avoided and
competition increased. ECRB therefore developed an analysis of compliance of TSOs and
NRAs with the transparency requirements of Regulation (EC) 715/2009. The results revealed
very low degree of TSOs’ compliance with the legal requirements: only applicable network
codes are published on the web pages of TSOs. NRAs in general comply with transparency:
methodologies for transmission tariffs calculation as well as applicable tariffs69
are published
in all cases.70
4. Utilization of underground gas storage
Gas storages play an important role in meeting gas demand. They may be used to cover
base load demand, seasonal swings, short-run peak requirements and disruptions and are
also a central security of supply tool.
Among the Energy Community Contracting Parties, only Serbia and Ukraine have gas
storage facilities, namely:
- One gas storage facility, Banatski Dvor, in Serbia with capacity (working gas) of 4.345
GWh, maximum injection capacity of 26.070,53 MWh/day and maximum withdrawal
capacity of 43.450,89 MWh/day;
- 12 storage facilities in Ukraine with a total capacity of 336.742,58 GWh, maximum
injection capacity of 2.883.256,32 MWh/day and maximum withdrawal capacity of
3.046.459,51 MWh/day;
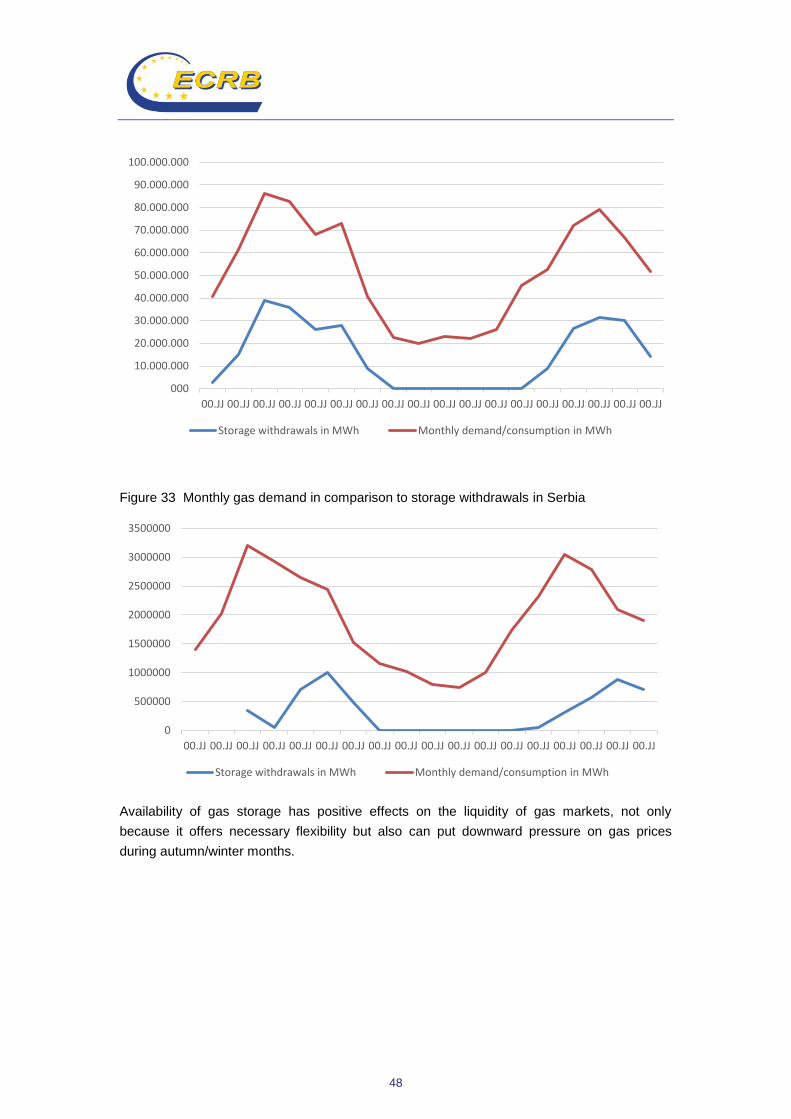
Total yearly withdrawals in 2013 covered on average 24,40% of gas demand in Ukraine and
12,20% in Serbia. These percentages would be even higher when calculated only for winter
months (up to 50%). The related dynamics can be seen in the graphs below.
Figure 32 Monthly gas demand in comparison to storage withdrawals in Ukraine
69 Where the NRA provides approval.
70 Details of the analysis are available from : ECRB, Compliance review – transparency of the Energy Community gas
markets, 2016.
48
Figure 33 Monthly gas demand in comparison to storage withdrawals in Serbia
Availability of gas storage has positive effects on the liquidity of gas markets, not only
because it offers necessary flexibility but also can put downward pressure on gas prices
during autumn/winter months.
000
10.000.000
20.000.000
30.000.000
40.000.000
50.000.000
60.000.000
70.000.000
80.000.000
90.000.000
100.000.000
00.JJ 00.JJ 00.JJ 00.JJ 00.JJ 00.JJ 00.JJ 00.JJ 00.JJ 00.JJ 00.JJ 00.JJ 00.JJ 00.JJ 00.JJ 00.JJ 00.JJ 00.JJ
Storage withdrawals in MWh Monthly demand/consumption in MWh
0
500000
1000000
1500000
2000000
2500000
3000000
3500000
00.JJ 00.JJ 00.JJ 00.JJ 00.JJ 00.JJ 00.JJ 00.JJ 00.JJ 00.JJ 00.JJ 00.JJ 00.JJ 00.JJ 00.JJ 00.JJ 00.JJ 00.JJ
Storage withdrawals in MWh Monthly demand/consumption in MWh
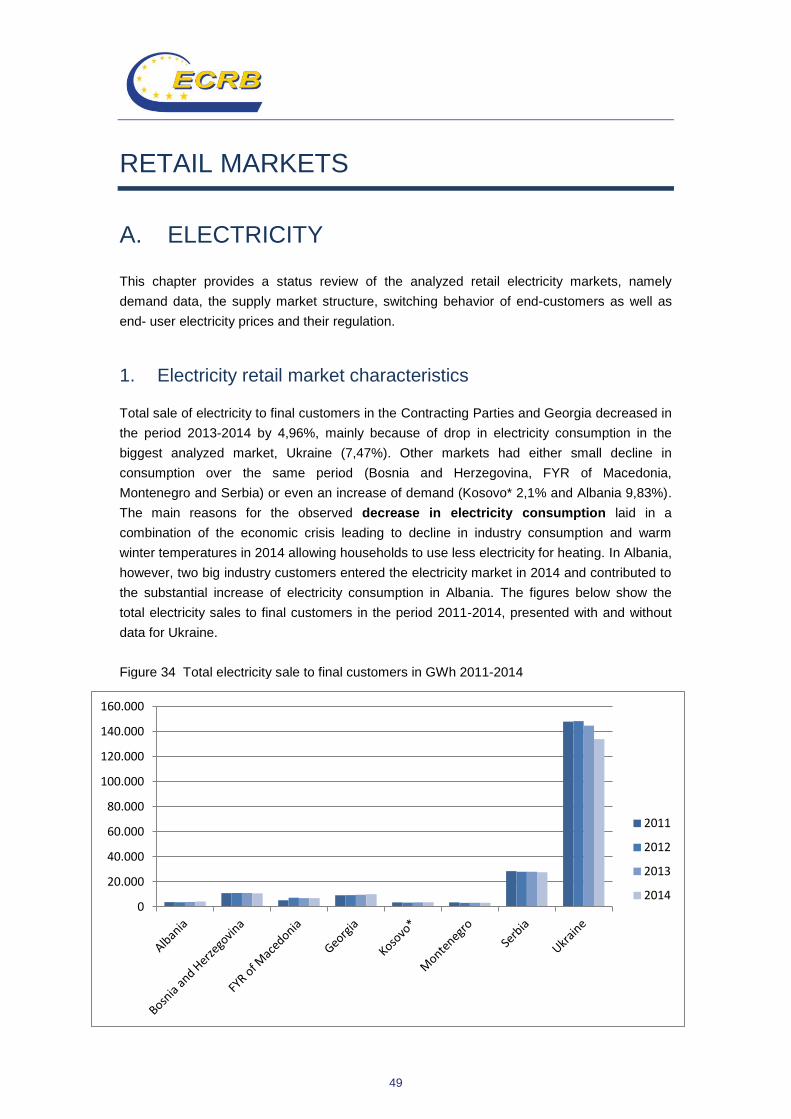
49
RETAIL MARKETS
A. ELECTRICITY
This chapter provides a status review of the analyzed retail electricity markets, namely
demand data, the supply market structure, switching behavior of end-customers as well as
end- user electricity prices and their regulation.
1. Electricity retail market characteristics
Total sale of electricity to final customers in the Contracting Parties and Georgia decreased in
the period 2013-2014 by 4,96%, mainly because of drop in electricity consumption in the
biggest analyzed market, Ukraine (7,47%). Other markets had either small decline in
consumption over the same period (Bosnia and Herzegovina, FYR of Macedonia,
Montenegro and Serbia) or even an increase of demand (Kosovo* 2,1% and Albania 9,83%).
The main reasons for the observed decrease in electricity consumption laid in a
combination of the economic crisis leading to decline in industry consumption and warm
winter temperatures in 2014 allowing households to use less electricity for heating. In Albania,
however, two big industry customers entered the electricity market in 2014 and contributed to
the substantial increase of electricity consumption in Albania. The figures below show the
total electricity sales to final customers in the period 2011-2014, presented with and without
data for Ukraine.
Figure 34 Total electricity sale to final customers in GWh 2011-2014
0
20.000
40.000
60.000
80.000
100.000
120.000
140.000
160.000
2011
2012
2013
2014

50
Figure 35 Total electricity sale to final customers in GWh 2011-2014 (excluding Ukraine) Figure 36 Electricity demand growth rate 2013 to 2014
9,829%
-1,935% -,409%
4,954%
2,097%
-,993% -1,193%
-7,470%
-10,000%
-8,000%
-6,000%
-4,000%
-2,000%
,000%
2,000%
4,000%
6,000%
8,000%
10,000%
12,000%
ALB BIH FYROM GEO KOS* MNE SRB UKR
0
5.000
10.000
15.000
20.000
25.000
30.000
35.000
2011
2012
2013
2014
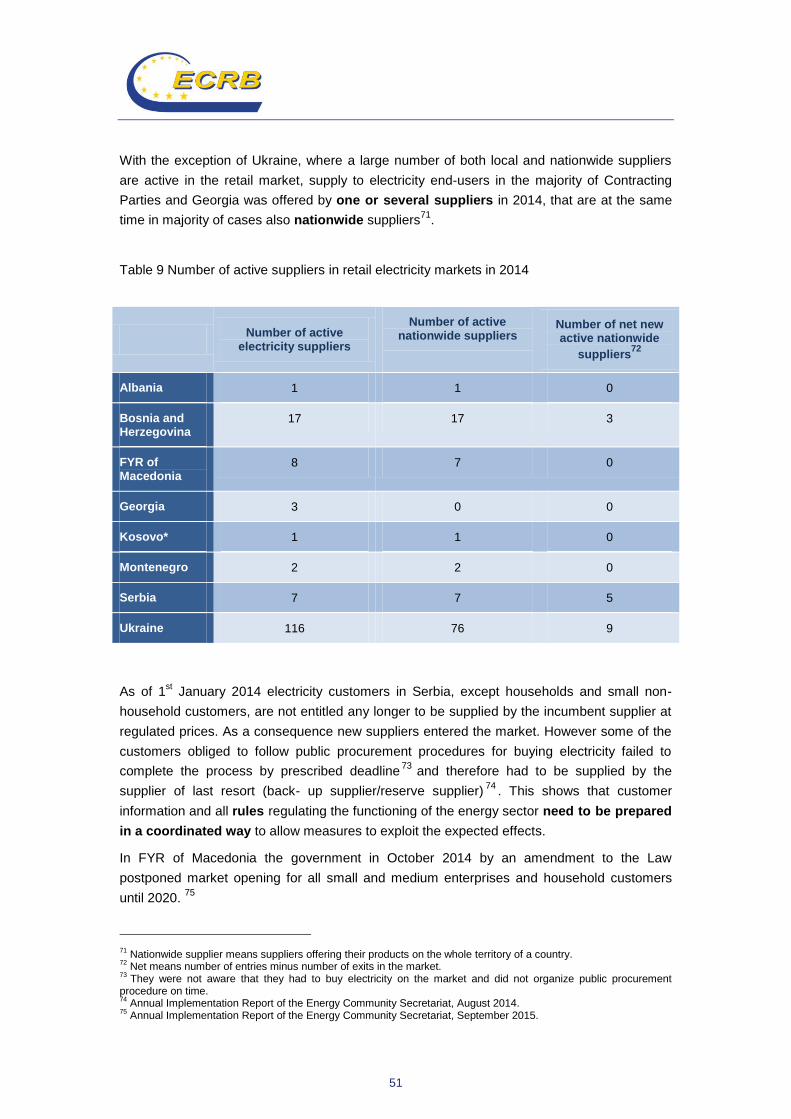
51
With the exception of Ukraine, where a large number of both local and nationwide suppliers
are active in the retail market, supply to electricity end-users in the majority of Contracting
Parties and Georgia was offered by one or several suppliers in 2014, that are at the same
time in majority of cases also nationwide suppliers71
.
Table 9 Number of active suppliers in retail electricity markets in 2014
Number of active
electricity suppliers
Number of active nationwide suppliers
Number of net new active nationwide
suppliers72
Albania 1 1 0
Bosnia and Herzegovina
17 17 3
FYR of Macedonia
8 7 0
Georgia 3 0 0
Kosovo* 1 1 0
Montenegro 2 2 0
Serbia 7 7 5
Ukraine 116 76 9
As of 1st January 2014 electricity customers in Serbia, except households and small non-
household customers, are not entitled any longer to be supplied by the incumbent supplier at
regulated prices. As a consequence new suppliers entered the market. However some of the
customers obliged to follow public procurement procedures for buying electricity failed to
complete the process by prescribed deadline73
and therefore had to be supplied by the
supplier of last resort (back- up supplier/reserve supplier)74
. This shows that customer
information and all rules regulating the functioning of the energy sector need to be prepared
in a coordinated way to allow measures to exploit the expected effects.
In FYR of Macedonia the government in October 2014 by an amendment to the Law
postponed market opening for all small and medium enterprises and household customers
until 2020. 75
71 Nationwide supplier means suppliers offering their products on the whole territory of a country.
72 Net means number of entries minus number of exits in the market.
73 They were not aware that they had to buy electricity on the market and did not organize public procurement
procedure on time. 74
Annual Implementation Report of the Energy Community Secretariat, August 2014. 75
Annual Implementation Report of the Energy Community Secretariat, September 2015.

52
It is worth noting that all new suppliers active in the market indeed operate as nationwide
suppliers; this proofs that both transmission and distribution networks were effectively
opened for suppliers other than incumbent and the first steps towards creating level playing
field in the retail markets have proven success. The figures below show detailed information
on transmission and distribution network use by more suppliers in 2014. It is obvious that
more suppliers were active in the part of market supplying customers connected to the
transmission network, not only because these customers are with higher quantities and
sensitivity to price changes, but also because in many of the Contracting Parties those
customers were forced in several previous years to leave the regulated market and conclude
a contract with a supplier offering electricity at non- regulated prices.
Figure 37 Are electricity TSO networks used by more than one supplier?
Figure 38 Are electricity DSO networks used by more than one supplier?
ALB, KOS*
BIH, FYROM, GEO, MNE, SRB, UKR
no
yes
FYROM, GEO, SRB, UKR
ALB, BIH, KOS*, MNE no
yes

53
In order to accomplish the picture of retail electricity markets from supply side, concentration
and openness of markets have been investigated. Results are presented in the table
hereinafter. The analyzed markets may be grouped in the following way:
- In Albania and Kosovo* there is only one retail public supplier of electricity, namely the
incumbent with a 100% market share;
- In Georgia the electricity retailers are regional and incumbent suppliers with the market
share of three largest companies being equal or close to 100%. Similarly, in Bosnia
and Herzegovina three dominant electricity suppliers with market shares adding up to
98% act as a regional suppliers, although having nationwide licenses;
- In Montenegro there are two retail electricity suppliers in the market: one of them
supplies only one industrial customer accounting for around 20% of total consumption.
All other customers are with the incumbent supplier;
- In Serbia, the great majority of customers are supplied by an incumbent supplier with a
market share close to 100%. Although market shares of the largest companies were still
extremely high in 2014, new market entrants improved slightly the competitiveness of
retail markets;
- In FYR of Macedonia there were 8 active suppliers (2- regulated market, 6- liberalized
electricity market). The market share of the biggest electricity supplier (active on
regulated market) was 64,40%;
- The large number of electricity retailers in Ukraine and their low market shares76
might
indicate a competitive and open market. However, household customers were still
supplied by local utilities77
at regulated prices, like in all other Energy Community
Contracting Parties. According to the Law on functioning of electricity market of Ukraine
of 2013 non-household customers are eligible as of 1st January 2014
78, household
customers are eligible from 1st January 2015
79.
76 The market share of the largest supplier in the whole market was 17,2% in 2014, while the market share of the
same company in supplying households was only 8,79%. 77
There are 40 DSOs in Ukraine performing also retail supply function. 78
Non- household customers had the right to choose supplier also before 2014 but without using the term “eligible”. 79
In order to realize such a provision of the Law relevant secondary legislation on switching is under preparation.

54
Table 10 Electricity retail market concentration and market opening in 2014
Number of electricity retailers selling at least 5% of total
electricity consumed by final customers
Market share of the 3 largest companies in
the retail market (aggregated) in %
Estimated incumbent market share in the household market, in % of annual
consumption
Albania 1 100% 100%
Bosnia and Herzegovina
3 98,01% 100%
FYR of Macedonia
3 91,40% 100%
Georgia 2 100% 100%
Kosovo* 1 100% 100%
Montenegro 2 100% 100%
Serbia 1 99,36% 100%
Ukraine 4 30,06% 100%
2. Switching behavior
The switching rate is one of the commonly used indicators for measuring market
competitiveness. However, its interpretation has to be done carefully and by taking into
consideration relevant legislative and regulatory provisions as well as the structures of the
markets.
In the monitoring period not all customers in the Contracting Parties had the right to choose
their supplier:
- Household customers in none of the markets were eligible in 2014. Nevertheless
national legislation in all cases provides for complete market opening as of January
2015. The exemption is FYR of Macedonia where the Government in October 2014 by
an amendment to the Law postponed market opening for all small and medium
enterprises and household customers until 2020.
- Non-household customers were eligible to switch their suppliers in more than half of the
Contracting Parties, namely in Kosovo*, FYR of Macedonia, Montenegro, Serbia and
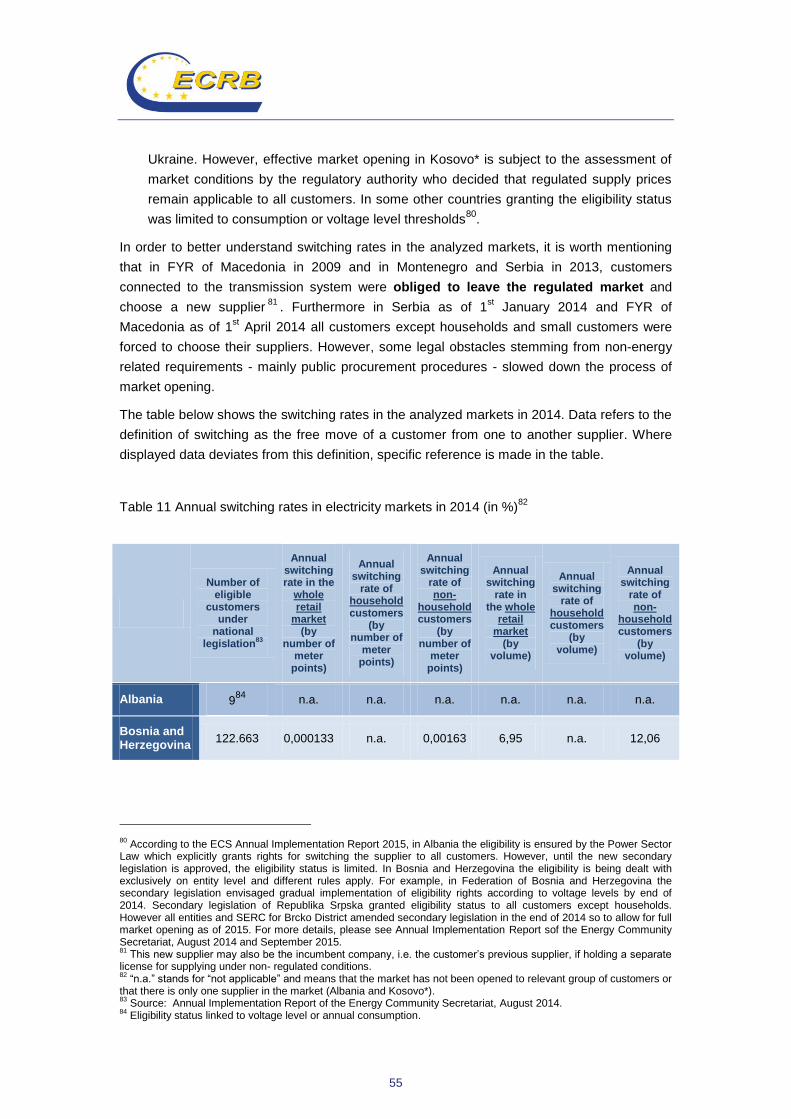
55
Ukraine. However, effective market opening in Kosovo* is subject to the assessment of
market conditions by the regulatory authority who decided that regulated supply prices
remain applicable to all customers. In some other countries granting the eligibility status
was limited to consumption or voltage level thresholds80
.
In order to better understand switching rates in the analyzed markets, it is worth mentioning
that in FYR of Macedonia in 2009 and in Montenegro and Serbia in 2013, customers
connected to the transmission system were obliged to leave the regulated market and
choose a new supplier81
. Furthermore in Serbia as of 1st January 2014 and FYR of
Macedonia as of 1st April 2014 all customers except households and small customers were
forced to choose their suppliers. However, some legal obstacles stemming from non-energy
related requirements - mainly public procurement procedures - slowed down the process of
market opening.
The table below shows the switching rates in the analyzed markets in 2014. Data refers to the
definition of switching as the free move of a customer from one to another supplier. Where
displayed data deviates from this definition, specific reference is made in the table.
Table 11 Annual switching rates in electricity markets in 2014 (in %)82
Number of eligible
customers under
national legislation
83
Annual switching rate in the
whole retail
market (by
number of meter
points)
Annual switching
rate of household customers
(by number of
meter points)
Annual switching
rate of non-
household customers
(by number of
meter points)
Annual switching
rate in the whole
retail market
(by volume)
Annual switching
rate of household customers
(by volume)
Annual switching
rate of non-
household customers
(by volume)
Albania 984
n.a. n.a. n.a. n.a. n.a. n.a.
Bosnia and Herzegovina
122.663 0,000133 n.a. 0,00163 6,95 n.a. 12,06
80 According to the ECS Annual Implementation Report 2015, in Albania the eligibility is ensured by the Power Sector
Law which explicitly grants rights for switching the supplier to all customers. However, until the new secondary legislation is approved, the eligibility status is limited. In Bosnia and Herzegovina the eligibility is being dealt with exclusively on entity level and different rules apply. For example, in Federation of Bosnia and Herzegovina the secondary legislation envisaged gradual implementation of eligibility rights according to voltage levels by end of 2014. Secondary legislation of Republika Srpska granted eligibility status to all customers except households. However all entities and SERC for Brcko District amended secondary legislation in the end of 2014 so to allow for full market opening as of 2015. For more details, please see Annual Implementation Report sof the Energy Community Secretariat, August 2014 and September 2015. 81
This new supplier may also be the incumbent company, i.e. the customer’s previous supplier, if holding a separate license for supplying under non- regulated conditions. 82
“n.a.” stands for “not applicable” and means that the market has not been opened to relevant group of customers or that there is only one supplier in the market (Albania and Kosovo*). 83
Source: Annual Implementation Report of the Energy Community Secretariat, August 2014. 84
Eligibility status linked to voltage level or annual consumption.
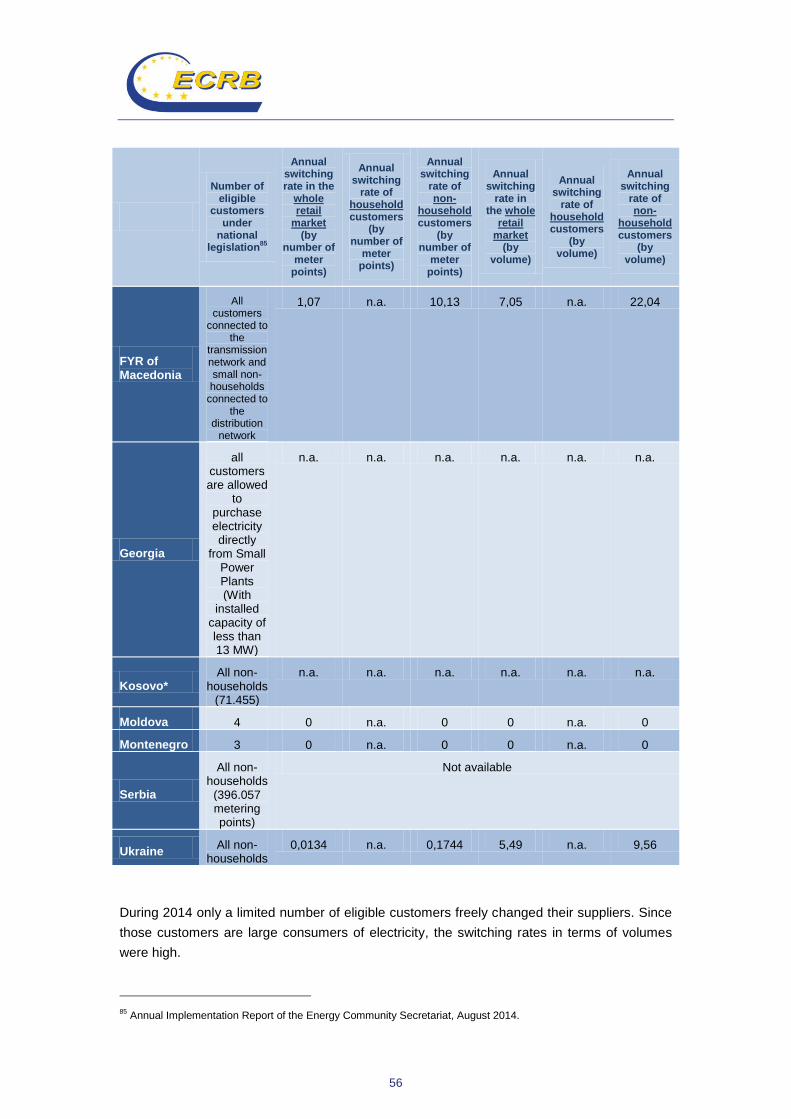
56
Number of eligible
customers under
national legislation
85
Annual switching rate in the
whole retail
market (by
number of meter
points)
Annual switching
rate of household customers
(by number of
meter points)
Annual switching
rate of non-
household customers
(by number of
meter points)
Annual switching
rate in the whole
retail market
(by volume)
Annual switching
rate of household customers
(by volume)
Annual switching
rate of non-
household customers
(by volume)
FYR of Macedonia
All customers
connected to the
transmission network and small non- households
connected to the
distribution network
1,07 n.a. 10,13 7,05 n.a. 22,04
Georgia
all customers are allowed
to purchase electricity directly
from Small Power Plants (With
installed capacity of less than 13 MW)
n.a. n.a. n.a. n.a. n.a. n.a.
Kosovo* All non-
households (71.455)
n.a. n.a. n.a. n.a. n.a. n.a.
Moldova 4 0 n.a. 0 0 n.a. 0
Montenegro 3 0 n.a. 0 0 n.a. 0
Serbia
All non- households
(396.057 metering points)
Not available
Ukraine All non-
households 0,0134 n.a. 0,1744 5,49 n.a. 9,56
During 2014 only a limited number of eligible customers freely changed their suppliers. Since
those customers are large consumers of electricity, the switching rates in terms of volumes
were high.
85 Annual Implementation Report of the Energy Community Secretariat, August 2014.

57
Due to the fact that the all customers except households and small customers were forced to
choose their suppliers in 2014 in FYR of Macedonia and Serbia, switching activities
increased in these countries. The practice in FYR of Macedonia shows that all customers on
the open market have chosen new suppliers which are not connected in any way with the
incumbent supplier active on the regulated market. On the other hand, in Serbia most of the
customers chose their previous (incumbent) supplier, i.e. did not effectively switch to another
company. However the process still has to be seen positively both in terms of raising
customers’ awareness of their rights in the open market and abolishment of regulated supply
prices.
3. End- user electricity prices
The following chapter presents the levels and structures of end-user electricity prices for
both household and industry customers in the Contracting Parties and other analyzed
markets, in the second semester of 2014.
End-user electricity prices for household customers varied substantially from around 2 EUR
cent/kWh in Ukraine to almost 12 EUR cent/kWh in Albania, which is still much lower than the
EU 28 average86
price for households in the second semester of 2014 (20,52 EUR cent/kWh).
In only two Contracting Parties, namely Albania and Montenegro, the household prices were
close to 10 EUR cent/kWh. In Bosnia and Herzegovina and FYR of Macedonia they were
slightly above 8 EUR cent/kWh, in other Contracting Parties much lower. Regulation of final
prices for households, still applied in all Energy Community Contracting Parties clearly
influences their cost reflectivity.
Table 12 Electricity prices for households in second semester of 2014, EUROSTAT Band DC: 2500kWh < consumption < 5000 kWh (EUR cent/kWh)
Electrical energy, network and non- recoverable levies
VAT and other recoverable taxes
Price with all taxes and levies included
Albania 9,67 1,93 11,60
Bosnia and Herzegovina
6,90 1,17 8,07
FYR of Macedonia87
6,66 1,20 7.86
Georgia88
5,41 0,97 6,38
86 EUROSTAT.
87 Source: ERC, recalculated to EUR based on EUROSTAT average exchange rates EUR-DEN for Q3 and Q4 2014.
88 Average electricity prices for all households, for Q4 2014 for capital city. Average price for other regions was
slightly lower- 5,76 EURc/kWh.
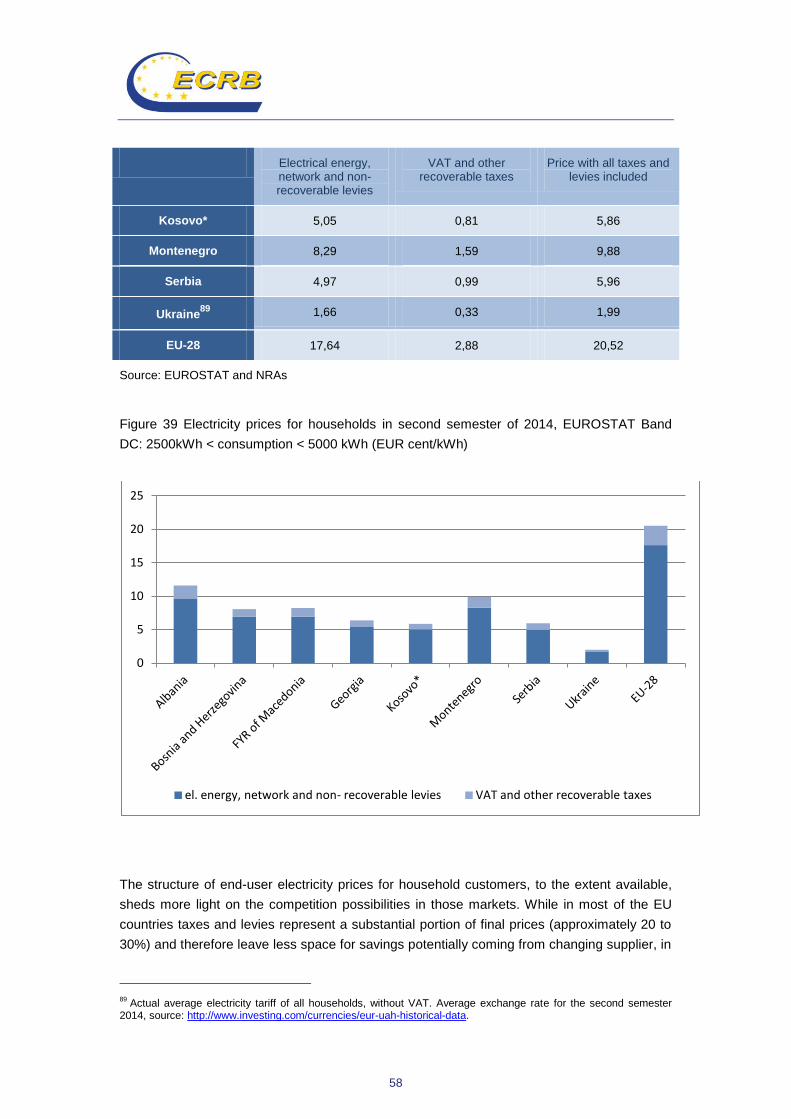
58
Electrical energy, network and non- recoverable levies
VAT and other recoverable taxes
Price with all taxes and levies included
Kosovo* 5,05 0,81 5,86
Montenegro 8,29 1,59 9,88
Serbia 4,97 0,99 5,96
Ukraine89
1,66 0,33 1,99
EU-28 17,64 2,88 20,52
Source: EUROSTAT and NRAs
Figure 39 Electricity prices for households in second semester of 2014, EUROSTAT Band
DC: 2500kWh < consumption < 5000 kWh (EUR cent/kWh)
The structure of end-user electricity prices for household customers, to the extent available,
sheds more light on the competition possibilities in those markets. While in most of the EU
countries taxes and levies represent a substantial portion of final prices (approximately 20 to
30%) and therefore leave less space for savings potentially coming from changing supplier, in
89 Actual average electricity tariff of all households, without VAT. Average exchange rate for the second semester
2014, source: http://www.investing.com/currencies/eur-uah-historical-data.
0
5
10
15
20
25
el. energy, network and non- recoverable levies VAT and other recoverable taxes

59
the Energy Community Contracting Parties the network costs have larger shares, thus
leaving contestable portions of end-user prices also on a very low level.
Table 13 Breakdown of household electricity prices into their main components (Band DC: 2500kWh < consumption < 5000 kWh (EUR cent/kWh)
Energy and supply Network costs Taxes and levies
Bosnia and Herzegovina
3.58 3,32 1,17
FYR of Macedonia 4,14 2,82 1,27
Georgia90
2,4491
2,9892
0,96
Kosovo* 2,03 2.38 1.45
Montenegro 4,00 4,45 1,22
Serbia 1,98 2,92 1,06
Source: EUROSTAT and NRAs
Figure 40 Structure of household electricity prices (Band DC: 2500kWh < consumption <
5000 kWh (EUR cent/kWh)
90 All households.
91 Including transmission charge.
92 Distribution charge.
,000
2,000
4,000
6,000
8,000
10,000
12,000
Bosnia and Herzegovina
FYR of Macedonia
Georgia Kosovo* Montenegro Serbia
Energy and supply Network charges Taxes and levies
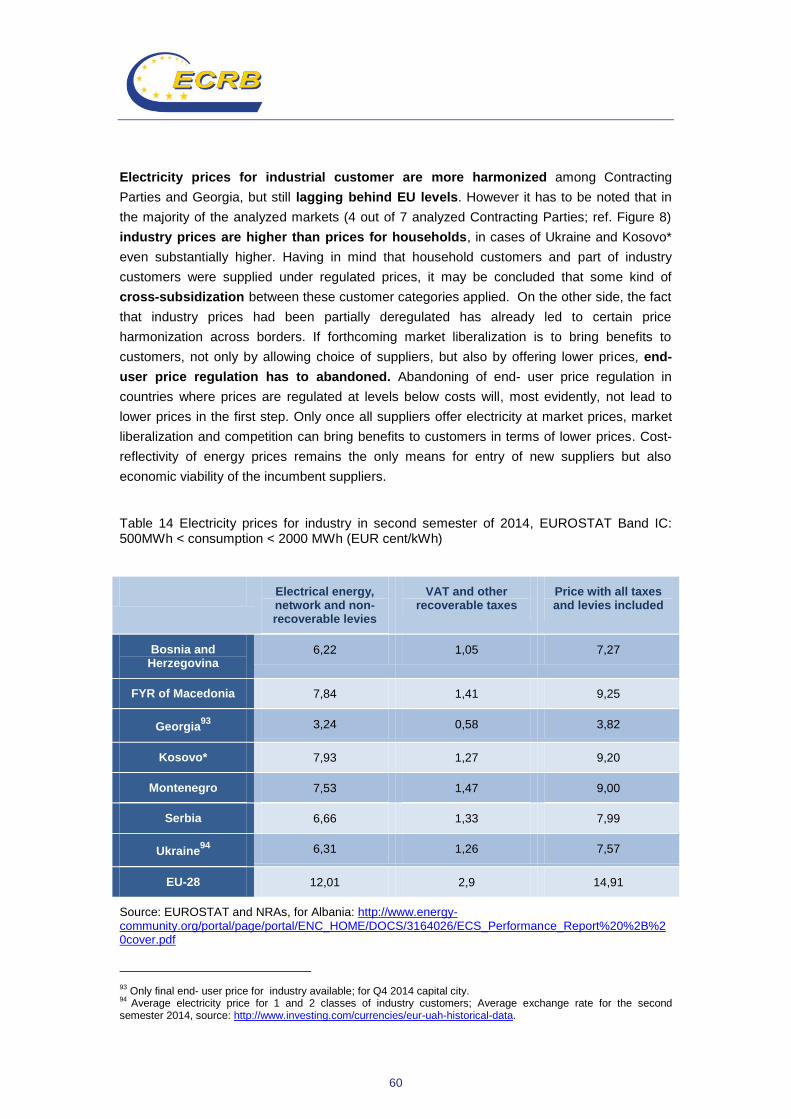
60
Electricity prices for industrial customer are more harmonized among Contracting
Parties and Georgia, but still lagging behind EU levels. However it has to be noted that in
the majority of the analyzed markets (4 out of 7 analyzed Contracting Parties; ref. Figure 8)
industry prices are higher than prices for households, in cases of Ukraine and Kosovo*
even substantially higher. Having in mind that household customers and part of industry
customers were supplied under regulated prices, it may be concluded that some kind of
cross-subsidization between these customer categories applied. On the other side, the fact
that industry prices had been partially deregulated has already led to certain price
harmonization across borders. If forthcoming market liberalization is to bring benefits to
customers, not only by allowing choice of suppliers, but also by offering lower prices, end-
user price regulation has to abandoned. Abandoning of end- user price regulation in
countries where prices are regulated at levels below costs will, most evidently, not lead to
lower prices in the first step. Only once all suppliers offer electricity at market prices, market
liberalization and competition can bring benefits to customers in terms of lower prices. Cost-
reflectivity of energy prices remains the only means for entry of new suppliers but also
economic viability of the incumbent suppliers.
Table 14 Electricity prices for industry in second semester of 2014, EUROSTAT Band IC: 500MWh < consumption < 2000 MWh (EUR cent/kWh)
Electrical energy, network and non- recoverable levies
VAT and other recoverable taxes
Price with all taxes and levies included
Bosnia and Herzegovina
6,22 1,05 7,27
FYR of Macedonia 7,84 1,41 9,25
Georgia93
3,24 0,58 3,82
Kosovo* 7,93 1,27 9,20
Montenegro 7,53 1,47 9,00
Serbia 6,66 1,33 7,99
Ukraine94
6,31 1,26 7,57
EU-28 12,01 2,9 14,91
Source: EUROSTAT and NRAs, for Albania: http://www.energy-community.org/portal/page/portal/ENC_HOME/DOCS/3164026/ECS_Performance_Report%20%2B%20cover.pdf
93 Only final end- user price for industry available; for Q4 2014 capital city.
94 Average electricity price for 1 and 2 classes of industry customers; Average exchange rate for the second
semester 2014, source: http://www.investing.com/currencies/eur-uah-historical-data.

61
Figure 41 Electricity prices for industry in second semester of 2014, EUROSTAT Band IC:
500MWh < consumption < 2000 MWh (EUR cent/kWh)
Figure 42 Comparison of end- user electricity prices for households (Band DC) and industry
(Band IC)- second semester of 2014 (EUR cent/kWh)
000
002
004
006
008
010
012
014
016
el. energy, network and non- recoverable levies VAT and other recovrable taxes
0
5
10
15
20
25
households (Band DC) industry (Band IC)
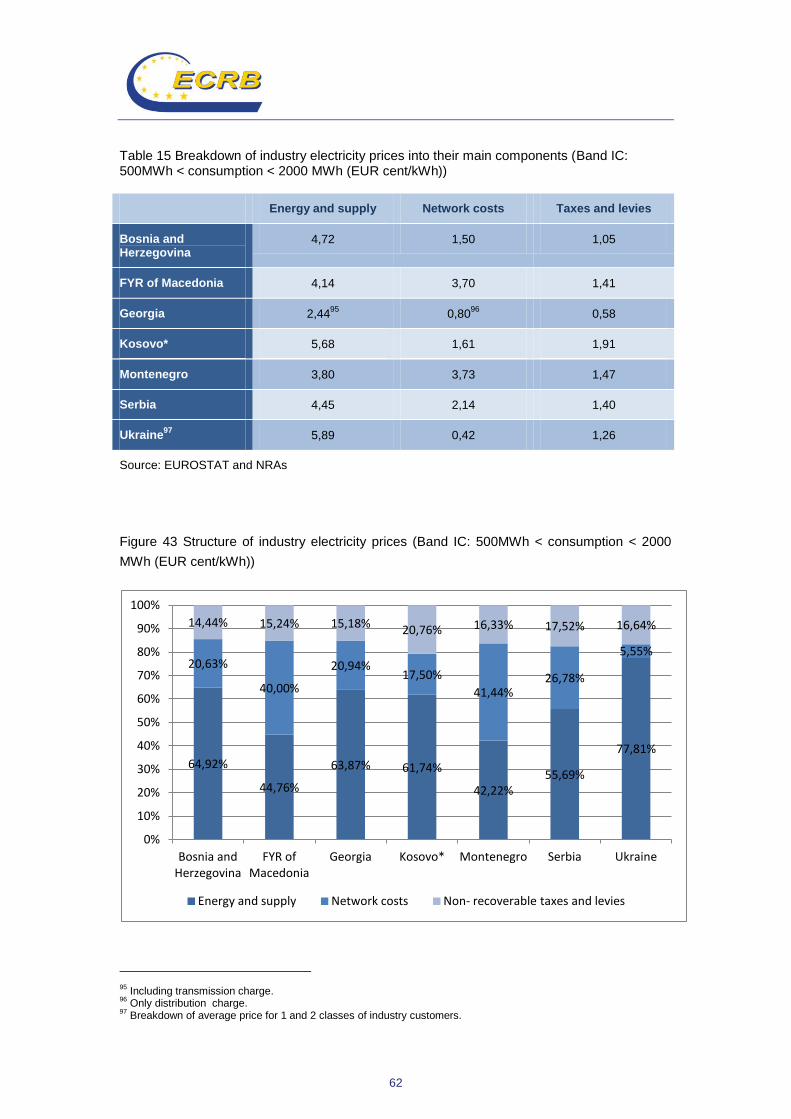
62
Table 15 Breakdown of industry electricity prices into their main components (Band IC: 500MWh < consumption < 2000 MWh (EUR cent/kWh))
Energy and supply Network costs Taxes and levies
Bosnia and Herzegovina
4,72 1,50 1,05
FYR of Macedonia 4,14 3,70 1,41
Georgia 2,4495
0,8096
0,58
Kosovo* 5,68 1,61 1,91
Montenegro 3,80 3,73 1,47
Serbia 4,45 2,14 1,40
Ukraine97
5,89 0,42 1,26
Source: EUROSTAT and NRAs
Figure 43 Structure of industry electricity prices (Band IC: 500MWh < consumption < 2000
MWh (EUR cent/kWh))
95 Including transmission charge.
96 Only distribution charge.
97 Breakdown of average price for 1 and 2 classes of industry customers.
64,92%
44,76%
63,87% 61,74%
42,22% 55,69%
77,81%
20,63%
40,00%
20,94% 17,50%
41,44% 26,78%
5,55%
14,44% 15,24% 15,18% 20,76% 16,33% 17,52% 16,64%
0%
10%
20%
30%
40%
50%
60%
70%
80%
90%
100%
Bosnia and Herzegovina
FYR of Macedonia
Georgia Kosovo* Montenegro Serbia Ukraine
Energy and supply Network costs Non- recoverable taxes and levies

63
4. Regulation of electricity end-user prices
Regulation of end-user energy prices is generally recognized as one of the main obstacles to
creating competitive and well-functioning retail markets. This is especially the case when
regulated prices are determined at levels below costs and/or when cross-subsidization
between groups of customers applies.
End-user electricity prices for household customers were regulated in all Contracting
Parties and Georgia98
in 2014.
Also the great majority of non-household customers were still supplied at regulated prices
in 2014. Although the relevant national laws proclaimed eligibility status for non-household
customers in most of the Contracting Parties, in some of the markets the possibility to change
supplier was limited by secondary legislation99
, namely in Bosnia and Herzegovina, Kosovo*
and Albania. On the other side and as described earlier, in some countries, namely FYR of
Macedonia, Montenegro and Serbia, final customers connected to the transmission network
were forced to leave the regulated market and choose a new supplier and all non-household
customers were allowed to choose their suppliers. The table below shows the number /
percentage of non-household customers were supplied at non-regulated prices in 2014.
Table 16 Number of non- households supplied at non-regulated electricity prices in 2014
Number of non- households supplied at non- regulated prices in 2014
Albania 0
Bosnia and Herzegovina
2
FYR of Macedonia 222
Georgia Exact number not known
Kosovo* 0
Montenegro 1
Serbia 57.454
Ukraine 1376
98 Household customers in Georgia are allowed to switch out of regulated prices and purchase electricity directly from
Small Power Plants (With installed capacity of less than 13 MW) with price agreed upon between the parties. 99
Annual Implementation Report of the Energy Community Secretariat, August 2014.

64
End- user electricity prices are regulated by using the following methodologies100
:
- Rate of return/cost plus in Bosnia and Herzegovina, Serbia, Georgia and Ukraine;
- Revenue cap in FYR of Macedonia, Kosovo* and Montenegro;
- Price cap in Albania.
In the process of phasing out end-user price regulation it is important to prove to customers
that the electricity price is a market-based commodity price that varies according to the
wholesale market developments. One of the most efficient tools for doing so is frequent
updating of the energy component, so to allow the final price to reflect changes in the
wholesale market. This will also offer customers the possibility to estimate if retail companies,
other than incumbent suppliers, provide cheaper energy. The energy component in the
analyzed markets receives update once a year in all Contracting Parties and in Georgia101
.
- Ukraine: monthly for customers other than households,
- Serbia: no automatic mechanism, NRA decides upon request of a supplier;
- FYR of Macedonia: no automatic mechanism, the final prices are changed by new price
setting proceedings; the need for a related price review is considered on annual basis;
- Bosnia and Herzegovina: no automatic mechanism, the final prices are changed in case
of new price setting by the regulated initiated upon request of a supplier.
Another precondition for successful transition towards complete deregulation of end- user
prices is allowing customers to switch from and to regulated prices. Customers, especially
households, typically consider regulated energy prices as more stable. If customers are not
allowed to return to regulated supply, they will most likely not be willing to change supplier at
all. This tendency increases where regulated prices are set at levels below costs. Obviously
such approach does not contribute to liquid and effective retail market development. Also the
ACER/CEER Market Monitoring Report 2013102
investigated the influence of the possibility to
switch in and out of regulated prices on switching behavior and the results showed that in
countries with regulated electricity prices where both103
preconditions for efficient transition to
deregulation are met, the switching rates were much higher.
In all Contracting Parties, except Albania, and in Georgia switching from and to regulated
prices was allowed in 2014, in some cases only for households and small enterprises104
.
100 More details on types of price regulation implemented in the Energy Community can be found in the 2013 ECRB
report “Status Review of Main Criteria for Allowed Revenue Determination for transmission, distribution and regulated supply of electricity and gas”, http://www.energy-community.org/portal/page/portal/ENC_HOME/DOCS/2768183/Criteria%20for%20Allowed%20Revenue%20Determination_approved%20by%20the%20ECRB.fin.pdf. 101
The methodology in Georgia also allows one additional energy component review in emergency situations (in 2015 this option was used due to dramatic devaluation of the national currency). 102
http://www.acer.europa.eu/Official_documents/Acts_of_the_Agency/Publication/ACER%20Market%20Monitoring%20Report%202013.pdf , pages 53-55. 103
Namely frequent review of the energy component and the possibility of switching in and out of regulated prices. 104
Bosnia and Herzegovina and Serbia.

65
B. GAS
Having in mind that Albania, Kosovo* and Montenegro do not have gas markets, this part of
the report does not include information on these three markets. For Bosnia and Herzegovina
information has not been provided, therefore the analysis, where possible, relies on the
information from 2014 and 2015 Annual Implementation Report of the Energy Community.
1. Gas retail market characteristics
The total sale of gas to final customers in the Contracting Parties decreased from 2013 to
2014 by 15,36%105
. The decrease was the highest - 16,57% in Ukraine, followed by decrease
of 15,09% in FYR of Macedonia. Decrease in Ukraine was mainly caused on purpose, with a
view to lowering import (dependence). Decrease in other countries was mainly triggered by
warm autumn/winter temperatures in 2014 and a decline of industry consumption. The figures
below present the total gas sales to final customers in 2012, 2013 and 2014, expressed
including and excluding Ukraine106
, as well as consumption growth rates by country.
Figure 44 Total sale to final gas customers in GWh
105 Decrease from 2012 to 2013 was 10, 15%.
106 With a view to provide comparability having in mind the size of the Ukraine gas market compared to those of the
other analyzed markets.
0
100.000
200.000
300.000
400.000
500.000
600.000
Bosnia and Herzegovina
FYR of Macedonia
Georgia Serbia Ukraine
1.943,12 1.256,40 18.499,00 16.084,00
418.378,55
2012
2013
2014
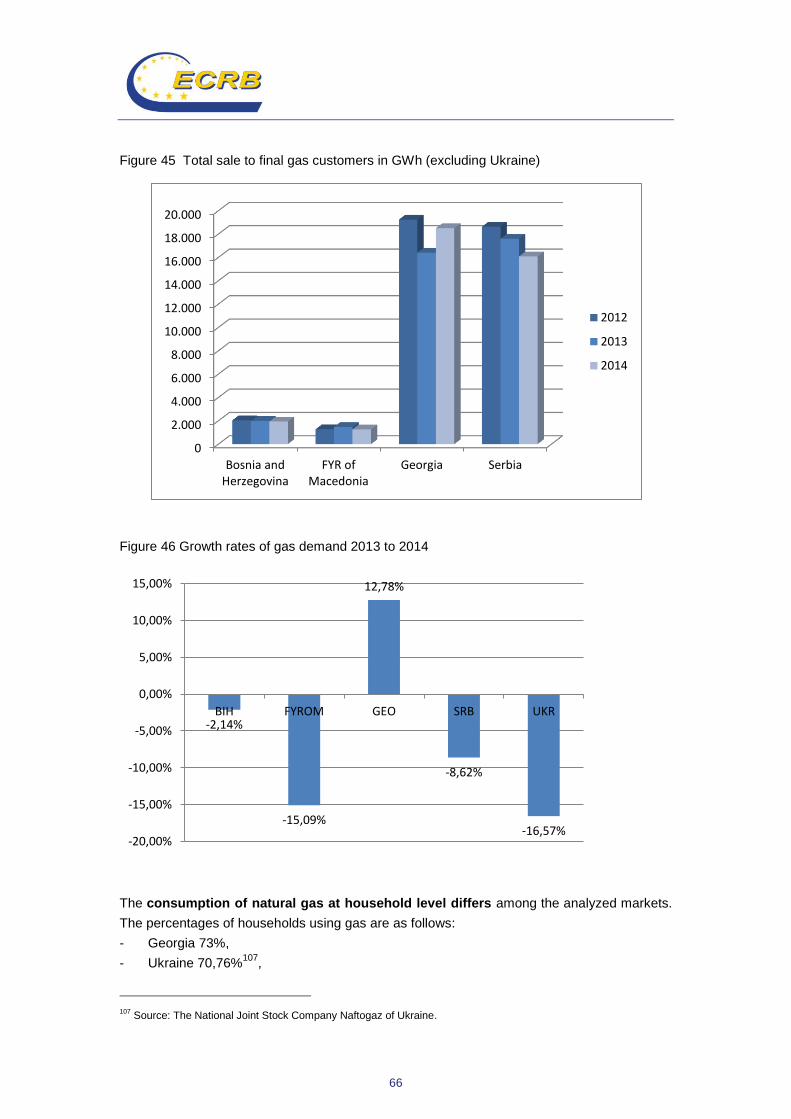
66
Figure 45 Total sale to final gas customers in GWh (excluding Ukraine)
Figure 46 Growth rates of gas demand 2013 to 2014
The consumption of natural gas at household level differs among the analyzed markets.
The percentages of households using gas are as follows:
- Georgia 73%,
- Ukraine 70,76%107
,
107 Source: The National Joint Stock Company Naftogaz of Ukraine.
0
2.000
4.000
6.000
8.000
10.000
12.000
14.000
16.000
18.000
20.000
Bosnia and Herzegovina
FYR of Macedonia
Georgia Serbia
2012
2013
2014
-2,14%
-15,09%
12,78%
-8,62%
-16,57% -20,00%
-15,00%
-10,00%
-5,00%
0,00%
5,00%
10,00%
15,00%
BIH FYROM GEO SRB UKR

67
- Serbia 10% and
- FYR of Macedonia 0,007%.
Also the average consumption of gas per household varies among countries. Relevant
quantities are displayed in the figure below.
Figure 47 Average annual gas consumption per household in kWh
End-users of gas in the Contracting Parties and Georgia were supplied mainly by regional
retail suppliers, i.e. suppliers offering gas only to a restricted area defined by their license and
usually performing also a DSO function. The number of active suppliers ranged from 4 in
Bosnia and Herzegovina and FYR of Macedonia to 36 in Serbia and 37 in Georgia. The
number of suppliers in Ukraine (350) refers to the licensed suppliers but there is no
information on number of retail suppliers practically active in the market. The number of active
nationwide suppliers108
was very low - only one in Serbia109
and FYR of Macedonia; in Bosnia
and Herzegovina all retailers supply gas regionally. In Georgia all retailers supply nationwide.
The information on nationwide suppliers for Ukraine, again, refers only to number of
nationwide licensed suppliers (301); it is expected that the number of retailers actually
supplying customers nationwide is lower.
In only two countries, Ukraine and Serbia, transmission and distribution networks were used
by more than one supplier. In FYR of Macedonia only the transmission network is used by
more than one supplier. For the purpose of facilitating the forthcoming market opening, it is of
utmost importance to enable efficient separation of supply and network activities, i.e. to allow
gas retailers to supply customers on the whole territory of a country.
108 Nationwide supplier means suppliers offering their products on the whole territory of a country.
109 40 suppliers were licensed as nationwide, but only one was nationwide active.
0,00
2.000,00
4.000,00
6.000,00
8.000,00
10.000,00
12.000,00
14.000,00
FYR of Macedonia
Georgia Serbia Ukraine
8.397,00
6.789,41 6.923,00
12.300,00
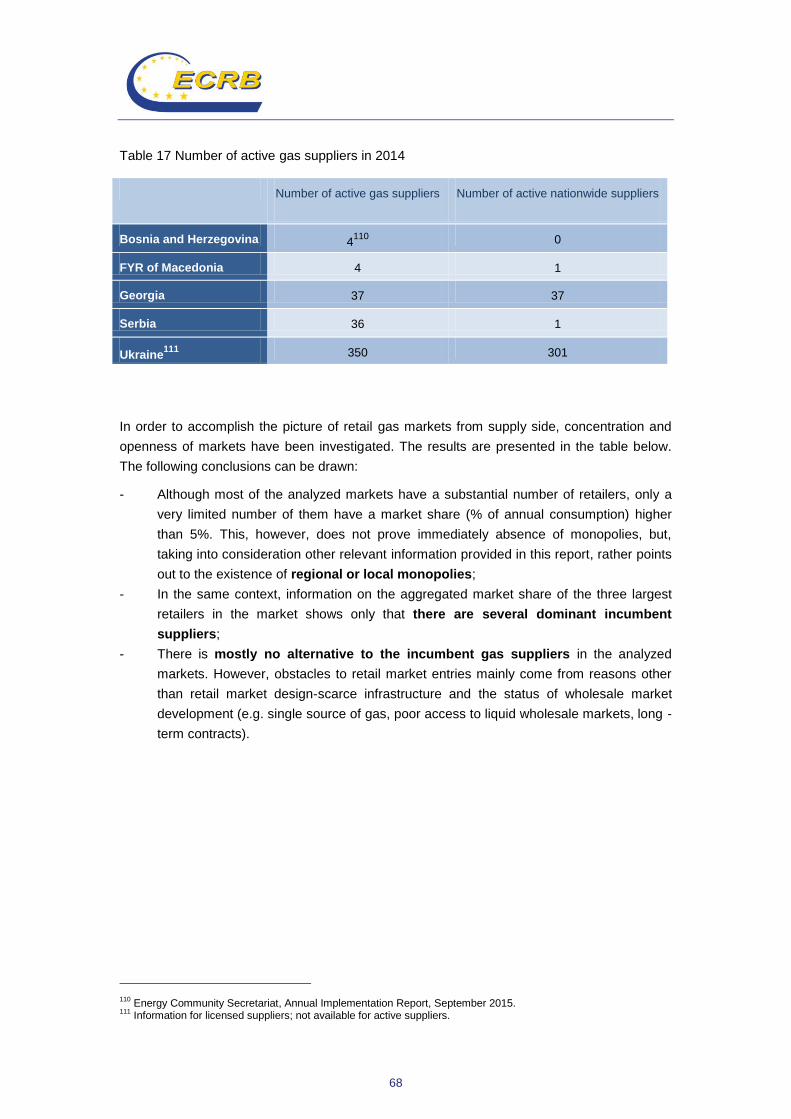
68
Table 17 Number of active gas suppliers in 2014
Number of active gas suppliers
Number of active nationwide suppliers
Bosnia and Herzegovina 4110
0
FYR of Macedonia 4 1
Georgia 37 37
Serbia 36 1
Ukraine111
350 301
In order to accomplish the picture of retail gas markets from supply side, concentration and
openness of markets have been investigated. The results are presented in the table below.
The following conclusions can be drawn:
- Although most of the analyzed markets have a substantial number of retailers, only a
very limited number of them have a market share (% of annual consumption) higher
than 5%. This, however, does not prove immediately absence of monopolies, but,
taking into consideration other relevant information provided in this report, rather points
out to the existence of regional or local monopolies;
- In the same context, information on the aggregated market share of the three largest
retailers in the market shows only that there are several dominant incumbent
suppliers;
- There is mostly no alternative to the incumbent gas suppliers in the analyzed
markets. However, obstacles to retail market entries mainly come from reasons other
than retail market design-scarce infrastructure and the status of wholesale market
development (e.g. single source of gas, poor access to liquid wholesale markets, long -
term contracts).
110 Energy Community Secretariat, Annual Implementation Report, September 2015.
111 Information for licensed suppliers; not available for active suppliers.
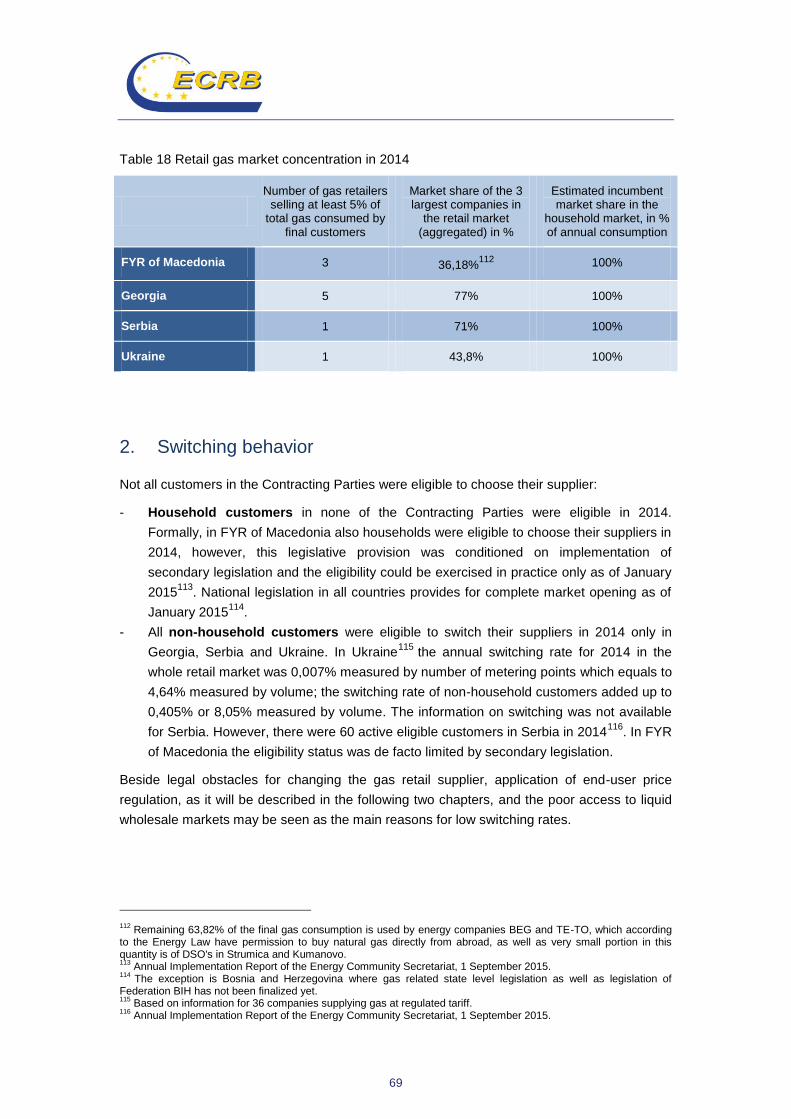
69
Table 18 Retail gas market concentration in 2014
Number of gas retailers selling at least 5% of
total gas consumed by final customers
Market share of the 3 largest companies in
the retail market (aggregated) in %
Estimated incumbent market share in the
household market, in % of annual consumption
FYR of Macedonia 3 36,18%112
100%
Georgia 5 77% 100%
Serbia 1 71% 100%
Ukraine 1 43,8% 100%
2. Switching behavior
Not all customers in the Contracting Parties were eligible to choose their supplier:
- Household customers in none of the Contracting Parties were eligible in 2014.
Formally, in FYR of Macedonia also households were eligible to choose their suppliers in
2014, however, this legislative provision was conditioned on implementation of
secondary legislation and the eligibility could be exercised in practice only as of January
2015113
. National legislation in all countries provides for complete market opening as of
January 2015114
.
- All non-household customers were eligible to switch their suppliers in 2014 only in
Georgia, Serbia and Ukraine. In Ukraine115
the annual switching rate for 2014 in the
whole retail market was 0,007% measured by number of metering points which equals to
4,64% measured by volume; the switching rate of non-household customers added up to
0,405% or 8,05% measured by volume. The information on switching was not available
for Serbia. However, there were 60 active eligible customers in Serbia in 2014116
. In FYR
of Macedonia the eligibility status was de facto limited by secondary legislation.
Beside legal obstacles for changing the gas retail supplier, application of end-user price
regulation, as it will be described in the following two chapters, and the poor access to liquid
wholesale markets may be seen as the main reasons for low switching rates.
112 Remaining 63,82% of the final gas consumption is used by energy companies BEG and TE-TO, which according
to the Energy Law have permission to buy natural gas directly from abroad, as well as very small portion in this quantity is of DSO's in Strumica and Kumanovo. 113
Annual Implementation Report of the Energy Community Secretariat, 1 September 2015. 114
The exception is Bosnia and Herzegovina where gas related state level legislation as well as legislation of Federation BIH has not been finalized yet. 115
Based on information for 36 companies supplying gas at regulated tariff. 116
Annual Implementation Report of the Energy Community Secretariat, 1 September 2015.

70
3. End-user gas prices
This chapter presents the levels and structures of end-user gas prices for both household
and industry customers in the Contracting Parties and Georgia in the second semester of
2014.
End-user gas prices for household customers in the Contracting Parties and Georgia vary
substantially, from less than 1 EUR cent/kWh in Ukraine117
to approximately 5 EUR
cent/kWh in Bosnia and Herzegovina. The EU-28 average118
gas price for households in the
second semester of 2014 was 7,19 EUR cent/kWh. The household prices Serbia are similar
to those in Bosnia and Herzegovina, and the gas prices for residential customers in Georgia
are very low on average - 2,08 EUR cent/kWh. The main reason for low gas prices for
household customers in Ukraine is the low price of domestic production that is dedicated to
supply of households. The low import price in Georgia in comparison to higher import prices
in Bosnia and Herzegovina and Serbia certainly also play an important role. Finally the
regulation of end-user prices for households still applied in all Contracting Parties119
and
clearly influences their cost reflectivity.
Table 19 Gas prices for households, EUROSTAT Band D2: 20GJ < consumption < 200 GJ (EUR cent/kWh)
Gas, network and non- recoverable levies
VAT and other recoverable taxes
Price with all taxes and levies included
Bosnia and Herzegovina
4,39 0,73 5,12
Georgia120
1,76 0,32 2,08
Serbia 4,10 0,41 4,51
Ukraine121
0,53 0,10 0,63
EU-28 6,20 0,99 7,19
Source: EUROSTAT and NRAs
117 It is worth noting that end-user prices for households substantially increased in 2015.
118 Source: EUROSTAT.
119 Details on end- user price regulation are described in the following chapter.
120 Weighted average price for all households. Prices for the supplier of last resort in the capital city.
121 Weighted average price for all households; Average exchange rate for the second semester 2014, source:
http://www.investing.com/currencies/eur-uah-historical-data.

71
Figure 48 Gas prices for households, EUROSTAT Band D2: 20GJ < consumption < 200 GJ
(EUR cent/kWh)
The structure of end-user prices for gas household customers is available only for
Ukraine and, partially, Georgia. The share of network costs in the end-user price for
households is 28,6% in Ukraine and 28,4% in Georgia, whereby the network share for
Georgia refers only to distribution charge.
Gas prices for industry were more harmonized among analyzed markets, in some cases
higher than EU average gas price. However it has to be noted that in majority of the analyzed
markets (Bosnia and Herzegovina, Georgia and Ukraine) industry prices were higher than
prices for households, in cases of Ukraine and Georgia even substantially higher. Having in
mind that the great majority of customers, both household and industry, were supplied under
regulated prices. It can be consequently concluded that a certain level of cross-
subsidization between these customer categories applied. On the other side, the fact that
industry prices had been partially deregulated has already led to certain price harmonization.
If forthcoming market liberalization is to bring benefits to customers, not only by allowing
choice of suppliers, but also offering the lower prices, end-user price regulation has to be
abandoned. Abandoning of end- user price regulation in countries where prices are regulated
at levels below costs will, most evidently, not lead to lower prices in the first step. Only once
all suppliers offer gas at market prices, market liberalization and competition can bring
benefits to customers in terms of lower prices. Cost-reflectivity of energy prices remains one
the most important means for entry of new suppliers but also economic viability of the
incumbent suppliers.
000
001
002
003
004
005
006
007
008
Bosnia and Herzegovina
Georgia Serbia Ukraine EU-28
gas, network and non- recoverable levies VAT and other recoverable taxes

72
Table 20 Gas prices for industry, EUROSTAT Band I3: 10 000 GJ < consumption < 100 000 GJ (EUR cent/kWh)
Gas, network and non- recoverable
levies
VAT and other recoverable taxes
Price with all taxes and levies included
Bosnia and Herzegovina
5,31 0,90 6,21
FYR of Macedonia 4,22 0,76 4,98
Georgia122
2,76 0,49 3,25
Serbia 3,83 0,38 4,21
Ukraine123
2,80 0,56 3,36
EU-28 3,69 0,74 4,43
Source: EUROSTAT and NRAs
Figure 49 Gas prices for industry, EUROSTAT Band I3: 10 000 GJ < consumption < 100 000
GJ (EUR cent/kWh)
122 Weighted average for all industry customers.
123 Weighted average for all non- household customers.
,000
1,000
2,000
3,000
4,000
5,000
6,000
7,000
Bosnia and Herzegovina
FYR of Macedonia
Georgia Serbia Ukraine EU-28
gas and non- recoverable levies VAT and other recoverable taxes

73
Figure 50 Comparison of end- user gas prices for households (Band D2) and industry (Band
I3)- second semester of 2013 (EUR cent/kWh)
The structure of end-user prices for industry customers is available only for Ukraine and,
partially, Georgia. The share of network costs in the end-user price for all non- households is
5,39% in Ukraine and 2,39% in Georgia, whereby the network share for Georgia refers only to
distribution charge.
4. End- user gas price regulation
Regulation of end-user energy prices is generally recognized as one of the main obstacles to
creating competitive and well-functioning retail markets. This is especially the case when
regulated prices are determined at levels below costs and/or when cross-subsidization
between groups of customers exists.
End-user gas prices for household customers were regulated in all Contracting Parties in
2014, with the exception of FYR of Macedonia, where only a limited number of households124
was supplied at non-regulated prices. In Georgia household customers connected to the grid
after 2007 are supplied under non-regulated prices. However 84% of residential consumers
were supplied under partly regulated prices, consuming 93% of gas supplied to residential
consumers.
124 37 household customers.
000
001
002
003
004
005
006
007
008
Bosnia and Herzegovina
FYR of Macedonia
Georgia Serbia Ukraine EU-28
Household prices Industry prices
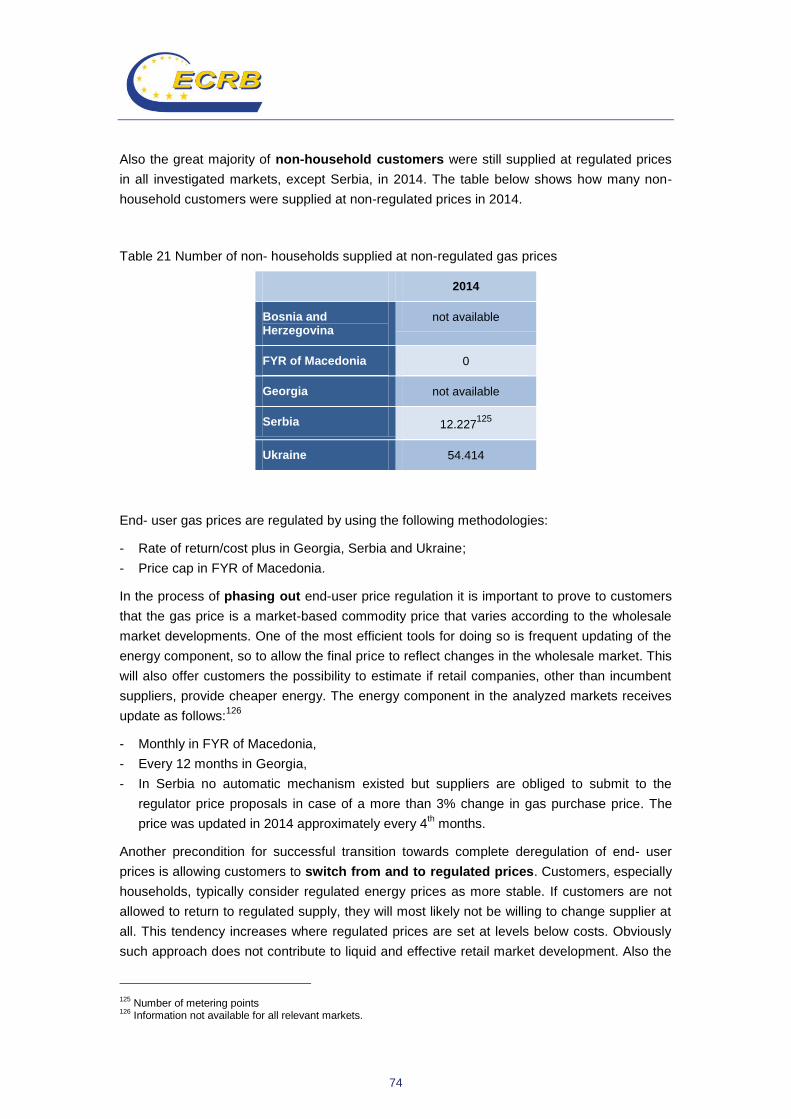
74
Also the great majority of non-household customers were still supplied at regulated prices
in all investigated markets, except Serbia, in 2014. The table below shows how many non-
household customers were supplied at non-regulated prices in 2014.
Table 21 Number of non- households supplied at non-regulated gas prices
2014
Bosnia and Herzegovina
not available
FYR of Macedonia 0
Georgia not available
Serbia 12.227125
Ukraine 54.414
End- user gas prices are regulated by using the following methodologies:
- Rate of return/cost plus in Georgia, Serbia and Ukraine;
- Price cap in FYR of Macedonia.
In the process of phasing out end-user price regulation it is important to prove to customers
that the gas price is a market-based commodity price that varies according to the wholesale
market developments. One of the most efficient tools for doing so is frequent updating of the
energy component, so to allow the final price to reflect changes in the wholesale market. This
will also offer customers the possibility to estimate if retail companies, other than incumbent
suppliers, provide cheaper energy. The energy component in the analyzed markets receives
update as follows:126
- Monthly in FYR of Macedonia,
- Every 12 months in Georgia,
- In Serbia no automatic mechanism existed but suppliers are obliged to submit to the
regulator price proposals in case of a more than 3% change in gas purchase price. The
price was updated in 2014 approximately every 4th months.
Another precondition for successful transition towards complete deregulation of end- user
prices is allowing customers to switch from and to regulated prices. Customers, especially
households, typically consider regulated energy prices as more stable. If customers are not
allowed to return to regulated supply, they will most likely not be willing to change supplier at
all. This tendency increases where regulated prices are set at levels below costs. Obviously
such approach does not contribute to liquid and effective retail market development. Also the
125 Number of metering points
126 Information not available for all relevant markets.

75
ACER/CEER Market Monitoring Report 2012127
investigated the influence of the possibility to
switch in and out of regulated prices on switching behavior and the results showed that in
countries with regulated gas prices where both128
preconditions for efficient transition to
deregulation are met, the switching rates were much higher.
Among the markets analyzed in this report, only in Serbia129
and Ukraine switching in and out
of regulated prices was allowed.
127
http://www.acer.europa.eu/Official_documents/Acts_of_the_Agency/Publication/ACER%20Market%20Monitoring%20Report%202013.pdf , pages 53-55. 128
Namely frequent review of the energy component and the possibility of switching in and out of regulated prices. 129
Only for households and small customers.

76
CONSUMER PROTECTION AND CUSTOMER EMPOWERMENT
1. Background
Well functioning of retail electricity and gas markets means that consumers have continuous
access to energy and benefit from competition, as well as that their rights are guaranteed and
strengthened. Therefore 3rd
Energy Package outlines a set of measures which aim to:
- Ensure continuous supply of electricity and gas and address energy poverty;
- Define concept of vulnerable customers and means for their protection;
- Ensure participation of customers in liberalized energy market by providing necessary
information to customers, in a transparent way and free of charge, related to metering
and billing, contractual terms and conditions, switching supplier, dispute settlement
etc.
This chapter monitors household consumer protection according to the relevant provisions of
the Electricity and Gas Directives. More precisely, it explores how these provisions have been
transposed into national legislation, i.e. how the national legal frameworks protect household
consumers.
The topics covered in this chapter are:
- Supplier of last resort and disconnections;
- Vulnerable customers;
- Consumer information;
- Complaint handling and dispute resolution.
2. Supplier of last resort and disconnections
The Electricity Directive requires that all household customers enjoy universal service, namley
the right to be supplied with electricity of a specified quality at reasonable, easily comparable,
transparent and non- discriminatory prices. This may be ensured by appointing a supplier of
last resort. The Gas Directive does not recognize the term “universal service”. However, a
supplier of last resort for customers connected to the gas system may be appointed. None of
the Directives explains which functions the supplier of last resort has. The ACER/CEER
Market Monitoring Report 2013130
identified a list of functions that electricity and gas suppliers
130 ACER/CEER Annual Report on the Results of Monitoring the Internal Electricity and Natural Gas markets in 2013,
http://www.acer.europa.eu/Official_documents/Acts_of_the_Agency/Publication/ACER_Market_Monitoring_Report_2014.pdf.

77
of last resort have in EU Member States. The table below summarizes which of these
functions are applicable in the Energy Community Contracting Parties and Georgia.
Table 22 Functions of the supplier of last resort in the Energy Community – 2014
In which circumstances may a household customer turn to the "supplier of last resort" to ensure continuous energy supply?
Number of countries- electricity
Number of countries- gas
If a household customer does not find supplier on the market
5 2
If a household customer is dropped by its current supplier because of non- payment
3 1
The current supplier has gone bankrupt and is no longer doing business
5 3
The license of the current supplier has been revoked 4 3
If a final household customer does not choose a supplier at market opening
4 2
If a fix- term supply contract expires 4 2
Other reasons 1
There is no supplier of last resort in the country 1131
0
A supplier of last resort was appointed in 2014 for electricity and gas132
in all
Contracting Parties but very often operated under another name (e.g. guaranteed supplier
of electricity in Ukraine or reserve supplier in Serbia). In Albania the wholesale electricity
supplier had functions of a supplier of last resort in 2014. The table above shows that the
electricity supplier of last resort usually supplied customers in case they did not find an
alternative supplier on the market or remained inactive after market opening (this function
may be also considered as default supply) or in case their supplier did not perform its function
any more (e.g. because of bankruptcy or the license has been revoked). In Montenegro, the
function of a supplier of last resort was defined more generally.
Besides having secure energy supply, it is important for consumers to know under which
circumstances they can be disconnected from the network and what is the procedure for
connecting them again after the reasons for disconnection are removed. The Electricity and
Gas Directives specify that a prohibition of disconnection may be a tool for protecting
vulnerable customers but do not include disconnection related requirements for energy
131 In Albania the wholesale supplier has the function of supplier of last resort.
132 Where gas market exists.
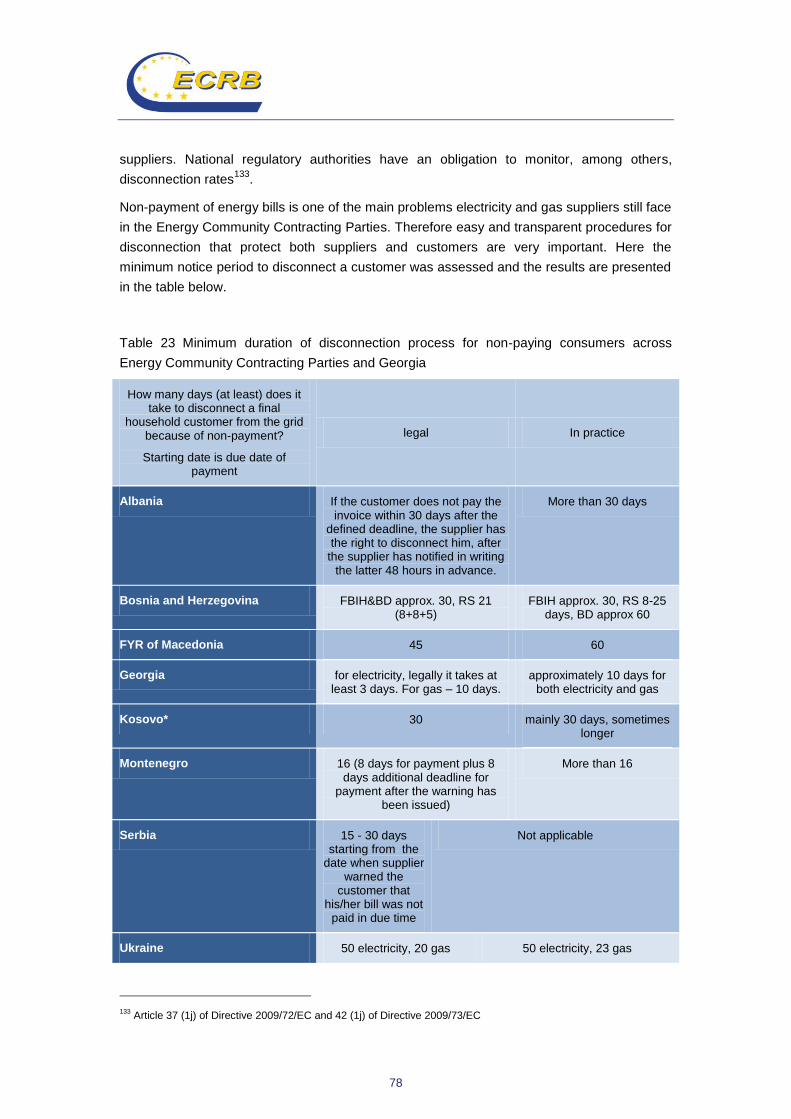
78
suppliers. National regulatory authorities have an obligation to monitor, among others,
disconnection rates133
.
Non-payment of energy bills is one of the main problems electricity and gas suppliers still face
in the Energy Community Contracting Parties. Therefore easy and transparent procedures for
disconnection that protect both suppliers and customers are very important. Here the
minimum notice period to disconnect a customer was assessed and the results are presented
in the table below.
Table 23 Minimum duration of disconnection process for non-paying consumers across
Energy Community Contracting Parties and Georgia
How many days (at least) does it take to disconnect a final
household customer from the grid because of non-payment?
Starting date is due date of payment
legal In practice
Albania If the customer does not pay the invoice within 30 days after the
defined deadline, the supplier has the right to disconnect him, after
the supplier has notified in writing the latter 48 hours in advance.
More than 30 days
Bosnia and Herzegovina FBIH&BD approx. 30, RS 21 (8+8+5)
FBIH approx. 30, RS 8-25 days, BD approx 60
FYR of Macedonia 45 60
Georgia for electricity, legally it takes at least 3 days. For gas – 10 days.
approximately 10 days for both electricity and gas
Kosovo* 30 mainly 30 days, sometimes longer
Montenegro 16 (8 days for payment plus 8 days additional deadline for
payment after the warning has been issued)
More than 16
Serbia 15 - 30 days starting from the
date when supplier warned the
customer that his/her bill was not
paid in due time
Not applicable
Ukraine 50 electricity, 20 gas 50 electricity, 23 gas
133 Article 37 (1j) of Directive 2009/72/EC and 42 (1j) of Directive 2009/73/EC

79
The minimal number of days that are legally envisaged between the payment due date and
actual disconnection of a customer is usually 30-50 days. This period includes deadlines for
payment of the bill, warning after non-payment, usually with an extension of the payment
deadline and, if applicable, announcement of disconnection134
. The actual duration of a
disconnection usually takes longer than legally binding deadlines.
Finally, for the countries where such information is available, a share of disconnections of
household customers due to non-payment of electricity bills is shown in the figure below.
Figure 51 Share of household disconnections due to non-payment in % of household
metering points135136
- electricity- 2014
The share of household disconnections due to non-payment for electricity in the
Contracting Parties varies substantially among countries. While the percentages in Bosnia
and Herzegovina, FYR of Macedonia and Ukraine are similar to those of the majority EU
Member States137
, the shares of household disconnections in Montenegro and Serbia are
higher. The rate of household disconnections in Kosovo* is extremely high138
, witnessing
historically high rate of non-payments. In 2014 there were 4 888 607 electricity bills generated
134 Announcement of disconnection is sometimes not sent separately, but it is part of a warning.
135 For Macedonia the % refers to both household and non- household disconnections.
136 The share is calculated by dividing the number of household disconnections in 2014 with the number of household
metering points. It assumes that some households could be disconnected more than once during the year. 137
Usually lower than 2% (ACER/CEER Annual Report on the Results of Monitoring the Internal Electricity and Natural Gas markets in 2013, p.208). 138
For illustration reasons: number of household disconnections in Kosovo* was more than 350.000 in 2014, while in Ukraine this number was around 320.000.
1,170% 1,760%
85,220%
7,000% 6,300% 1,940%
,000%
10,000%
20,000%
30,000%
40,000%
50,000%
60,000%
70,000%
80,000%
90,000%
Bosnia and Herzegovina
FYR of Macedonia
Kosovo* Montenegro Serbia Ukraine
80
to household customers. Total number of household disconnections for 2014 was 351 201. If
one compares the total number of disconnections with the total number of bills generated for
household the yearly disconnection percentage adds up to 7.18%.
The shares of household disconnections due to non-payment of gas were available only
for Bosnia and Herzegovina - Republika Srpska entity (0,70%) and Ukraine (0,95%). These
figures are similar to those in the EU Member States and generally prove the higher payment
of gas bills in comparison to electricity bills.
3. Vulnerable customers
According to Article 3 of both the Electricity and Gas Directive adequate safeguards to protect
vulnerable customers should be in place. In this context each country should define the
concept of vulnerable customers and ensure that rights and obligations linked to vulnerable
customers are applied.
The Contracting Parties in the majority of cases included a definition of vulnerable customers
as well as the measures for their protection in the relevant legislative frameworks, even if not
always precisely in line with the requirements of the Directives. Some of the Contracting
Parties defined vulnerable customers in their energy related laws, while others have some
kind of recognition of tvulnerable customers in their general social protection schemes139
.
There are different criteria applied for defining which customer categories have a right to use
energy related support schemes. Typically, low level of income and health or disability of
persons or their family members serves as criteria for obtaining the status of a vulnerable
customer.
Different approaches to protecting vulnerable customers have been chosen. The table below
summarizes measures used for protection of vulnerable customers in the Contracting Parties
and Georgia in 2014.
139 For more information see ECRB 2013 report “Treatment of vulnerable customers in the Energy Community”,
https://www.energy-community.org/portal/page/portal/ENC_HOME/DOCS/2124179/Treatment_of_Vulnerable_Customers_2013_update_approved_by_ECRB.pdf .

81
Table 24 Measures to protect vulnerable customers in the Contracting Parties and Georgia -
2014
Measures to protect vulnerable customers Number of countries- electricity
Number of countries- gas
Restrictions on disconnection due to non- payment 3 1
Earmarked social benefits to cover (unpaid) energy expenses
5 2
Special energy prices for vulnerable customers - -
Additional social benefits to cover (unpaid) energy expenses (non- earmarked financial means)
- -
Free energy- saving advice to vulnerable customers 2 1
Right to deferred payment (if applied, please explain the way it is deferred)
3 1
Exemption from some components of final customer energy costs (e.g. energy price, network tariffs, taxes, levies…
- -
Financial grants for the replacement of inefficient appliances
1 -
Free basic supply of energy (if applied, please explain how (e.g. how much energy is free of charge)
1 1
Other 2 -
Measures for protections of vulnerable customers were much more used for electricity than
gas. The most spread measure was earmarked social benefit to cover energy expenses,
applied in 5 out of 8 analyzed markets. Other measures often used were restrictions on
disconnection due to non-payment and right to deferred payment.
Some details on specific protection measures are the following:
Serbia: vulnerable customers were granted the right of free supply of 120-250 kWh of
electricity and 35-75 m3 of gas, depending on number of household members
(vulnerable customer have to chose only one support – for electricity or gas).
Albania: the prices structure of 2015 removed the two blocks tariff system and the
difference in price between the existing price (in 2014) and the price defined for 2015.
(648 leke/month – 4,62 €/month140
) was compensated from the state budget directly
to the customers.
140 Recalculated based on the exchange rate on 31
st December 2014 (1EUR=140,14 leke), National Bank of Albania:
https://www.bankofalbania.org/web/Exchange_Rates_2014_2.php.
82
Kosovo*: when deciding on disconnections, electricity suppliers had to take into
account the decision taken by the national regulator on the protection of vulnerable
customers, in order to avoid disconnections during the winter period.
Georgia: if disconnection would pose a threat to human health or life, a licensee must
defer payment for a reasonable period of time (gas - no more than 3 months;
electricity - at least 1 month).
Ukraine: electricity related legislation has not defined the concept of vulnerable
consumers. However for all household customers disconnections were prohibited
before the weekend and holidays. Household customers also had the right to
earmarked social benefits to cover energy bills for both electricity and gas (in case of
compliance with the conditions of appointment and granting subsidies for
reimbursement of payments for utility services). In case electricity customers did not
have funds to pay the debt, they had to apply to the energy supplier for scheduling
repayment or deferred payment period and provide a certificate confirming his
insolvency. For gas, legislation approved in 2015 envisaged preparation of definition
of vulnerable customers as well as adequate protection measures.
Montenegro: supports for all endangered categories of 40% of the billed amount if
below 60 €, for bills of more 60 the support was fixed with 24 € financed by the
government.
Bosnia and Herzegovina: distributor and supplier had to take appropriate measures to
avoid the disconnection due to non-payment. In Republika Srpska and Brcko District
restrictions on disconnection during the winter and extreme cold weather existed but
the suspension of delivery can still be a final measure. In Federation BIH restrictions
on disconnection of life supporting equipment existed. Also, there were restrictions on
disconnection in the Federation BIH before and during public holiday, as well as on
Friday and during weekends. In addition to this, the governments of Federation BIH
and Brcko District had programs to support vulnerable customers from their budgets.
The share of vulnerable customers out of the total number of household metering points
shows whether the definition of vulnerable customers is well targeted or not. The figure below
shows these shares calculated for 31st December 2014.

83
Figure 52 Share of vulnerable customers in the Contracting Parties (in % of household
metering points, status on 31st December 2014)
4. Customer information
Transparent and reliable information to customers is one of the most important preconditions
for customers’ active participation in energy market. The Electricity and Gas Directives
comprise many provisions that require proper informing of customers on prices, bills,
switching, dispute settlement and rights and obligations of customers in general141
. This
chapter deals not only with compliance with legal requirements of the Directives related to
provision of information to consumers but also with good practices going beyond them.
Consumers should receive transparent information on applicable electricity and gas prices.
This means also that they need to be informed in advance about the change in energy
prices. In the majority of the analyzed markets there is a legal requirement for information to
household consumers on price changes, including the provision on minimal number of days
for informing consumers before the new prices apply. Only in FYR of Macedonia there is no
such requirement. The figure below shows how many days in advance households have to be
informed at minimum about the electricity and gas price changes.
141 Article 3 and Annex I of Directives 2009/72/EC and 2009/73/EC.
24,000%
5,860% 7,390%
8,210%
4,850%
2,000%
,000%
5,000%
10,000%
15,000%
20,000%
25,000%
30,000%
Albania Bosnia and Herzegovina
FYR of Macedonia
Kosovo* Montenegro Serbia

84
Figure 53 Minimal number of days in advance that household consumers are informed about
energy price changes142
In most of the countries the household consumers have to be informed about the price
change at least 15 days in advance. In Kosovo* and Georgia these deadlines are longer - 30
and 60 days respectively, while in Ukraine the legal requirement for informing households in
advance about the price change was only 5 days. In order to allow consumers to actively
participate in energy markets - in this case to investigate other offers and eventually change
supplier, the information on price change should be provided in advance enough143
(e.g.30
days).
Electricity and gas bills are the primary source of information to customers, therefore their
content needs to be carefully prepared - relevant, clear and concise. In all analyzed Energy
Community energy markets, except Ukraine, the content of electricity and gas bills was
prescribed, usually by supply rules. In Kosovo* the supplier was obliged to prepare the
standard form of bill that is to be approved by the regulator. The figure below shows which
information can be found on energy bills in the Contracting Parties and Georgia.
142 The information for Bosnia and Herzegovina refers only to Republika Srpska entity; in other entities the legislation
requires only that customers are appropriately informed in advance about the price change. 143
In some more developed EU markets, where consumers may conclude contracts with fixed or variable energy prices, legal requirements for informing consumers in advance differ according to the type of pricing chosen. Of course, if a consumer has chosen variable energy pricing, the prices will vary frequently and the information on price change may be provided only in a short term. For more information, please see ACER/CEER Market Monitoring Report 2014.
0 10 20 30 40 50 60 70
Albania
Bosnia and Herzegovina
Georgia
Kosovo*
Montenegro
Serbia
Ukraine
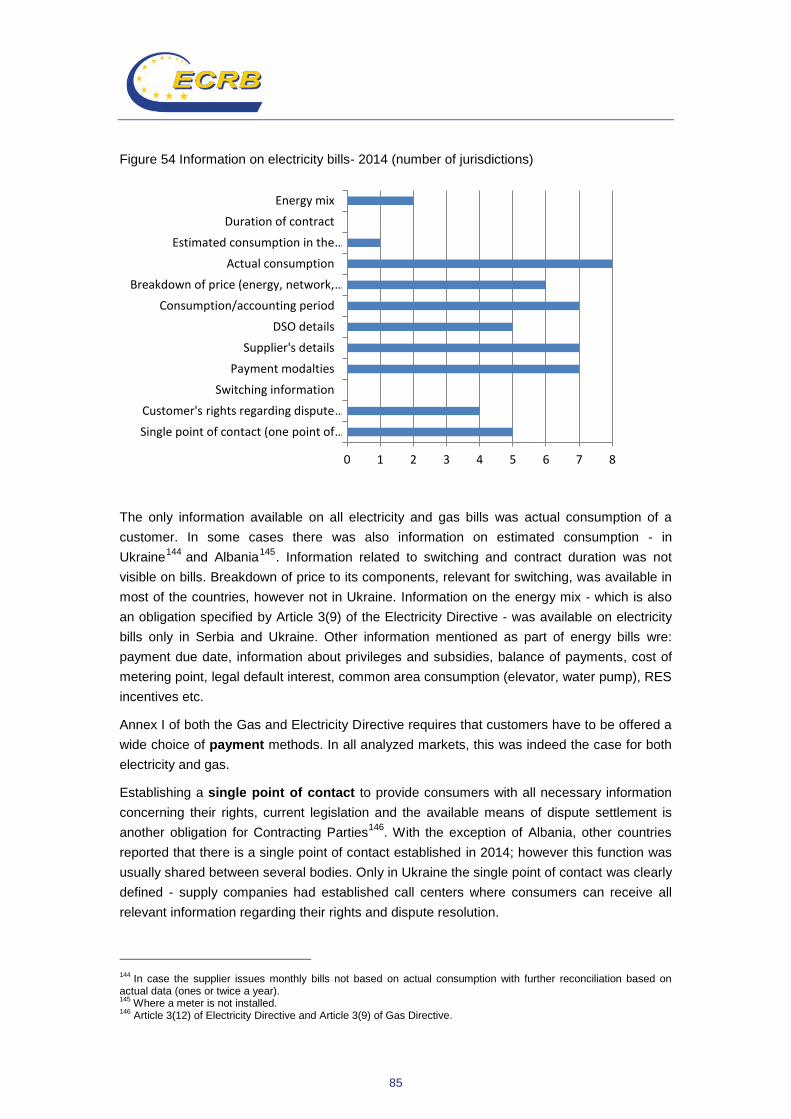
85
Figure 54 Information on electricity bills- 2014 (number of jurisdictions)
The only information available on all electricity and gas bills was actual consumption of a
customer. In some cases there was also information on estimated consumption - in
Ukraine144
and Albania145
. Information related to switching and contract duration was not
visible on bills. Breakdown of price to its components, relevant for switching, was available in
most of the countries, however not in Ukraine. Information on the energy mix - which is also
an obligation specified by Article 3(9) of the Electricity Directive - was available on electricity
bills only in Serbia and Ukraine. Other information mentioned as part of energy bills wre:
payment due date, information about privileges and subsidies, balance of payments, cost of
metering point, legal default interest, common area consumption (elevator, water pump), RES
incentives etc.
Annex I of both the Gas and Electricity Directive requires that customers have to be offered a
wide choice of payment methods. In all analyzed markets, this was indeed the case for both
electricity and gas.
Establishing a single point of contact to provide consumers with all necessary information
concerning their rights, current legislation and the available means of dispute settlement is
another obligation for Contracting Parties146
. With the exception of Albania, other countries
reported that there is a single point of contact established in 2014; however this function was
usually shared between several bodies. Only in Ukraine the single point of contact was clearly
defined - supply companies had established call centers where consumers can receive all
relevant information regarding their rights and dispute resolution.
144 In case the supplier issues monthly bills not based on actual consumption with further reconciliation based on
actual data (ones or twice a year). 145
Where a meter is not installed. 146
Article 3(12) of Electricity Directive and Article 3(9) of Gas Directive.
0 1 2 3 4 5 6 7 8
Single point of contact (one point of …
Customer's rights regarding dispute …
Switching information
Payment modalties
Supplier's details
DSO details
Consumption/accounting period
Breakdown of price (energy, network, …
Actual consumption
Estimated consumption in the …
Duration of contract
Energy mix
86
The possibility to efficiently change electricity and gas supplier is an important tool for
consumers to exercise their power in the energy market and benefit from competition.
Therefore it is not only crucial to enable and facilitate supplier switching, but also to provide
information to consumers on how to do it. The Electricity and Gas Directive require that
switching is done within 3 weeks and that the final closure account is available not later than 6
weeks after the switching is performed. Although in several Contracting Parties supplier
switching is not possible because there is no alternative supplier in the market, the rules for
switching have been approved in majority of them, usually correctly transposing the timing
requirements of the Directives147
. The switching process may be stopped due to some
prescribed reasons in most of the countries148
as the examples hereinafter illustrate:
Serbia: non- payment of a bill and non-payment of damage claim in case of contract
termination when duration of contracted supply is fixed;
FYR of Macedonia: in the case if non-payment of electricity bills to the incumbent
supplier and costs to DSO, TSO and Market Operator;
Kosovo*: in cases when current supplier rightly considers that, in the proposed
transfer date, the customer is not eligible customer or is still obliged under the
contract with the current supplier;
Ukraine: 1. debt of customer under the supply contract; 2. the system of commercial
metering customer does not meet the requirements necessary to switch supplier; 3.
failure to submit the necessary documents, the shortcomings in the documents; 4.
new supplier didn't sign distribution contract with relevant DSO.
Bosnia and Herzegovina: incomplete or inaccurate request for switching; provisions
of previous contract between old supplier and a customer, withdrawal of customer
request, force majeure.
According to Annex I of the Electricity and Gas Directive, Contracting Parties shall ensure
implementation of smart meters that should assist the active participation of consumers in
electricity and gas markets. The implementation of smart meters may be subject to cost-
benefit analysis that is to be performed then by 1st January 2014. Electricity smart meters
should be rolled-out to at least 80% of consumers by 2020, unless the result of a cost- benefit
analysis is negative. There is no such a timeline envisaged for gas. In none of the Contracting
Parties a cost-benefit analysis has been performed. The figure below shows the percentage
of household customers with electricity smart meters149
in Contracting Parties where
implemented.
147 In FYR of Macedonia prescribed number of working days for switching is 45 for both electricity and gas. This is
also the time in which the switching is actually completed. 148
In Montenegro switching process cannot be stopped. 149
A smart meter is a new generation of device for energy metering that sends electronic meter readings to the energy supplier automatically and provides the customer with helpful functionalities in order to regulate own consumption.

87
Figure 55 Share of households with electricity smart meters (in %), status 31.12.2014.
Although smart meters are not yet widely implemented in the Energy Community Contracting
Parties, frequency of billing information based on actual consumption in households
was monthly in 2014 in all cases150
. For comparison reasons it is worth noting that in the
majority of EU Member States households receive information on actual consumption (if
without smart meters) only once a year151
.
150 Only in BIH- Republika Srpska electricity and gas billing based on actual consumption was annual.
151 ACER/CEER Annual Report on the Results of Monitoring the Internal Electricity and Natural Gas markets in 2013,
p.221
9,250%
,400%
44,000%
4,000%
,000%
5,000%
10,000%
15,000%
20,000%
25,000%
30,000%
35,000%
40,000%
45,000%
50,000%
Bosnia and Herzegovina
Kosovo* Montenegro Ukraine
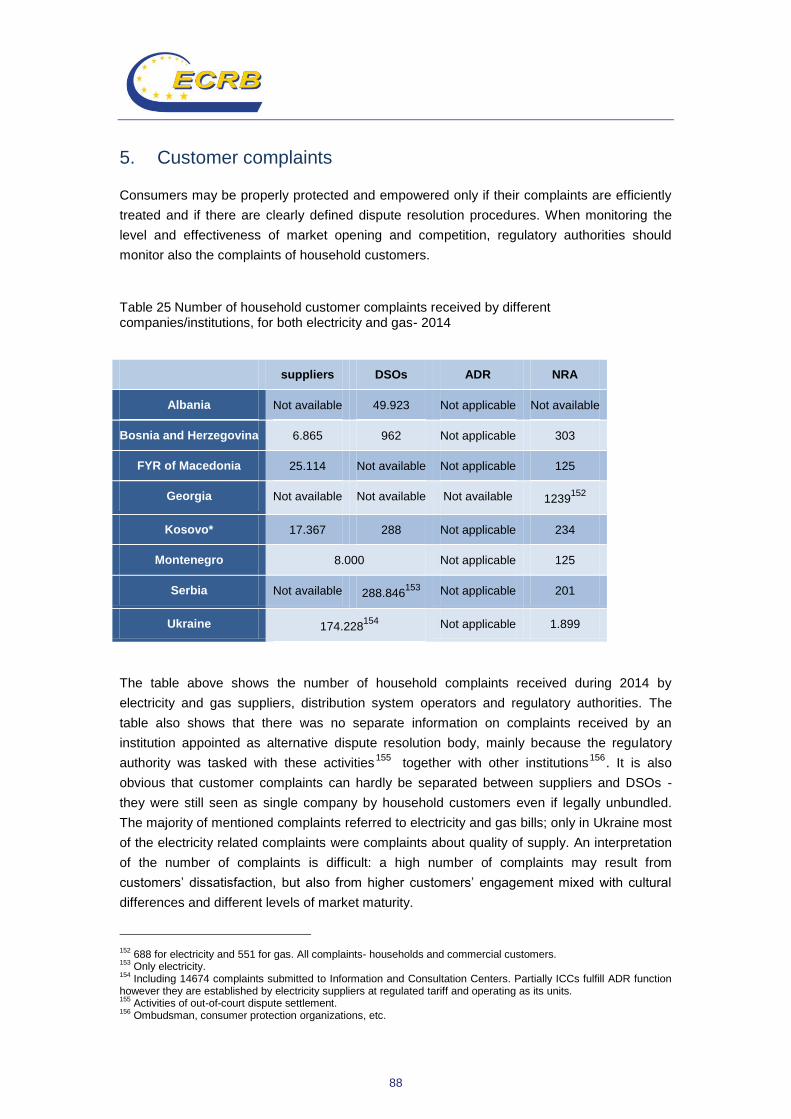
88
5. Customer complaints
Consumers may be properly protected and empowered only if their complaints are efficiently
treated and if there are clearly defined dispute resolution procedures. When monitoring the
level and effectiveness of market opening and competition, regulatory authorities should
monitor also the complaints of household customers.
Table 25 Number of household customer complaints received by different companies/institutions, for both electricity and gas- 2014
suppliers DSOs ADR NRA
Albania Not available 49.923 Not applicable Not available
Bosnia and Herzegovina 6.865 962 Not applicable 303
FYR of Macedonia 25.114 Not available Not applicable 125
Georgia Not available Not available Not available 1239152
Kosovo* 17.367 288 Not applicable 234
Montenegro 8.000 Not applicable 125
Serbia Not available 288.846153
Not applicable 201
Ukraine 174.228154
Not applicable 1.899
The table above shows the number of household complaints received during 2014 by
electricity and gas suppliers, distribution system operators and regulatory authorities. The
table also shows that there was no separate information on complaints received by an
institution appointed as alternative dispute resolution body, mainly because the regulatory
authority was tasked with these activities155
together with other institutions156
. It is also
obvious that customer complaints can hardly be separated between suppliers and DSOs -
they were still seen as single company by household customers even if legally unbundled.
The majority of mentioned complaints referred to electricity and gas bills; only in Ukraine most
of the electricity related complaints were complaints about quality of supply. An interpretation
of the number of complaints is difficult: a high number of complaints may result from
customers’ dissatisfaction, but also from higher customers’ engagement mixed with cultural
differences and different levels of market maturity.
152 688 for electricity and 551 for gas. All complaints- households and commercial customers.
153 Only electricity.
154 Including 14674 complaints submitted to Information and Consultation Centers. Partially ICCs fulfill ADR function
however they are established by electricity suppliers at regulated tariff and operating as its units. 155
Activities of out-of-court dispute settlement. 156
Ombudsman, consumer protection organizations, etc.
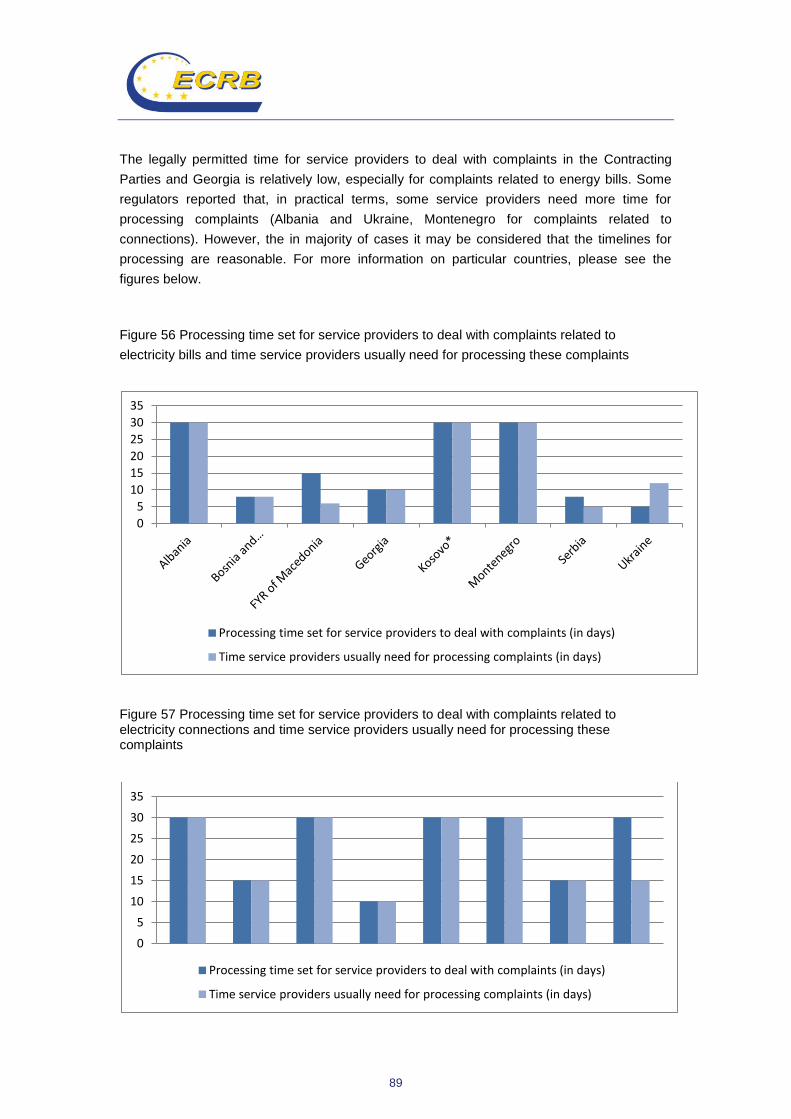
89
The legally permitted time for service providers to deal with complaints in the Contracting
Parties and Georgia is relatively low, especially for complaints related to energy bills. Some
regulators reported that, in practical terms, some service providers need more time for
processing complaints (Albania and Ukraine, Montenegro for complaints related to
connections). However, the in majority of cases it may be considered that the timelines for
processing are reasonable. For more information on particular countries, please see the
figures below.
Figure 56 Processing time set for service providers to deal with complaints related to
electricity bills and time service providers usually need for processing these complaints
Figure 57 Processing time set for service providers to deal with complaints related to electricity connections and time service providers usually need for processing these complaints
0
5
10
15
20
25
30
35
Processing time set for service providers to deal with complaints (in days)
Time service providers usually need for processing complaints (in days)
0
5
10
15
20
25
30
35
Processing time set for service providers to deal with complaints (in days)
Time service providers usually need for processing complaints (in days)