Physical activity report eurostat
52
PHYSICAL ACTIVITIES EUROPEAN OPINION RESEARCH GROUP PHYSICAL ACTIVITY Fieldwork: October-December 2002 Publication: December 2003 Special Eurobarometer European Commission Special Eurobarometer 183-6 / Wave 58.2 - European Opinion Research Group EEIG This survey was requested by Directorate General Health and Consumer Protection and coordinated by Directorate General Press and Communication This document does not represent the point of view of the European Commission. The interpretations and opinions contained in it are solely those of the authors.
-
Upload
max-icardi -
Category
Documents
-
view
37 -
download
3
Transcript of Physical activity report eurostat

PHYSICAL ACTIVITIES
EUROPEAN OPINION RESEARCH GROUP
PHYSICAL ACTIVITY
Fieldwork: October-December 2002
Publication: December 2003
Special EurobarometerEuropean
Commission
Spec
ial E
urob
arom
eter
183
-6 /
Wav
e 58
.2 -
Eur
opea
n O
pini
on R
esea
rch
Gro
up E
EIG
This survey was requested by Directorate General Health and Consumer Protection andcoordinated by Directorate General Press and Communication
This document does not represent the point of view of the European Commission.The interpretations and opinions contained in it are solely those of the authors.
PHYSICAL ACTIVITIES
EUROPEAN OPINION RESEARCH GROUP
This public opinion survey was carried out at the request of the Directorate-General Health
and Consumer's Protection and was managed and organised by the Public Opinion Analysis
Sector of the Directorate-General Press and Communication.
It was conducted in all the Member at States of the European Union between October 28 and
December 8, 2002, under the general coordination of the European Opinion Research Group
EEIG. in Brussels.
The technical specifications, the names of the institutes involved in the research and the
questionnaire are annexed.
The European Commission accepts no liability of any kind arising from this report.
The original language of this report is English.
PHYSICAL ACTIVITIES
EUROPEAN OPINION RESEARCH GROUP
TABLE OF CONTENTS
GENERAL INTRODUCTION ......................................................................................................1
1. Prevalence of Physical Activity ..........................................................................................2
1.1. General Situation in the European Union..................................................................2
1.2. Prevalence of Physical Activity by Age .....................................................................6
1.3. Prevalence of Physical Activity by Gender................................................................9
1.4. Prevalence of Physical Activity in the Member States.............................................13
2. Context of Physical Activity..............................................................................................18
2.1. General Situation in the European Union................................................................18
2.2. Physical activity in different contexts by age...........................................................20
2.3. Physical activity in different contexts by gender......................................................21
2.4. Context of physical activity in the Member States...................................................23
3. Perception of Environmental Opportunities for Physical Activity ......................................27
3.1. General Situation in the European Union................................................................27
3.2. Perception of Environmental Opportunities for Physical Activity by age..................29
3.3. Perception of Environmental Opportunities for Physical Activity by Gender............30
3.4. Perception of Environmental Opportunities in the Member States ..........................31
4. Methodological considerations.........................................................................................34
4.1. International Physical Activity Questionnaire (IPAQ)...............................................34
4.2. Context of Physical Activity.....................................................................................36
4.3. Perception of Environmental Opportunities for Physical Activity .............................36
APPENDIX ...............................................................................................................................37
Technical Specifications ....................................................................................................38
Questions on Physical Activity: ENGLISH VERSION.........................................................43
Frequencies of all Variables (unweighted results) ............................................................465
PHYSICAL ACTIVITIES
EUROPEAN OPINION RESEARCH GROUP 1
GENERAL INTRODUCTION
Between 28th October 2002 and 8th December 2002, the European Opinion Research Group, aconsortium of Market and Public Opinion Research agencies, made out of INRA and GfKWorldwide, carried out wave 58.2 of the Standard Eurobarometer, on request of the EuropeanCommission, Directorate-General Press and Communication, Public Opinion Analysis Unit.
The following topics are covered in this wave:
� Health (Q.1-71)
� Developing Countries (Q.72-79)
Standard Eurobarometer surveys cover the population of the respective nationalities of theEuropean Union member states, aged 15 years and over, resident in each of the memberstates. The basic sample design applied in all member states is a multi-stage, random(probability) one. In each EU country, a number of sampling points is drawn with probabilityproportional to population size (for a total coverage of the country) and to population density.
For doing so, points are drawn systematically from each of the ‘administrative regional units’,after stratification by individual unit and type of area. Hence, they represent the whole territory ofmember states according to EUROSTAT NUTS 2 (or equivalent) and according to thedistribution of resident population of the respective EU nationalities in terms of metropolitan,urban and rural areas. In each of the selected sampling points, a starting address is drawn atrandom. Further addresses are selected as every Nth address by standard random routeprocedures, from the initial address. In each household, respondent is drawn at random. Allinterviews are face-to-face in the respondent's home and in the appropriate national language.

PHYSICAL ACTIVITIES
EUROPEAN OPINION RESEARCH GROUP 2
1. Prevalence of Physical Activity
1.1. General Situation in the 0ean Union
Physical activity in the Member States was assessed using the “International Physical Activity
Questionnaire” (IPAQ). The goal of the IPAQ is to allow a cross-cultural comparison of physical
activity parameters. The IPAQ measures the frequency, duration, and level of intensity of
physical activity in the last 7 days.
The frequency of physical activity is measured by the question “In the last 7 days, on how many
days did you do […] physical activities?”. The duration is measured by the question “ On days
you do […] physical activity, how much time do you usually spend at it?”.
To assess the level of intensity of physical activity, these questions are asked for vigorous and
moderate physical activities, walking, and sitting. Questions do not distinguish between contexts
of physical activity, they thus measure all types of physical activities that were performed by an
individual in the last 7 days.
Table 1. Vigorous physical activity in the last 7 days
Q.50: In the last 7 days, on how many days did you do vigorous physical activitieslike lifting heavy things, digging, aerobics or fast cycling?
% EU 15None 57.41 day 7.92 days 9.13 days 7.24 days 3.55 days 5.56 days 2.07 days 6.1
Within the European Union, more than half of respondents (57.4%) reported no vigorous
physical activity in the last 7 days. 7.9% reported 1 day of vigorous physical activity, and 9.1%
reported 2 days of vigorous physical activity in the past week.

PHYSICAL ACTIVITIES
EUROPEAN OPINION RESEARCH GROUP 3
Table 2. Time spend on vigorous physical activity in the last 7 days
Q.51: On days when you do vigorous physical activities, how much time do you usually spendat it?
% EU 15Did not do any vigorous physical activities in the last 7 days 60.730 minutes or less 4.231 to 60 minutes 14.761 to 90 minutes 4.691 to 120 minutes 9.7More than 120 minutes 3.5DK 2.6
When asked, how much time they usually spend on an average day doing vigorous physical
activities, more than 60% (60.7%) reported doing no vigorous physical activity. The average
time of vigorous physical activity bouts is 30 minutes or less for 4.2%, up to 60 minutes for
14.7%, up to 90 minutes for 4.6%, up to 120 minutes for 9.7% and more than 120 minutes for
3.5%.
Table 3. Moderate physical activity in the last 7 days
Q.52: In the last 7 days, on how many days did you do moderate physical activity like carryinglight loads, cycling at a normal pace or doubles tennis? Please do not include walking.
% EU 15None 40.81 day 6.42 days 11.33 days 8.54 days 5.25 days 7.26 days 3.37 days 15.4
For physical activity of moderate level of intensity, 40.8% of respondents reported no such
physical activity in the past week. More than 15% (15.4%) reported doing moderate physical
activity every day in the past week, and 11.3% reported doing moderate physical activity on 2
days in the past week.
PHYSICAL ACTIVITIES
EUROPEAN OPINION RESEARCH GROUP 4
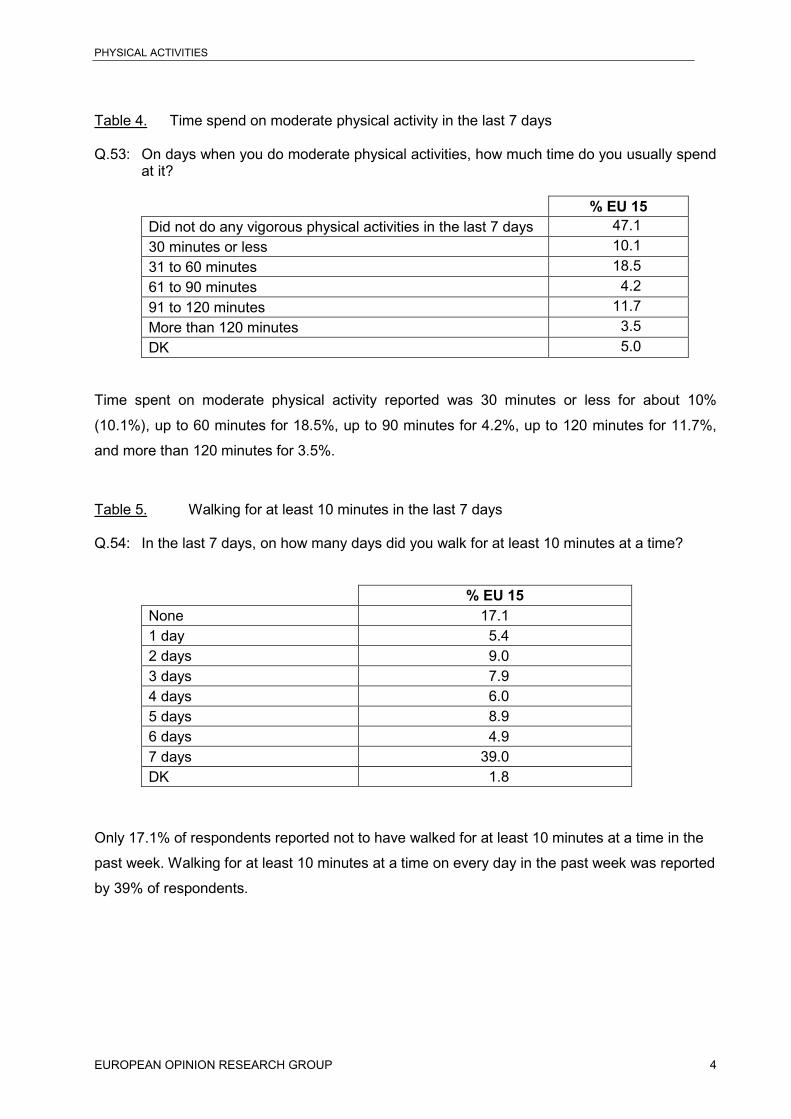
Table 4. Time spend on moderate physical activity in the last 7 days
Q.53: On days when you do moderate physical activities, how much time do you usually spendat it?
% EU 15Did not do any vigorous physical activities in the last 7 days 47.130 minutes or less 10.131 to 60 minutes 18.561 to 90 minutes 4.291 to 120 minutes 11.7More than 120 minutes 3.5DK 5.0
Time spent on moderate physical activity reported was 30 minutes or less for about 10%
(10.1%), up to 60 minutes for 18.5%, up to 90 minutes for 4.2%, up to 120 minutes for 11.7%,
and more than 120 minutes for 3.5%.
Table 5. Walking for at least 10 minutes in the last 7 days
Q.54: In the last 7 days, on how many days did you walk for at least 10 minutes at a time?
% EU 15None 17.11 day 5.42 days 9.03 days 7.94 days 6.05 days 8.96 days 4.97 days 39.0DK 1.8
Only 17.1% of respondents reported not to have walked for at least 10 minutes at a time in the
past week. Walking for at least 10 minutes at a time on every day in the past week was reported
by 39% of respondents.

PHYSICAL ACTIVITIES
EUROPEAN OPINION RESEARCH GROUP 5
Table 6. Time spend walking on a usual day
Q.55: On days when you walk for at least 10 minutes at a time, how much time do you usuallyspend walking?
% EU 15Did not do any walking for at least 10 minutes at a time 21.030 minutes or less 37.531 to 60 minutes 21.861 to 90 minutes 5.891 to 120 minutes 6.2More than 120 minutes 1.6DK 6.1
The average time spent walking was reported to be up to 30 minutes by more than one third of
respondents (37.5%), up to 60 minutes by 21.8%, up to 90 minutes by 5.8%, up to 120 minutes
by 6.2%, and more than 120 minutes by 1.6%.
For sitting, the majority of respondents reported to sit between 1.3 hours to 5.3 hours on a usual
day.
Table 7. Time spend sitting on a usual day
Q.56: How much time do you spend sitting on usual day? This may include time spent at adesk, visiting friends, reading, studying or watching television?
% EU 15Less than 1 hour 1.9From 1 hour to 1.30 hours 4.5From 1.31 hours to 2.30 hours 10.3From 2.31 hours to 3.30 hours 13.9From 3.31 hours to 4.30 hours 14.5From 4.31 hours to 5.30 hours 11.3From 4.31 hours to 5.30 hours 10.6From 5.31 hours to 6.30 hours 5.2From 6.31 hours to 7.30 hours 8.5From 7.31 hours to 8.30 hours 8.7More than 8.30 hours 4.6DK 6.2

PHYSICAL ACTIVITIES
EUROPEAN OPINION RESEARCH GROUP 6
1.2. Prevalence of Physical Activity by Age
If reported days of vigorous physical activity in the past week were compared across age
groups, older people reported to about 80% (79.6%) no vigorous physical activity in the past
week. For the younger age groups, this rate dropped to 43.1% among respondents being 15-25
years of age.
Table 8. Days of vigorous physical activity in the last 7 days by age
15-25years %
26-44years %
45-64years %
65 +years%
None 43.1 49.9 60.4 79.61 day 9.8 8.4 7.9 5.02 days 12.9 10.7 7.8 4.83 days 11.8 8.2 5.8 3.34 days 5.6 4.0 2.8 1.55 days 6.3 7.7 5.1 1.46 days 2.4 2.8 1.8 0.57 days 6.5 6.8 6.9 3.1DK 1.5 1.4 1.4 0.8
Time spend on vigorous physical activities in the last week decreased with age. Of those being
15-25 years of age, 14.5% reported bouts of vigorous physical activity of 91 to 120 minutes, for
26-44 years olds this rate is 10.7%, for 45-64 years old this rate is 8.9%, and for those 65 years
of age and older this rate is 4.5%, respectively.
Table 9. Time spend on vigorous physical activity in the last 7 days by age
15-25years %
26-44years %
45-64years %
65 +years%
No vigorous physical activities 46.5 53.9 63.8 82.030 minutes or less 4.4 5.7 3.5 2.331 to 60 minutes 17.8 18.1 14.5 6.061 to 90 minutes 8.8 5.0 3.6 1.491 to 120 minutes 14.5 10.7 8.9 4.5More than 120 minutes 4.8 3.5 3.4 2.5DK 3.1 3.1 2.5 1.3
For moderate physical activity, a similar decrease of participation could be observed. One third
(33.1%) of those being 15-25 years of age did not report any moderate physical activity in the
past week, for those being 65 years of age and older, this rate was 55.9%. However, the rate of
PHYSICAL ACTIVITIES
EUROPEAN OPINION RESEARCH GROUP 7
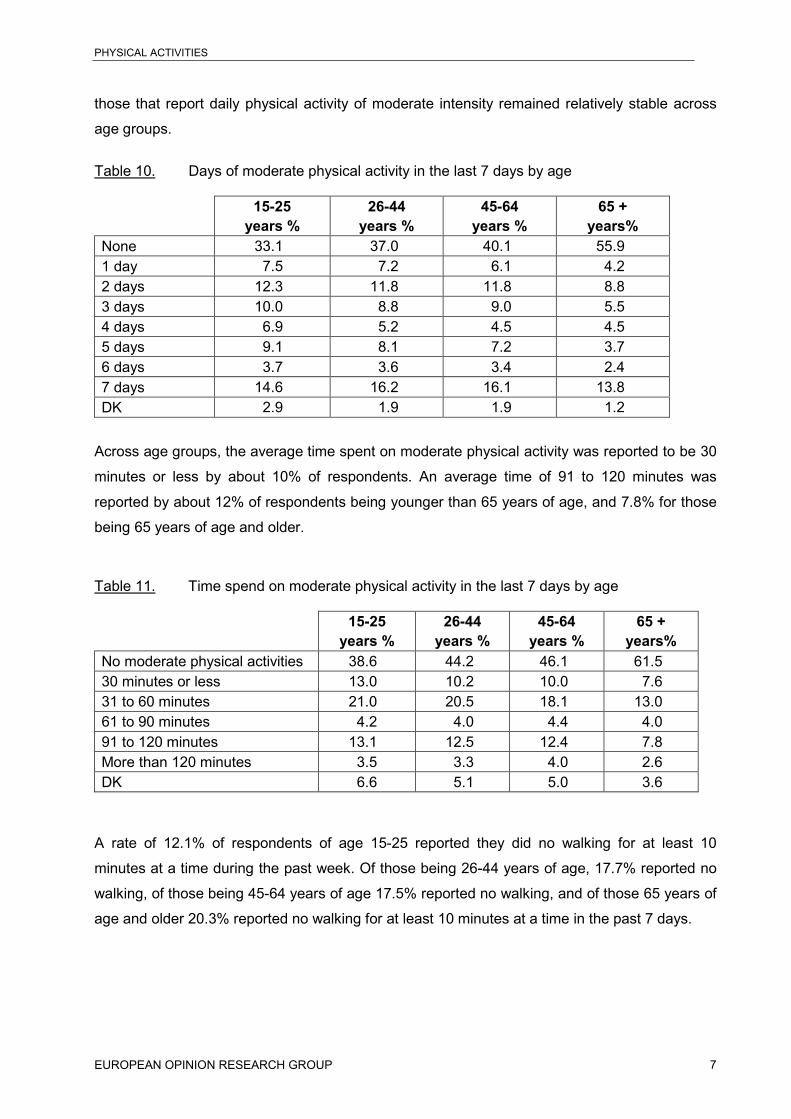
those that report daily physical activity of moderate intensity remained relatively stable across
age groups.
Table 10. Days of moderate physical activity in the last 7 days by age
15-25years %
26-44years %
45-64years %
65 +years%
None 33.1 37.0 40.1 55.91 day 7.5 7.2 6.1 4.22 days 12.3 11.8 11.8 8.83 days 10.0 8.8 9.0 5.54 days 6.9 5.2 4.5 4.55 days 9.1 8.1 7.2 3.76 days 3.7 3.6 3.4 2.47 days 14.6 16.2 16.1 13.8DK 2.9 1.9 1.9 1.2
Across age groups, the average time spent on moderate physical activity was reported to be 30
minutes or less by about 10% of respondents. An average time of 91 to 120 minutes was
reported by about 12% of respondents being younger than 65 years of age, and 7.8% for those
being 65 years of age and older.
Table 11. Time spend on moderate physical activity in the last 7 days by age
15-25years %
26-44years %
45-64years %
65 +years%
No moderate physical activities 38.6 44.2 46.1 61.530 minutes or less 13.0 10.2 10.0 7.631 to 60 minutes 21.0 20.5 18.1 13.061 to 90 minutes 4.2 4.0 4.4 4.091 to 120 minutes 13.1 12.5 12.4 7.8More than 120 minutes 3.5 3.3 4.0 2.6DK 6.6 5.1 5.0 3.6
A rate of 12.1% of respondents of age 15-25 reported they did no walking for at least 10
minutes at a time during the past week. Of those being 26-44 years of age, 17.7% reported no
walking, of those being 45-64 years of age 17.5% reported no walking, and of those 65 years of
age and older 20.3% reported no walking for at least 10 minutes at a time in the past 7 days.
PHYSICAL ACTIVITIES
EUROPEAN OPINION RESEARCH GROUP 8
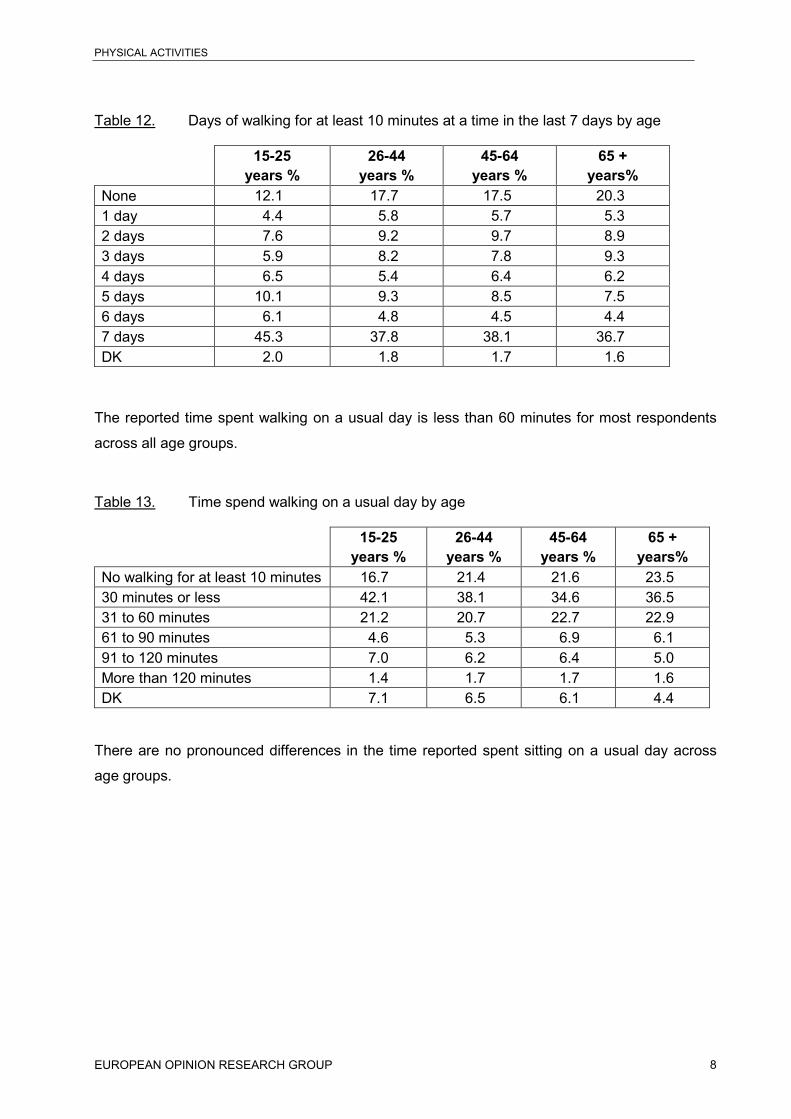
Table 12. Days of walking for at least 10 minutes at a time in the last 7 days by age
15-25years %
26-44years %
45-64years %
65 +years%
None 12.1 17.7 17.5 20.31 day 4.4 5.8 5.7 5.32 days 7.6 9.2 9.7 8.93 days 5.9 8.2 7.8 9.34 days 6.5 5.4 6.4 6.25 days 10.1 9.3 8.5 7.56 days 6.1 4.8 4.5 4.47 days 45.3 37.8 38.1 36.7DK 2.0 1.8 1.7 1.6
The reported time spent walking on a usual day is less than 60 minutes for most respondents
across all age groups.
Table 13. Time spend walking on a usual day by age
15-25years %
26-44years %
45-64years %
65 +years%
No walking for at least 10 minutes 16.7 21.4 21.6 23.530 minutes or less 42.1 38.1 34.6 36.531 to 60 minutes 21.2 20.7 22.7 22.961 to 90 minutes 4.6 5.3 6.9 6.191 to 120 minutes 7.0 6.2 6.4 5.0More than 120 minutes 1.4 1.7 1.7 1.6DK 7.1 6.5 6.1 4.4
There are no pronounced differences in the time reported spent sitting on a usual day across
age groups.
PHYSICAL ACTIVITIES
EUROPEAN OPINION RESEARCH GROUP 9
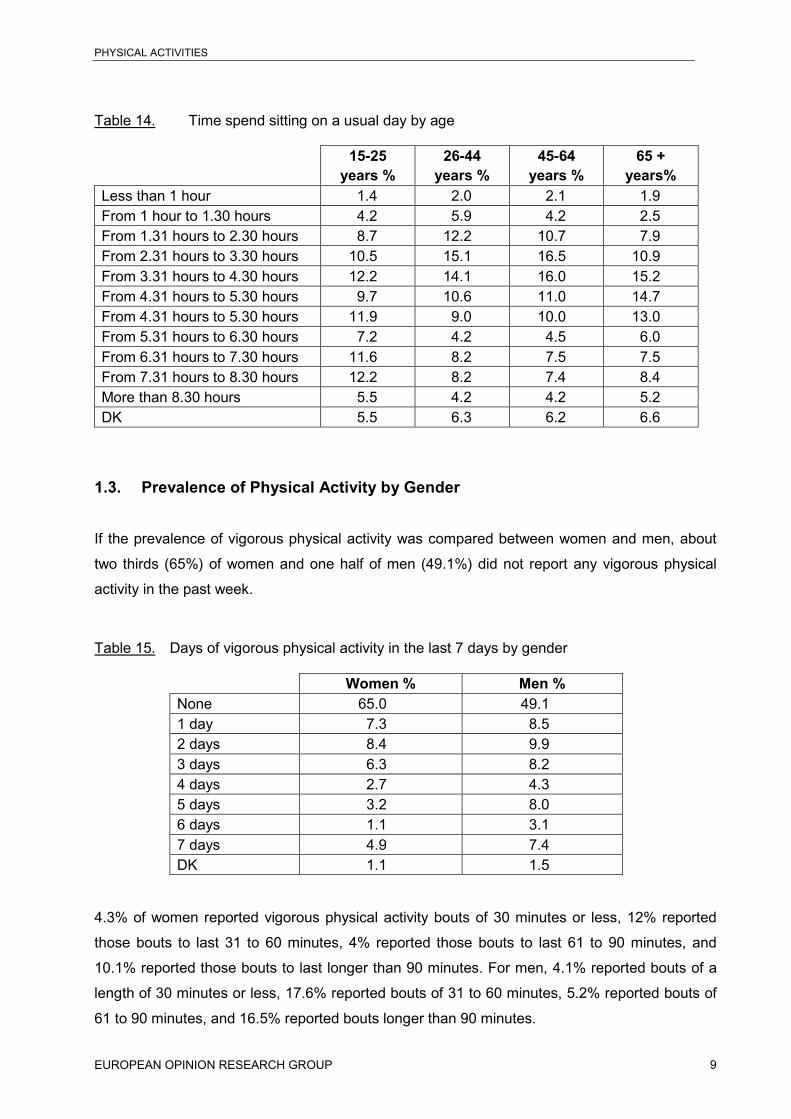
Table 14. Time spend sitting on a usual day by age
15-25years %
26-44years %
45-64years %
65 +years%
Less than 1 hour 1.4 2.0 2.1 1.9From 1 hour to 1.30 hours 4.2 5.9 4.2 2.5From 1.31 hours to 2.30 hours 8.7 12.2 10.7 7.9From 2.31 hours to 3.30 hours 10.5 15.1 16.5 10.9From 3.31 hours to 4.30 hours 12.2 14.1 16.0 15.2From 4.31 hours to 5.30 hours 9.7 10.6 11.0 14.7From 4.31 hours to 5.30 hours 11.9 9.0 10.0 13.0From 5.31 hours to 6.30 hours 7.2 4.2 4.5 6.0From 6.31 hours to 7.30 hours 11.6 8.2 7.5 7.5From 7.31 hours to 8.30 hours 12.2 8.2 7.4 8.4More than 8.30 hours 5.5 4.2 4.2 5.2DK 5.5 6.3 6.2 6.6
1.3. Prevalence of Physical Activity by Gender
If the prevalence of vigorous physical activity was compared between women and men, about
two thirds (65%) of women and one half of men (49.1%) did not report any vigorous physical
activity in the past week.
Table 15. Days of vigorous physical activity in the last 7 days by gender
Women % Men %None 65.0 49.11 day 7.3 8.52 days 8.4 9.93 days 6.3 8.24 days 2.7 4.35 days 3.2 8.06 days 1.1 3.17 days 4.9 7.4DK 1.1 1.5
4.3% of women reported vigorous physical activity bouts of 30 minutes or less, 12% reported
those bouts to last 31 to 60 minutes, 4% reported those bouts to last 61 to 90 minutes, and
10.1% reported those bouts to last longer than 90 minutes. For men, 4.1% reported bouts of a
length of 30 minutes or less, 17.6% reported bouts of 31 to 60 minutes, 5.2% reported bouts of
61 to 90 minutes, and 16.5% reported bouts longer than 90 minutes.

PHYSICAL ACTIVITIES
EUROPEAN OPINION RESEARCH GROUP 10
Table 16. Time spend on vigorous physical activity in the last 7 days by gender
Women % Men %No vigorous physical activities 67.4 53.630 minutes or less 4.3 4.131 to 60 minutes 12.0 17.661 to 90 minutes 4.0 5.291 to 120 minutes 7.5 12.1More than 120 minutes 2.6 4.4DK 2.2 3.0
A higher rate of women (43.2%) than men (38.1%) reported no physical activity of moderate
level of intensity in the last 7 days. 16.8% of women reported moderate physical activity on
every day, for men this rate was 14%.
Table 17. Days of moderate physical activity in the last 7 days by gender
Women % Men %None 43.2 38.11 day 5.6 7.12 days 10.4 12.33 days 8.1 8.84 days 4.9 5.55 days 6.0 8.56 days 3.0 3.67 days 16.8 14.0DK 1.9 2.0
There is not much variation in the time spent on moderate physical activity bouts between
females and males.
PHYSICAL ACTIVITIES
EUROPEAN OPINION RESEARCH GROUP 11
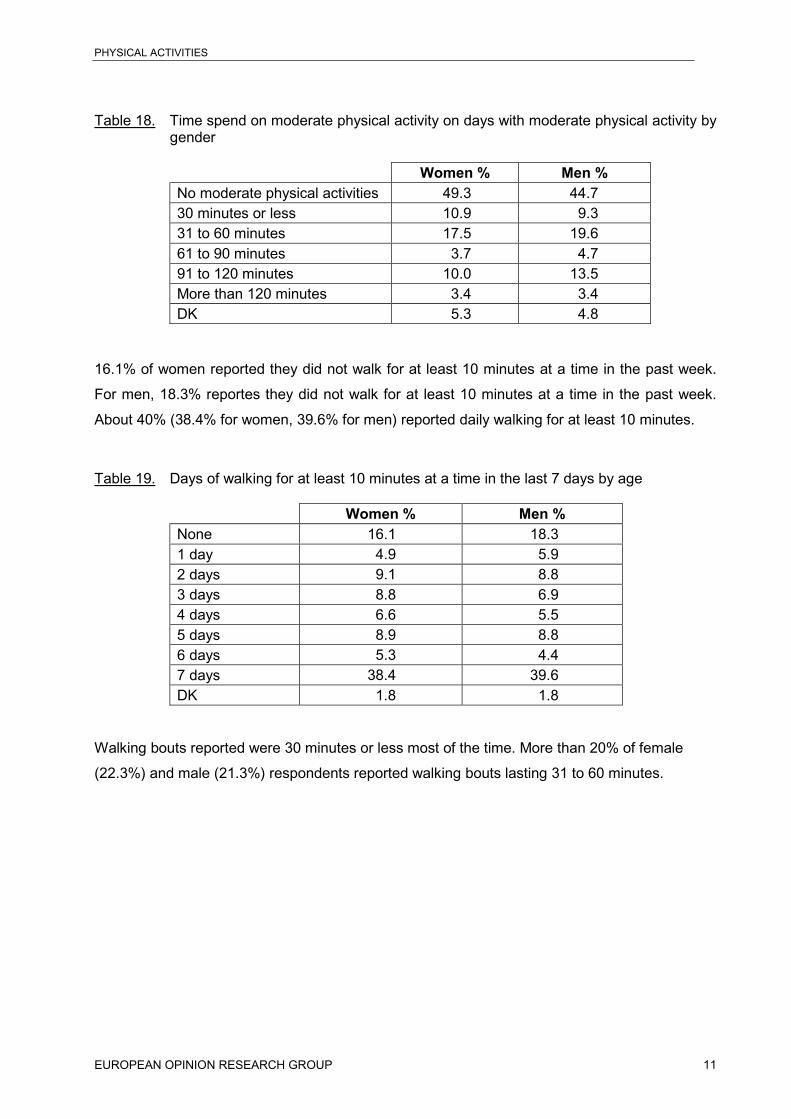
Table 18. Time spend on moderate physical activity on days with moderate physical activity bygender
Women % Men %No moderate physical activities 49.3 44.730 minutes or less 10.9 9.331 to 60 minutes 17.5 19.661 to 90 minutes 3.7 4.791 to 120 minutes 10.0 13.5More than 120 minutes 3.4 3.4DK 5.3 4.8
16.1% of women reported they did not walk for at least 10 minutes at a time in the past week.
For men, 18.3% reportes they did not walk for at least 10 minutes at a time in the past week.
About 40% (38.4% for women, 39.6% for men) reported daily walking for at least 10 minutes.
Table 19. Days of walking for at least 10 minutes at a time in the last 7 days by age
Women % Men %None 16.1 18.31 day 4.9 5.92 days 9.1 8.83 days 8.8 6.94 days 6.6 5.55 days 8.9 8.86 days 5.3 4.47 days 38.4 39.6DK 1.8 1.8
Walking bouts reported were 30 minutes or less most of the time. More than 20% of female
(22.3%) and male (21.3%) respondents reported walking bouts lasting 31 to 60 minutes.
PHYSICAL ACTIVITIES
EUROPEAN OPINION RESEARCH GROUP 12
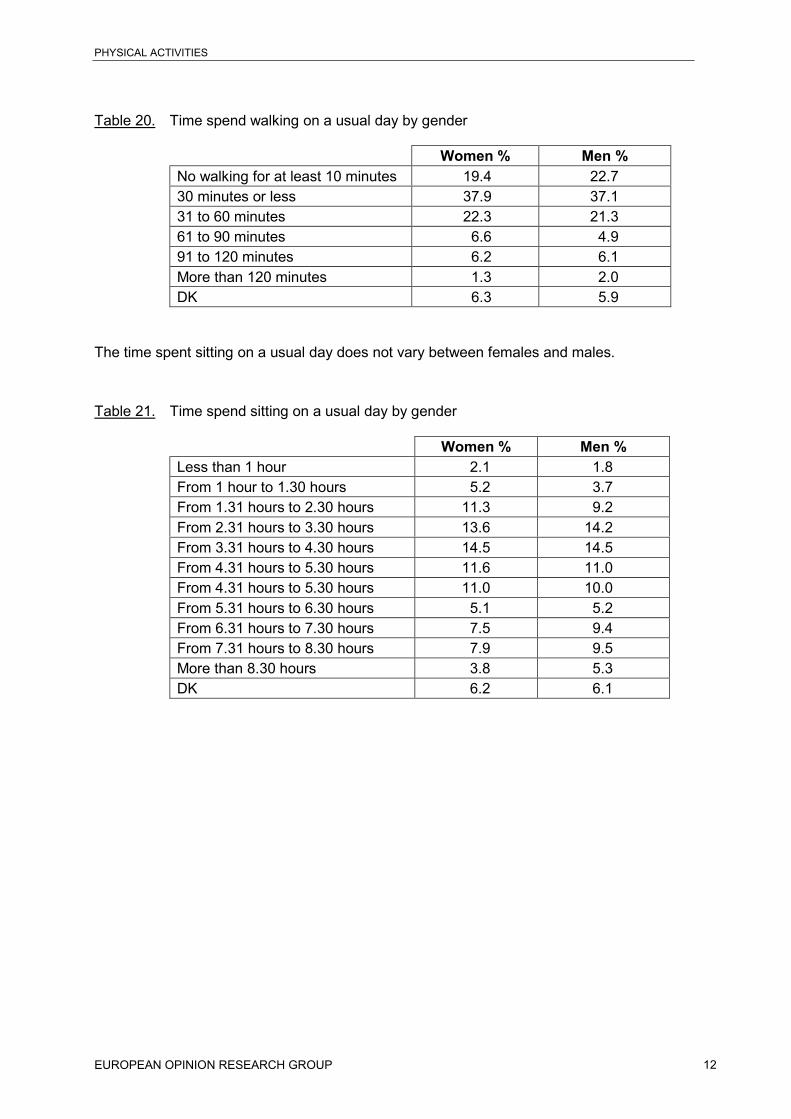
Table 20. Time spend walking on a usual day by gender
Women % Men %No walking for at least 10 minutes 19.4 22.730 minutes or less 37.9 37.131 to 60 minutes 22.3 21.361 to 90 minutes 6.6 4.991 to 120 minutes 6.2 6.1More than 120 minutes 1.3 2.0DK 6.3 5.9
The time spent sitting on a usual day does not vary between females and males.
Table 21. Time spend sitting on a usual day by gender
Women % Men %Less than 1 hour 2.1 1.8From 1 hour to 1.30 hours 5.2 3.7From 1.31 hours to 2.30 hours 11.3 9.2From 2.31 hours to 3.30 hours 13.6 14.2From 3.31 hours to 4.30 hours 14.5 14.5From 4.31 hours to 5.30 hours 11.6 11.0From 4.31 hours to 5.30 hours 11.0 10.0From 5.31 hours to 6.30 hours 5.1 5.2From 6.31 hours to 7.30 hours 7.5 9.4From 7.31 hours to 8.30 hours 7.9 9.5More than 8.30 hours 3.8 5.3DK 6.2 6.1

PHYSICAL ACTIVITIES
EUROPEAN OPINION RESEARCH GROUP 13
1.4. Prevalence of Physical Activity in the Member States
Across Member States, the rate of those who reported no vigorous physical activity in the last 7
days ranged from a low of 43.3% in the Netherlands to a high of 71.7% in Spain. Lower than
average rates of non-participation in vigorous physical activity in the past week were reported in
Germany (45.2%), Luxembourg (51.3%), and Finland (51.4%).
High rates of non-participation in vigorous physical activity could be found, beside Spain, in Italy
(63.9%), Ireland (62.3%), and Belgium (61.4%).
In the last 7 days, on how many days did you do vigorous physical activities like lifting heavy things, digging,
aerobics or fast cycling?
0102030405060708090
100
NEL GER LUX FIN GRE DEN EU15
GB AUS SWE FRA POR BEL IRL ITA SPA
None 1-3 days 4-7 days
Time usually spent doing vigorous physical activities is categorized in no vigorous physical
activity, bouts of up to 60 minutes, and bouts that are longer than 60 minutes.
In Finland (27.7%), the Netherlands (25.8%), Luxemburg (23.8%), and Sweden (23.5%) more
than 23% of the populations reported bouts of less than 60 minutes when they were engaged in
vigorous physical activity.

PHYSICAL ACTIVITIES
EUROPEAN OPINION RESEARCH GROUP 14
On the days when you do vigorous physical activities, how much time do you usually spend at it?
0102030405060708090
100
NEL GER FIN LUX DEN SWE EU15
GRE AUS GB FRA BEL IRL ITA POR SPA
No vigorous physical activity up to 60 minutes more than 60 minutes
The lowest rates of non-participation in moderate physical activity in the last 7 days could be
found in the Netherlands (7.5%), Portugal (26.2%), Germany (28.6%), Denmark (30.6%),
Luxembourg (33.9%), and Finland (35.9%).
Highest rates of non-participation were reported in France (52.8%), Spain (51.3%), and Italy
(50%).
In the last 7 days, on how many days did you do moderate physical activity like carrying light loads, cycling at a normal
pace or doubles tennis? Please do not include walking.
0102030405060708090
100
NEL POR GER DEN LUX FIN BEL GRE AUS EU15
GB SWE IRL ITA SPA FRA
None 1-3 days 4-7 days
Moderate physical activity on 4 to 7 days per week was reported by 71.6% of adults in the
Netherlands, compared to 31.1% in the EU average.
PHYSICAL ACTIVITIES
EUROPEAN OPINION RESEARCH GROUP 15
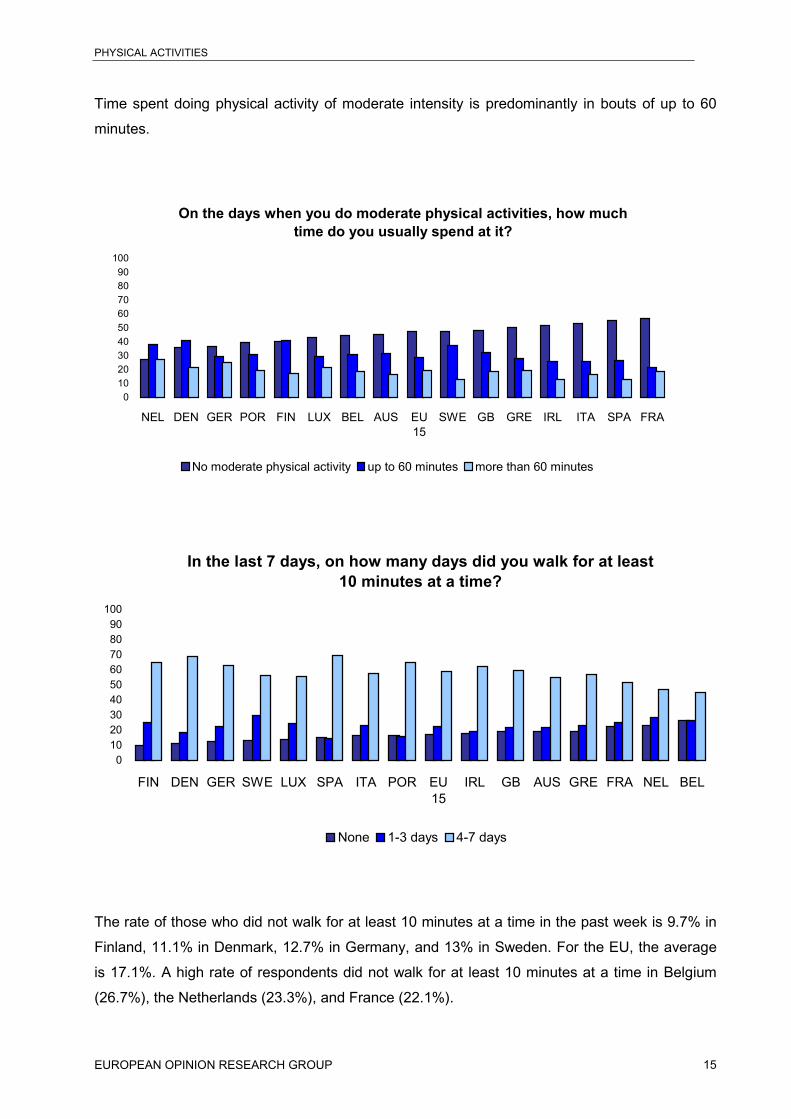
Time spent doing physical activity of moderate intensity is predominantly in bouts of up to 60
minutes.
On the days when you do moderate physical activities, how much time do you usually spend at it?
0102030405060708090
100
NEL DEN GER POR FIN LUX BEL AUS EU15
SWE GB GRE IRL ITA SPA FRA
No moderate physical activity up to 60 minutes more than 60 minutes
In the last 7 days, on how many days did you walk for at least 10 minutes at a time?
0102030405060708090
100
FIN DEN GER SWE LUX SPA ITA POR EU15
IRL GB AUS GRE FRA NEL BEL
None 1-3 days 4-7 days
The rate of those who did not walk for at least 10 minutes at a time in the past week is 9.7% in
Finland, 11.1% in Denmark, 12.7% in Germany, and 13% in Sweden. For the EU, the average
is 17.1%. A high rate of respondents did not walk for at least 10 minutes at a time in Belgium
(26.7%), the Netherlands (23.3%), and France (22.1%).
PHYSICAL ACTIVITIES
EUROPEAN OPINION RESEARCH GROUP 16
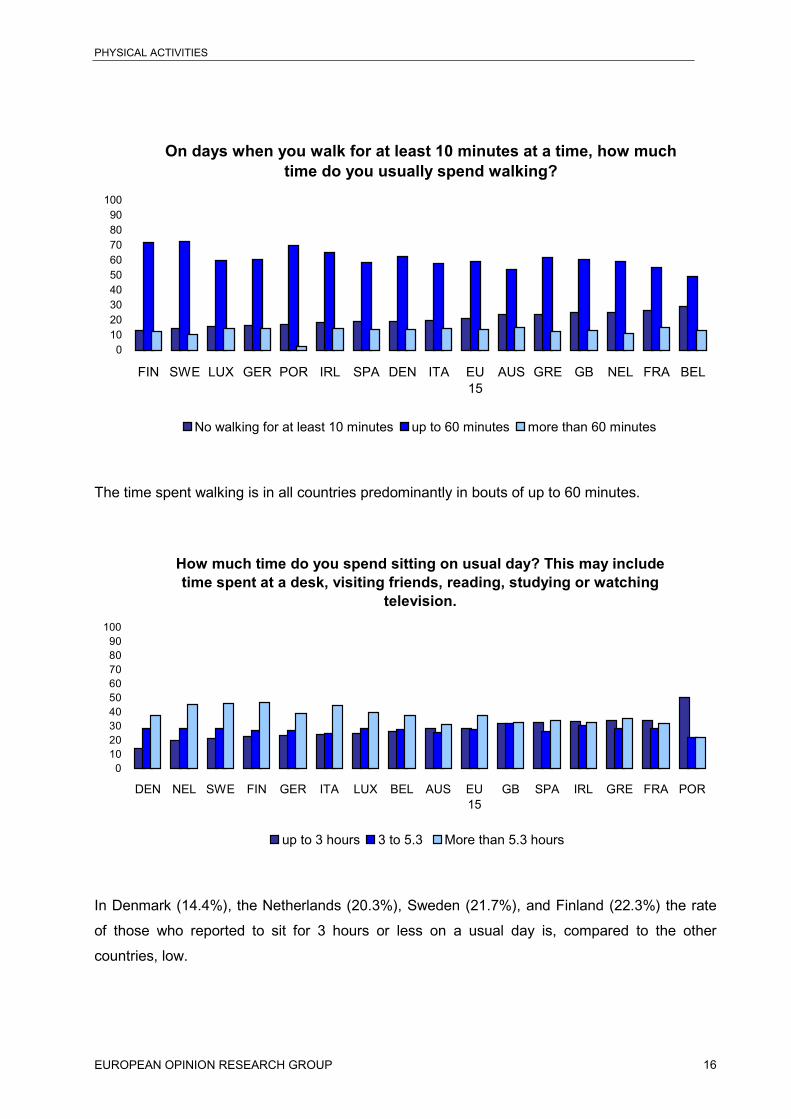
On days when you walk for at least 10 minutes at a time, how much time do you usually spend walking?
0102030405060708090
100
FIN SWE LUX GER POR IRL SPA DEN ITA EU15
AUS GRE GB NEL FRA BEL
No walking for at least 10 minutes up to 60 minutes more than 60 minutes
The time spent walking is in all countries predominantly in bouts of up to 60 minutes.
How much time do you spend sitting on usual day? This may include time spent at a desk, visiting friends, reading, studying or watching
television.
0102030405060708090
100
DEN NEL SWE FIN GER ITA LUX BEL AUS EU15
GB SPA IRL GRE FRA POR
up to 3 hours 3 to 5.3 More than 5.3 hours
In Denmark (14.4%), the Netherlands (20.3%), Sweden (21.7%), and Finland (22.3%) the rate
of those who reported to sit for 3 hours or less on a usual day is, compared to the other
countries, low.

PHYSICAL ACTIVITIES
EUROPEAN OPINION RESEARCH GROUP 17
Overall, significant variations across the physical activity parameters of the IPAQ can be
observed in the Members States. Across parameters, respondents of the Netherlands,
Denmark, Finland, Sweden, Germany, and Luxemburg reported higher prevalence of physical
activity than the other nations.
Lower than average prevalences of physical activity were found in France, Belgium, Italy, Spain
and Portugal.
PHYSICAL ACTIVITIES
EUROPEAN OPINION RESEARCH GROUP 18
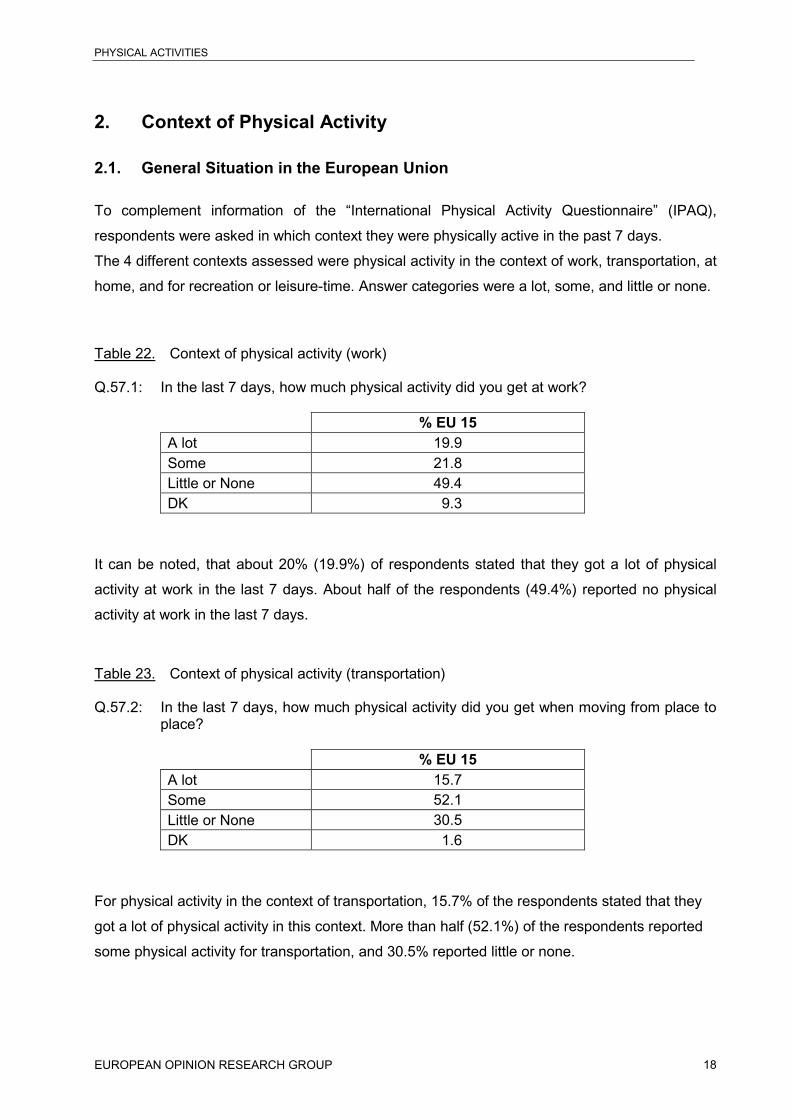
2. Context of Physical Activity
2.1. General Situation in the European Union
To complement information of the “International Physical Activity Questionnaire” (IPAQ),
respondents were asked in which context they were physically active in the past 7 days.
The 4 different contexts assessed were physical activity in the context of work, transportation, at
home, and for recreation or leisure-time. Answer categories were a lot, some, and little or none.
Table 22. Context of physical activity (work)
Q.57.1: In the last 7 days, how much physical activity did you get at work?
% EU 15A lot 19.9Some 21.8Little or None 49.4DK 9.3
It can be noted, that about 20% (19.9%) of respondents stated that they got a lot of physical
activity at work in the last 7 days. About half of the respondents (49.4%) reported no physical
activity at work in the last 7 days.
Table 23. Context of physical activity (transportation)
Q.57.2: In the last 7 days, how much physical activity did you get when moving from place toplace?
% EU 15A lot 15.7Some 52.1Little or None 30.5DK 1.6
For physical activity in the context of transportation, 15.7% of the respondents stated that they
got a lot of physical activity in this context. More than half (52.1%) of the respondents reported
some physical activity for transportation, and 30.5% reported little or none.
PHYSICAL ACTIVITIES
EUROPEAN OPINION RESEARCH GROUP 19
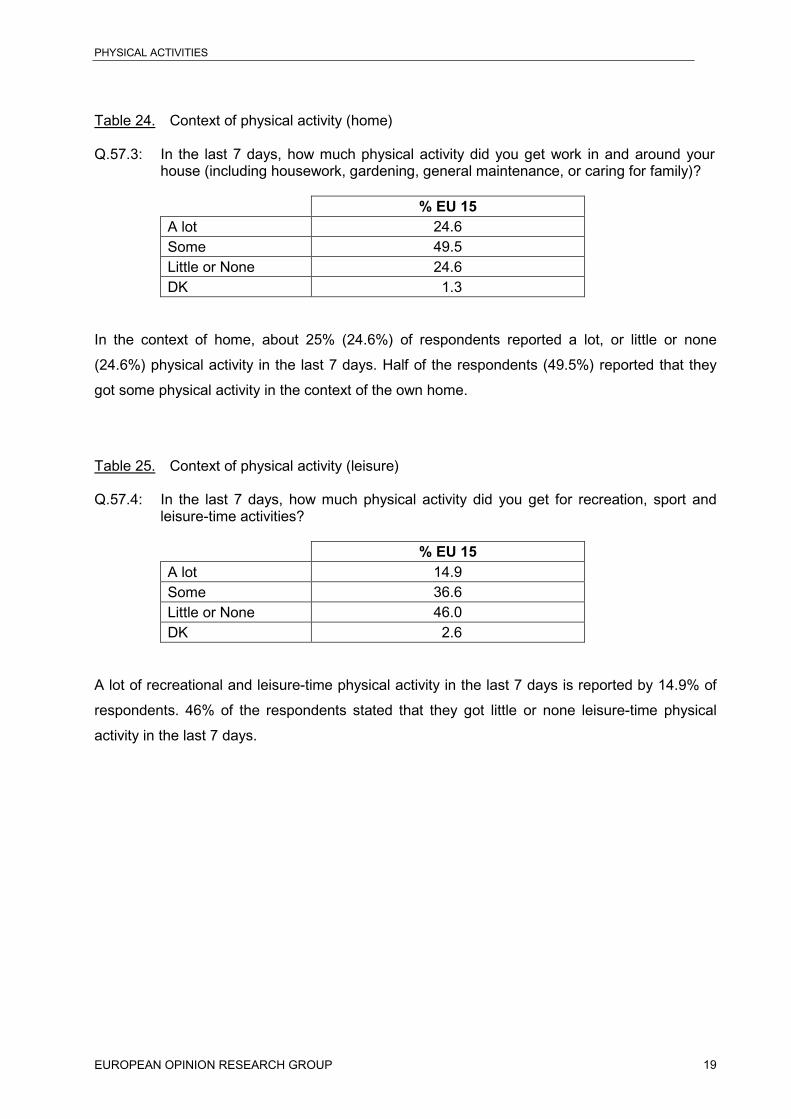
Table 24. Context of physical activity (home)
Q.57.3: In the last 7 days, how much physical activity did you get work in and around yourhouse (including housework, gardening, general maintenance, or caring for family)?
% EU 15A lot 24.6Some 49.5Little or None 24.6DK 1.3
In the context of home, about 25% (24.6%) of respondents reported a lot, or little or none
(24.6%) physical activity in the last 7 days. Half of the respondents (49.5%) reported that they
got some physical activity in the context of the own home.
Table 25. Context of physical activity (leisure)
Q.57.4: In the last 7 days, how much physical activity did you get for recreation, sport andleisure-time activities?
% EU 15A lot 14.9Some 36.6Little or None 46.0DK 2.6
A lot of recreational and leisure-time physical activity in the last 7 days is reported by 14.9% of
respondents. 46% of the respondents stated that they got little or none leisure-time physical
activity in the last 7 days.
PHYSICAL ACTIVITIES
EUROPEAN OPINION RESEARCH GROUP 20
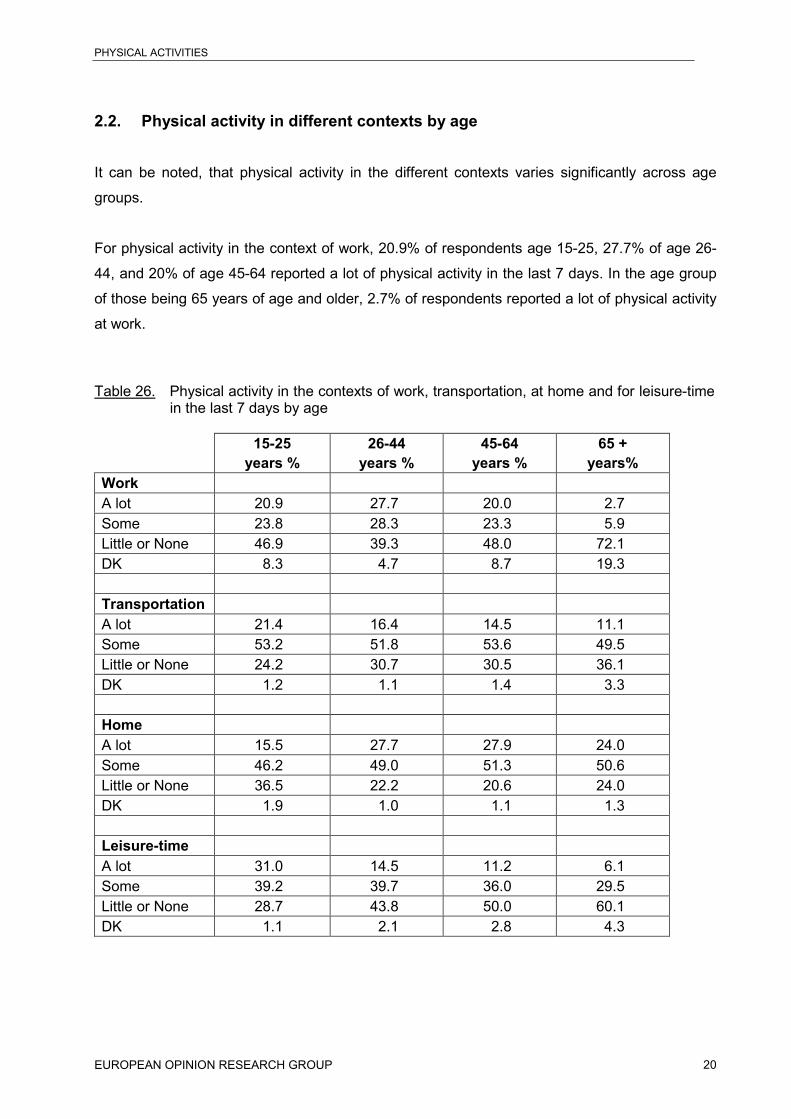
2.2. Physical activity in different contexts by age
It can be noted, that physical activity in the different contexts varies significantly across age
groups.
For physical activity in the context of work, 20.9% of respondents age 15-25, 27.7% of age 26-
44, and 20% of age 45-64 reported a lot of physical activity in the last 7 days. In the age group
of those being 65 years of age and older, 2.7% of respondents reported a lot of physical activity
at work.
Table 26. Physical activity in the contexts of work, transportation, at home and for leisure-timein the last 7 days by age
15-25years %
26-44years %
45-64years %
65 +years%
WorkA lot 20.9 27.7 20.0 2.7Some 23.8 28.3 23.3 5.9Little or None 46.9 39.3 48.0 72.1DK 8.3 4.7 8.7 19.3
TransportationA lot 21.4 16.4 14.5 11.1Some 53.2 51.8 53.6 49.5Little or None 24.2 30.7 30.5 36.1DK 1.2 1.1 1.4 3.3
HomeA lot 15.5 27.7 27.9 24.0Some 46.2 49.0 51.3 50.6Little or None 36.5 22.2 20.6 24.0DK 1.9 1.0 1.1 1.3
Leisure-timeA lot 31.0 14.5 11.2 6.1Some 39.2 39.7 36.0 29.5Little or None 28.7 43.8 50.0 60.1DK 1.1 2.1 2.8 4.3
PHYSICAL ACTIVITIES
EUROPEAN OPINION RESEARCH GROUP 21
Similarly, those being 65 years of age and older reported lower rates of a lot of physical activity
for the purpose of transportation compared to the younger age groups.
Physical activity at home is predominantly reported by the older age groups. Of those being 15-
24 years of age, 15.5% reported a lot of physical activity in the last 7 days, in the other 3 age
groups this rate was 24% (65 years and older) to 27.9 %(45-64 years of age).
Physical activity for recreational purposes declined with age. Of those being 15-24 years of age
70.2% reported at least some leisure-time physical activity in the last 7 days. In the age group
of the 26-44 years old, 54.2% reported at least some leisure-time physical activity, while 47.2%
of those 45-64, and 35.5% of those 65 years of age and older reported some leisure-time
physical activity in the last 7 days.
2.3. Physical activity in different contexts by gender
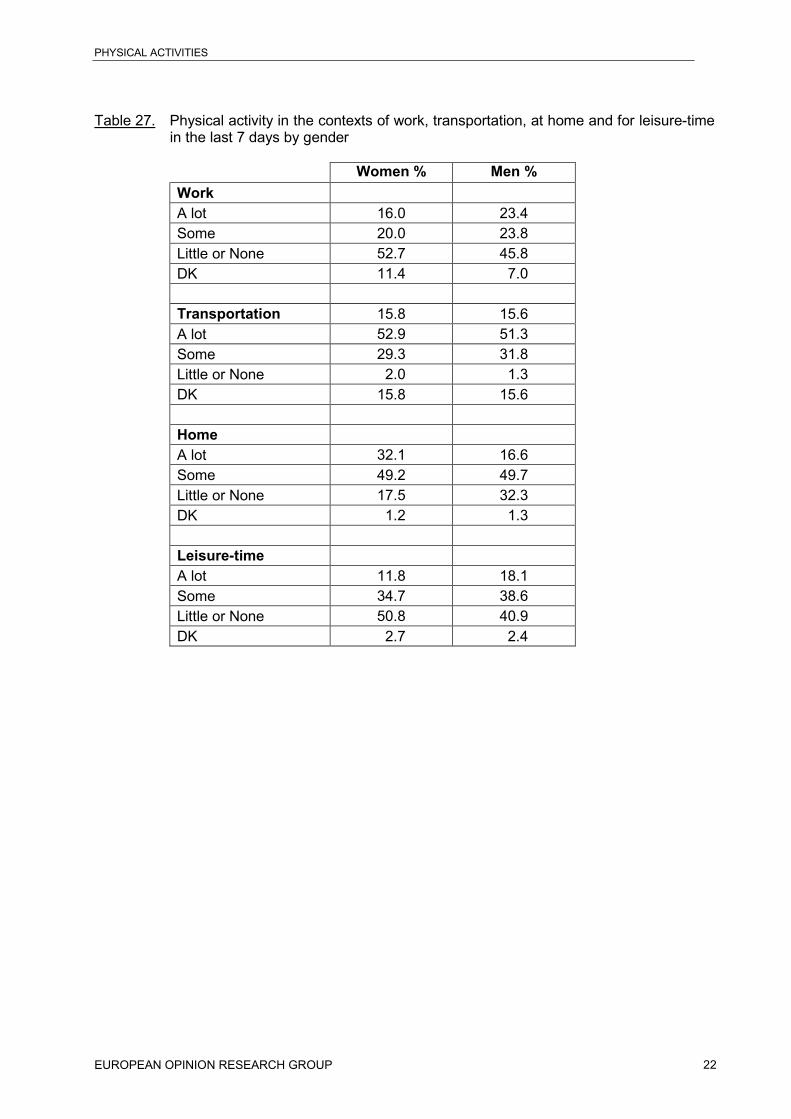
For physical activity at work, men reported to a higher rate a lot and some physical activity
during the last 7 days than women. There is no variations in physical activity in the context of
transportation between men and women.
About a third of women (32.1%) reported a lot of physical activity in and around the home in the
last 7 days. For men, 16.6% reported a lot of physical activity in and around the home in the last
7 days.
Men are, however, more likely to report a lot (18.1%) or some (38.6%) leisure-time physical
activity than women.
PHYSICAL ACTIVITIES
EUROPEAN OPINION RESEARCH GROUP 22
Table 27. Physical activity in the contexts of work, transportation, at home and for leisure-timein the last 7 days by gender
Women % Men %WorkA lot 16.0 23.4Some 20.0 23.8Little or None 52.7 45.8DK 11.4 7.0
Transportation 15.8 15.6A lot 52.9 51.3Some 29.3 31.8Little or None 2.0 1.3DK 15.8 15.6
HomeA lot 32.1 16.6Some 49.2 49.7Little or None 17.5 32.3DK 1.2 1.3
Leisure-timeA lot 11.8 18.1Some 34.7 38.6Little or None 50.8 40.9DK 2.7 2.4

PHYSICAL ACTIVITIES
EUROPEAN OPINION RESEARCH GROUP 23
2.4. Context of physical activity in the Member States
Participation rates in physical activity in the last 7 days varied across the Member States.
A lot of physical activity in the context of work was reported by respondents in Austria (30.2%),
the Netherlands (28.7%) and Germany (24.7%).
In the last 7 days, how much physical activity did you get at work?
0102030405060708090
100
AUS NEL GER IRL GB EU15
DEN SPA POR GRE FRA LUX BEL ITA SWE FIN
A lot Some Little/ None
The lowest rates of participation in a lot of physical activity at work were reported in Finland
(10.6%), Sweden (12.4%) and Italy (12.9%).

PHYSICAL ACTIVITIES
EUROPEAN OPINION RESEARCH GROUP 24
For the context of transportation, a lot of physical activity was reported by respondents in Great
Britain (26.3%), Portugal (21.6%), Ireland (20.7%), the Netherlands (20%) and Germany
(19.3%).
Lower rates of such physical activity were reported in Finland (4.9%), Belgium (6%), and France
(6.9%), where only about 6% of respondents reported a lot of physical activity for the means of
transportation.
In the last 7 days, how much physical activity did you get when moving from place to place?
0102030405060708090
100
GB POR IRL NEL GER AUS SPA EU15
SWE GRE ITA DEN LUX FRA BEL FIN
A lot Some Little/ None

PHYSICAL ACTIVITIES
EUROPEAN OPINION RESEARCH GROUP 25
About one third of respondents in Germany (37.9%), Great Britain (35.2%), and the Netherlands
(33.4%) reported a lot of physical activity in and around of home. In Finland (8.5%), France
(10.3%), and Belgium (15.2%) only about 10% of respondents reported a lot of physical activity
in the context of home.
A high prevalence of a lot of leisure-time physical activity was found in the Netherlands (24.2%),
Sweden (22.6%), Luxembourg (22.2%), Ireland (19.8%), and Austria (19.3%).
At the low end, less than 10% of respondents in the southern European countries Greece
(8.7%), Portugal (9.4%), and Italy (9.8%) reported a lot of physical activity for recreational
purposes. For Finland it can be noted, that only 11.7% of adults reported a lot of leisure time
physical activity in the last 7 days, that however, compared to the other countries, a high rate of
respondents reported moderate levels of recreational physical activity (46.7%)
In the last 7 days, how much physical activity did you get work in and around your house (including housework, gardening, general
maintenance, or caring for family)?
0102030405060708090
100
GER GB NEL AUS IRL EU15
SPA POR LUX GRE ITA DEN SWE BEL FRA FIN
A lot Some Little/ None

PHYSICAL ACTIVITIES
EUROPEAN OPINION RESEARCH GROUP 26
In the last 7 days, how much physical activity did you get for recreation, sport and leisure-time activities?
0102030405060708090
100
NEL SWE LUX IRL AUS GB SPA GER EU15
FRA DEN BEL FIN ITA POR GRE
A lot Some Little/ None

PHYSICAL ACTIVITIES
EUROPEAN OPINION RESEARCH GROUP 27
3. Perception of Environmental Opportunities for Physical Activity
3.1. General Situation in the European Union
In order to assess the perception of adults of environmental opportunities for physical activity,
three items were used.
The first item asked whether respondents agreed or disagreed with the statement “The area
where I live offers me many opportunities to be physically active”.
The second item asked whether respondents agreed or disagreed with the statement “Local
sport clubs and other local providers offer many opportunities to be physically active”.
The third item asked whether respondents agreed or disagreed with the statement “My local
authority does enough for its citizens concerning their physical activities”.
Table 28. Perception of opportunities to be physically active in local area
Q.58.a: To what extent do you agree or disagree with the following statement concerning sportand physical activity?“The area where I live offers me many opportunities to be physically active.”
% EU 15Strongly agree 28.3Tend to agree 41.7Tend to disagree 14.2Strongly disagree 9.2DK 6.7
It can be noted that more than two thirds (70.0%) of the population strongly agreed or agreed
that the area where they live offers many opportunities to be physically active.
Similarly, more than two thirds of respondents (69.2%) strongly agreed or agreed that local
sport clubs or other providers offer many opportunities to be physically active.
The percentage of those that strongly agreed or agreed that their local authority does enough
for its citizens concerning physical activity was slightly lower (55.7%).

PHYSICAL ACTIVITIES
EUROPEAN OPINION RESEARCH GROUP 28
Table 29. Perception of local sport clubs and other local providers offering many opportunitiesto be physically active
Q.58.b: To what extent do you agree or disagree with the following statement concerningsport and physical activity?“Local sport clubs and other local providers offer many opportunities to be physicallyactive.”
% EU 15Strongly agree 27.5Tend to agree 41.7Tend to disagree 12.7Strongly disagree 9.0DK 9.1
Table 30. Perception of local authority doing enough for citizens physical activity
Q.58.c: To what extent do you agree or disagree with the following statement concerningsport and physical activity?“My local authority does enough for its citizens concerning their physical activities.”
% EU 15Strongly agree 18.1Tend to agree 37.6Tend to disagree 19.0Strongly disagree 13.0DK 12.3

PHYSICAL ACTIVITIES
EUROPEAN OPINION RESEARCH GROUP 29
3.2. Perception of Environmental Opportunities for Physical Activity by age
Between the age groups of the 15-25 years old, the 26-44 years old, and the 45-65 years old
only minor variations in regard to the perception of environmental opportunities for physical
activity could be observed.
Compared to these 3 age groups, however, those being 65 years of age and older had more
critical perceptions of environmental opportunities for physical activity. Only about 20% of adults
65 years of age and older strongly agreed to the statements concerning environmental
opportunities for physical activity, in the other age groups, this rate was about 30%.
Table 31. Perception of environmental opportunities for physical activity by age
15-25years %
26-44years %
45-64years %
65 +years%
“The area where I live offers memany opportunities to be physicallyactive”Strongly agree 31.0 29.0 29.2 22.9Tend to agree 40.4 42.8 43.3 38.3Tend to disagree 16.1 15.3 13.1 12.3Strongly disagree 10.0 9.3 8.0 9.8DK 2.5 3.6 6.3 16.7
“Local sport clubs and other localproviders offer many opportunitiesto be physically active”Strongly agree 30.1 28.8 28.6 21.0Tend to agree 43.0 42.8 42.3 37.4Tend to disagree 13.4 13.6 12.5 10.6Strongly disagree 9.5 9.1 7.8 10.2DK 3.9 5.6 8.8 20.9
“My local authority does enoughfor its citizens concerning theirphysical activities”Strongly agree 18.6 17.4 19.3 17.2Tend to agree 36.6 38.5 39.2 34.5Tend to disagree 21.6 20.8 18.1 14.8Strongly disagree 14.4 13.8 12.1 11.3DK 8.6 9.7 11.3 22.2
PHYSICAL ACTIVITIES
EUROPEAN OPINION RESEARCH GROUP 30
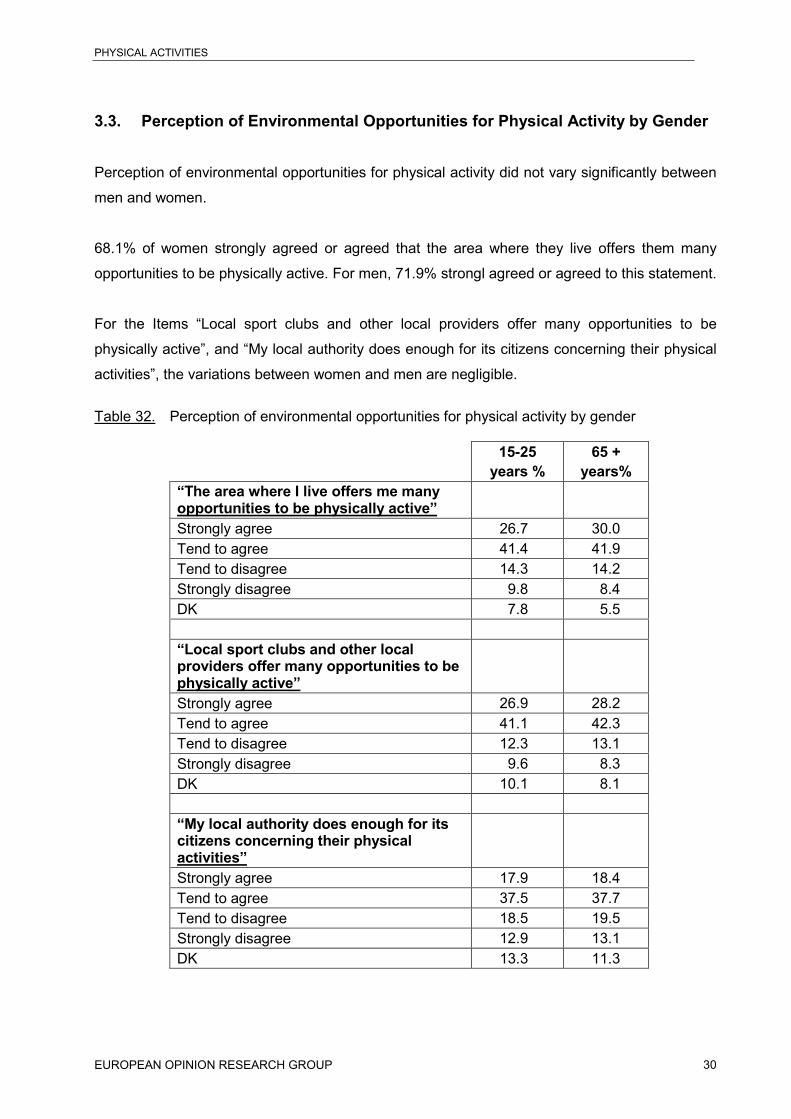
3.3. Perception of Environmental Opportunities for Physical Activity by Gender
Perception of environmental opportunities for physical activity did not vary significantly between
men and women.
68.1% of women strongly agreed or agreed that the area where they live offers them many
opportunities to be physically active. For men, 71.9% strongl agreed or agreed to this statement.
For the Items “Local sport clubs and other local providers offer many opportunities to be
physically active”, and “My local authority does enough for its citizens concerning their physical
activities”, the variations between women and men are negligible.
Table 32. Perception of environmental opportunities for physical activity by gender
15-25years %
65 +years%
“The area where I live offers me manyopportunities to be physically active”Strongly agree 26.7 30.0Tend to agree 41.4 41.9Tend to disagree 14.3 14.2Strongly disagree 9.8 8.4DK 7.8 5.5
“Local sport clubs and other localproviders offer many opportunities to bephysically active”Strongly agree 26.9 28.2Tend to agree 41.1 42.3Tend to disagree 12.3 13.1Strongly disagree 9.6 8.3DK 10.1 8.1
“My local authority does enough for itscitizens concerning their physicalactivities”Strongly agree 17.9 18.4Tend to agree 37.5 37.7Tend to disagree 18.5 19.5Strongly disagree 12.9 13.1DK 13.3 11.3
PHYSICAL ACTIVITIES
EUROPEAN OPINION RESEARCH GROUP 31
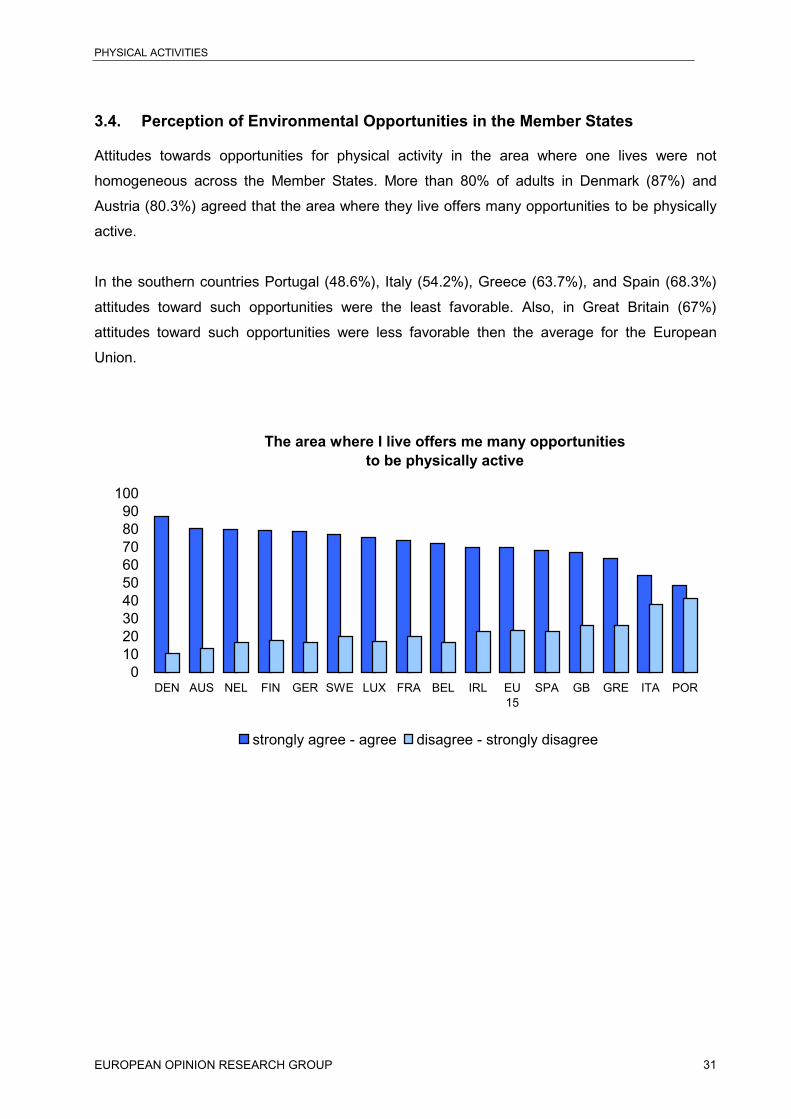
3.4. Perception of Environmental Opportunities in the Member States
Attitudes towards opportunities for physical activity in the area where one lives were not
homogeneous across the Member States. More than 80% of adults in Denmark (87%) and
Austria (80.3%) agreed that the area where they live offers many opportunities to be physically
active.
In the southern countries Portugal (48.6%), Italy (54.2%), Greece (63.7%), and Spain (68.3%)
attitudes toward such opportunities were the least favorable. Also, in Great Britain (67%)
attitudes toward such opportunities were less favorable then the average for the European
Union.
The area where I live offers me many opportunities to be physically active
0102030405060708090
100
DEN AUS NEL FIN GER SWE LUX FRA BEL IRL EU15
SPA GB GRE ITA POR
strongly agree - agree disagree - strongly disagree

PHYSICAL ACTIVITIES
EUROPEAN OPINION RESEARCH GROUP 32
The statement that local sport clubs and other providers offer many opportunities for physical
activity is agreed upon by almost 90% of adults in the Netherland (88.7%), and Denmark
(86.7%). Finland (78.6%), Germany (74.8%), and Sweden (73.9%) did also show a higher than
average approval to this statement.
Local sport clubs and other local providers offermany opportunities to be physically active
0102030405060708090
100
NEL DEN FIN GER SWE AUS LUX IRL FRA BEL GB EU15
SPA GRE ITA POR
strongly agree - agree disagree - strongly disagree
The southern countries Portugal (44.9%), Italy (54.1%), and Greece (62.7) had the lowest rate
of approval to this statement in comparison to the other Member States.
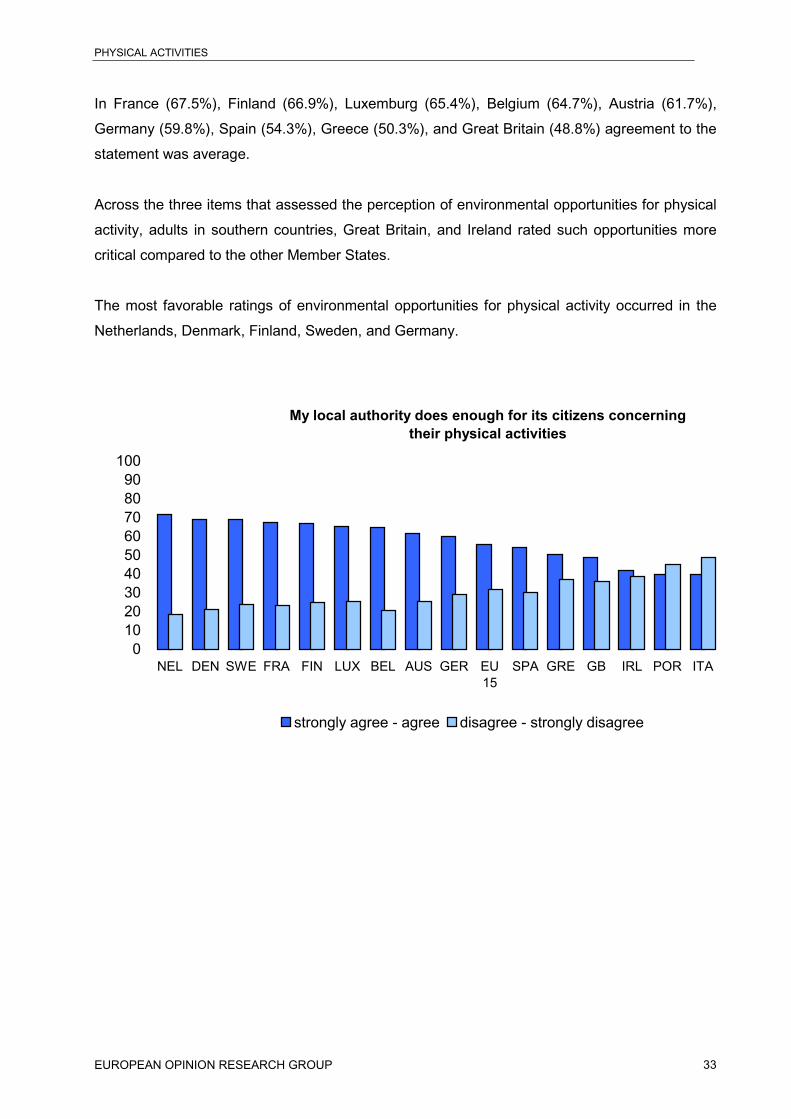
In comparison to the first two items, the statement “My local authority does enough for its
citizens concerning their physical activities” yields lower rates of agreement across Member
States.
In the Netherlands (71.4%), Denmark (69%), and Sweden (68.7%) agreement to this statement
was comparably high.
Italy (39.4%), Portugal (39.9%), and Ireland (41.6%) featured the lowest rate of agreement to
this statement. For Italy, and Portugal, the rates of adults that disagree to the statement that
local authorities do enough for citizens concerning physical activity was higher than the rate of
adults who agreed to the statement.
PHYSICAL ACTIVITIES
EUROPEAN OPINION RESEARCH GROUP 33
In France (67.5%), Finland (66.9%), Luxemburg (65.4%), Belgium (64.7%), Austria (61.7%),
Germany (59.8%), Spain (54.3%), Greece (50.3%), and Great Britain (48.8%) agreement to the
statement was average.
Across the three items that assessed the perception of environmental opportunities for physical
activity, adults in southern countries, Great Britain, and Ireland rated such opportunities more
critical compared to the other Member States.
The most favorable ratings of environmental opportunities for physical activity occurred in the
Netherlands, Denmark, Finland, Sweden, and Germany.
My local authority does enough for its citizens concerning their physical activities
0102030405060708090
100
NEL DEN SWE FRA FIN LUX BEL AUS GER EU15
SPA GRE GB IRL POR ITA
strongly agree - agree disagree - strongly disagree

PHYSICAL ACTIVITIES
EUROPEAN OPINION RESEARCH GROUP 34
4. Methodological considerations
4.1. International Physical Activity Questionnaire (IPAQ)
The “International Physical Activity Questionnaire” was used to estimate the prevalence of
physical activity in the Member States (Q.50–Q.56). The intend of the IPAQ is to provide an
instrument that can be used to monitor levels of physical activity globally. During the creation of
the IPAQ, special emphasis was placed on developing an instrument that has a high level of
cultural equivalence, and that can be used for the cross-national comparison of physical activity
levels.
Cultural equivalence was definded as:
Conceptual equivalence: Respondents have to attach the same meaning to the terms and
concepts used in the IPAQ.
Metric equivalence: The numbers reported should mean the same thing to respondents (e.g.
intensity levels of used examples are consistent across nations).
Linguistic equivalence: Terminology and grammar used in the IPAQ have to have the same
meaning across nations.
For use in the EUROBAROMETER, the existing English version of the IPAQ was translated into
all languages of the Member States paying close attention to these problems of cultural
equivalence.
In the first step of the translation prozess, the English master version of the IPAQ short form
was provided to INRA, and INRA created national versions for all Member States with the help
of their national partners. Secondly, these national versions were sent to physical activity
experts in all Member States. Physical activity experts had to compare their national version to
the English master version in regard to cultural equivalence. Physical activity experts were
encouraged to make necessary recommendations in order to increase the cultural equivalence
of their national version. Thirdly, the recommendations of the physical activity experts were
considered by INRA in the process of finalizing the national versions of the IPAQ that were used
in the EUROBAROMETER.
The IPAQ was tested for reliability and validity by the IPAQ committee in 12 countries in the
years 1998-1999.
PHYSICAL ACTIVITIES
EUROPEAN OPINION RESEARCH GROUP 35
Test-retest reliability was determined to be around 0.8 for Spearman’s Rho when the retest was
performed after 3 to 7 days.
Criterion validity was determined to be around 0.3 (Rho) when tested against accelerometer
(computer science application) data from 7 consecutive days.
The test-retest reliabilty of the IPAQ was also examined in the European Physical Activity
Surveillance System (EUPASS) project. Measures of Spearman’s Rho indicated a test-retest
reliability for the “last 7 days” short version of the IPAQ of around 0.4.
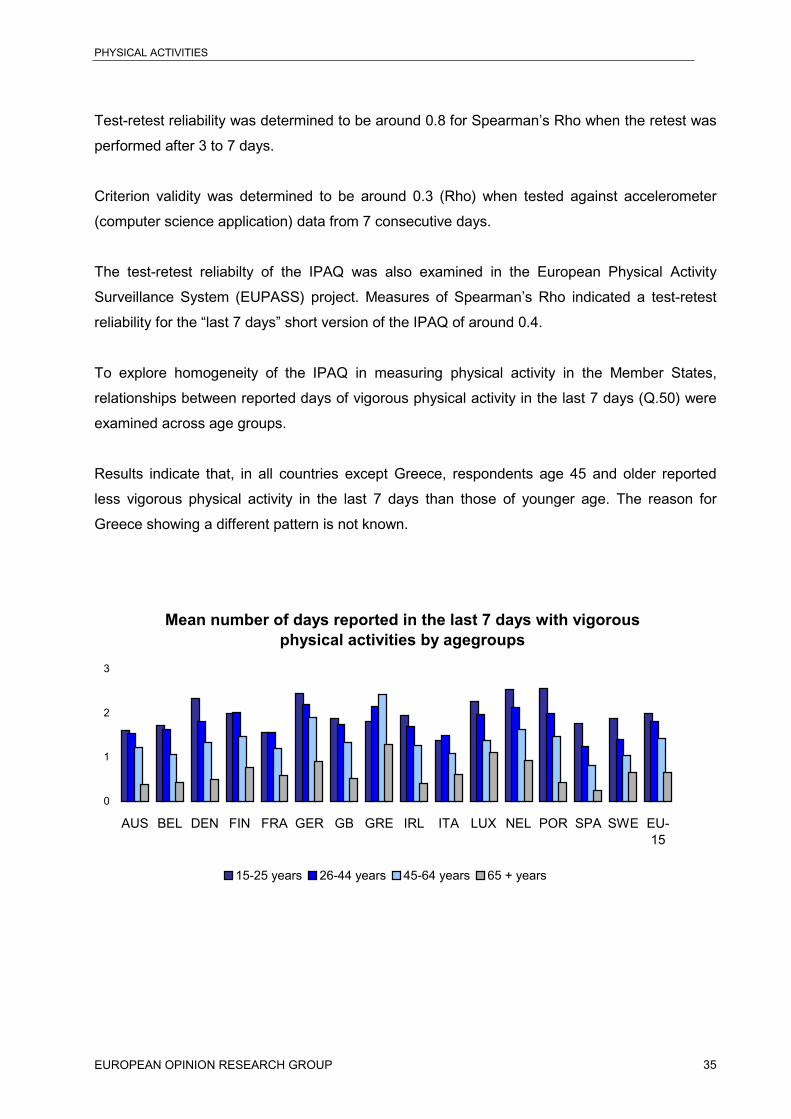
To explore homogeneity of the IPAQ in measuring physical activity in the Member States,
relationships between reported days of vigorous physical activity in the last 7 days (Q.50) were
examined across age groups.
Results indicate that, in all countries except Greece, respondents age 45 and older reported
less vigorous physical activity in the last 7 days than those of younger age. The reason for
Greece showing a different pattern is not known.
Mean number of days reported in the last 7 days with vigorous physical activities by agegroups
0
1
2
3
AUS BEL DEN FIN FRA GER GB GRE IRL ITA LUX NEL POR SPA SWE EU-15
15-25 years 26-44 years 45-64 years 65 + years

PHYSICAL ACTIVITIES
EUROPEAN OPINION RESEARCH GROUP 36
4.2. Context of Physical Activity
The context of physical activity in the last 7 days was assessed by question Q.57. Test-retest
reliability of these items was assessed in the European Physical Activity Surveillance (EUPASS)
project.
For physical activity in the context of work, Spearmans Roh was 0.54, in the context of
transportation it was 0.41, at home it was 0.43, and for leisure it was 0.42 when retested after 7
to 10 days.
4.3. Perception of Environmental Opportunities for Physical Activity
Questions 58 were used to assess the perception of environmental opportunities for physical
activity in the Member States. The 3 items were tested for reliability in the European Physical
Activity Surveillance (EUPASS) project.
Test-retest reliability for Spearmans Roh were 0.66 for item Q.58.a, 0.64 for item Q.58.b, and
0.71 for item Q.58.c when retested after 7 to 10 days.

PHYSICAL ACTIVITIES
EUROPEAN OPINION RESEARCH GROUP 37
APPENDIX
PHYSICAL ACTIVITIES
EUROPEAN OPINION RESEARCH GROUP 38
Technical Specifications
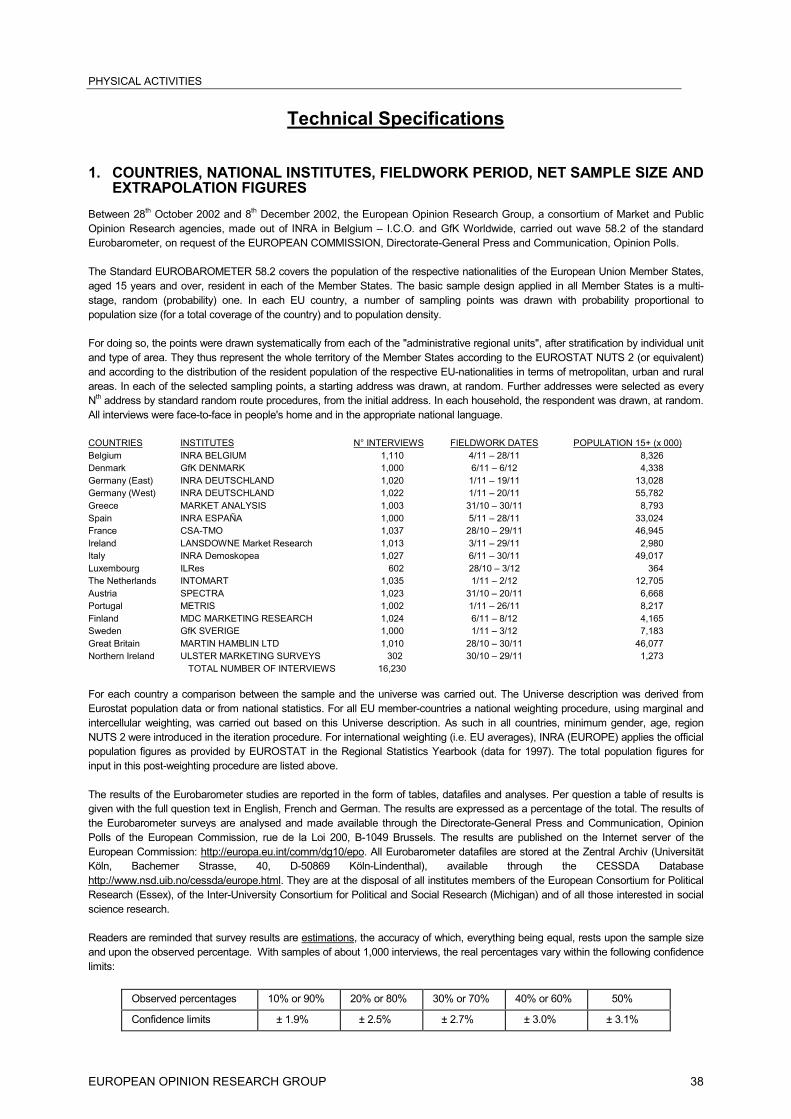
1. COUNTRIES, NATIONAL INSTITUTES, FIELDWORK PERIOD, NET SAMPLE SIZE ANDEXTRAPOLATION FIGURES
Between 28th October 2002 and 8th December 2002, the European Opinion Research Group, a consortium of Market and PublicOpinion Research agencies, made out of INRA in Belgium – I.C.O. and GfK Worldwide, carried out wave 58.2 of the standardEurobarometer, on request of the EUROPEAN COMMISSION, Directorate-General Press and Communication, Opinion Polls.
The Standard EUROBAROMETER 58.2 covers the population of the respective nationalities of the European Union Member States,aged 15 years and over, resident in each of the Member States. The basic sample design applied in all Member States is a multi-stage, random (probability) one. In each EU country, a number of sampling points was drawn with probability proportional topopulation size (for a total coverage of the country) and to population density.
For doing so, the points were drawn systematically from each of the "administrative regional units", after stratification by individual unitand type of area. They thus represent the whole territory of the Member States according to the EUROSTAT NUTS 2 (or equivalent)and according to the distribution of the resident population of the respective EU-nationalities in terms of metropolitan, urban and ruralareas. In each of the selected sampling points, a starting address was drawn, at random. Further addresses were selected as everyNth address by standard random route procedures, from the initial address. In each household, the respondent was drawn, at random.All interviews were face-to-face in people's home and in the appropriate national language.
COUNTRIES INSTITUTES N° INTERVIEWS FIELDWORK DATES POPULATION 15+ (x 000)Belgium INRA BELGIUM 1,110 4/11 – 28/11 8,326Denmark GfK DENMARK 1,000 6/11 – 6/12 4,338Germany (East) INRA DEUTSCHLAND 1,020 1/11 – 19/11 13,028Germany (West) INRA DEUTSCHLAND 1,022 1/11 – 20/11 55,782Greece MARKET ANALYSIS 1,003 31/10 – 30/11 8,793Spain INRA ESPAÑA 1,000 5/11 – 28/11 33,024France CSA-TMO 1,037 28/10 – 29/11 46,945Ireland LANSDOWNE Market Research 1,013 3/11 – 29/11 2,980Italy INRA Demoskopea 1,027 6/11 – 30/11 49,017Luxembourg ILRes 602 28/10 – 3/12 364The Netherlands INTOMART 1,035 1/11 – 2/12 12,705Austria SPECTRA 1,023 31/10 – 20/11 6,668Portugal METRIS 1,002 1/11 – 26/11 8,217Finland MDC MARKETING RESEARCH 1,024 6/11 – 8/12 4,165Sweden GfK SVERIGE 1,000 1/11 – 3/12 7,183Great Britain MARTIN HAMBLIN LTD 1,010 28/10 – 30/11 46,077Northern Ireland ULSTER MARKETING SURVEYS 302 30/10 – 29/11 1,273
TOTAL NUMBER OF INTERVIEWS 16,230
For each country a comparison between the sample and the universe was carried out. The Universe description was derived fromEurostat population data or from national statistics. For all EU member-countries a national weighting procedure, using marginal andintercellular weighting, was carried out based on this Universe description. As such in all countries, minimum gender, age, regionNUTS 2 were introduced in the iteration procedure. For international weighting (i.e. EU averages), INRA (EUROPE) applies the officialpopulation figures as provided by EUROSTAT in the Regional Statistics Yearbook (data for 1997). The total population figures forinput in this post-weighting procedure are listed above.
The results of the Eurobarometer studies are reported in the form of tables, datafiles and analyses. Per question a table of results isgiven with the full question text in English, French and German. The results are expressed as a percentage of the total. The results ofthe Eurobarometer surveys are analysed and made available through the Directorate-General Press and Communication, OpinionPolls of the European Commission, rue de la Loi 200, B-1049 Brussels. The results are published on the Internet server of theEuropean Commission: http://europa.eu.int/comm/dg10/epo. All Eurobarometer datafiles are stored at the Zentral Archiv (UniversitätKöln, Bachemer Strasse, 40, D-50869 Köln-Lindenthal), available through the CESSDA Databasehttp://www.nsd.uib.no/cessda/europe.html. They are at the disposal of all institutes members of the European Consortium for PoliticalResearch (Essex), of the Inter-University Consortium for Political and Social Research (Michigan) and of all those interested in socialscience research.
Readers are reminded that survey results are estimations, the accuracy of which, everything being equal, rests upon the sample sizeand upon the observed percentage. With samples of about 1,000 interviews, the real percentages vary within the following confidencelimits:
Observed percentages 10% or 90% 20% or 80% 30% or 70% 40% or 60% 50%
Confidence limits ± 1.9% ± 2.5% ± 2.7% ± 3.0% ± 3.1%
PHYSICAL ACTIVITIES
EUROPEAN OPINION RESEARCH GROUP 39
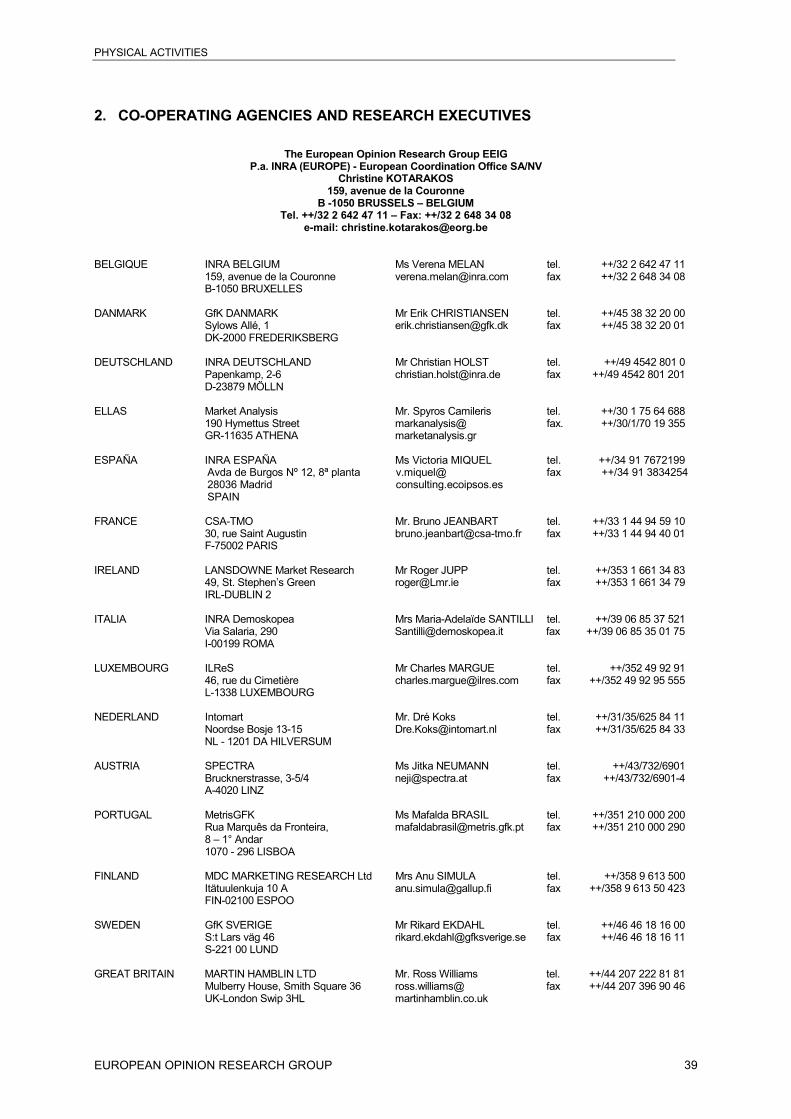
2. CO-OPERATING AGENCIES AND RESEARCH EXECUTIVES
The European Opinion Research Group EEIGP.a. INRA (EUROPE) - European Coordination Office SA/NV
Christine KOTARAKOS159, avenue de la Couronne
B -1050 BRUSSELS – BELGIUMTel. ++/32 2 642 47 11 – Fax: ++/32 2 648 34 08
e-mail: [email protected]
BELGIQUE INRA BELGIUM Ms Verena MELAN tel. ++/32 2 642 47 11159, avenue de la Couronne [email protected] fax ++/32 2 648 34 08B-1050 BRUXELLES
DANMARK GfK DANMARK Mr Erik CHRISTIANSEN tel. ++/45 38 32 20 00Sylows Allé, 1 [email protected] fax ++/45 38 32 20 01DK-2000 FREDERIKSBERG
DEUTSCHLAND INRA DEUTSCHLAND Mr Christian HOLST tel. ++/49 4542 801 0Papenkamp, 2-6 [email protected] fax ++/49 4542 801 201D-23879 MÖLLN
ELLAS Market Analysis Mr. Spyros Camileris tel. ++/30 1 75 64 688190 Hymettus Street markanalysis@ fax. ++/30/1/70 19 355GR-11635 ATHENA marketanalysis.gr
ESPAÑA INRA ESPAÑA Ms Victoria MIQUEL tel. ++/34 91 7672199Avda de Burgos Nº 12, 8ª planta v.miquel@ fax ++/34 91 383425428036 Madrid consulting.ecoipsos.esSPAIN
FRANCE CSA-TMO Mr. Bruno JEANBART tel. ++/33 1 44 94 59 1030, rue Saint Augustin [email protected] fax ++/33 1 44 94 40 01F-75002 PARIS
IRELAND LANSDOWNE Market Research Mr Roger JUPP tel. ++/353 1 661 34 83 49, St. Stephen’s Green [email protected] fax ++/353 1 661 34 79
IRL-DUBLIN 2
ITALIA INRA Demoskopea Mrs Maria-Adelaïde SANTILLI tel. ++/39 06 85 37 521 Via Salaria, 290 [email protected] fax ++/39 06 85 35 01 75
I-00199 ROMA
LUXEMBOURG ILReS Mr Charles MARGUE tel. ++/352 49 92 9146, rue du Cimetière [email protected] fax ++/352 49 92 95 555L-1338 LUXEMBOURG
NEDERLAND Intomart Mr. Dré Koks tel. ++/31/35/625 84 11Noordse Bosje 13-15 [email protected] fax ++/31/35/625 84 33NL - 1201 DA HILVERSUM
AUSTRIA SPECTRA Ms Jitka NEUMANN tel. ++/43/732/6901Brucknerstrasse, 3-5/4 [email protected] fax ++/43/732/6901-4A-4020 LINZ
PORTUGAL MetrisGFK Ms Mafalda BRASIL tel. ++/351 210 000 200Rua Marquês da Fronteira, [email protected] fax ++/351 210 000 2908 – 1° Andar1070 - 296 LISBOA
FINLAND MDC MARKETING RESEARCH Ltd Mrs Anu SIMULA tel. ++/358 9 613 500Itätuulenkuja 10 A [email protected] fax ++/358 9 613 50 423FIN-02100 ESPOO
SWEDEN GfK SVERIGE Mr Rikard EKDAHL tel. ++/46 46 18 16 00S:t Lars väg 46 [email protected] fax ++/46 46 18 16 11S-221 00 LUND
GREAT BRITAIN MARTIN HAMBLIN LTD Mr. Ross Williams tel. ++/44 207 222 81 81Mulberry House, Smith Square 36 ross.williams@ fax ++/44 207 396 90 46UK-London Swip 3HL martinhamblin.co.uk
PHYSICAL ACTIVITIES
EUROPEAN OPINION RESEARCH GROUP 40
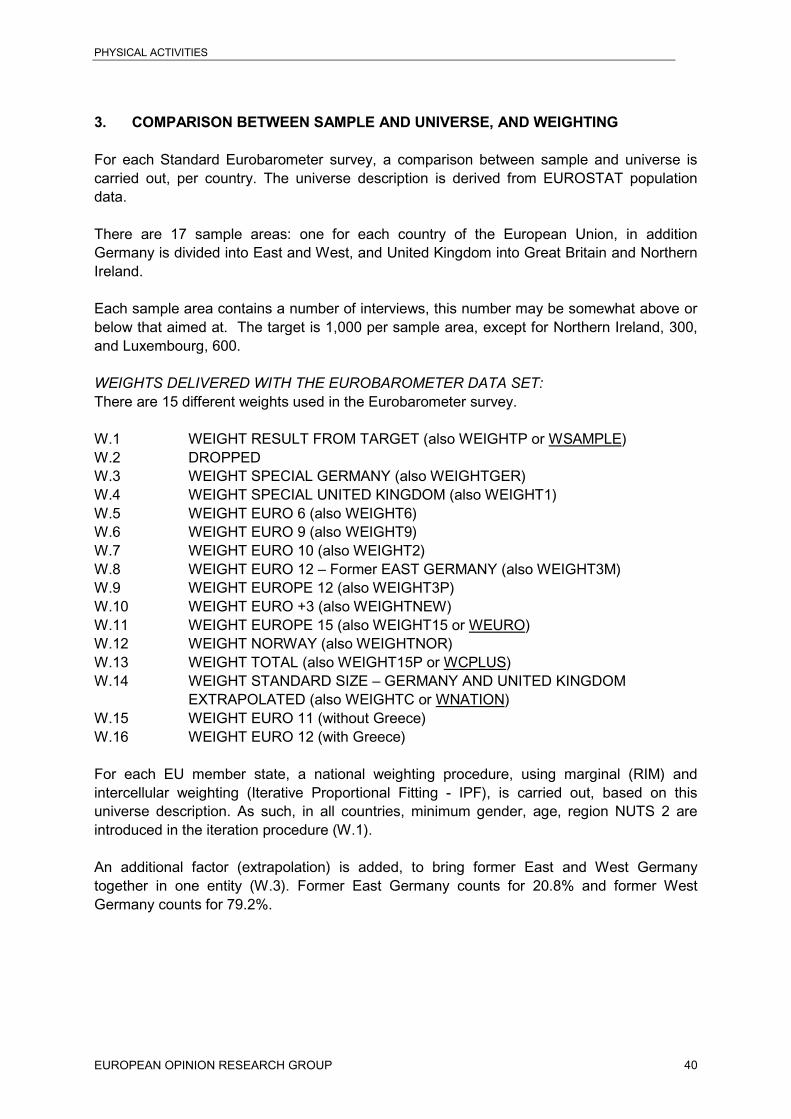
3. COMPARISON BETWEEN SAMPLE AND UNIVERSE, AND WEIGHTING
For each Standard Eurobarometer survey, a comparison between sample and universe iscarried out, per country. The universe description is derived from EUROSTAT populationdata.
There are 17 sample areas: one for each country of the European Union, in additionGermany is divided into East and West, and United Kingdom into Great Britain and NorthernIreland.
Each sample area contains a number of interviews, this number may be somewhat above orbelow that aimed at. The target is 1,000 per sample area, except for Northern Ireland, 300,and Luxembourg, 600.
WEIGHTS DELIVERED WITH THE EUROBAROMETER DATA SET:There are 15 different weights used in the Eurobarometer survey.
W.1 WEIGHT RESULT FROM TARGET (also WEIGHTP or WSAMPLE)W.2 DROPPEDW.3 WEIGHT SPECIAL GERMANY (also WEIGHTGER)W.4 WEIGHT SPECIAL UNITED KINGDOM (also WEIGHT1)W.5 WEIGHT EURO 6 (also WEIGHT6)W.6 WEIGHT EURO 9 (also WEIGHT9)W.7 WEIGHT EURO 10 (also WEIGHT2)W.8 WEIGHT EURO 12 – Former EAST GERMANY (also WEIGHT3M)W.9 WEIGHT EUROPE 12 (also WEIGHT3P)W.10 WEIGHT EURO +3 (also WEIGHTNEW)W.11 WEIGHT EUROPE 15 (also WEIGHT15 or WEURO)W.12 WEIGHT NORWAY (also WEIGHTNOR)W.13 WEIGHT TOTAL (also WEIGHT15P or WCPLUS)W.14 WEIGHT STANDARD SIZE – GERMANY AND UNITED KINGDOM
EXTRAPOLATED (also WEIGHTC or WNATION)W.15 WEIGHT EURO 11 (without Greece)W.16 WEIGHT EURO 12 (with Greece)
For each EU member state, a national weighting procedure, using marginal (RIM) andintercellular weighting (Iterative Proportional Fitting - IPF), is carried out, based on thisuniverse description. As such, in all countries, minimum gender, age, region NUTS 2 areintroduced in the iteration procedure (W.1).
An additional factor (extrapolation) is added, to bring former East and West Germanytogether in one entity (W.3). Former East Germany counts for 20.8% and former WestGermany counts for 79.2%.

PHYSICAL ACTIVITIES
EUROPEAN OPINION RESEARCH GROUP 41
The same principle is used to bring Northern Ireland together with Great Britain, to form theUnited Kingdom (W.4). Here Northern Ireland counts for 2.5% and Great Britain, for 97.5%.
For the sake of analysis, historical weights were created, bringing countries together,contained in historical entities such as Europe of the 6, 9, 10, and 12. (W.5 from to W.10).Countries not inserted in these weights are set to 0.
In order to make a European 15 weight, the data are extrapolated using population figuresfor each sample area (15 members = 17 sample areas) (W.11).
Standard Eurobarometer surveys may include data from Norway. A special weight is createdonly for Norway (W.12).
For international weighting, INRA applies the official population figures as provided byEUROSTAT in the Regional Statistical Yearbook (data for 1997). Total population figures forinput in this post-weighting procedure are listed above. The result is WEIGHT TOTAL (W.13)
W.14 extrapolates the new and old Länder to their respective proportion in the whole ofGermany, (former East Germany (20.8%), former West Germany (79.2%) and does thesame for Great Britain (97.5%) and Northern Ireland (2.5%). The other countries are leftuntouched.
From Eurobarometer 49 onwards, a new weight (W.15) was created to separate the 11countries that accepted to introduce the euro, as of 01/01/1999.
From Eurobarometer 54 onwards, a new weight (W.16) was created to add Greece into thegroup of countries that accepted to introduce the euro. For an analysis of these 12 countries,use W.16.

PHYSICAL ACTIVITIES
EUROPEAN OPINION RESEARCH GROUP 42
PRECISION OF WEIGHTS:Each weight is expressed in 10,000. This means that a person with weight equal to 1 willhave the weight 10,000, a person with weight equal to 1.534 will have the weight 15,340. Inother words, we use 4 decimal point digits. Hence, you need to divide by 10,000 to have thenumber of people interviewed contained in the data set.
WEIGHTED RESULTS
W1 W3 W4 W5 W6 W7 W8 W9 W10 W11 W14 W15 W16
BE 1110 1110 1110 299 361 387 369 410 0 476 1110 444 466
DK 1000 1000 1000 0 169 182 186 192 0 223 1000 276 243
WG 1022 1618 1022 1844 2227 2385 2442 2528 0 2935 1618 2741 2873
GE 2042 2043 2042 1844 2227 2385 2442 3118 0 3619 2043 3380 3543
EG 1020 425 1020 0 0 0 0 589 0 684 425 639 670
GR 1003 1003 1003 0 0 369 378 391 0 454 1003 560 444
SP 1000 1000 1000 0 0 0 1414 1465 0 1700 1000 1588 1664
FR 1037 1037 1037 1575 1902 2037 2085 2159 0 2506 1037 2341 2453
IR 1013 1013 1013 0 118 126 129 134 0 155 1013 145 152
IT 1027 1027 1027 1628 1967 2106 2156 2233 0 2591 1027 2421 2537
LU 602 602 602 12 14 15 16 16 0 19 602 18 18
NL 1035 1035 1035 425 514 550 563 583 0 677 1035 632 663
AU 1023 1023 1023 0 0 0 0 0 1136 351 1023 328 344
PO 1002 1002 1002 0 0 0 353 365 0 424 1002 396 415
FI 1024 1024 1024 0 0 0 0 0 710 220 1024 205 215
SW 1000 1000 1000 0 0 0 0 0 1196 370 1000 456 403
NI 302 302 33 0 50 54 55 57 0 66 33 82 72
GB 1010 1010 1280 0 1818 1947 1993 2064 0 2396 1280 2957 2609
UK 1312 1312 1313 0 1868 2001 2048 2121 0 2462 1313 3039 2681
EU15 16230 16231 16231 5783 9141 10159 12166 13187 3042 16246 16232 16230 16241
E _ _ _ _ _ _ _ _ _ _ _ 11899 _
PREIN4 _ _ _ _ _ _ _ _ _ _ _ 4332 _
EURO12 _ _ _ _ _ _ _ _ _ _ _ _ 12915
PREIN3 _ _ _ _ _ _ _ _ _ _ _ _ 3326
PHYSICAL ACTIVITIES
EUROPEAN OPINION RESEARCH GROUP 43
Questions on Physical Activity: ENGLISH VERSION
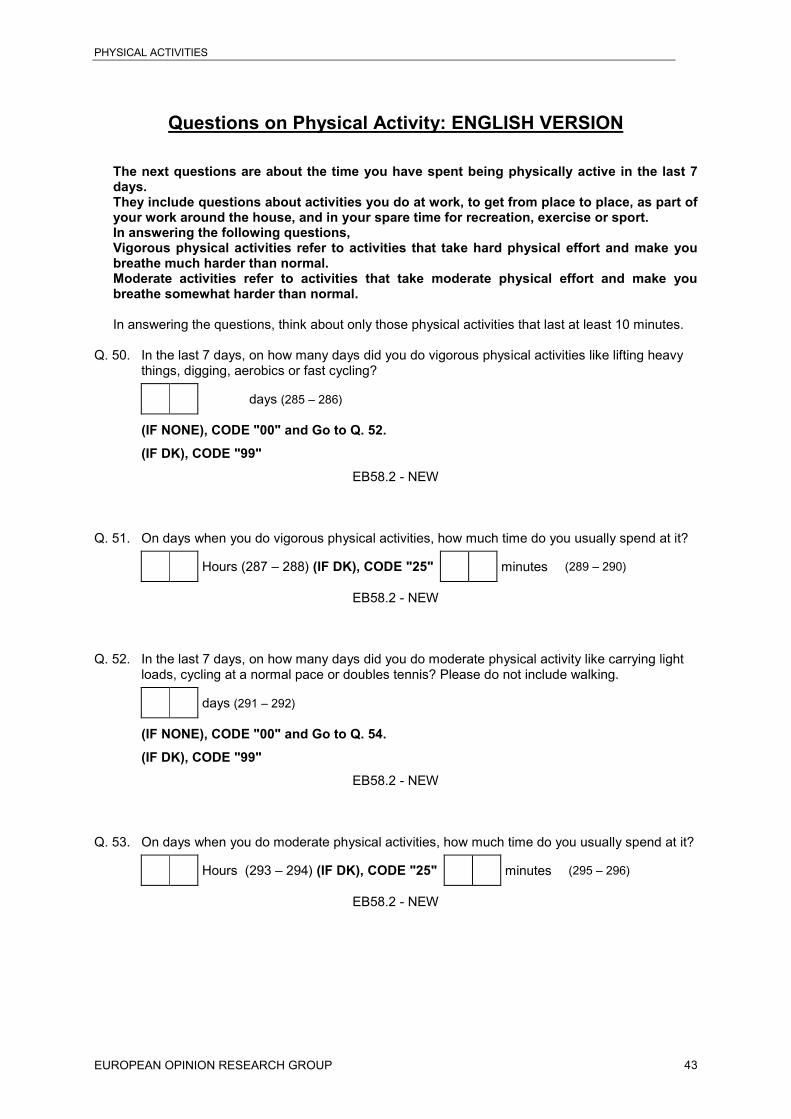
The next questions are about the time you have spent being physically active in the last 7days.They include questions about activities you do at work, to get from place to place, as part ofyour work around the house, and in your spare time for recreation, exercise or sport.In answering the following questions,Vigorous physical activities refer to activities that take hard physical effort and make youbreathe much harder than normal.Moderate activities refer to activities that take moderate physical effort and make youbreathe somewhat harder than normal.
In answering the questions, think about only those physical activities that last at least 10 minutes.
Q. 50. In the last 7 days, on how many days did you do vigorous physical activities like lifting heavythings, digging, aerobics or fast cycling?
days (285 – 286)
(IF NONE), CODE "00" and Go to Q. 52.(IF DK), CODE "99"
EB58.2 - NEW
Q. 51. On days when you do vigorous physical activities, how much time do you usually spend at it?
Hours (287 – 288) (IF DK), CODE "25" minutes (289 – 290)
EB58.2 - NEW
Q. 52. In the last 7 days, on how many days did you do moderate physical activity like carrying lightloads, cycling at a normal pace or doubles tennis? Please do not include walking.
days (291 – 292)
(IF NONE), CODE "00" and Go to Q. 54.(IF DK), CODE "99"
EB58.2 - NEW
Q. 53. On days when you do moderate physical activities, how much time do you usually spend at it?
Hours (293 – 294) (IF DK), CODE "25" minutes (295 – 296)
EB58.2 - NEW

PHYSICAL ACTIVITIES
EUROPEAN OPINION RESEARCH GROUP 44
Q. 54. In the last 7 days, on how many days did you walk for at least 10 minutes at a time?
days (297 – 298)
(IF NONE), CODE "00" and Go to Q. 56.(IF DK), CODE "99"
EB58.2 - NEWQ. 55. On days when you walk for at least 10 minutes at a time, how much time do you usually spend
walking?
hours (299 – 300) (IF DK), CODE "25" minutes (301 – 302)
EB58.2 - NEW
Q. 56. How much time do you spend sitting on usual day? This may include time spentat a desk, visiting friends, reading, studying or watching television.
Hours (303 – 304) (IF DK), CODE "25" minutes (305 – 306)
(IF NONE), CODE "00"EB58.2 - NEW
Q. 57. In the last 7 days, how much physical activity did you get…?
READ OUT A LOT SOME LITTLEOR NONE DK
1 at work 1 2 3 4(307)
2 when moving from place to place 1 2 3 4(308)
3work in and around your house (includinghousework, gardening, general maintenance,or caring for your family)
1 2 3 4(309)
4 for recreation, sport and leisure-time activities 1 2 3 4(310)
EB58.2 - NEW
Q. 58.To what extent do you agree or disagree with the following statementsconcerning sport and physical activity?
a) The area where I live offers me many opportunities to be physically active.(SHOW CARD - READ OUT - ONE ANSWER ONLY)
Strongly agree…………………………………………………………………………………… 1 (311)
Tend to agree…………………………………………………………………………………….. 2
Tend to disagree………………………………………………………………………………… 3
Strongly disagree………………………………………………………………………………… 4
DK…………………………………………………………………………………………………. 5
EB58.2 - NEW
PHYSICAL ACTIVITIES
EUROPEAN OPINION RESEARCH GROUP 45
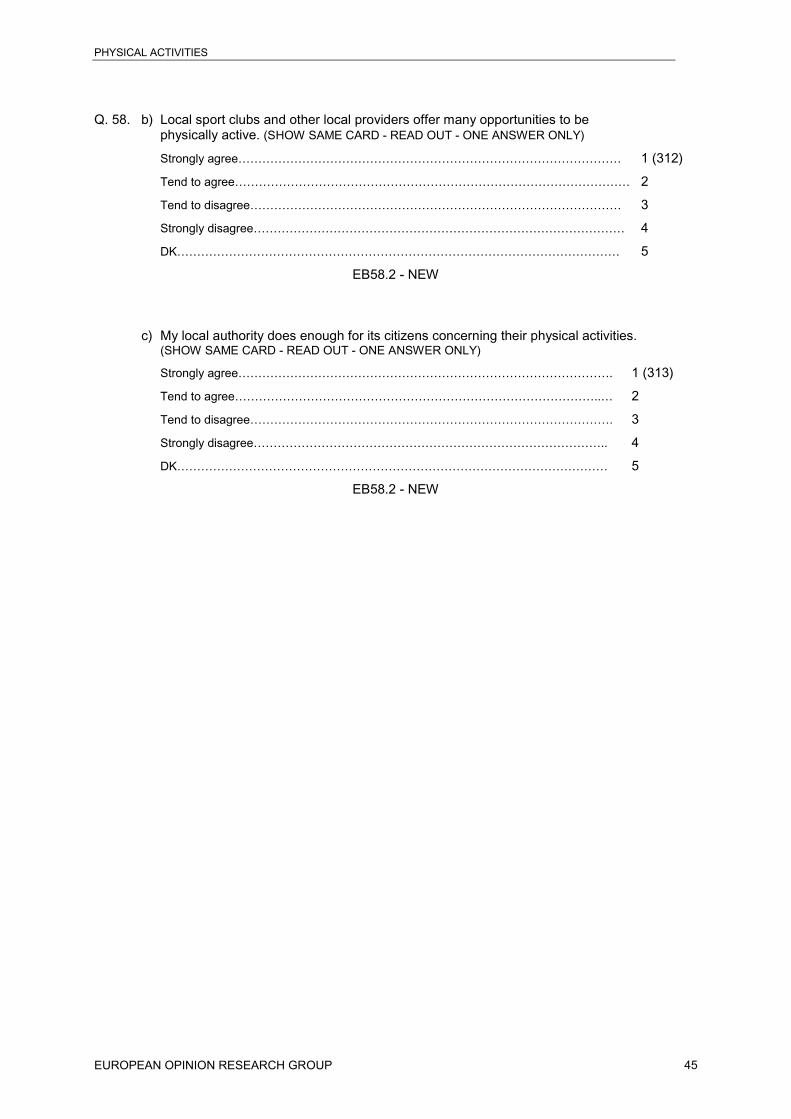
Q. 58. b) Local sport clubs and other local providers offer many opportunities to bephysically active. (SHOW SAME CARD - READ OUT - ONE ANSWER ONLY)
Strongly agree…………………………………………………………………………………… 1 (312)
Tend to agree……………………………………………………………………………………… 2
Tend to disagree………………………………………………………………………………… 3
Strongly disagree………………………………………………………………………………… 4
DK………………………………………………………………………………………………… 5
EB58.2 - NEW
c) My local authority does enough for its citizens concerning their physical activities.(SHOW SAME CARD - READ OUT - ONE ANSWER ONLY)
Strongly agree…………………………………………………………………………………. 1 (313)
Tend to agree………………………………………………………………………………..… 2
Tend to disagree………………………………………………………………………………. 3
Strongly disagree…………………………………………………………………………….. 4
DK……………………………………………………………………………………………… 5
EB58.2 - NEW

PHYSICAL ACTIVITIES
EUROPEAN OPINION RESEARCH GROUP 46
Frequencies of all Variables (unweighted results)THE NEXT QUESTIONS ARE ABOUT THE TIME YOU HAVE SPENT BEING PHYSICALLY ACTIVE IN THE LAST 7 DAYS. THEY INCLUDE QUESTIONS ABOUTACTIVITIES YOU DO AT WORK, TO GET FROM PLACE TO PLACE, AS PART OF YOUR WORK AROUND THE HOUSE, AND IN YOUR SPARE TIME FORRECREATION, EXERCISE OR SPORT. IN ANSWERING THE FOLLOWING QUESTIONS: "VIGOROUS PHYSICAL ACTIVITIES" REFER TO ACTIVITIES THATTAKE HARD PHYSICAL EFFORT AND MAKE YOU BREATHE MUCH HARDER THAN NORMAL. "MODERATE ACTIVITIES" REFER TO ACTIVITIES THAT TAKEMODERATET AND MAKE YOU BREATHE SOMEWHAT HARDER THAN NORMAL. IN ANSWERING THE QUESTIONS, THINK ABOUT ONLY THOSE PHYSICALACTIVITIES THAT YOU LAST AT LEAST 10 MINUTES.
Q.50. - In the last seven days, on how many days did you do vigorous physical activities like lifting heavy things, digging,aerobics or fast cycling?
None.................................................................................... 9286 57.2% 16230
1 day................................................................................... 1285 7.9%
2 days.................................................................................. 1443 8.9%
3 days.................................................................................. 1088 6.7%
4 days.................................................................................. 587 3.6%
5 days.................................................................................. 930 5.7%
6 days.................................................................................. 329 2.0%
7 days.................................................................................. 1068 6.6%
DK...................................................................................... 214 1.3%
Average
+--+--+ 1.472 0.000 7.000| | || | |+--+--+
IF "NONE", GO TO Q.52.
Q.51. - On days when you do vigorous physical activities, how much time do you usually spend at it?
Less than 1.00.......................................................................... 10856 66.9% 16230
From 1.00 to 1.30....................................................................... 3018 18.6%
From 1.31 to 2.30....................................................................... 1625 10.0%
From 2.31 to 3.30....................................................................... 154 0.9%
From 3.31 to 4.30....................................................................... 92 0.6%
More than 4.30.......................................................................... 96 0.6%
DK...................................................................................... 389 2.4%
Average (min.)
+--+--+--+--+ 67.810 0.000******| | | | || | | | |+--+--+--+--+
Q.52. - In the last seven days, on how many days did you do moderate physical activity like carrying light loads, cycling at anormal pace or doubles tennis? Please do not include walking.
None.................................................................................... 6051 37.3% 16230
1 day................................................................................... 1049 6.5%
2 days.................................................................................. 1750 10.8%
3 days.................................................................................. 1327 8.2%
4 days.................................................................................. 802 4.9%
5 days.................................................................................. 1341 8.3%
6 days.................................................................................. 541 3.3%
7 days.................................................................................. 3013 18.6%
DK...................................................................................... 356 2.2%
PHYSICAL ACTIVITIES
EUROPEAN OPINION RESEARCH GROUP 47
Average
+--+--+ 2.636 0.000 7.000| | || | |+--+--+
IF "NONE", GO TO Q.54.
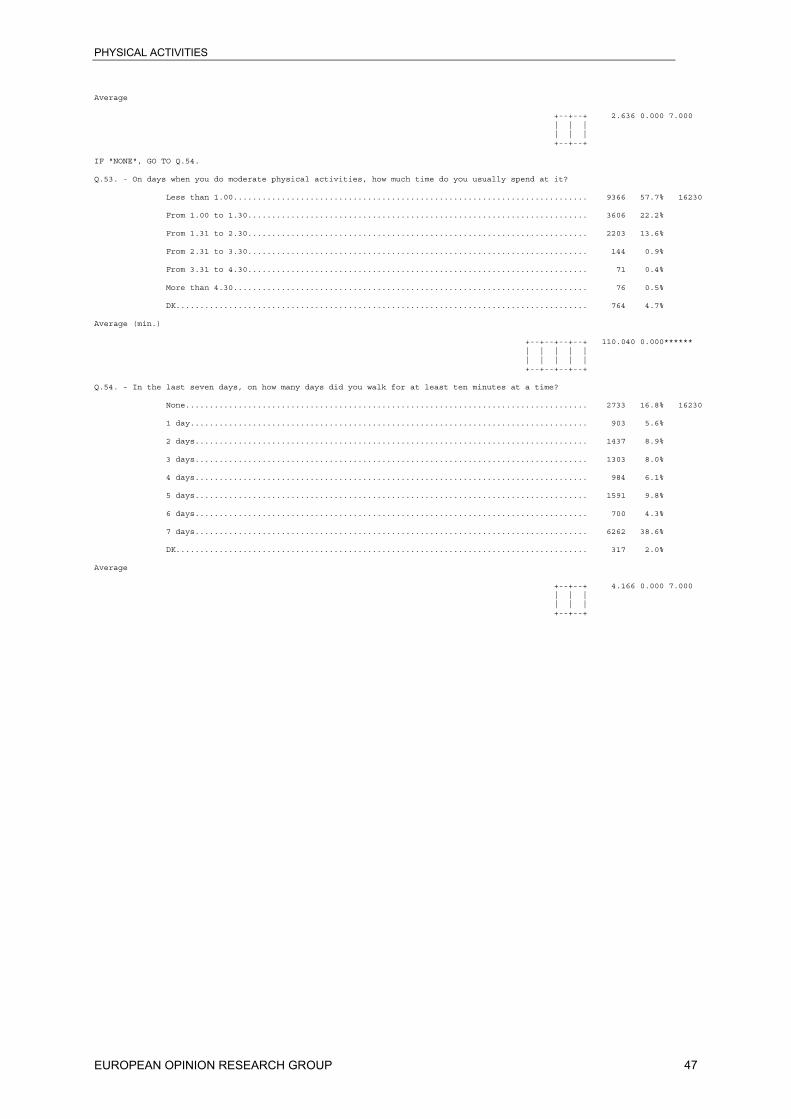
Q.53. - On days when you do moderate physical activities, how much time do you usually spend at it?
Less than 1.00.......................................................................... 9366 57.7% 16230
From 1.00 to 1.30....................................................................... 3606 22.2%
From 1.31 to 2.30....................................................................... 2203 13.6%
From 2.31 to 3.30....................................................................... 144 0.9%
From 3.31 to 4.30....................................................................... 71 0.4%
More than 4.30.......................................................................... 76 0.5%
DK...................................................................................... 764 4.7%
Average (min.)
+--+--+--+--+ 110.040 0.000******| | | | || | | | |+--+--+--+--+
Q.54. - In the last seven days, on how many days did you walk for at least ten minutes at a time?
None.................................................................................... 2733 16.8% 16230
1 day................................................................................... 903 5.6%
2 days.................................................................................. 1437 8.9%
3 days.................................................................................. 1303 8.0%
4 days.................................................................................. 984 6.1%
5 days.................................................................................. 1591 9.8%
6 days.................................................................................. 700 4.3%
7 days.................................................................................. 6262 38.6%
DK...................................................................................... 317 2.0%
Average
+--+--+ 4.166 0.000 7.000| | || | |+--+--+
PHYSICAL ACTIVITIES
EUROPEAN OPINION RESEARCH GROUP 48
IF "NONE", GO TO Q.56.
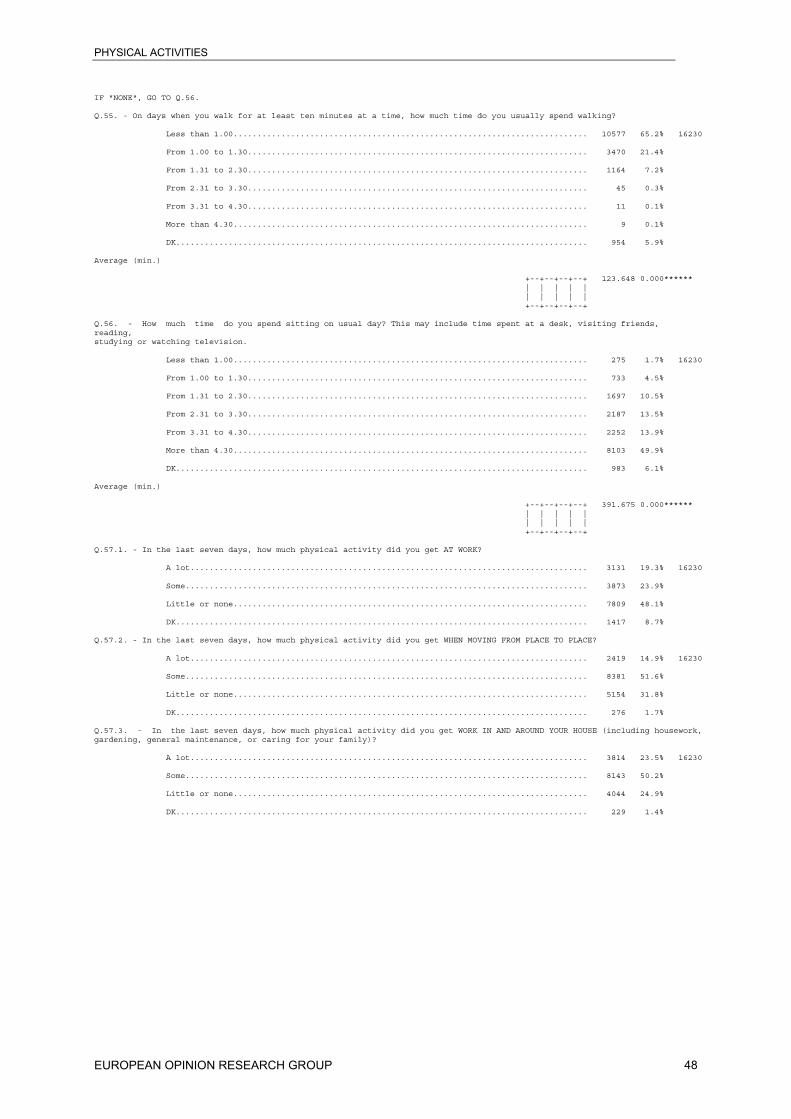
Q.55. - On days when you walk for at least ten minutes at a time, how much time do you usually spend walking?
Less than 1.00.......................................................................... 10577 65.2% 16230
From 1.00 to 1.30....................................................................... 3470 21.4%
From 1.31 to 2.30....................................................................... 1164 7.2%
From 2.31 to 3.30....................................................................... 45 0.3%
From 3.31 to 4.30....................................................................... 11 0.1%
More than 4.30.......................................................................... 9 0.1%
DK...................................................................................... 954 5.9%
Average (min.)
+--+--+--+--+ 123.648 0.000******| | | | || | | | |+--+--+--+--+
Q.56. - How much time do you spend sitting on usual day? This may include time spent at a desk, visiting friends,reading,studying or watching television.
Less than 1.00.......................................................................... 275 1.7% 16230
From 1.00 to 1.30....................................................................... 733 4.5%
From 1.31 to 2.30....................................................................... 1697 10.5%
From 2.31 to 3.30....................................................................... 2187 13.5%
From 3.31 to 4.30....................................................................... 2252 13.9%
More than 4.30.......................................................................... 8103 49.9%
DK...................................................................................... 983 6.1%
Average (min.)
+--+--+--+--+ 391.675 0.000******| | | | || | | | |+--+--+--+--+
Q.57.1. - In the last seven days, how much physical activity did you get AT WORK?
A lot................................................................................... 3131 19.3% 16230
Some.................................................................................... 3873 23.9%
Little or none.......................................................................... 7809 48.1%
DK...................................................................................... 1417 8.7%
Q.57.2. - In the last seven days, how much physical activity did you get WHEN MOVING FROM PLACE TO PLACE?
A lot................................................................................... 2419 14.9% 16230
Some.................................................................................... 8381 51.6%
Little or none.......................................................................... 5154 31.8%
DK...................................................................................... 276 1.7%
Q.57.3. - In the last seven days, how much physical activity did you get WORK IN AND AROUND YOUR HOUSE (including housework,gardening, general maintenance, or caring for your family)?
A lot................................................................................... 3814 23.5% 16230
Some.................................................................................... 8143 50.2%
Little or none.......................................................................... 4044 24.9%
DK...................................................................................... 229 1.4%

PHYSICAL ACTIVITIES
EUROPEAN OPINION RESEARCH GROUP 49
Q.57.4. - In the last seven days, how much physical activity did you get FOR RECREATION, SPORT AND LEISURE-TIME ACTIVITIES?
A lot................................................................................... 2431 15.0% 16230
Some.................................................................................... 6039 37.2%
Little or none.......................................................................... 7335 45.2%
DK...................................................................................... 425 2.6%
Q.58. - a) To what extent do you agree or disagree with the following statements concerning sport and physical activity?THE AREA WHERE I LIVE OFFERS ME MANY OPPORTUNITIES TO BE PHYSICALLY ACTIVE
Strongly agree.......................................................................... 5125 31.6% 16230
Tend to agree........................................................................... 6522 40.2%
Tend to disagree........................................................................ 2050 12.6%
Strongly disagree....................................................................... 1482 9.1%
DK...................................................................................... 1051 6.5%
Q.58. - b) To what extent do you agree or disagree with the following statements concerning sport and physical activity?LOCAL SPORT CLUBS AND OTHER LOCAL PROVIDERS OFFER MANY OPPORTUNITIES TO BE PHYSICALLY ACTIVE
Strongly agree.......................................................................... 4975 30.7% 16230
Tend to agree........................................................................... 6464 39.8%
Tend to disagree........................................................................ 1893 11.7%
Strongly disagree....................................................................... 1389 8.6%
DK...................................................................................... 1509 9.3%
Q.58. - c) To what extent do you agree or disagree with the following statements concerning sport and physical activity?MY LOCAL AUTHORITY DOES ENOUGH FOR ITS CITIZENS CONCERNING THEIR PHYSICAL ACTIVITIES
Strongly agree.......................................................................... 3255 20.1% 16230
Tend to agree........................................................................... 6061 37.3%
Tend to disagree........................................................................ 2946 18.2%
Strongly disagree....................................................................... 1958 12.1%
DK...................................................................................... 2010 12.4%