EBFM: Evolution or Revolution?s3.amazonaws.com › nefmc.org › 2a.-Description-of-an...potential...
38
Transcript of EBFM: Evolution or Revolution?s3.amazonaws.com › nefmc.org › 2a.-Description-of-an...potential...


EBFM: Evolution or Revolution?

The Challenge: A Deeply Interconnected System

“In view of the dynamic interactions in nature, a single-species approach to management is inadequate, particularly for multispecies fisheries, or fisheries where the by-catch is significant.
To avoid the deficiencies of a single-species approach, management might address itself to the productivity and harvest potential of an entire ecosystem, since the ecosystem in the long run has greater stability than any of its components.
… individual species, groups of species, or particular fisheries (defined by area or gear) would be regulated to control the relative balance of the species mix”
Hennemuth , R.C., B.J. Rothschild, L.G. Anderson, and W. A Lund(1980).
Northeast Fishery Management Task Force (1980)

The Whole is More Stable than its Parts

Ecosystem-Based Fisheries Management in the Northeast:Back to the Future

Phase I. Establish Goals and Objectives. Establish Ecosystem Production Units (EPUs) for consideration as management units. Develop Fishery Ecosystem Plan. 2012
Phase II. Identify management and scientific requirements to implement EBFM. Combine Multispecies Groundfish, Skate, and Monkfish Plans into joint plan accounting for biological interactions. Consider new reference points based on new modeling efforts for the species complex. 2013-14
Phase III. Implement EBFM. Implement quota-based management in all Ecosystem Production Units. Allocate all fishery resources to each EPU. Establish accumulation limits, transferability requirements, and permitting and monitoring requirements. Develop EIS for new plan. 2014-2017
2012 NEFMC Executive Committee Proposed EBFM Implementation Strategy

Aggregate Surplus Production Model for Northeast U.S Continental Shelf
(Brown et al. 1976)
ICNAF Two Tier System
-Determine total system MSY:MMSY 980,000 MT
-Allocate catches for each species accounting for by-catch and making sure thetotal doesn’t exceed systemMSY


Setting Catch Advice: Proposed Approach
1) Identify Ceiling (Upper Cap)2) Assign Catch Advice for Individual Species:
-- Subject to the following constraints:-Sum of Species Catches not to exceed Ceiling- Species not to fall below floor- Minimize variance
3) Additional Considerations: Incentive Structures

Northeast Regional Ecosystem Plan (NMFS 1988) Ecosystem Management Elements

Northeast Regional Ecosystem Plan (NMFS 1988)Ecosystem Management Elements

Fishery Functional Group: A group of species that are typically caught together in a particular type of gear and feed on similar food items


Defining Fishery Assemblages (Lucey and Fogarty)
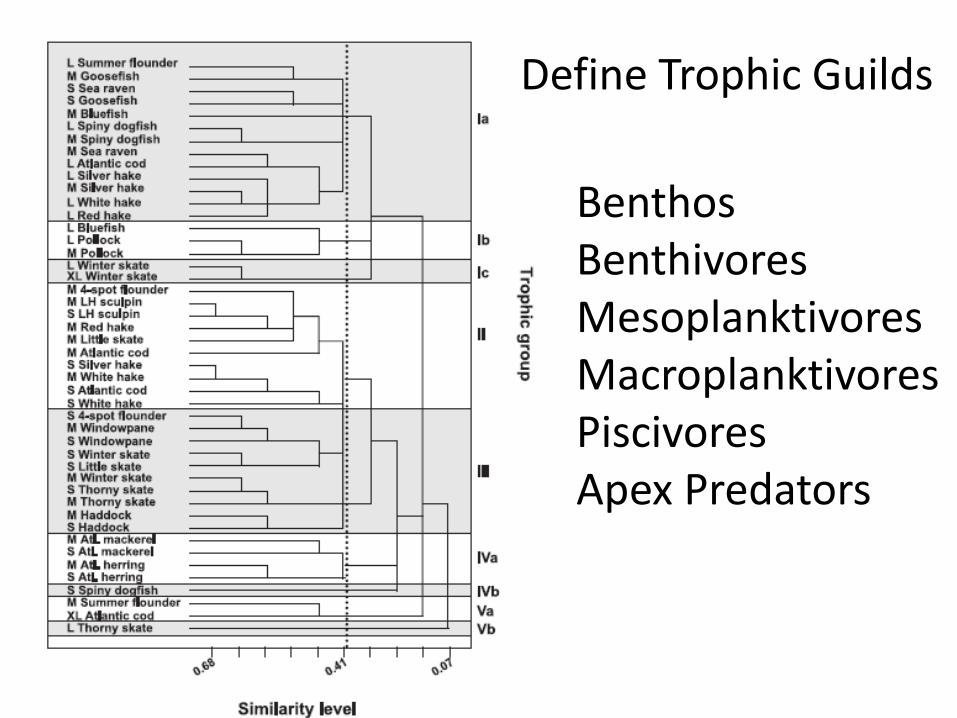
Define Trophic Guilds
Benthos BenthivoresMesoplanktivoresMacroplanktivoresPiscivoresApex Predators

Functional Group Trajectories:Commercial Landings

Functional Group Trajectories: NEFSC Survey

Energy is the Natural Currency for Ecosystem-Based Fisheries Management

Empirical Limit Reference Point:Exploitation Rate not to Exceed Ratio of
Microplankton to Total Production
Mean Ratio: 0.27

U.S. Department of Commerce| National Oceanic and Atmospheric Administration |NOAA Fisheries | Page 21
EMAX

Limit Reference Points: Production Model Approach:
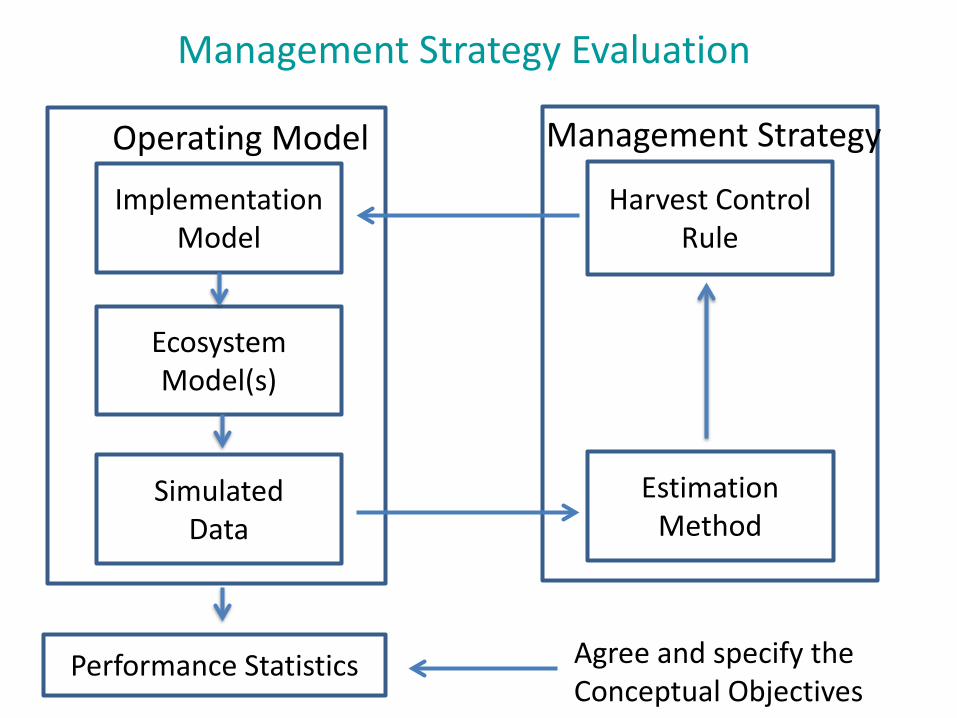
Operating Model
Implementation Model
EcosystemModel(s)
SimulatedData
Operating Model
Harvest Control Rule
Estimation Method
Management Strategy
Performance Statistics Agree and specify the Conceptual Objectives
Management Strategy Evaluation

Asse
ssm
ent
Mod
els
Ope
ratin
g M
odel
s
Ecosystem Production Potential ModelNetWork Model (EcoPath)
Multispecies Production ModelFunctional Group Production ModelMultispecies Delay-Difference Model
Multispecies Statistical Catch-at-Age Model
Length-Based Multispecies Model (Hydra)EcoSim, Atlantis
Revenue and Net Profitability ModelsPortfolio Models
Ener
gy F
low
Mod
els
Econ
omic
M
odul
esAvailable NEFSC Models For EBFM

• 10 fish species: 2 elasmobranchs, 2 pelagics, 4 groundfish, 2 flatfish Multispecies:
• 5 variable width size categories for each speciesSize structured
• Size specific predation mortalityEstimates predation mortality
• 2 growth forms, exponential and von Bertalanffy
• Temperature covariate on both growth forms
Environmental covariates on growth, maturity, fecundity
• 3 recruitment forms: Ricker, Beverton-Holt, Gamma (3 parameter)Multiple recruitment functions
• 3 fleets: bottom & pelagic trawls, fixed gearMultiple fishing fleets
• Simulation mode only, operating modelLikelihood (or Bayesian) parameter
estimation in ADMB
• 1 area, “Georges Bank”Spatial
Operating Model: Hydra

Species 2
Species 1 Fishery 1
Fishery 2
Species 1
Species 1
Species 2
Hydra: A Size-Structured Multifleet Simulation Model


Year 20 Year 50
Yield curve, all species combined, bottom trawl only

U.S. Department of Commerce| National Oceanic and Atmospheric Administration |NOAA Fisheries | Page 31
EMAX

The Safety Net: Defining Floors

Keeping Track of Size Structure

Additional Fishery Performance Metrics:
Fishermen’s Ecological Knowledge
Long-term Fishermen’s RecordsQualitative Advice


Potential Operating Model: Atlantis Northeast United States

ATLANTIS – Biological Groups and Fleets45 Functional Groups
18 Fishing fleets