EAVY INDUSTRIAL CONSTRUCTION AND MAINTENANCE WORKFORCE ... · heavy industrial construction and...
18
HEAVY INDUSTRIAL CONSTRUCTION AND MAINTENANCE WORKFORCE OUTLOOK TO 2020 May 2017
Transcript of EAVY INDUSTRIAL CONSTRUCTION AND MAINTENANCE WORKFORCE ... · heavy industrial construction and...

HEAVY INDUSTRIAL CONSTRUCTION AND
MAINTENANCE WORKFORCE OUTLOOK
TO 2020
May 2017

HIGHLIGHTS OF SPRING 2017 UPDATE
– The projection identifies a drop in labour demand in 2018 with a slow upswing later in 2018. It is recognized that project plans in the current environment are very fluid and any changes will impact the future labour demands.
– Labour demand is lower than projected in previous years due to an increase in the number of projects that have been cancelled or delayed due to low oil prices.
– Labour demand is projected to go up from mid-2018 to 2020, however, the 2018-2020 numbers are considered soft as a number of projects under development may not proceed.
– Ongoing maintenance is a stabilizing influence on construction trades since existing facilities are getting older and new facilities are coming into production.
– The top five occupations with the highest demand include boilermakers, pipefitters, labourers, carpenters and electricians. As the model does not incorporate labour supply projections, no comment is made on supply-demand relationships. Industry representatives have reported that, with the exception of boilermakers, other trades have not been difficult to recruit.
2

PURPOSE AND BASIS OF WORKFORCE
PROJECTIONS
• The Sector Intelligence Model (SIM) for Heavy Industrial Construction, formerly OILMAP, is a collaboration between the government of Alberta and COAA that has been in place since January 2012.
– The purpose is to provide a better understanding of the heavy industrial construction and maintenance workforce demands in Alberta.
• The projections are based on micro-economic modelling that is updated twice a year: Spring (May) and Fall (November).
• The projections include projects that have been validated by individual companies. Only projects that have a validated start date are included in the model.
• The projections for the ongoing and turnaround maintenance are based on data from the General Presidents’ Maintenance Committee for Canada and the National Maintenance Council For Canada.
3
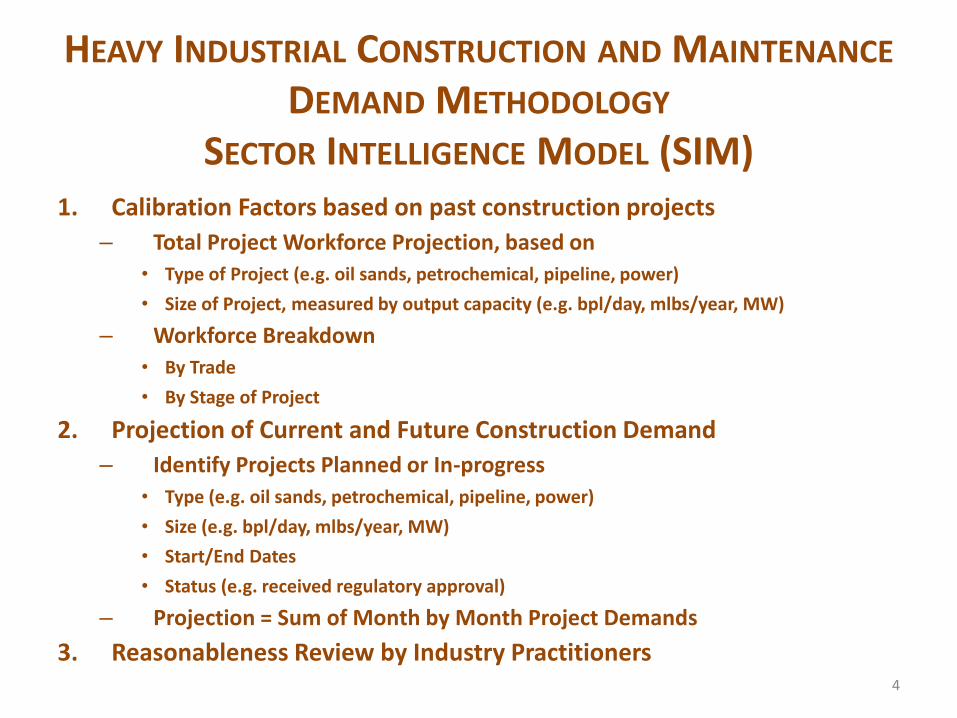
HEAVY INDUSTRIAL CONSTRUCTION AND MAINTENANCE
DEMAND METHODOLOGY
SECTOR INTELLIGENCE MODEL (SIM)1. Calibration Factors based on past construction projects
– Total Project Workforce Projection, based on
• Type of Project (e.g. oil sands, petrochemical, pipeline, power)
• Size of Project, measured by output capacity (e.g. bpl/day, mlbs/year, MW)
– Workforce Breakdown
• By Trade
• By Stage of Project
2. Projection of Current and Future Construction Demand
– Identify Projects Planned or In-progress
• Type (e.g. oil sands, petrochemical, pipeline, power)
• Size (e.g. bpl/day, mlbs/year, MW)
• Start/End Dates
• Status (e.g. received regulatory approval)
– Projection = Sum of Month by Month Project Demands
3. Reasonableness Review by Industry Practitioners4
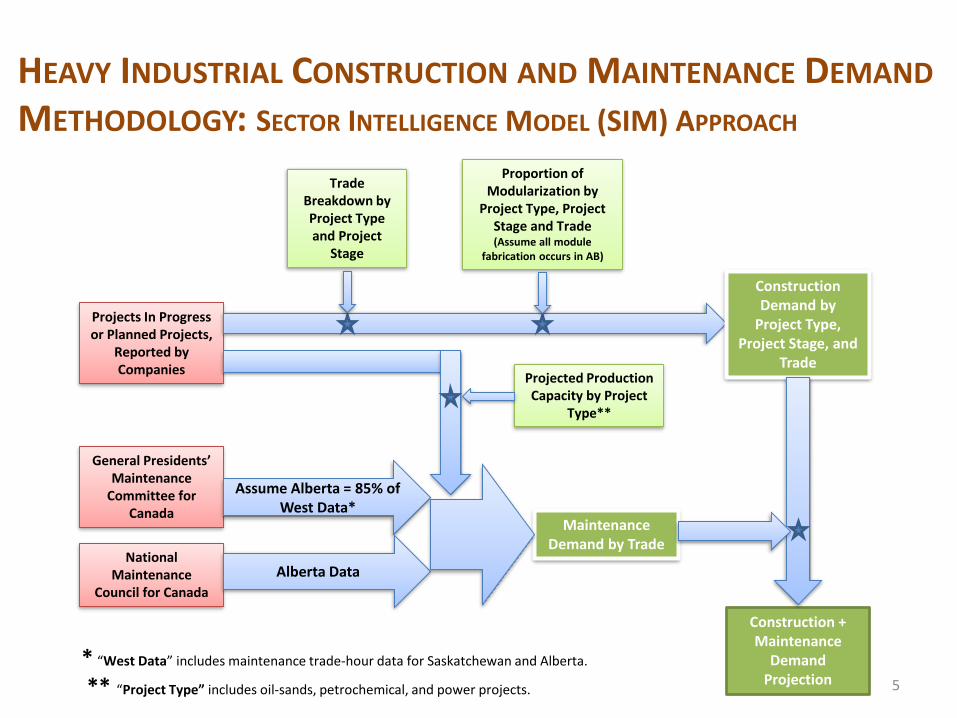
HEAVY INDUSTRIAL CONSTRUCTION AND MAINTENANCE DEMAND
METHODOLOGY: SECTOR INTELLIGENCE MODEL (SIM) APPROACH
5
Projects In Progress or Planned Projects,
Reported by Companies
Construction Demand by
Project Type, Project Stage, and
Trade
General Presidents’ Maintenance
Committee for Canada
Maintenance Demand by Trade
National Maintenance
Council for Canada
Trade Breakdown by Project Type and Project
Stage
Proportion of Modularization by
Project Type, Project Stage and Trade(Assume all module
fabrication occurs in AB)
Construction + Maintenance
Demand Projection
Assume Alberta = 85% of West Data*
Alberta Data
* “West Data” includes maintenance trade-hour data for Saskatchewan and Alberta.
** “Project Type” includes oil-sands, petrochemical, and power projects.
Projected Production Capacity by Project
Type**
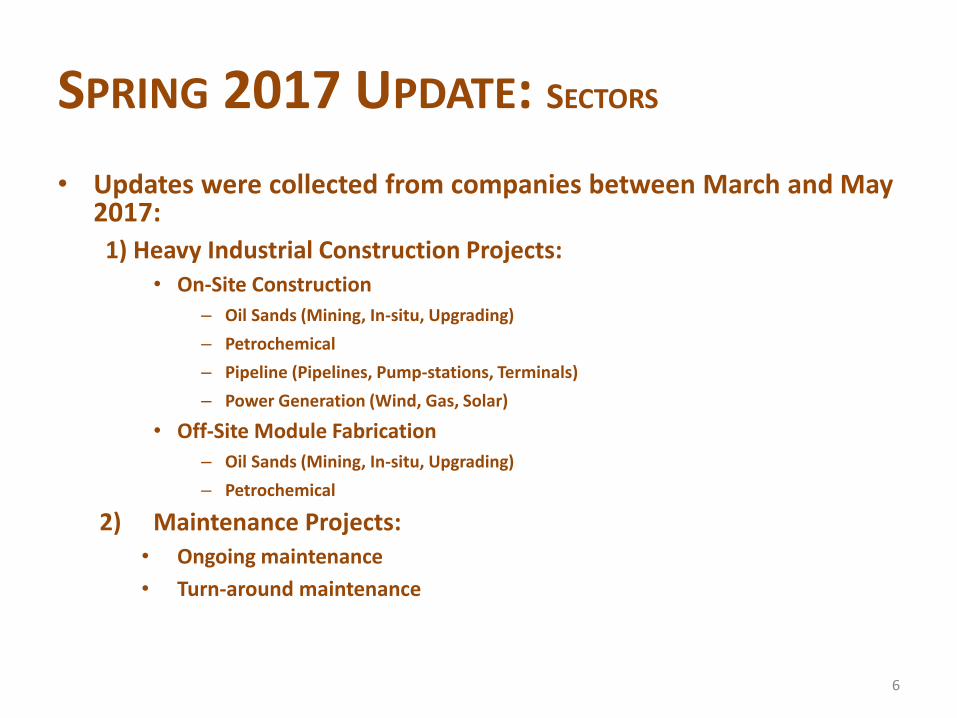
SPRING 2017 UPDATE: SECTORS
• Updates were collected from companies between March and May 2017:
1) Heavy Industrial Construction Projects:• On-Site Construction
– Oil Sands (Mining, In-situ, Upgrading)
– Petrochemical
– Pipeline (Pipelines, Pump-stations, Terminals)
– Power Generation (Wind, Gas, Solar)
• Off-Site Module Fabrication
– Oil Sands (Mining, In-situ, Upgrading)
– Petrochemical
2) Maintenance Projects:• Ongoing maintenance
• Turn-around maintenance
6

SPRING 2017 UPDATE: PROJECT CATEGORIES
There are seven categories:• Projects included in the model:
– “Planning Stage” with or without anticipated start and end date.
– “Received Regulatory Approval” and plan to proceed with start/end date.
– “Construction In-Progress” with start/end date.
– “Postponed” but have an anticipated start and end date.
• Projects removed from the model:– On-Hold with no start date identified.
– Cancelled –removed from a companies capital plans.
– Completed – project is operational with no construction workforce on site.
7
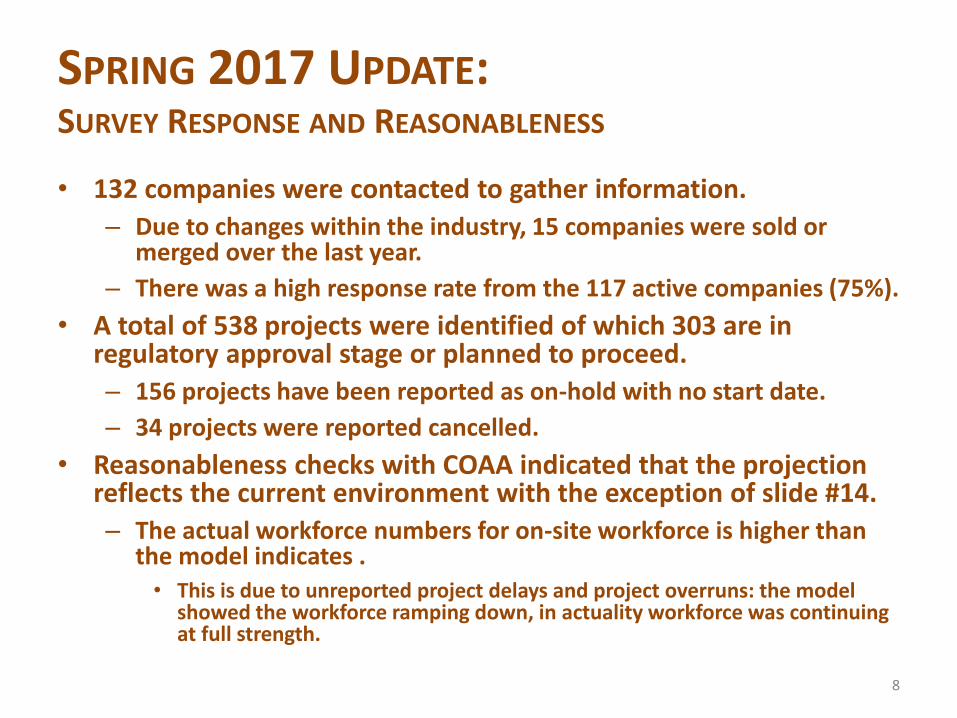
SPRING 2017 UPDATE: SURVEY RESPONSE AND REASONABLENESS
• 132 companies were contacted to gather information.
– Due to changes within the industry, 15 companies were sold or merged over the last year.
– There was a high response rate from the 117 active companies (75%).
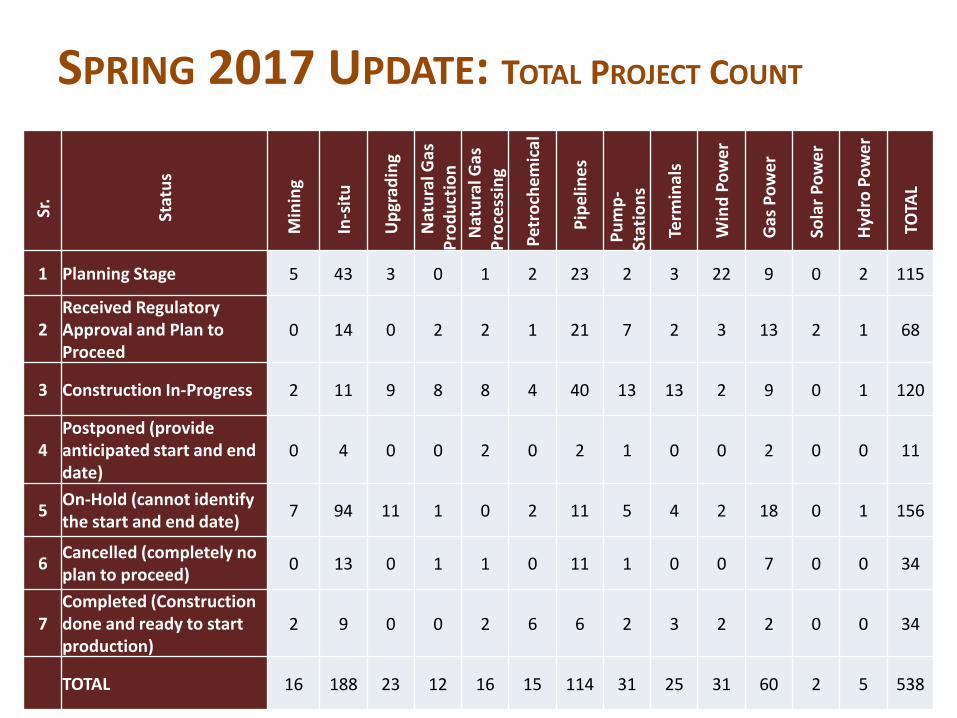
• A total of 538 projects were identified of which 303 are in regulatory approval stage or planned to proceed.
– 156 projects have been reported as on-hold with no start date.
– 34 projects were reported cancelled.
• Reasonableness checks with COAA indicated that the projection reflects the current environment with the exception of slide #14.
– The actual workforce numbers for on-site workforce is higher than the model indicates . • This is due to unreported project delays and project overruns: the model
showed the workforce ramping down, in actuality workforce was continuing at full strength.
8
SPRING 2017 UPDATE: TOTAL PROJECT COUNT
9
Sr.
Stat
us
Min
ing
In-s
itu
Up
grad
ing
Nat
ura
l Gas
P
rod
uct
ion
Nat
ura
l Gas
P
roce
ssin
g
Pet
roch
em
ical
Pip
elin
es
Pu
mp
-St
atio
ns
Term
inal
s
Win
d P
ow
er
Gas
Po
we
r
Sola
r P
ow
er
Hyd
ro P
ow
er
TOTA
L
1 Planning Stage 5 43 3 0 1 2 23 2 3 22 9 0 2 115
2Received Regulatory Approval and Plan to Proceed
0 14 0 2 2 1 21 7 2 3 13 2 1 68
3 Construction In-Progress 2 11 9 8 8 4 40 13 13 2 9 0 1 120
4Postponed (provide anticipated start and end date)
0 4 0 0 2 0 2 1 0 0 2 0 0 11
5On-Hold (cannot identify the start and end date)
7 94 11 1 0 2 11 5 4 2 18 0 1 156
6Cancelled (completely no plan to proceed)
0 13 0 1 1 0 11 1 0 0 7 0 0 34
7Completed (Construction done and ready to start production)
2 9 0 0 2 6 6 2 3 2 2 0 0 34
TOTAL 16 188 23 12 16 15 114 31 25 31 60 2 5 538
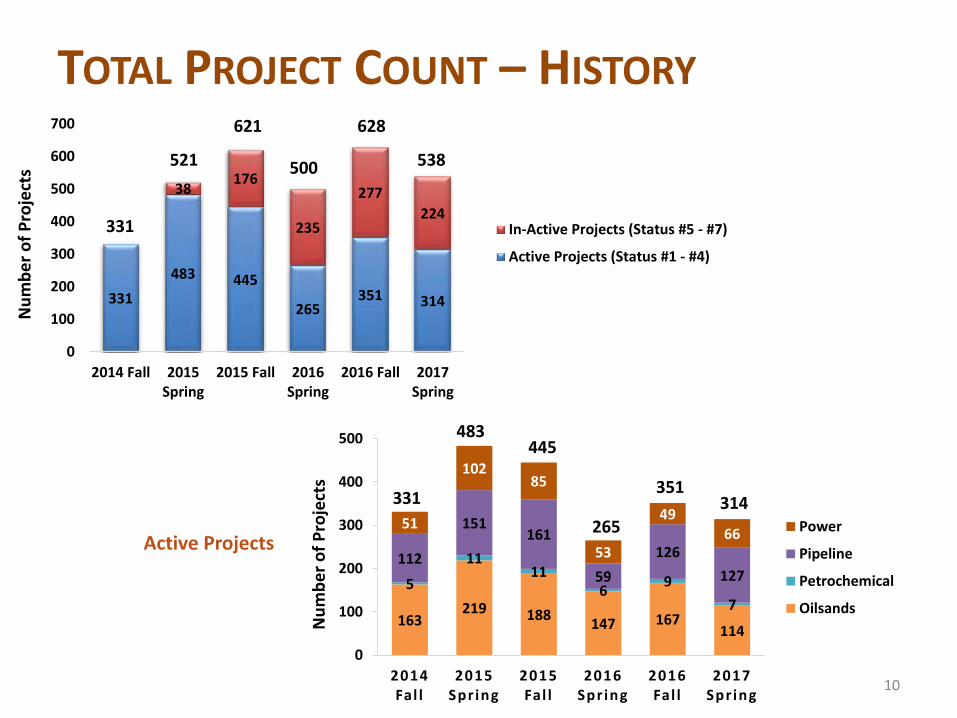
TOTAL PROJECT COUNT – HISTORY
10
331
483 445
265351 314
38176
235
277
224
0
100
200
300
400
500
600
700
2014 Fall 2015Spring
2015 Fall 2016Spring
2016 Fall 2017Spring
Nu
mb
er
of
Pro
ject
s
In-Active Projects (Status #5 - #7)
Active Projects (Status #1 - #4)
331
521
621
500
628
538
163219 188
147 167114
5
1111
69
7
112
151161
59
126
127
51
10285
53
4966
0
100
200
300
400
500
2014 Fal l
2015 Spr ing
2015 Fal l
2016 Spr ing
2016 Fal l
2017 Spr ing
Nu
mb
er
of
Pro
ject
s
Power
Pipeline
Petrochemical
Oilsands
331
483445
265
351314
Active Projects
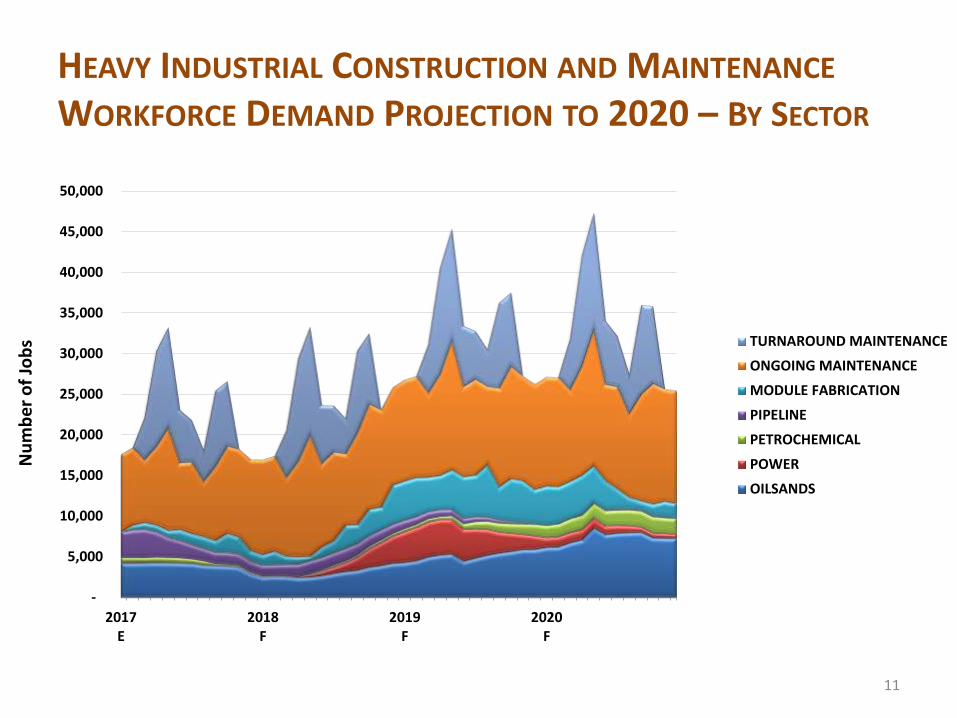
HEAVY INDUSTRIAL CONSTRUCTION AND MAINTENANCE
WORKFORCE DEMAND PROJECTION TO 2020 – BY SECTOR
11
-
5,000
10,000
15,000
20,000
25,000
30,000
35,000
40,000
45,000
50,000
2017E
2018F
2019F
2020F
Nu
mb
er
of
Job
s TURNAROUND MAINTENANCE
ONGOING MAINTENANCE
MODULE FABRICATION
PIPELINE
PETROCHEMICAL
POWER
OILSANDS

HEAVY INDUSTRIAL CONSTRUCTION AND MAINTENANCE
WORKFORCE DEMAND PROJECTION TO 2020 – BY OCCUPATION
12
0
5000
10000
15000
20000
25000
30000
35000
40000
45000
50000
2017E
2018F
2019F
2020F
Nu
mb
er
of
Job
s
Construction Managers & Supervisors
Welders
Truck Drivers
Structural Iron Workers
Sheet Metal Workers
Scaffolders
Reinforcing Iron Workers
Pipefitters
Painters
Millwrights
Mechanics and Oilers (Pipeline)
Labourers
Insulators
Instrument Mechanics
Heavy Equipment Operators
Environmental Supervisors (Pipeline)
Electricians
Cement Masons
Carpenters
C&H Equipment Operators
Boilermakers
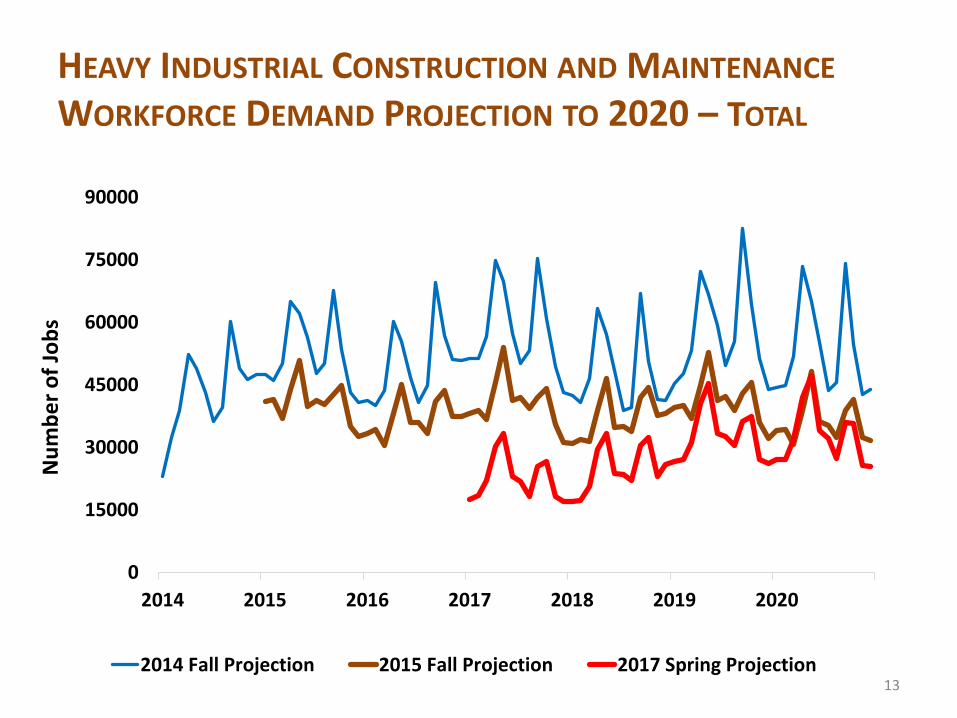
HEAVY INDUSTRIAL CONSTRUCTION AND MAINTENANCE
WORKFORCE DEMAND PROJECTION TO 2020 – TOTAL
13
0
15000
30000
45000
60000
75000
90000
2014 2015 2016 2017 2018 2019 2020
Nu
mb
er
of
Job
s
2014 Fall Projection 2015 Fall Projection 2017 Spring Projection

HEAVY INDUSTRIAL CONSTRUCTION WORKFORCE
DEMAND PROJECTION TO 2020 – ON-SITE AND OFF-SITEOn-Site Construction
14
0
5000
10000
15000
20000
25000
30000
35000
2014 2015 2016 2017 2018 2019 2020
Nu
mb
er
of
Job
s
2014 Fall Projection
2015 Fall Projection
2017 Spring Projection
0
2000
4000
6000
8000
10000
12000
14000
2014 2015 2016 2017 2018 2019 2020
Nu
mb
er
of
Job
s
2014 Fall Projection
2015 Fall Projection
Off-Site Module Construction
Note: The model assumes that all module fabrication is completed in Alberta

HEAVY INDUSTRIAL MAINTENANCE WORKFORCE
DEMAND PROJECTION TO 2020 – ONGOING AND TURNAROUND
Nu
mb
er
of
Job
s
Ongoing Maintenance Turnaround Maintenance
On-Site Maintenance Total
15
-
4,000
8,000
12,000
16,000
20,000
2017E
2018F
2019F
2020F
-
4,000
8,000
12,000
16,000
20,000
2017E
2018F
2019F
2020F
-
5,000
10,000
15,000
20,000
25,000
30,000
35,000
2017E
2018F
2019F
2020F
Turnaround Maintenance
Ongoing Maintenance

HEAVY INDUSTRIAL CONSTRUCTION AND MAINTENANCE
WORKFORCE DEMAND PROJECTION TO 2020 - BY TYPE OF PROJECT
Distribution of Workforce Projection by Type of Project
16
35%
42%
23%
2017
41%
40%
19%
2020
On-Site andModule
OngoingMaintenance
TurnaroundMaintenance
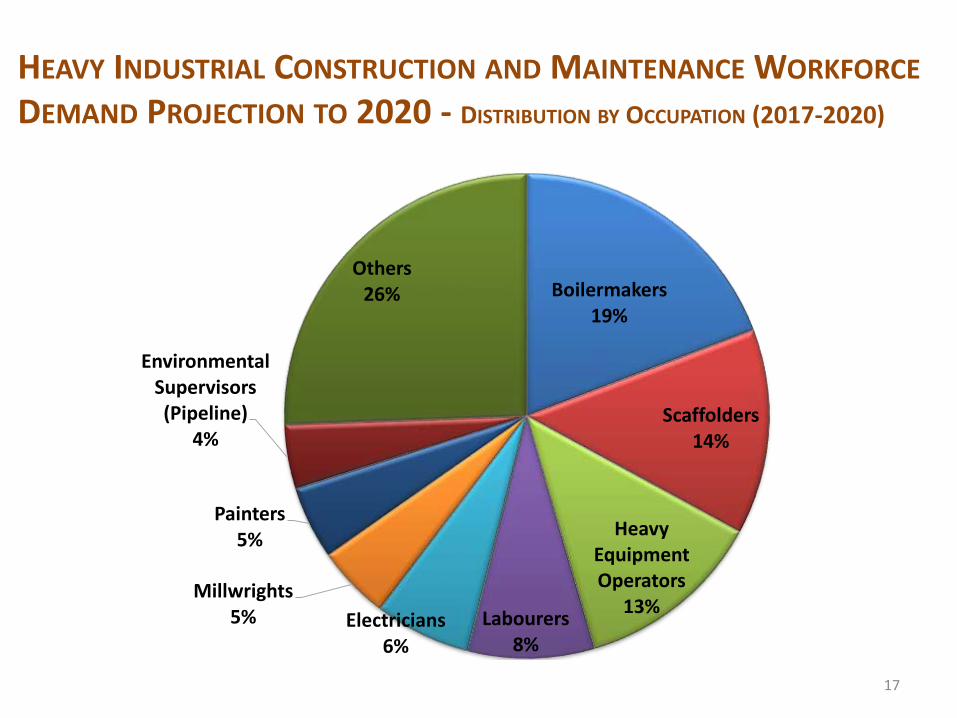
HEAVY INDUSTRIAL CONSTRUCTION AND MAINTENANCE WORKFORCE
DEMAND PROJECTION TO 2020 - DISTRIBUTION BY OCCUPATION (2017-2020)
17
Boilermakers19%
Scaffolders14%
Heavy Equipment Operators
13%Labourers
8%Electricians
6%
Millwrights5%
Painters 5%
Environmental Supervisors (Pipeline)
4%
Others26%
NEXT FORECAST UPDATE• The next forecast will be completed in May 2018.
• Data gathering will take place from February to April with the target to complete the forecast by May.
• GOA is establishing an on-line data collection tool for this survey to streamline the process.
• Employers will have the ability to update their project information in an easier, more efficient and secure environment.
• GOA will be contacting all contributors in February 2018 to provide information on how to access this new system.
18