East African Bribery Index 2014
88
THE EAST AFRICAN BRIBERY INDEX 2014
-
Upload
transparency-international-kenya -
Category
Documents
-
view
217 -
download
0
description
Â
Transcript of East African Bribery Index 2014

The easT africanBriBery index 2014


The easT africanBriBery index 2014

© Transparency International-Kenya, 2014Every effort has been made to verify the accuracy of
the information contained in this report. All information
was believed to be correct as of November 2014.
Transparency International Kenya does not accept
responsibility for the consequences of the use of the
report’s contents for other purposes or in other contexts.

iii T h e E a s t A f r i c a n B r i b e r y I n d e x 2 0 1 4
TABLE OF CONTENTS
List of tables and figures ...................................................................................................................................................vi
acknowledgement ..................................................................................................................................................................ix
executive summary ............................................................................................................................................................... x
recommendations ................................................................................................................................................................ xii
Methodology ............................................................................................................................................................................. xiii
survey Objectives .................................................................................................................................................................. xv
The East African Bribery Index 2014 ......................................................................................................................................1
comparison by likelihood....................................................................................................................................................1
nature of bribery incidents ................................................................................................................................................1
aggregate index .........................................................................................................................................................................2
BURUNDI .....................................................................................................................................................................................................4
introduction ...................................................................................................................................................................................4
sample characterisation ......................................................................................................................................................5
findinGs ........................................................................................................................................................................................5
aggregate index ...........................................................................................................................................................5
indicator ranking ..........................................................................................................................................................6
reasons for paying a bribe ..................................................................................................................................9
reporting of bribery incidents ........................................................................................................................ 10
reasons for not reporting bribery incidents ........................................................................................ 10
cOrrUPTiOn PercePTiOn ............................................................................................................................................ 11
Perceived level of corruption .......................................................................................................................... 11
Perceived change of the level of corruption ........................................................................................ 11
Projected change in the level of corruption ......................................................................................... 12
Government’s commitment to fight corruption ................................................................................. 13
Most important action to be taken in the fight against corruption ...................................... 14
KENYA ....................................................................................................................................................................................................... 15
introduction ............................................................................................................................................................................... 15
sample characterisation .................................................................................................................................................. 17

ivT h e E a s t A f r i c a n B r i b e r y I n d e x 2 0 1 4
findinGs .................................................................................................................................................................................... 17
aggregate index ....................................................................................................................................................... 17
indicator ranking .................................................................................................................................................... 18
reasons for paying a bribe .............................................................................................................................. 21
reporting of bribery incidents ........................................................................................................................ 21
reasons for not reporting bribery incidents ........................................................................................ 22
cOrrUPTiOn PercePTiOn ............................................................................................................................................ 22
Perceived current level of corruption ........................................................................................................ 22
Perceived change in the level of corruption ........................................................................................ 23
Government’s commitment to fight corruption ................................................................................. 24
Most important action to be taken in the fight against corruption ...................................... 25
RWANDA ................................................................................................................................................................................................. 26
introduction ............................................................................................................................................................................... 26
sample characterisation .................................................................................................................................................. 27
aggregate index ....................................................................................................................................................... 27
indicator ranking ...................................................................................................................................................... 28
reasons for paying a bribe .............................................................................................................................. 31
reporting of bribery incidents ........................................................................................................................ 31
reasons for not reporting bribery incidents ........................................................................................ 32
cOrrUPTiOn PercePTiOn ............................................................................................................................................ 32
Perceived level of corruption ......................................................................................................................... 32
Perceived change in the level of corruption ........................................................................................ 33
Projected change in the level of corruption ......................................................................................... 33
Government’s commitment to fight corruption ................................................................................. 34
Most important action to be taken in the fight against corruption ...................................... 35
TANZANIA ............................................................................................................................................................................................... 36
introduction ............................................................................................................................................................................. 36
sample characterisation .................................................................................................................................................. 37
aggregate index ....................................................................................................................................................... 38
indicator ranking ...................................................................................................................................................... 38
reasons for paying a bribe .............................................................................................................................. 41
reporting of bribery incidents ........................................................................................................................ 42
reasons for not reporting bribery incidents ........................................................................................ 42
cOrrUPTiOn PercePTiOn ............................................................................................................................................ 43

v T h e E a s t A f r i c a n B r i b e r y I n d e x 2 0 1 4
Perceived level of corruption .......................................................................................................................... 43
Perceived change of the level of corruption in Tanzania ............................................................ 44
Projected change in the level of corruption ......................................................................................... 44
Government’s commitment to fight corruption ................................................................................. 45
Most important action to be taken in the fight against corruption ...................................... 46
UGANDA ................................................................................................................................................................................................... 47
introduction ............................................................................................................................................................................... 47
sample characterisation .................................................................................................................................................. 49
aggregate index ....................................................................................................................................................... 49
indicator ranking .................................................................................................................................................... 49
reasons for paying a bribe .............................................................................................................................. 52
reporting of bribery incidents ........................................................................................................................ 53
reasons for not reporting bribery incidents ........................................................................................ 53
cOrrUPTiOn PercePTiOn ........................................................................................................................................... 54
Perceived level of corruption .......................................................................................................................... 54
Perceived change in corruption levels ................................................................................................... 54
Projected change in the level of corruption ......................................................................................... 55
Government’s commitment to fight corruption ................................................................................. 55
Most important action to be taken in the fight against corruption ...................................... 57

viT h e E a s t A f r i c a n B r i b e r y I n d e x 2 0 1 4
List of Tables and Figures
Tables
Table 1: Sample size distribution across the countries ........................................................................................................xv
Table 2: Sample distribution by gender, residence and age – Across East Africa ...................................xv
Table 3: Sample distribution by highest level of education - Across East Africa .................................... xvi
Table 4: Sample distribution by employment status - Across East Africa ...................................................... xvi
Table 5: Sample distribution by household income - Across East Africa......................................................... xvi
Table 6: Comparison of countries by aggregate likelihood of bribery .................................................................... 1
Table 7: Nature of bribery incidents in East Africa ...................................................................................................................... 1
Table 8: Aggregate index across East Africa...................................................................................................................................... 2
Table 9: Distribution of respondents by province - Burundi .......................................................................................... 5
Table 10: Aggregate index - Burundi ......................................................................................................................................................... 6
Table 11: Likelihood of bribery - Burundi ............................................................................................................................................. 6
Table 12: Prevalence of bribery - Burundi .............................................................................................................................................. 7
Table 13: Average size of bribe - Burundi ............................................................................................................................................... 8
Table 14: Share of ‘national’ bribe - Burundi ....................................................................................................................................... 8
Table 15: Perceived impact of bribery - Burundi .............................................................................................................................. 9
Table 16: Reasons for projected increase in corruption in the next one year - Burundi .....................12
Table 17: Reasons for dissatisfaction with anti-corruption efforts - Burundi .................................................13
Table 18: Citizens’ efforts in fighting corruption - Burundi ................................................................................................13
Table 19: Most important action to be taken against corruption - Burundi ......................................................14
Table 20: Distribution of respondents by County - Kenya ....................................................................................................17
Table 21: Aggregate Index – Kenya .............................................................................................................................................................18
Table 22: Likelihood of bribery - Kenya ...................................................................................................................................................18
Table 23: Prevalence of bribery - Kenya.................................................................................................................................................19
Table 24: Average size of bribe - Kenya .................................................................................................................................................19
Table 25: Share of ‘national’ bribe - Kenya .........................................................................................................................................20
Table 26: Prevalence impact of bribery - Kenya ............................................................................................................................20
Table 27: Reasons for projected increase in level of corruption - Kenya ............................................................24
Table 28: Reasons for dissatisfaction with government’s anti-corruption efforts - Kenya ...............24
Table 29: Citizens’ efforts in fighting corruption - Kenya .....................................................................................................25
Table 30: Most important action to be taken against corruption - Kenya...........................................................25

vii T h e E a s t A f r i c a n B r i b e r y I n d e x 2 0 1 4
Table 31: Distribution of respondents by province - Rwanda ..........................................................................................27
Table 32: Aggregate Index – Rwanda ........................................................................................................................................................27
Table 33: Likelihood of bribery - Rwanda .............................................................................................................................................28
Table 34: Prevalence of bribery – Rwanda ..........................................................................................................................................29
Table 35: Average size of bribe - Rwanda .......................................................................................................................................... 29
Table 36: Share of ‘national’ bribe - Rwanda ....................................................................................................................................30
Table 37: Perceived impact of bribery - Rwanda ..........................................................................................................................30
Table 38: Reasons for satisfaction with government anti-corruption efforts - Rwanda ......................34
Table 39: Citizens’ anti-corruption efforts - Rwanda ................................................................................................................34
Table 40: Most important action to be taken against corruption - Rwanda .....................................................35
Table 41: Respondent distribution by region - Tanzania ........................................................................................................37
Table 42: Aggregate index - Tanzania .....................................................................................................................................................38
Table 43: Likelihood of bribery -Tanzania .............................................................................................................................................39
Table 44: Prevalence of bribery - Tanzania ..........................................................................................................................................39
Table 45: Average size of bribe – Tanzania .........................................................................................................................................40
Table 46: Share of ‘national’ bribe - Tanzania ..................................................................................................................................41
Table 47: Perceived impact of bribery - Tanzania.........................................................................................................................41
Table 48: Reason for projected increase in the level of corruption - Tanzania .............................................45
Table 49: Reasons for dissatisfaction with government anti-corruption efforts - Tanzania ............45
Table 50: Citizens’ anti-corruption efforts - Tanzania ..............................................................................................................46
Table 51: The most important action to be taken against corruption - Tanzania........................................46
Table 52: Distribution of respondents by region - Uganda ..................................................................................................49
Table 53: Aggregate Index – Uganda .........................................................................................................................................................49
Table 54: Likelihood of bribery – Uganda ..............................................................................................................................................50
Table 55: Prevalence of bribery – Uganda ............................................................................................................................................50
Table 56: Average size of bribe – Uganda ............................................................................................................................................51
Table 57: Share of ‘national’ bribe - Uganda .....................................................................................................................................51
Table 58: Perceived impact of bribery – Uganda ...........................................................................................................................52
Table 59: Reasons for projected increase in the level of corruption - Uganda .............................................55
Table 60: Reason for dissatisfaction with government anti-corruption efforts - Uganda ..................56
Table 61: Citizens’ efforts in fighting corruption - Uganda .................................................................................................56
Table 62: The most important action to be taken against corruption – Uganda ..........................................57

viiiT h e E a s t A f r i c a n B r i b e r y I n d e x 2 0 1 4
Figures
Figure 1: Reasons for paying bribes - Burundi .............................................................................................................9
Figure 2: Reporting of bribery incidents - Burundi .................................................................................................10
Figure 3: Reasons for not reporting bribery incidents - Burundi ..................................................................10
Figure 4: Perceived level of corruption - Burundi ....................................................................................................11
Figure 5: Perceived change in the level of corruption - Burundi ..................................................................11
Figure 6: Projected change in level of corruption - Burundi ............................................................................12
Figure 7: Government’s commitment to fight corruption - Burundi ............................................................13
Figure 8: Reasons for paying bribes – Kenya .............................................................................................................21
Figure 9: Reporting of bribery incidents - Kenya .....................................................................................................21
Figure 10: Reasons for not reporting bribery incidents – Kenya .....................................................................22
Figure 11: Perceived current level of corruption – Kenya ....................................................................................22
Figure 12: Perceived change in the level of corruption - Kenya ......................................................................23
Figure 13: Projected change in level of corruption - Kenya ................................................................................23
Figure 14: Government’s commitment to fight corruption – Kenya ...............................................................24
Figure 15: Reasons for paying bribes - Rwanda .........................................................................................................31
Figure 16: Reporting of bribery incidents - Rwanda .................................................................................................31
Figure 17: Reasons for not reporting bribery incidents - Rwanda ..................................................................32
Figure 18: Perceived current level of corruption – Rwanda ................................................................................32
Figure 19: Perceived change in the level of corruption - Rwanda ..................................................................33
Figure 20: Projected change in the level of corruption – Rwanda ..................................................................33
Figure 21: Government’s commitment to the fight against corruption - Rwanda ................................34
Figure 22: Reasons for paying a bribe - Tanzania ......................................................................................................42
Figure 23: Reporting of bribery incidents - Tanzania ...............................................................................................42
Figure 24: Reasons for not reporting bribery cases - Tanzania ........................................................................43
Figure 25: Perceived current level of corruption - Tanzania ...............................................................................43
Figure 26: Perceived change in the level of corruption - Tanzania ................................................................44
Figure 27: Projected change in the level of corruption - Tanzania .................................................................44
Figure 28: Government’s commitment to fight corruption - Tanzania ..........................................................45
Figure 29: Reasons for paying bribes - Uganda ..........................................................................................................52
Figure 30: Reporting of bribery incidents – Uganda .................................................................................................53
Figure 31: Reasons for not reporting bribery incidents – Uganda ..................................................................53
Figure 32: Perceived current level of corruption – Uganda .................................................................................54
Figure 33: Perceived change in the level of corruption - Uganda ...................................................................54
Figure 34: Projected change in the level of corruption – Uganda ...................................................................55
Figure 35: Government anti-corruption efforts - Uganda ......................................................................................56
ix T h e E a s t A f r i c a n B r i b e r y I n d e x 2 0 1 4
ACKNOWLEDGMENT
Transparency International chapters in Burundi, Kenya, Rwanda and Uganda, and Concern for Development Initiatives in Africa (ForDIA) in Tanzania recognise and appreciate the invaluable contribution of various individuals and institutions to the East African Bribery Index 2014 survey.
We particularly thank Humphrey Josia in Tanzania, Gerald Padde (Uganda), Albert Kavatiri (Rwanda), Amédée Ndagijimana (Burundi), Harriet Wachira and Job Munyua (Kenya) who coordinated the project including data collection in their respective countries. The dedicated team of research supervisors and assistants across the region is also appreciated. We thank Sheila Masinde and Collins Baswony for overseeing the editing and publication of the report.
We must in addition appreciate the 10,597 respondents who participated in the survey and made it successful.
The East African Bribery Index 2014 would not have been possible without the financial support of our development partners. In a special way we appreciate GIZ (Gesellschaft für Internationale Zusammenarbeit, German Technical Cooperation in Kenya), the Embassy of the Kingdom of the Netherlands in Kenya, Ambassade De France Au Burundi (French Embassy in Burundi) and Project OSCAR (Burundi).

xT h e E a s t A f r i c a n B r i b e r y I n d e x 2 0 1 4
EXECUTIVE SUMMARY
The East African Bribery Index 2014 was carried out in Burundi, Rwanda, Kenya and Uganda by Transparency International chapters in the respective countries and Concern for Development Initiatives in Africa (ForDIA) in Tanzania. A total of 10,597 respondents were randomly sampled and recorded their bribery experiences while seeking services in the preceding twelve months.
The East African Bribery Index (EABI) offers an insight on bribery experiences from East Africans as they interact with key institutions in their countries while seeking services. It explores the prevalence of bribery in various sectors as well as the value that citizens place on the different services they seek. In 2014 the survey additionally sought to establish what role citizens had played in fighting corruption in the past twelve months while giving them an opportunity to recommend what should be done to reduce corruption in their respective countries.
Despite the various efforts put forward by their governments, citizens, for varied reasons, still encounter situations where they have to pay bribes to access basic services. These bribes are a financial burden to majority of the citizens who live below the poverty line. Further, there have been other serious consequences arising from auctioning fundamental services to the highest bidder.
The problem is compounded by the loss of public confidence in various anti-corruption institutions as the survey reveals that most East Africans are not willing to report the bribery incidents they encounter.
Likelihood of encountering bribery
Burundi had the highest likelihood of bribery with a score of 19.4% followed by Tanzania at 19%. Uganda which topped the 2013 index dropped to third position at 17.9%, while Kenya and Rwanda maintained the fourth and fifth positions at 12.3% and 2.9% respectively. The survey established that East Africans had the highest likelihood of encountering bribery while interacting with the Police in all countries except Rwanda where the highest likelihood was with the Local Authority.
Average size of bribe
Average bribes paid to the Police were less than 50 USD in all East African countries except in Rwanda where the amount was 72 USD. The Police accounted for about a third of all the bribes paid in the mentioned sectors in their respective countries.
The average size of bribe paid in the public sector surpassing 100 USD was recorded at Lands Services in Uganda, and Judiciary in Rwanda and Uganda.

xi T h e E a s t A f r i c a n B r i b e r y I n d e x 2 0 1 4
Reasons for paying bribes
Bribe payment in Tanzania, Burundi and Rwanda was largely attributed to the need to expedite service delivery. In Kenya and Uganda, most respondents said they paid a bribe since it was the only way to access the services they were seeking.
Reporting of bribery incidents
About ninety percent of the respondents that encountered a bribery incident did not report or make a complaint to any authority or person. In Kenya, most of the respondents said they did not know where to report while in Tanzania most felt that no action would be taken to resolve their complaint. In Burundi and Uganda, most individuals that did not report attributed this to the fact that they were beneficiaries of the bribery transaction and in Rwanda, most were afraid of self-incrimination.
Perception on the level of corruption
Majority of respondents in Kenya, Uganda, Tanzania and Burundi described the level of corruption in their respective countries as high and felt it had increased in the past 12 months. In Rwanda, the majority described it as low and decreasing in the past 12 months.
Government anti-corruption efforts
Only respondents from Rwanda were satisfied with government efforts towards fighting corruption while their fellow East Africans felt that government anti-corruption efforts were insufficient.
Personal initiative to address corruption
Over 70% of the respondents in Burundi, Kenya, Tanzania and Uganda said they had done nothing to fight corruption in the past twelve months. The only positive feedback in this regard came from Rwanda with 63% saying their effort included refraining from any act of corruption with 11% saying they had done nothing to fight corruption.

xiiT h e E a s t A f r i c a n B r i b e r y I n d e x 2 0 1 4
RECOMMENDATIONS
Civic education
Citizens should be sensitised on the cost of corruption and the impact it has in their lives. This will help them to acknowledge the role they have to play in the fight against corruption. Civic education on corruption reporting channels and legislation is equally key.
Complaints referral and resolution mechanisms
There is need to establish and or strengthen avenues where citizens can lodge corruption complaints and seek redress. The existing mechanisms are seemingly unknown to the citizens or in cases where they are known, do not inspire public confidence. Existing complaint channels should be publicised and procedures involved explained to the public.
Reforms in the Police, Land Services and Judiciary
Reforms in adversely mentioned sectors are now not an option but mandatory to ensure more transparency and accountability in service delivery. The Police, Land Services and Judiciary across the region continue to perform poorly in the East African Bribery Index, indicating that reforms in these sectors have not borne fruit, in countries where reforms have been initiated such as Kenya.
Punitive action against corrupt officials
Government officials found culpable in acts of corruption need to face the law as prescribed and should not to be seen to go unpunished because of the positions they hold. The rule of law has to be upheld at all times in order to eradicate the culture of impunity that has taken root in East Africa. Political will in this regard is critical, to ensure full application of anti-corruption legislation.

xiii T h e E a s t A f r i c a n B r i b e r y I n d e x 2 0 1 4
METHODOLOGY
The East African Bribery Index 2014 survey was conducted in the five East African countries: Burundi, Kenya, Rwanda, Tanzania and Uganda between May and September 2014 at the household level. Data was collected through face to face interviews to record bribery experiences from 10,597 respondents. The respondents were picked through simple random sampling based on the population size across the various administrative units in each country. The respective national samples were as follows:
Sample size composition
Country Sample size
Burundi 1,448
Kenya 2,164
Rwanda 2,511
Tanzania 2,488
Uganda 1,986
Total 10,597
Table 1: Sample size distribution across the countries
Sample characteristics
A majority of the respondents that participated in the survey were from the rural areas, aged between 30 to 49 years, with the male respondents slightly more than the women.
Gender (%)
Burundi Kenya Rwanda Tanzania Uganda
Male 59 53 57 51 52
Female 41 47 43 49 48
Residency (%)
Urban 18 40 23 42 22
Rural 82 60 77 58 78
Age group (%)
18-29 41 27 35 27 42
30-49 47 53 51 59 44
50+ 12 20 14 14 14
Table 2: Sample distribution by gender, residence and age – Across East Africa
A majority of the respondents in Rwanda and Tanzania reported that they had attained primary school education while in Uganda and Kenya, the majority had secondary and tertiary schooling respectively. Tanzania and Uganda had the least number of respondents reporting informal or no education.

xivT h e E a s t A f r i c a n B r i b e r y I n d e x 2 0 1 4
Level of education (%)
Burundi Kenya Rwanda Tanzania Uganda
Primary School Only 44 24 57 45 21
Secondary School Only 34 41 26 35 37
Tertiary Training 12 27 5 14 38
Informal Education / No formal
Education 10 8 12 6 4
Table 3: Sample distribution by highest level of education – Across East Africa
The majority of those sampled were self-employed or employed in a family business or farm. Retirees and those employed in the community sector made up less than 10% of those sampled across the region.
Employment Status (%)
Burundi Kenya Rwanda Tanzania Uganda
Student 10 4 4 4 7
Unemployed 11 12 5 11 13
Self Employed /Employed in a family business or farm 50 59 75 59 51
Employed in private sector 10 17 10 13 16
Employed by the government/Local authority/Parastatal 15 4 3 8 8
Employed in the community Sector e.g. Church, N.G.O, Co-operative 3 2 2 2 3
Retired 1 2 1 3 2
Table 4: Sample distribution by employment status - Across East Africa
The bulk of the sample comprised the lower and middle income group, individuals earning approximately between two and six US dollars a day. These are citizens that are largely dependent on the government for the provision of basic services. Further financial burden is placed on the already vulnerable populace when bribery is a determinant to access basic services.1
Household Income
(Ksh)1 Burundi Kenya Rwanda Tanzania Uganda
Less than 5,456 52 21 100 26 21
5,457 - 16,368 34 39 - 41 35
16,369 - 54,560 12 30 - 27 27
54,561 - 109,120 1 8 - 6 11
Above 109,120 1 2 - 1 6
Table 5: Sample distribution by household income - Across East Africa
1 At the time of the survey, the Kenya Shilling exchanged at 17 with the Burundi Franc, 8 with the Rwanda Franc, 18 with the Tanzania Shilling ,29 with the Uganda Shilling and 88 with the US Dollar

xv T h e E a s t A f r i c a n B r i b e r y I n d e x 2 0 1 4
SURVEY OBJECTIVES
The objective of the survey was to map out bribery experiences of respondents across the five East African countries during interactions with key public service sectors2 in the preceding 12 months by establishing the following:
i. Which institutions the respondent interacted with in the preceding 12 months while seeking services.
ii. Whether a bribe was explicitly asked (demanded), implicitly asked (expected) or offered by the respondent during the interaction.
iii. Whether the respondent paid the bribe that was demanded/ expected.
iv. Public perception on whether the services sought would have been rendered if a bribe was not paid.
From the information above, five indicators were derived as follows:
Indicator 1: Likelihood of encountering a bribery incident
This is the proportion of individuals who interacted with institution X and a bribe was demanded / expected or offered within the last 12 months.
Likelihood = Total number of bribery demand situations for institution X
Total number of interactions recorded for institution X
Indicator 2: Prevalence of bribery
This is the proportion of those who interacted with institution X and paid a bribe within the last 12 months. That is, the total number of times bribes were paid compared to the actual number of interactions at institution X.
Prevalence = Total number of times bribes were recorded for institution X
Total number of interactions recorded for institution X
Indicator 3: Average size of bribe
This is the average amount of bribe paid by individuals who interacted with institution X within the last 12 months.
Average size = Total amount of bribes reportedly paid in institution X
Individuals who reported having paid a bribe in institution X
2 Data from Rwanda is derived from the Rwanda Bribery Index 2014 whose tool includes some private sector institutions and civil society

xviT h e E a s t A f r i c a n B r i b e r y I n d e x 2 0 1 4
Indicator 4: Share of ‘national’ bribe
This is the share of the total amount of bribes paid in institution X out of the sum total amount paid in all sampled institutions within the last 12 months.
Share = Total amount of bribes paid in institution X
Total amount of bribes paid in all institutions
Indicator 5: Impact of bribery
This is the proportion of those who interacted with institution X within the last 12 months and thought that if they do not pay a bribe then they would not be served.
Impact = Total number who thought they would not get a service without a bribe to institution X
Total numbers of respondents interacting with institution X

1 T h e E a s t A f r i c a n B r i b e r y I n d e x 2 0 1 4
COMPARISON BY LIKELIHOOD
The table below indicates the overall likelihood of a respondent encountering a bribery incident while seeking public services in East Africa. Burundi took the first position with a score of 19.4% followed by Tanzania, which moved up from rank three at 12.9% in 2013 to second place with a score of 19%. Uganda moved down two positions to take the third position, while Kenya and Rwanda maintained their previous spots at 12.3% and 2.9% respectively. The likelihood of encountering bribery in Uganda and Rwanda decreased, with Uganda registering the highest decrease. In Tanzania, Burundi and Kenya, the likelihood increased, with Tanzania registering the highest increase.3
Rank Country 2014 (%) 2013 (%) Rank (2013) Variance3
1 Burundi 19.4 18.6 2 +0.8
2 Tanzania 19.0 12.9 3 +6.1
3 Uganda 17.9 26.9 1 -8.9
4 Kenya 12.3 7.9 4 +4.4
5 Rwanda 2.9 4.4 5 -1.5
Table 6: Comparison of the countries by aggregate likelihood of bribery
Nature of Bribery incidents:
The survey compared the nature of bribery incidents across the region. Kenya had the highest number of respondents accessing services without being asked to pay a bribe at 59% followed by Uganda at 57% while in Burundi and Tanzania it was 52%. Burundi recorded the highest number of respondents who initiated the payment of bribes.
Nature of bribery incidents
Country Demanded/Expected Offered None
Burundi 34% 14% 52%
Kenya 37% 4% 59%
Tanzania 42% 6% 52%
Uganda 37% 6% 57%
Rwanda 15% 2% 83%
Table 7: Nature of bribery incidents in East Africa
3 Difference between 2013 and 2014 scores
The easT africanBriBery index 2014

2T h e E a s t A f r i c a n B r i b e r y I n d e x 2 0 1 4
Aggregate index
The police in Uganda, Tanzania, Burundi and Kenya were ranked the most bribery prone institutions in East Africa, with a significant increase in scores for Uganda, Tanzania and Burundi. The police in Rwanda, ranked position five in 2013 moved down to position eight, registering a decrease in score. Land Services in Uganda, Kenya and Burundi, and the Judiciary in Kenya and Tanzania were also ranked among the top ten worst performing sectors.
Rank Sector /Institution2014
AggregateCountry
2013 Aggregate
Variance
1 Police 84.0 Uganda 60.0 +24.0
2 Police 82.5 Tanzania 72.9 +9.6
3 Police 73.3 Burundi 64.0 +9.3
4 Police 68.0 Kenya 60.0 +8.0
5 Land Services 60.0 Uganda 46.7 +13.3
6 Land Services 55.0 Kenya 46.7 +8.3
7 Judiciary 46.7 Kenya 38.3 +8.4
8 Police 46.6 Rwanda 54.0 -7.4
9 Land Services 42.3 Burundi 51.7 -9.4
10 Judiciary 41.7 Tanzania 38.3 +3.4
11 Judiciary 37.0 Rwanda 24.0 +13.0
12 Land Services 35.7 Tanzania 26.9 +8.8
13 Judiciary 35.0 Burundi 48.3 -13.3
14 Natural Resources 34.2 Tanzania - -
15 Local Authority 32.2 Rwanda 42.8 -10.6
16 Judiciary 30.7 Uganda 42.0 -11.3
17 Private Sector 30.6 Rwanda 12.9 +17.7
18 Tax Services 23.1 Kenya 14.6 +8.5
19 Educational Institutions 22.5 Burundi 20.2 +2.3
20 Banks 21.7 Rwanda 22.8 -1.1
21 County Administration 21.5 Kenya - -
22Medical And Health Services 19.8 Uganda 15.9 +3.9
23 Tax Services 19.8 Burundi 16.4 +3.4
24 City and Local Councils 19.4 Uganda 25.9 -6.5
25Registry & Licensing Services 19.4 Kenya 33.3 -13.9
26Registry & Licensing Services 18.0 Tanzania 21.6 -3.6
27Utilities (Water & Electricity) 15.8 Uganda 13.2 +2.6

3 T h e E a s t A f r i c a n B r i b e r y I n d e x 2 0 1 4
Rank Sector /Institution2014
AggregateCountry
2013 Aggregate
Variance
28Registry & Licensing Services 15.6 Rwanda - -
29Utilities (Water & Electricity) 15.6 Tanzania 15.4 +0.2
30Registry & Licensing Services 15.5 Uganda 25.1 -9.6
31Registry & Licensing Services 15.3 Burundi 16.4 -1.1
32Medical and Health Services 15.2 Tanzania 22.0 -6.8
33 City and Local Councils 14.7 Burundi 12.3 +2.4
34 Provincial Administration 14.7 Rwanda - -
35 Tax Services 14.5 Uganda 20.1 -5.6
36 Educational Institutions 14.4 Kenya 23.5 -9.1
37 Tax Services 14.4 Tanzania 36.9 -22.5
38Utilities (Water, Electricity &Postal Services) 14.0 Rwanda 12.0 +2.0
39 Educational Institutions 13.7 Uganda 13.3 +0.4
40Medical and Health Services 13.4 Kenya 14.1 -0.7
41Utilities (Water & Electricity) 12.7 Kenya 11.2 +1.5
42Utilities (Water & Electricity) 12.4 Burundi 19.4 -7.0
43 Land Services 12.3 Rwanda 14.5 -2.2
44 Educational Institutions 12.2 Tanzania 12.5 -0.3
45 City and Local Councils 12.0 Tanzania 15.1 -3.1
46Medical and Health Services 10.4 Burundi 10.2 +0.2
47 Educational Institutions 10.0 Rwanda 9.6 +0.4
48 Tax Services 9.7 Rwanda 18.8 -9.2
49 Civil Society 9.4 Rwanda 5.4 +4.0
50Medical and Health Services 7.9 Rwanda 9.4 -1.5
Table 8: Aggregate index across East Africa

4T h e E a s t A f r i c a n B r i b e r y I n d e x 2 0 1 4
BURUNDI
INTRODUCTION
Corruption continues to pose a real challenge in service delivery in Burundi. According to this report, East Africans are more likely to encounter bribery in Burundi than in any of the other four countries surveyed. This is an alarming finding that should concern authorities, stakeholders and members of the public to stand up against any act of corruption. Key service sectors like the Police, Lands and Judiciary still remain the most bribery prone institutions in the country.
The Ministry of Good Governance has been conducting regular public awareness activities against corruption in conjunction with civil society organisations including Association Burundaise des Consommateurs (ABUCO) – Transparency International Burundi and other organisations such as Observatoire de la lutte contre la corruption et les malversations économiques (OLUCOME). The media in Burundi has also increasingly taken up its role in the fight against corruption through different public programmes.
Despite these concerted efforts between the government, the civil society and other non-state actors to create awareness against corruption, there is need to translate this public awareness into action that will turn the tide against bribery and corruption at large. Citizens need to be empowered to realise that they have a role to play in the fight against corruption while the government needs to prioritise enforcement of existing anti-corruption laws.
As the country prepares for general elections in 2015, the public must make anti-corruption an election agenda to ensure that successful candidates are held accountable in fighting this vice.

5 T h e E a s t A f r i c a n B r i b e r y I n d e x 2 0 1 4
Sample characterisationA sample of 1,448 respondents was randomly selected across all the provinces in Burundi for the survey. The distribution of respondents by province is indicated in the table below.
Province Number of respondents Percentage
Bubanza 58 4.
Bujumbura Mairie 100 7
Bujumbura Rural 81 6
Bururi 108 8
Cankuzo 34 2
Cibitoke 79 6
Gitega 129 9
Karusi 72 5
Kayanza 111 8
Kirundo 116 8
Makamba 64 4
Muramvya 66 5
Muyinga 119 8
Mwaro 52 4
Ngozi 117 8
Rutana 62 4
Ruyigi 80 6
Total 1,448 100
Table 9: Distribution of respondents by province – Burundi
FINDINGS
Aggregate IndexThe aggregate index is a composite index resulting from the five different indicators of the survey. It ranges between 0 and 100, with a score of 100 being the worst score. It is a result of the different indicators of the survey, with the final score dependent on how the sector performed in the individual indicator.
The Burundi National Police was ranked as the most bribery prone in Burundi with an increased score of 73.3 compared with 64 in 2013. This was followed by Land Services, which held the same position in 2013 with a score of 51.7 against a score of 42.3 in 2014. Once again the Medical and Health Services was ranked tenth with a score of 10.4.

6T h e E a s t A f r i c a n B r i b e r y I n d e x 2 0 1 4
Rank Sector2014
Aggregate2013
AggregateVariance
1 Police 73.3 64.0 +9.3
2 Land Services 42.3 51.7 -9.4
3 Judiciary 35.0 48.3 -13.3
4 Educational Institutions 22.5 20.9 +1.6
5 Tax Services 19.8 16.4 +3.4
6 Registry & Licensing services 15.3 17.5 -2.2
7 City and Local Councils 14.7 12.6 +2.1
8 Utilities (Water & Electricity) 12.4 18.7 -6.3
9 Medical and Health Services 10.4 10.2 +0.2
Table 10: Aggregate index – Burundi
INDICATOR RANKING
Indicator 1: LikelihoodThis indicator measures the likelihood of a respondent being asked or expected to pay a bribe when interacting with a particular sector. It also includes respondents who offered to pay a bribe. It is derived from the number of all bribery situations (demanded, expected, offered) registered in a sector as a proportion of all the interactions registered in that particular sector.
In this category, the police took the lead with respondents having a 23% chance of encountering a bribery incident. This was the same position held by the Police in 2013 with a slightly higher likelihood of 24.7%. Land Services moved up one spot to second place with respondents having a 21% chance of encountering bribery. The Judiciary dropped from second position in 2013 to the fifth position in 2014 while Medical and Health Services maintained the last position in this list with respondents having a three percent chance of encountering bribery.
Rank Sector 2014 (%) 2013 (%) Variance
1 Police 23.8 24.7 -0.9
2 Land Services 21.1 21.3 -0.2
3 Registry & Licensing Services 18.0 18.0 -0.4
4 Educational Institutions 17.4 12.9 +4.5
5 Judiciary 17.4 21.4 -4
6 City & Local Councils 16.8 11.9 +4.9
7 Tax Services 9.0 12.8 -3.8
8 Utilities (Water & Electricity) 6.4 9.2 -2.8
9 Medical and Health Services 3.5 3.1 +0.4
Table 11: Likelihood of bribery - Burundi

7 T h e E a s t A f r i c a n B r i b e r y I n d e x 2 0 1 4
Indicator 2: PrevalenceThis indicator measures the probability that a respondent would pay a bribe upon interacting with a particular sector. It is calculated as the proportion of the number of bribes recorded in a particular sector to the total number of interactions registered in that sector. A higher value indicates the high prevalence of bribery in a sector.
On the probability of actual payment of a bribe, the Burundi National Police was ranked first at 39.5%, an increase from 31.5% in 2013. Land Services was second at 19.3% followed by the Judiciary at 17.3%, both registering a decrease from the previous year. Medical Services recorded the lowest prevalence at 1.1%.
Rank Sector 2014 (%) 2013 (%) Variance
1 Police 39.5 31.5 +8
2 Land Services 19.3 26.8 -7.5
3 Judiciary 17.3 19.4 -2.1
4 Tax Services 15.0 19.3 -4.3
5 Registry & Licensing Services 14.7 13.9 +0.8
6 Educational Institutions 14.6 10.3 +4.3
7 City & Local Councils 11.7 5.8 +5.9
8 Utilities (Water & Electricity) 6.5 10.1 -3.6
9 Medical and Health Services 1.1 1.1 0
Table 12: Prevalence of bribery – Burundi
Indicator 3: Average size of bribeThis indicator captures the average amount of bribes paid by respondents while seeking services in a particular sector. It is the arithmetic mean of all bribes paid to a sector, relative to all the respondents reporting having paid a bribe to that sector.
Respondents interacting with the Land Services had to part with an average of 86,747 Burundi Francs (approximately USD 574) in order to access services. This was a drop from 112,794 Burundi Francs (approximately USD 74) paid in 2013. Generally ,there was a decrease in the average size of bribe in several sectors most notably in utilities (Water & Electricity) where it reduced by a third from 90,842 Francs in 2013 to 29,481 Francs in 2014 (approximately USD 59 to USD 19). Increased amounts were recorded at the Judiciary, Registry & Licensing Services and Tax Services.
4 1 USD = 1,521 Burundi Francs

8T h e E a s t A f r i c a n B r i b e r y I n d e x 2 0 1 4
Rank SectorAverage size
of bribe (Fbu)5 2014)
Average size of bribe
(Fbu) 2013Variance6
1 Land Services 86,747 112,794 -26,047
2 Judiciary 77,983 74,160 +3,823
3 Tax Services 37,791 24,868 +12,923
4 Educational Institutions 34,470 43,568 -9,098
5 Police 33,913 50,424 -16,511
6 Utilities (Water & Electricity) 29,481 90,842 -61,361
7 City and Local Councils 21,572 35,135 -13,563
8 Medical and Health Services 4,667 6,824 -2,157
9 Registry & Licensing Services 5,324 1,941 +3,383
Table 13:5 Average size of bribe – Burundi6
Indicator 4: Share of ‘national’ bribeThis is the proportion of bribes a sector accounts for relative to the total amount of bribes recorded by the survey across all sectors in a particular country. It reflects the proportional culpability of a sector as measured by the amount of bribes received.
The Burundi National Police enjoyed a third of the total amount of bribes paid in Burundi, an increase from 23.8% in 2013. The Judiciary was second with a share of 27.6% and Educational Institutions third at 19.4%. The rest of the sectors mentioned had a share of less than 10% of the total bribes paid.
Rank Sector 2014 (%) 2013 (%) Variance
1 Police 30.0 23.8 +6.2
2 Judiciary 27.6 27.8 -0.2
3 Educational Institutions 19.4 13.2 +6.2
4 Land Services 8.4 11.3 -2.9
5 City and Local Councils 5.0 2.5 +2.5
6 Tax Services 4.2 5.3 -1.1
7 Utilities (Water & Electricity) 2.6 9.3 -6.7
8 Registry & Licensing Services 1.8 2.6 -0.8
9 Medical and Health Services 1.0 0.4 +0.6
Table 14: Share of ‘national’ bribe – Burundi
Indicator 5: Perceived ImpactThis indicator is derived from the respondent’s perception on whether they would have received the services they were seeking if they had not paid the bribe. It highlights the value that the respondents have on the bribes paid as the only means to access a service.
5 Burundi Francs6 Difference between average amount of bribe paid in 2014 and 2013
9 T h e E a s t A f r i c a n B r i b e r y I n d e x 2 0 1 4
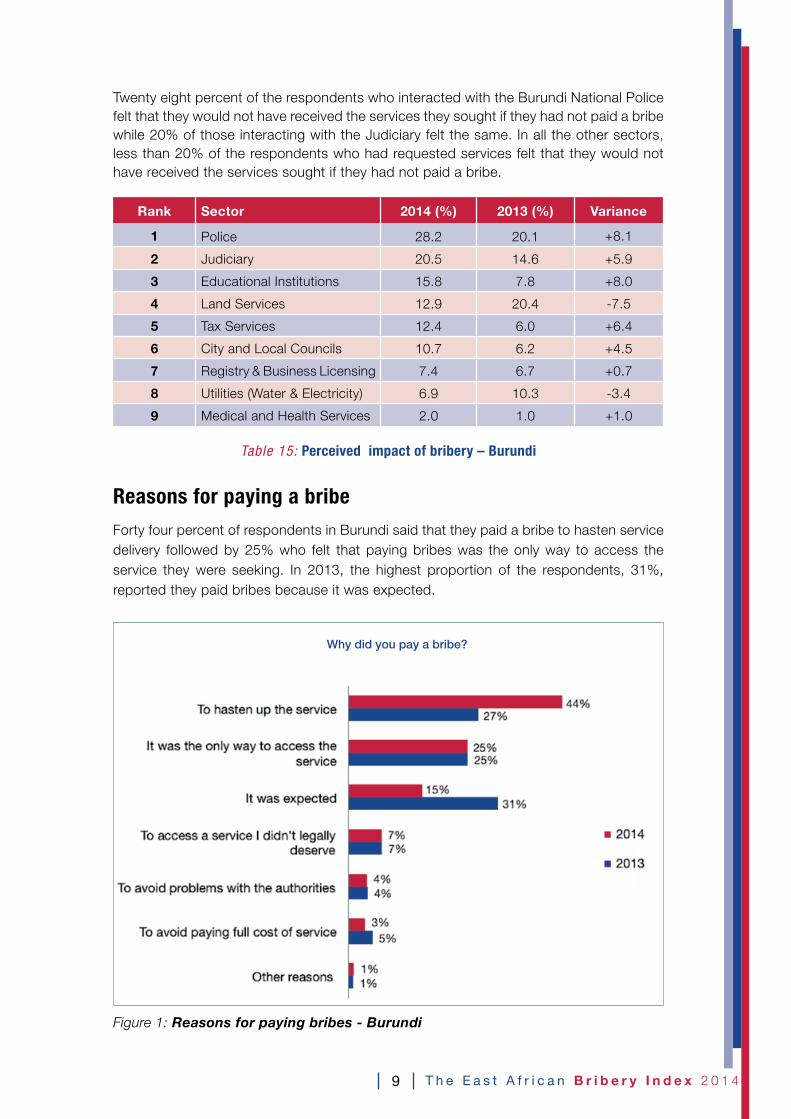
Twenty eight percent of the respondents who interacted with the Burundi National Police felt that they would not have received the services they sought if they had not paid a bribe while 20% of those interacting with the Judiciary felt the same. In all the other sectors, less than 20% of the respondents who had requested services felt that they would not have received the services sought if they had not paid a bribe.
Rank Sector 2014 (%) 2013 (%) Variance
1 Police 28.2 20.1 +8.1
2 Judiciary 20.5 14.6 +5.9
3 Educational Institutions 15.8 7.8 +8.0
4 Land Services 12.9 20.4 -7.5
5 Tax Services 12.4 6.0 +6.4
6 City and Local Councils 10.7 6.2 +4.5
7 Registry & Business Licensing 7.4 6.7 +0.7
8 Utilities (Water & Electricity) 6.9 10.3 -3.4
9 Medical and Health Services 2.0 1.0 +1.0
Table 15: Perceived impact of bribery – Burundi
Reasons for paying a bribeForty four percent of respondents in Burundi said that they paid a bribe to hasten service delivery followed by 25% who felt that paying bribes was the only way to access the service they were seeking. In 2013, the highest proportion of the respondents, 31%, reported they paid bribes because it was expected.
Figure 1: Reasons for paying bribes - Burundi
Why did you pay a bribe?

10T h e E a s t A f r i c a n B r i b e r y I n d e x 2 0 1 4
Reporting of bribery incidents When asked whether they reported or complained about the bribery incidents they encountered, 93% said that they did not. The percentage of those who reported dropped from 11% in 2013 to 7% in 2014.
Figure 2: Reporting of bribery incidents - Burundi
Reasons for not reporting bribery incidentsRespondents in Burundi, in equal share at 18%, said that the reason they did not report the bribery incidents they encountered was because they were beneficiaries to the vice, feared incriminating themselves and reprisals arising from making such a report. In 2013, the highest proportion of respondents (31%) did not report bribery cases as they did not know where to report.
Figure 3: Reasons for not reporting bribery incidents - Burundi
Did you report any of the bribery incidents you encountered to any authority or person?
Reasons for not reporting the bribery incidents

11 T h e E a s t A f r i c a n B r i b e r y I n d e x 2 0 1 4
CORRUPTION PERCEPTION The survey also sought to establish the respondents’ perception towards corruption and the anti-corruption agenda in their countries.
Perceived level of corruptionSeventy two percent of the respondents described the state of corruption in Burundi as high, an increase from 62% in 2013. Twenty percent termed the level of corruption as average compared with 24% in the previous year while six percent described the level of corruption as low.
Figure 4: Perceived level of corruption - Burundi
Perceived change of the level of corruption in the past year Half of the respondents in Burundi felt that corruption had increased compared with 28% that felt it had remained the same. Eighteen percent felt that it had decreased. It is worth noting that in 2013, the highest proportion of respondents (41%) felt that corruption would increase in the coming year.
Figure 5: Perceived change in the level of corruption - Burundi
How would you describe the current state of corruption in Burundi today?
Comparing the current state of corruption with one year ago, would you say corruption has:

12T h e E a s t A f r i c a n B r i b e r y I n d e x 2 0 1 4
Projected change in the level of corruption Almost half of the respondents interviewed in Burundi felt that corruption levels would increase in the next year, with 26% holding the opposite opinion. Fifteen percent felt corruption levels would remain the same.
Figure 6: Projected change in level of corruption - Burundi
About 43% of the respondents observed that lack of visible measures geared towards reducing corruption was among the main reasons why corruption levels would increase in the coming year. Other reasons put forward are listed as follows:
Reasons for Projected increase in corruption in the next one year Percent
No measures are taken by the government to reduce corruption 43%
You cannot get services without giving a bribe in Burundi 29%
High poverty unemployment cost of living 25%
Other reasons 4%
Table 16: Reasons for projected increase in corruption in the next one year - Burundi
Thinking of the next one year, do you think the incidents of corruption will:
13 T h e E a s t A f r i c a n B r i b e r y I n d e x 2 0 1 4
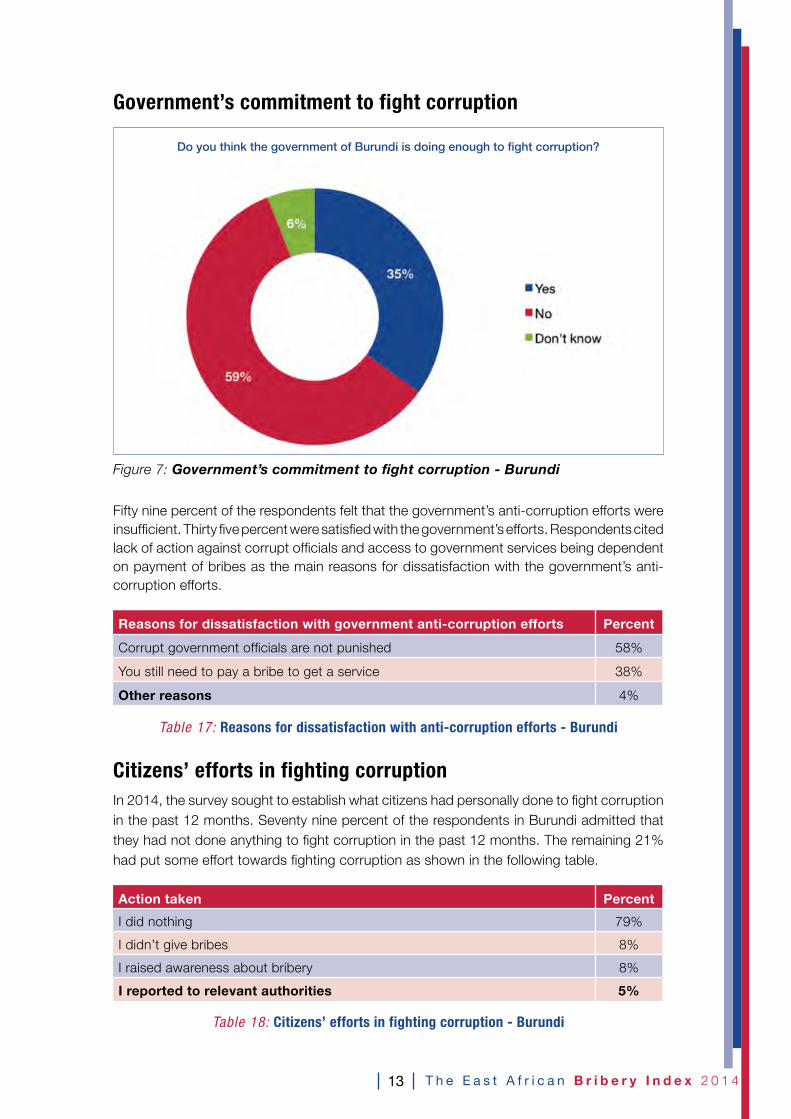
Government’s commitment to fight corruption
Figure 7: Government’s commitment to fight corruption - Burundi
Fifty nine percent of the respondents felt that the government’s anti-corruption efforts were insufficient. Thirty five percent were satisfied with the government’s efforts. Respondents cited lack of action against corrupt officials and access to government services being dependent on payment of bribes as the main reasons for dissatisfaction with the government’s anti-corruption efforts.
Reasons for dissatisfaction with government anti-corruption efforts Percent
Corrupt government officials are not punished 58%
You still need to pay a bribe to get a service 38%
Other reasons 4%
Table 17: Reasons for dissatisfaction with anti-corruption efforts - Burundi
Citizens’ efforts in fighting corruption In 2014, the survey sought to establish what citizens had personally done to fight corruption in the past 12 months. Seventy nine percent of the respondents in Burundi admitted that they had not done anything to fight corruption in the past 12 months. The remaining 21% had put some effort towards fighting corruption as shown in the following table.
Action taken Percent
I did nothing 79%
I didn’t give bribes 8%
I raised awareness about bribery 8%
I reported to relevant authorities 5%
Table 18: Citizens’ efforts in fighting corruption - Burundi
Do you think the government of Burundi is doing enough to fight corruption?

14T h e E a s t A f r i c a n B r i b e r y I n d e x 2 0 1 4
What do you think is the most important action to be taken in the fight against corruption?
When asked the most important thing that should be done in the fight against corruption, 52% of the respondents recommended punitive measures against corrupt officials followed by 24% that proposed collaboration between the government and non-governmental organisations in creating awareness among the public.
Recommendation Percent
The government should punish corrupt officials 52%
The government and NGOs should partner to create awareness 24%
The government should make / review laws fighting corruption 13%
Create more jobs and increase salaries of civil servants 11%
Table 19: Most important action to be taken against corruption - Burundii

15 T h e E a s t A f r i c a n B r i b e r y I n d e x 2 0 1 4
KENYA
INTRODUCTIONThe findings of this East African Bribery Index edition indicate that corruption continues to stalk key sectors including those that have received considerable attention in the reform process since the promulgation of the Constitution of Kenya in 2010. The reforms have been particularly focused on the National Police Service, Lands and Judiciary; yet these sectors top the 2014 aggregate index in Kenya, and feature prominently in the other indicators.
Reforms in the Police Service have seen the establishment of the National Police Service Commission (NPSC), which is responsible for the recruitment and management of personnel. The Independent Policing Oversight Authority (IPOA), a public oversight body to check excesses in law enforcement has also been established. The formation of these independent bodies offered fresh optimism to the public, that previous corruption-prone processes such as the hiring and promotion of police officers and others including disciplinary procedures and general management of staff would be conducted above board. However, the police recruitment of more than 10,000 officers conducted in 2014 by the Commission was marred by allegations of bribery, nepotism, tribalism and other irregularities. The irregularities raised doubts on the impact and speed of ongoing police reforms aimed at instilling discipline, professionalism, integrity, accountability among other attributes of an effective Police Service. The High Court later nullified the entire exercise and ordered a fresh recruitment countrywide. At the time of publishing this report, the Commission had indicated it would appeal the court ruling.
The vetting of police officers that began in 2013 delivered some admirable results, albeit not without challenges. More than 10 senior police officers were declared unfit to hold office, largely due to undeclared and or unexplained wealth. These outcomes are still being challenged by those affected.
The reforms in the land sector have commenced albeit with teething problems. The Ministry of Lands and National Land Commission were at loggerheads over many issues for the better part of 2014, mainly on their mandates. Progress in instilling integrity in this sector largely depends on the ability of the Ministry and the Commission to work together harmoniously to offer leadership and solutions to the many problems affecting the sector. The Lands Cabinet Secretary has been at the forefront of reorganising the lands registry to particularly resolve the problem of perpetually ‘missing’ files that had long been used as baits in the demand for bribes. These efforts seem not to have registered impact yet in so far as bribery incidents in the registries are concerned.
16T h e E a s t A f r i c a n B r i b e r y I n d e x 2 0 1 4
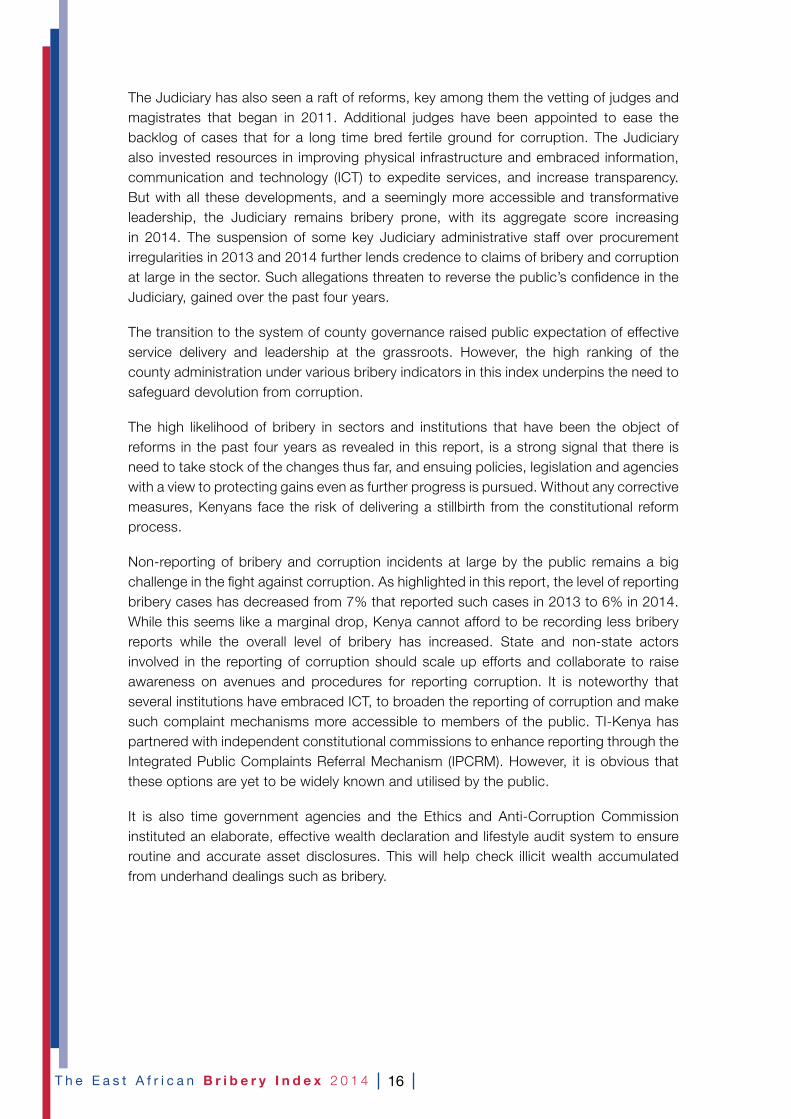
The Judiciary has also seen a raft of reforms, key among them the vetting of judges and magistrates that began in 2011. Additional judges have been appointed to ease the backlog of cases that for a long time bred fertile ground for corruption. The Judiciary also invested resources in improving physical infrastructure and embraced information, communication and technology (ICT) to expedite services, and increase transparency. But with all these developments, and a seemingly more accessible and transformative leadership, the Judiciary remains bribery prone, with its aggregate score increasing in 2014. The suspension of some key Judiciary administrative staff over procurement irregularities in 2013 and 2014 further lends credence to claims of bribery and corruption at large in the sector. Such allegations threaten to reverse the public’s confidence in the Judiciary, gained over the past four years.
The transition to the system of county governance raised public expectation of effective service delivery and leadership at the grassroots. However, the high ranking of the county administration under various bribery indicators in this index underpins the need to safeguard devolution from corruption.
The high likelihood of bribery in sectors and institutions that have been the object of reforms in the past four years as revealed in this report, is a strong signal that there is need to take stock of the changes thus far, and ensuing policies, legislation and agencies with a view to protecting gains even as further progress is pursued. Without any corrective measures, Kenyans face the risk of delivering a stillbirth from the constitutional reform process.
Non-reporting of bribery and corruption incidents at large by the public remains a big challenge in the fight against corruption. As highlighted in this report, the level of reporting bribery cases has decreased from 7% that reported such cases in 2013 to 6% in 2014. While this seems like a marginal drop, Kenya cannot afford to be recording less bribery reports while the overall level of bribery has increased. State and non-state actors involved in the reporting of corruption should scale up efforts and collaborate to raise awareness on avenues and procedures for reporting corruption. It is noteworthy that several institutions have embraced ICT, to broaden the reporting of corruption and make such complaint mechanisms more accessible to members of the public. TI-Kenya has partnered with independent constitutional commissions to enhance reporting through the Integrated Public Complaints Referral Mechanism (IPCRM). However, it is obvious that these options are yet to be widely known and utilised by the public.
It is also time government agencies and the Ethics and Anti-Corruption Commission instituted an elaborate, effective wealth declaration and lifestyle audit system to ensure routine and accurate asset disclosures. This will help check illicit wealth accumulated from underhand dealings such as bribery.

17 T h e E a s t A f r i c a n B r i b e r y I n d e x 2 0 1 4
Sample characterisationA total of 2,164 residents were sampled from 16 counties in Kenya as shown in the table below:
Province Number of respondents Percentage
Bungoma 160 7
Embu 60 3
Garissa 50 2
Kakamega 197 9
Kilifi 125 6
Kisii 142 7
Kisumu 110 5
Machakos 129 6
Mombasa 105 5
Murang’a 121 6
Nairobi 367 17
Nakuru 215 10
Narok 111 5
Nyeri 83 4
Turkana 79 4
Uasin Gishu 110 5
Total 2164 100
Table 20: Distribution of respondents by County - Kenya
FINDINGS
Aggregate IndexThe aggregate index is a composite index resulting from the five different indicators of the survey. It ranges between 0 and 100, with a score of 100 being the worst score. It is a result of the different indicators of the survey, with the final score dependent on how the sector performed in the individual indicator.
The Kenya National Police Service was ranked first as most affected by bribery, followed by Land Services and the Judiciary. These three held the same spots in the 2013 index, but with lower scores. Tax Services moved up to the fourth spot with the score increasing from 14.6% to 23.1%. In 2014, following the new governance system of devolution, City and Local Councils were replaced with the County Administration, which maintained the same spot as its predecessor. Utilities (water and electricity) were once again ranked last in this list.

18T h e E a s t A f r i c a n B r i b e r y I n d e x 2 0 1 4
Rank Sector2014
Aggregate2013
AggregateVariance
1 Police 68.0 70.7 -2.7
2 Land Services 55.0 46.7 +8.3
3 Judiciary 46.7 38.3 +8.4
4 Tax Services 23.1 14.6 +8.5
5 County Administration 21.5 - -
6 Registry & Licensing Services 19.4 23.5 -4.1
7 Educational Institutions 14.4 14.6 -0.2
8 Medical and Health Services 13.3 14.1 -0.8
9 Utilities (Water & Electricity) 12.7 11.2 +1.5
Table 21: Aggregate Index – Kenya
INDICATOR RANKING
Indicator 1: LikelihoodThis indicator measures the likelihood of a respondent being asked or expected to pay a bribe when interacting with a particular sector. It also includes respondents who offered to pay a bribe.
It is derived from the number of all bribery situations (demanded, expected, offered) registered in a sector as a proportion of all the interactions registered in that particular sector.
In this category, Land Services took the lead with respondents having a 17% chance of encountering a bribery incident replacing Registry and Licensing Services that topped in this indicator in the 2013 index. The Judiciary maintained the second spot with increased likelihood (from 15.7% to 16.4%) while the Police dropped two spots from last year. Utilities (water and electricity) maintained the last position in this list.
Rank Sector 2014 (%) 2013 (%) Variance
1 Land Services 17.5 8.0 +9.5
2 Judiciary 16.4 15.7 +0.7
3 Registry & Licensing Services 10.0 21.8 -11.8
4 Police 8.9 10.2 -1.3
5 Medical and Health Services 8.3 7.7 0.6
6 Educational Institutions 5.6 4.6 +1
7 County Administration 4.5 - -
8 Tax Services 4.0 7.9 -3.9
9 Utilities (Water & Electricity) 3.5 2.3 +1.2
Table 22: Likelihood of bribery - Kenya
Indicator 2: PrevalenceThis indicator measures the probability that a respondent would pay a bribe upon interacting with a particular sector. It is calculated as the proportion of the number of bribes recorded in

19 T h e E a s t A f r i c a n B r i b e r y I n d e x 2 0 1 4
a particular sector and the total number of interactions registered in that sector. A higher value indicates the high prevalence of bribery in a sector.
On the probability of a respondent’s actual payment of a bribe when interacting with a sector, the Police Service was ranked first at 71.7%, at a similar position held and score recorded in 2013. Tax Services was second at 31.4% followed by the County Administration at 25.9%, Utilities (water & electricity) were bottom of the list.
Rank Sector 2014 (%) 2013 (%) Variance
1 Police 71.7 71.8 -0.1
2 Tax Services 31.4 9.7 +21.7
3 County Administration 25.9 - -
4 Land Services 19.4 38.6 -19.2
5 Registry & Licensing Services 19.2 20.0 -0.8
6 Judiciary 15.7 19.5 -3.8
7 Educational Institutions 13.4 39.5 -26.1
8 Medical and Health Services 10.5 9.8 +0.7
9 Utilities (Water & Electricity) 5.7 3.9 +1.8
Table 23: Prevalence of bribery - Kenya
Indicator 3: Average size of bribeThis indicator captures the average amount of bribes paid by respondents while seeking services in a particular sector. It is the arithmetic mean of all bribes paid to a sector, relative to all the respondents that reported paying a bribe to that sector.
The Judiciary and Land Services recorded the highest average size of bribe (Ksh 7,885 and Ksh 7,219; USD7 88 and 81 respectively) that was paid by respondents as in 2013 but with slightly lesser amounts with the Judiciary overtaking Land Services to take the lead. Amounts paid to Tax Services also significantly increased from Ksh 3,986 in 2013 to Ksh 6,815 in 2014 (from USD 45 to 77).
Rank SectorAverage size of
bribe
(Ksh)8 2014)
Average size of bribe
(Ksh) 2013Variance
1 Judiciary 7,885 8,390 -505
2 Land Services 7,219 8,949 -1,730
3 Tax Services 6,815 3,986 +2,829
4 County Administration 4,942 5,637 -695
5 Police 4,821 4,411 +410
6 Utilities (Water & Electricity) 2,121 1,553 +568
7 Educational Institutions 2,095 4,378 -2,283
8Registry & Licensing Services 1,103 965 +138
9 Medical and Health Services 881 1,119 -238
Table 24: Average size of bribe - Kenya8
7 1 USD= 88 Kenya Shillings 8 Kenya Shilling

20T h e E a s t A f r i c a n B r i b e r y I n d e x 2 0 1 4
Indicator 4: Share of ‘national’ bribeThis is the proportion of bribes a sector accounts for relative to the total amount of bribes recorded by the survey in a particular country. It reflects the proportional culpability of a sector as measured by the amount of bribes received.
The Kenya National Police Service received the biggest share of bribes paid in the sectors mentioned and accounted for almost half of all the bribes paid at 43.5%. Land Services was second at 11.9% followed closely by the Judiciary at 11.6%. Tax Services, Medical Services and utilities (water & electricity) had the smallest share of bribe, each less than 5%.
Rank Sector 2014 (%) 2013 (%) Variance
1 Police 43.5 33.1 +10.4
2 Land Services 11.9 14.4 -2.5
3 Judiciary 11.6 12.0 -0.4
4 Registry & Licensing Services 7.7 6.4 +1.3
5 Educational Institutions 7.4 9.8 -2.4
6 County Administration 5.7 14.4 -8.7
7 Utilities (Water & Electricity) 5.0 2.9 +2.1
8 Medical and Health Services 4.4 3.6 +0.8
9 Tax Services 2.7 2.4 +0.3
Table 25: Share of ‘national’ bribe - Kenya
Indicator 5: Perceived Impact
This indicator is derived from the respondent’s perception on whether they would have received the services they were seeking if they had not paid a bribe. It brings out the value that the respondents have on the bribes paid as the only means to access a service.
Half of the respondents who interacted with the Kenya National Police Service felt that if they had not paid a bribe they would not have received the services they were seeking. About 27% of respondents interacting with Land Services and 26.2% with the Judiciary held the same view.
Rank Sector 2014 (%) 2013 (%) Variance
1 Police 51.4 45.6 +5.8
2 Land Services 27.0 25.7 +1.3
3 Judiciary 26.2 27.6 -1.4
4 County Administration 18.0 14.4 +3.6
5 Medical and Health Services 17.7 3.6 +14.1
6 Registry & Licensing Services 13.5 6.4 +7.1
7 Utilities (Water & Electricity) 11.5 2.9 +8.6
8 Educational Institutions 11.1 9.8 +1.3
9 Tax Services 6.2 2.4 +3.8
Table 26: Prevalence impact of bribery - Kenya

21 T h e E a s t A f r i c a n B r i b e r y I n d e x 2 0 1 4
Reasons for paying bribesWhen asked why they paid a bribe, 38% of the respondents said they did so because it was the only way to access a service; 26% gave the same response in 2013. Thirty one percent said it was aimed at expediting the service while 16.6% of the respondents said that they paid a bribe to avoid problems with the authorities. In 2013, the highest proportion of respondents, 36%, said they had given a bribe to expedite services.
Figure 8: Reasons for paying bribes – Kenya
Reporting of bribery cases When asked whether they reported any of the bribery incidents they encountered, 94% of respondents stated that they did not with only 6% reporting; a slight decrease from 2013 where 7% reported.
Figure 9: Reporting of bribery incidents - Kenya
Did you report any of the bribery incidences you encountered to any authority or person?
Why did you pay the bribe?

22T h e E a s t A f r i c a n B r i b e r y I n d e x 2 0 1 4
Reasons for not reporting bribery incidentsTwenty seven percent of respondents who encountered bribery did not report as they stated that they did not know where to report. This was followed by 20% that believed that no action would be taken towards resolving their complaint and 20% who were beneficiaries of the transaction and did not see the need to report. In 2013, the biggest proportion of respondents (27%) encountering bribery did not report the bribery cases as they believed that no action would be taken.
Figure 10: Reasons for not reporting bribery incidents – Kenya
CORRUPTION PERCEPTION The survey also sought to establish respondents’ perception towards corruption and the anti-corruption agenda in their countries.
Perceived current level of corruption
Figure 11: Perceived current level of corruption – Kenya
How would you describe the current state of corruption in Kenya today?
Reasons for not reporting the bribery incidents

23 T h e E a s t A f r i c a n B r i b e r y I n d e x 2 0 1 4
Eighty one percent of the respondents described the current level of corruption in the country as high compared with 64% who gave the same response in 2013. Those that described the level of corruption as average decreased from 26% in 2013 to 14% in 2014.
Perceived change in the level of corruption
Figure 12: Perceived change in the level of corruption - Kenya
The negative perception of the state of corruption in Kenya persisted as 54% of the respondents felt that corruption had indeed increased within the last 12 months. In 2013, the highest proportion of respondents (46%) felt that corruption would decrease in the coming year.
Projected change in the level of corruption
Majority of the respondents were pessimistic about the future outlook of corruption as half of them (51%) felt that corruption in the next year would increase, with 27% of the respondents predicting a decrease in corruption levels.
Figure 13: Projected change in level of corruption - Kenya
Comparing the current state of corruption with one year ago, would you say corruption has:
Thinking of the next one year, do you think the incidents of corruption will:

24T h e E a s t A f r i c a n B r i b e r y I n d e x 2 0 1 4
Majority of the respondents observed that government officials engaging more in corruption and the high cost of living were the main reasons for the expected increase in corruption levels in the next year.
Reasons for Projected increase in the level of corruption Percent
Government officials are becoming more corrupt 43%
High cost of living / poverty 33%
We cannot see any efforts being made to fight corruption 23%
Other reasons 2%
Table 27: Reasons for projected increase in level of corruption - Kenya
Government’s commitment to fight corruption
Figure 14: Government’s commitment to fight corruption – Kenya
More than half of the respondents (59%) of the respondents felt that the government was not doing enough to fight corruption while 38% were satisfied with the government’s anti-corruption efforts. Respondents cited lack of punitive action against corrupt government officials as the main reason for their dissatisfaction.
Reasons for dissatisfactino with government anti-corruption efforts Percent
Corrupt government officials are not punished 64%
There are no visible anti-corruption efforts 17%
You still need to pay a bribe to get a service 13%
Other reasons 5%
Table 28: Reasons for dissatisfaction with government’s anti-corruption efforts - Kenya
Do you think the government of Kenya is doing enough to fight corruption?

25 T h e E a s t A f r i c a n B r i b e r y I n d e x 2 0 1 4
Citizens’ efforts in fighting corruption In 2014, the survey sought to establish what citizens had personally done to fight corruption in the past 12 months. Fifty seven percent reported that they had not done anything at all while 32% reported that they did not give or receive a bribe. This is a clear indication that more awareness creation on the role of the public in the fight against corruption is needed.
Action taken Percent
I did nothing 57%
I didn’t give a bribe 32%
I raised awareness about bribery 7%
I reported to relevant authorities 4%
Table 29: Citizens’ efforts in fighting corruption - Kenya
What do you think is the most important action that should be taken in the fight against corruption? When asked the most important action that should be taken in the fight against corruption, 32% of the respondents felt that sacking corrupt officials would be the best action against corruption followed by 19% that recommended an increase in the remuneration of civil servants and another 19% who proposed reviewing current anti-corruption legislation.
Recommendation Percent
All corrupt officials should be fired 32%
The government should increase pay for civil servants 19%
Review current laws to empower anti-corruption institutions 19%
Citizens should be sensitised about anti-corruption 16%
Other reasons 14%
Table 30: Most important action to be taken against corruption - Kenya

26T h e E a s t A f r i c a n B r i b e r y I n d e x 2 0 1 4
RWANDA
INTRODUCTIONSince 2007, Rwanda has been ranked the least corrupt country among the East African Community member countries and among the least corrupt in the African region by various corruption indices. However, it is evident that corruption has been and still is a prevalent problem in Rwanda. Main areas in Rwanda that constitute potential corruption risks include public procurement, traffic police, justice sector, land services, customs, licensing and issuance of construction permits.
A study conducted by RALGA9 on corruption in Local Government in 2013, revealed that 30% of people who interacted with procurement services between March 2012 and March 2013 reported having personally experienced corruption. The study established a kind of connivance between directors in charge of infrastructure, procurement officers and entrepreneurs in the chain of corruption. In the same vein, a study conducted by Transparency International Rwanda on professionalism and accountability of Rwandan courts, showed that 12.2% of people who interacted with judges experienced corruption incidents. Although this figure appears low, the study highlighted that the average amount paid by every person stands high at Rwf10 228,429 (331 USD).
Nevertheless, it is crucial to note that Rwanda continues to make progress in the fight against corruption as it has adopted encouraging laws and specific rules to reduce corruption. Following the National Anti-Corruption Policy that was approved by the cabinet in June 2012, the Government of Rwanda has also put in place other key laws to strengthen its commitment to prevent and fight corruption. These legislation include the laws relating to the protection of whistle-blowers and that determining the mission, powers, organisation and functioning of the Office of the Ombudsman. The latter law gives the Ombudsman and Deputy Ombudsman the power to investigate all activities relating to the responsibilities of the Office. The Office of Ombudsman is therefore conferred the powers of judicial police, and can request for documents, testimonies and explanations necessary for its investigations from public, parastatals, private organs and non-governmental organisations and is granted prosecution powers for all offences relating to the mission of the Office.
Furthermore, the Office of the Ombudsman is a leading organisation of the National Anti-Corruption Advisory Council (NAAC). In this capacity, it ensures that the anti-corruption institutions (Ombudsman, the Ministry of Local Government, the Ministry of Justice, the Supreme Court, Rwanda National Prosecution Authority, Rwanda National Police, National Security Services, Auditor General of State Finances, Rwanda Public Procurement Authority, Civil society platform, Private Sector Federation) combine efforts to fight corruption by making the decentralisation of the NAAC up to the District, sector and cell level more effective. The Office of the Ombudsman is also tasked with building strong anti-corruption awareness’ programmes at all levels but most importantly improve corruption investigations and emphasise the enforcement of anti-corruption measures.
Non-governmental actors led by Transparency International Rwanda are equally playing an important role towards curbing corruption in Rwanda. This has been done through increasing
9 RALGA: Rwanda Association of Local Government Authorities10 Rwanda Franc

27 T h e E a s t A f r i c a n B r i b e r y I n d e x 2 0 1 4
civic awareness and engagement in the fight against corruption. Advocacy and Legal Advisory Centres run by Transparency International Rwanda, and Anti-corruption, Justice and Information Centres are some corruption reporting mechanisms operated by CSOs to receive complaints of victims and witnesses of corruption. Such complaints have been used for further advocacy for systemic change.
Sample characterisation
A total of 2,511 respondents were randomly selected across the five provinces in Rwanda for the survey. The distribution of respondents by province is indicated in the table below.
Province Number of respondents PercentageKigali City 292 12West 584 23East 544 22North 491 20South 600 24Total 2,511 100
Table 31: Distribution of respondents by province - Rwanda
Aggregate IndexThe aggregate index is a composite index resulting from the five different indicators of the survey. It ranges between 0 and 100, with a score of 100 being the worst score. It is a result of the different indicators of the survey, with the final score dependent on how the sector performed in the individual indicator.
The Rwanda National Police was the most bribery prone institution in Rwanda scoring 46.2, a decrease from a score of 54 in 2013. This was followed by the Judiciary with a score of 37, and the Local Authority with a score of 32.2. The private sector recorded the highest increase in score, moving from 12.9 at position nine in 2013 to 30.6 at fourth place in 2014.
Rank Sector 2014 Aggregate
2013 Aggregate Variance
1 Police 46.6 54.0 -7.4
2 Judiciary 37.0 24.0 +13.0
3 Local Authority 32.2 42.9 -10.7
4 Private Sector 30.6 12.9 +17.7
5 Banks 21.7 22.8 -1.1
6 Registry & Licensing Services 15.6 - -
7 Provincial Administration 14.7 - -
8 Utilities (Water, Electricity & Postal Services) 14.0 12.6 +1.4
9 Land Services 12.3 15.5 -3.2
10 Educational Institutions 10.0 9.6 +0.4
11 Tax Services 9.7 18.8 -9.2
12 Civil Society 9.4 5.4 +4.0
13 Medical and Health Services 7.9 9.4 -1.5
Table 32: Aggregate Index – Rwanda

28T h e E a s t A f r i c a n B r i b e r y I n d e x 2 0 1 4
INDICATOR RANKING
Indicator 1: Likelihood
This indicator measures the likelihood of a respondent being asked or expected to pay a bribe when interacting with a particular sector. It also includes respondents who offered to pay a bribe. It is derived from the number of all bribery situations (demanded, expected, offered) registered in a sector as a proportion of all the interactions registered in that particular sector.
The likelihood of a respondent encountering a bribery situation while interacting with the Local Authority increased from 5% in 2013 to 7% while likelihood in the Rwanda National Police decreased from 10% in 2013 to 6%. The likelihood of encountering bribery in all the other sectors mentioned was less than 10%.
Rank Sector 2014 (%) 2013 (%) Variance
1 Local Authority 7.1 5.6 +1.5
2 Police 6.0 10.7 -4.7
3 Private Sector 4.2 3.4 +0.8
4 Judiciary 3.0 5.0 -2
5 Provincial Administration 2.7 - -
6 Land Services 2.0 4.5 -2.5
7 Utilities (Water, Electricity & Postal Services)
1.7 2.8-1.1
8 Educational Institutions 1.1 0.6 +0.5
9 Registry & Licensing Services 1.0 - -
10 Tax Services 0.8 1.4 -0.6
11 Civil Society 0.5 0.3 +0.2
12 Bank 0.5 0.8 -0.3
13 Medical and Health Services 0.3 0.5 -0.2
Table 33: Likelihood of bribery - Rwanda
Indicator 2: Prevalence
This indicator measures the probability that a respondent would pay a bribe upon interacting with a particular sector. It is calculated as the proportion of the number of bribes recorded in a particular sector and the total number of interactions registered in that sector. A higher value indicates the high prevalence of bribery in a sector.
Respondents had the highest probability of paying a bribe while interacting with the private sector followed by the Rwanda National Police. This probability in the private sector increased from 5% in 2013 to 23% while that of the Police decreased slightly from 16.1% to 15.7%.

29 T h e E a s t A f r i c a n B r i b e r y I n d e x 2 0 1 4
Rank Sector 2014 (%) 2013 (%) Variance1 Private Sector 23.3 5.1 +18.22 Police 15.7 16.1 -0.43 Local Authority 6.0 5.8 +0.24 Judiciary 4.4 5.6 -1.25 Utilities (Water, Electricity & Postal Services) 2.5 2.5 06 Land Services 1.5 2.0 -0.57 Provincial Administration 1.4 - -8 Civil Society 1.1 0.3 +0.89 Tax Services 0.9 4.7 -3.8
10 Registry & Licensing Services 0.7 - -11 Educational Institutions 0.7 0.4 +0.312 Banks 0.5 0.6 -0.113 Medical and Health Services 0.2 0.7 -0.5
Table 34: Prevalence of bribery – Rwanda
Indicator 3: Average size of bribeThis indicator captures the average amount of bribes paid by respondents while seeking services in a particular sector. It is the arithmetic mean of all bribes paid to a sector, relative to all the respondents reporting having paid a bribe to that sector.
Respondents interacting with the Judiciary had to part with an average of 88,285 Rwanda Francs (approximately USD 131) to access the services they were seeking. This was a significant increase from 45,196 Francs (approximately USD 66) paid in 2013.
Tax Services registered a significant drop in the average amount of bribes paid from 76,500 Francs (approximately USD 114) to 9,428 Francs (approximately USD 14) to take the 13th
position.
Rank SectorAverage size
of bribe (Rwf)11 2014)
Average size of bribe (Rwf) 2013
Variance
1 Civil Society 150,000.0012 30,750 +119,250.00
2 Judiciary 88,285.71 45,196.77 +43,088.94
3 Banks 70,388.89 76,572.82 -6,183.93
4 Registry & Licensing Services 53,937.50 - -
5 Private Sector 53,766.67 7,888.89 +45,877.78
6 Provincial Administration 50,000.00 - -
7 Police 48,961.54 40,754.17 +8,207.37
8 Land Sector 35,125.00 39,590.91 -4,465.91
9Utilities (Water, Electricity & Postal Services) 33,333.33 7,562.5
+25,770.83
10 Local Authority 19,567.55 33,790.43 -14,222.88
11 Educational Institutions 18,625.00 22,937.50 -4,312.50
12 Medical and Health Services 14,80.00 21,820.00 -7,020.00
13 Tax Services 9,428.57 76,500.00 -67,071.43
11Table 35: Average size of bribe - Rwanda12
11 Rwanda Francs12 This amount recorded for the civil society was from only one respondent and no other incident was recorded in this institution
by the survey

30T h e E a s t A f r i c a n B r i b e r y I n d e x 2 0 1 4
Indicator 4: Share of ‘national’ bribeThis is the proportion of bribes a sector accounts for relative to the total amount of bribes recorded by the survey in a particular country. It reflects the proportional culpability of a sector as measured by the amount of bribes received.
Bribes paid to the Rwanda National Police and the Local Authority collectively accounted for half of all the bribes reportedly paid at 28.8% and 22.3% respectively, followed by the Banks and the Judiciary at 14% each. Tax Services and the Provincial Administration took the least share of bribes among the mentioned sectors, each at less than 1%.
Rank Sector 2014 (%) 2013 (%) Variance1 Police 28.8 26.4 +2.42 Local Authority 22.3 38.2 -15.93 Bank 14.3 13.7 +0.64 Judiciary 14.0 7.6 +6.45 Private Sector 6.1 0.4 +5.76 Registry & Licensing Services 3.2 - -7 Utilities (Water, Electricity & Postal Services) 3.0 0.7 +2.38 Educational Institutions 2.2 1.0 +1.29 Land Services 2.1 2.3 -0.2
10 Civil Society 1.1 0.7 +0.411 Medical and Health Services 1.1 1.2 -0.112 Tax Services 0.5 3.2 -2.713 Provincial Administration 0.4 - -
Table 36: Share of ‘national’ bribe - Rwanda
Indicator 5: Perceived ImpactThis indicator is derived from the respondent’s perception on whether they would have received the services they were seeking if they had not paid the bribe. It brings out the value that the respondents have on the bribes paid as the only means to access a service.
Ten percent of the respondents interacting with the Rwanda National Police and private sector felt that paying a bribe was the only way they could access the services they were seeking. Medical and Health Services had the least number of respondents of the sectors mentioned, who felt they would have been denied a service if they had not paid a bribe at 0.6%.
Rank Sector 2014 (%) 2013 (%) Variance1 Police 10.2 28.6 -18.42 Private Sector 10.0 5.2 +4.83 Local Authority 6.1 10.6 -4.54 Judiciary 3.7 8.8 -5.15 Provincial Administration 2.9 - -6 Utilities (Water, Electricity & Postal Services) 2.6 5.6 -37 Tax Services 2.3 5.3 -38 Banks 2.0 2.8 -0.89 Civil Society 1.9 1.7 +0.2
10 Registry & Licensing Services 1.5 - -11 Educational Institutions 1.4 1.2 +0.212 Land Sector 1.4 3.6 -2.213 Medical and Health Services 0.6 0.3 +0.3
Table 37: Perceived impact of bribery - Rwanda

31 T h e E a s t A f r i c a n B r i b e r y I n d e x 2 0 1 4
Reasons for paying a bribeThirty two percent of the respondents reported that they paid a bribe to accelerate service delivery while 27% felt that paying a bribe was the only way to access a service. This was a notable increase from 2013 when 8% and 6% cited the same reasons respectively. Eleven percent gave a bribe to avoid paying the full cost of the service.
Figure 15: Reasons for paying bribes - Rwanda
Reporting of bribery incidentsEighty eight percent of respondents who encountered a bribery incident did not report to any authority or person while only 12% made such a report. This was a slight increase from the 11% that reported in 2013.
Figure 16: Reporting of bribery incidents - Rwanda
Why did you pay a bribe?
Did you report any of the bribery incidents you encountered to any authority or person?

32T h e E a s t A f r i c a n B r i b e r y I n d e x 2 0 1 4
Reasons for not reporting bribery incidentsAbout a third of the respondents who encountered bribery incidents failed to report to avoid incriminating themselves while a quarter admitted that it did not occur to them that they should report. These were the top two reasons for not reporting bribery cited in 2013.
Figure 17: Reasons for not reporting bribery incidents - Rwanda
CORRUPTION PERCEPTION The survey also sought to establish the respondents’ perception towards corruption and the anti-corruption agenda in their countries.
Perceived level of corruptionAbout half of the respondents in Rwanda described the level of corruption in their country as low, a drop from 63% in 2013. Twenty six percent felt it was average. Sixteen percent felt that corruption levels were high compared with 2% in 2013.
Figure 18: Perceived current level of corruption – Rwanda
How would you describe the current level of corruption in Rwanda today?
Reasons for not reporting the bribery incidents

33 T h e E a s t A f r i c a n B r i b e r y I n d e x 2 0 1 4
Perceived change in the level of corruption Seventy four percent of respondents felt that the level of corruption in Rwanda had decreased, while 8% felt that it had remained the same. Ten percent felt that the corruption level had increased. Seventy two percent of the respondents in 2013 had felt that the level of corruption in Rwanda would decrease in 2014.
Figure 19: Perceived change in the level of corruption - Rwanda
Projected change in the level of corruption Seventy eight percent of respondents were optimistic about the future as they believed that corruption would decrease in the next year. Four percent felt it would remain the same while seven percent believed it would increase.
Figure 20: Projected change in the level of corruption – Rwanda
Comparing the current state of corruption with one year ago, would you say corruption has:
Thinking of the next one year, do you think incidents of corruption will:

34T h e E a s t A f r i c a n B r i b e r y I n d e x 2 0 1 4
Government’s commitment to fight corruption Ninety seven percent of the respondents in Rwanda were satisfied with the government’s anti-corruption efforts. Only one percent felt that the efforts were not sufficient.
Figure 21: Government’s commitment to the fight against corruption - Rwanda
Respondents gave various reasons for favourable assessment of the government’s anti-corruption efforts. They observed that massive sensitisation against corruption, punishment of those involved in corruption and good service delivery was proof that indeed the government’s anti-corruption efforts were successful.
Reasons for satisfaction with anti-corruption efforts Percent
There is massive sensitisation and teachings against corruption 29%
Those involved are punished 27%
Government has done much to eradicate corruption 26%
There is good service delivery 10%
Corruption has reduced 6%
Other reasons 2%
Table 38: Reasons for satisfaction with government anti-corruption efforts - Rwanda
Citizens’ efforts in fighting corruption In 2014, the survey sought to establish what citizens had personally done to fight corruption in the preceding 12 months. Sixty three percent of the respondents said they had not involved themselves in any corrupt action while 13% reported those involved in corruption.
Action Percent
I don’t involve myself in corrupt acts 63%
I report those involved in corruption 13%
I participate in community mobilisation and awareness activities against corruption 13%
I did nothing 11%
Table 39: Citizens’ anti-corruption efforts - Rwanda
Do you think the government of Rwanda is doing enough to fight corruption?

35 T h e E a s t A f r i c a n B r i b e r y I n d e x 2 0 1 4
What do you think is the most important action to be taken in the fight against corruption?When asked what ought to be done to bolster the fight against corruption, 30% of the respondents recommended continuous training and sensitisation on corruption, and 29% proposed concerted efforts by both leaders and citizens. Twenty four percent proposed severe punitive action against corrupt individuals.
Recommendation Percent
Continuous training and sensitisation on corruptino 30%
All people (leaders and citizens) to fight corruption together 29%
Heavy punishment for those involved 24%
There should be good service delivery 10%
Other reasons 7%
Table 40: Most important action to be taken against corruption - Rwanda

36T h e E a s t A f r i c a n B r i b e r y I n d e x 2 0 1 4
TANZANIA
INTRODUCTIONA review of various reports of the media, research publications, Parliamentary Hansard and the reports of Controller and Auditor General (CAG) show Tanzania as being engulfed by corruption in which middle or senior Government officials and high profile political leaders are accused of complicity.
Bribery incidents involving the Police and Judiciary, and land officers have been frequently reported in the media. The Inspector General of Police (IGP) has on several occasions’ sacked police officers, especially the traffic police, due to indiscipline including involvement in bribery.
Several people living in rural areas in the regions of Tanga, Morogoro, Manyara, Kagera and others have been killed during violent conflict involving farming and cattle grazing communities over the control of land to support livelihoods. However, the land available for rural and urban communities has decreased over time due to corruption. Productive and strategically placed pieces of land have been illegally allocated to business-cum-political cliques and other corrupt networks.
Frequent media reports on corruption in the wildlife, forestry and fisheries departments of the Government, compounded by the poaching of elephants for their tusks, led to a major cabinet reshuffle in which four ministers were sacked in 2013.
In a study report published by Pew Research Centre in 2014, majority of Tanzanians consider corruption among political leaders as their greatest concern; 9 out of every 10 Tanzanians, feel political leaders have become more corrupt than elsewhere in Africa. According to the CAG report released in 2014, corruption has involved sheer theft of public money through dubious public procurement.
The constitutional review process that has been ongoing for over 20 years may not yield a new Constitution. Principal clauses intended to embed good governance in the new Constitution were removed from the draft during the Constituent Assembly (CA). Fierce debate that ensued over the retention of good governance principles in the proposed Constitution ended up splitting the CA into two; those who were for and against retaining key good governance provisions in the mother draft. In April 2015 Tanzanians will vote in a referendum to decide whether or not to adopt the draft Constitution.
Natural gas estimated at 52 Trillion Cubic Feet (TCF) worth over USD 500 billion is in the coming years expected to boost the economy; increasing the current Gross Domestic Product (GDP) of USD 33.5 billion 16-fold or more. However, apart from publishing the Natural Gas Policy of Tanzania (October 2013), and the local content policy and corresponding revenue management bill, there is little discernible software for good governance of the natural gas resources. The issue of beneficial ownership and contracts’ disclosure, and transparent natural gas revenue management are still unresolved and far from meeting the threshold for accountability.

37 T h e E a s t A f r i c a n B r i b e r y I n d e x 2 0 1 4
There has been public dissatisfaction over the low quality of healthcare, education services and increasing insecurity and crimes.
The Government has promised to enact an Access to Information legislation, which is supported by civil society and media practitioners.
Needless to say, Tanzania’s efforts to curb corruption and contain bribery are facing uphill challenges. A number of civil society and private sector entities are largely weak with some elements accused of complicity in the vice while the Prevention and Combating of Corruption Act (PCCA) of 2007 is far from effective. The country is enduring weak public service management machinery that is susceptible to corruption and bribery. Tanzania is actually challenged by the inability to break the vicious circle of corruption.
Nevertheless, there are options for Tanzania to curb bribery and corruption. Improving the capacity of civil society and media is considered as one option. Moreover, the Government Ministries, Departments and Agencies (MDAs) may need to establish formal relationships with civil society and media entities, specifically designed to fight corruption and bribery. The enactment of an Access to Information legislation is key in reinforcing accountability of MDAs to the public hence reducing corruption.
Sample characterisationA total of 2,488 respondents were randomly selected across sixteen regions in Tanzania for the survey. The distribution by region is indicated in the table below.
Province Number of respondents Percentage
Arusha 149 6.0
Dar es Salaam 371 14.9
Dodoma 180 7.2
Kagera 219 8.8
Kigoma 139 5.6
Kilimanjaro 140 5.6
Lindi 90 3.6
Manyara 60 2.4
Mbeya 240 9.6
Morogoro 190 7.6
Mtwara 110 4.4
Mwanza 250 10.0
Shinyanga 50 2.0
Singida 120 4.8
Tanga 120 4.8
Zanzibar 60 2.4
Total 2,488 100.0
Table 41: Respondent distribution by region - Tanzania

38T h e E a s t A f r i c a n B r i b e r y I n d e x 2 0 1 4
Aggregate Index
The aggregate index is a composite index resulting from the five different indicators of the survey. It ranges between 0 and 100, with a score of 100 being the worst score. It is a result of the different indicators of the survey, with the final score dependent on how the sector performed in the individual indicator.
The Tanzania Police Force took the top position as the most bribery prone institution in Tanzania with a score of 82.5 compared with 72.9 in 2013. The Judiciary maintained the second position at 41.7 while Tax Services dropped from the third to ninth position and Land Services ascended from position five to three.
Rank Sector 2014 (%) 2013 (%) Variance
1 Police 82.5 72.9 +9.6
2 Judiciary 41.7 38.3 +3.4
3 Land Services 35.7 26.9 +8.8
4 Natural Resources 34.2 - -
5 Registry & Licensing Services 18 21.6 -3.6
6 Utilities (Water & Electricity) 15.6 15.4 +0.2
7 Medical and Health Services 15.2 22.0 -6.8
8 Tax Services 14.4 36.9 -22.5
9 Educational Institutions 12.2 12.5 -0.3
10 Local Government Authorities 12 15.1 -3.1
Table 42: Aggregate index - Tanzania
INDICATOR RANKING
Indicator 1: Likelihood
This indicator measures the likelihood of a respondent being asked or expected to pay a bribe when interacting with a particular sector. It also includes respondents who offered to pay a bribe. It is derived from the number of all bribery situations (demanded, expected, offered) registered in a sector as a proportion of all the interactions registered in that particular sector.
The Tanzania Police Force maintained the lead position in this category as respondents interacting with the Police had a 23% chance of being asked or expected to pay a bribe in order to access a service. The Judiciary moved up one slot with respondents having a 22.8% chance of encountering bribery. This was a slight increase from 20.6% in 2013. A new entrant to the index, the Natural Resources sector, took the fourth position.

39 T h e E a s t A f r i c a n B r i b e r y I n d e x 2 0 1 4
Rank Sector 2014 (%) 2013 (%) Variance
1 Police 23.3 26.0 -2.7
2 Judiciary 22.8 20.6 +2.2
3 Registry & Licensing services 21.9 22.0 -0.1
4 Natural Resources 21.7 - -
5 Land Services 18.0 18.0 0
6 Tax services 13.1 13.6 -0.5
7 Medical and Health Services 12.1 11.1 +1.0
8 Local Government Authorities 11.7 8.7 +3.0
9 Educational Institutions 9.8 8.1 +1.7
10 Utilities (Water & Electricity) 6.2 5.3 +0.9
Table 43: Likelihood of bribery - Tanzania
Indicator 2: Prevalence
This indicator measures the probability that a respondent would pay a bribe upon interacting with a particular sector. It is calculated as the proportion of the number of bribes recorded in a particular sector and the total number of interactions registered in that sector. A higher value indicates the high prevalence of bribery in a sector.
On the probability of actual payment of bribes, the Tanzania Police Force was ranked first at 42.9% with a drop in score from 51.3% in 2013. The Natural Resources sector was second at 29.4% while the Judiciary and Registry and Licensing Services maintained the third and fourth positions respectively. Utilities (water and electricity) maintained the same position and score as in 2013 in this list.
Rank Sector 2014 (%) 2013 (%) Variance
1 Police 42.9 51.3 -8.4
2 Natural Resources 29.4 - -
3 Judiciary 25.1 27.2 -2.1
4 Registry & Licensing Services 19.0 20.8 -1.8
5 Land Services 16.4 18.6 -2.2
6 Local Government Authorities 14.7 11.4 +3.3
7 Medical and Health Services 14.6 18.7 -4.1
8 Tax Services 13.6 41.3 -27.7
9 Educational Institutions 13.0 7.8 +5.2
10 Utilities (Electricity & Water) 5.6 5.6 0
Table 44: Prevalence of bribery - Tanzania

40T h e E a s t A f r i c a n B r i b e r y I n d e x 2 0 1 4
Indicator 3: Average size of bribe
This indicator captures the average amount of bribes paid by respondents while seeking services in a particular sector. It is the arithmetic mean of all bribes paid to a sector, relative to all the respondents that reported paying a bribe to that sector.
The largest average size of bribe paid to sectors mentioned in Tanzania was recorded at Land Services at 111,057 Tanzania Shillings (approximately 67 USD13). In 2013, the top position was taken by Tax Services at Tsh 137,767 (approximately 84 USD), which dropped to position four with an average of Tsh 79,195 (approximately 48 USD). The Judiciary recorded a slight increase this year from Tsh 85,509 (approximately 52 USD) to Tsh 103, 550 (approximately 63 USD).
The least amount of average bribe was recorded at Medical and Health Services at Tsh 28,821.56 (approximately 17 USD).
Rank Sector 2014 (Tsh14) 2013 Variance
1 Land Services 111,057.42 117,553.77 -6,496.35
2 Natural Resources 106,117.65 - -
3 Judiciary 103,550.12 85,509.84 +18,040.28
4 Tax Services 79,195.89 137,767.76 -58,571.87
5 Utilities (Water & Electricity) 77,545.59 59,864.09 +17,681.50
6 Educational Institutions 62,237.39 49,324.11 +12,913.28
7 Police 60,777.35 56,571.64 +4,205.71
8 Local Government Authorities 54,013.61 78,774.31 -24,760.70
9 Registry & Licensing services 40,145.38 46,419.03 -6,273.65
10 Medical and Health Services 28,821.56 29,370.57 -549.01
Table 45: Average size of bribe - Tanzania14
Indicator 4: Share of ‘national’ bribe
This is the proportion of bribes an institution accounts for relative to the total amount of bribes recorded by the survey across all sectors in a particular country. It reflects the proportional culpability of an institution as measured by the amount of bribes received.
A quarter of all the bribes paid in the sectors sampled in the survey were paid to the Tanzania Police Force followed by 18% paid to the Judiciary and 10% paid to the Registry and Licensing Services. Tax Services, Local Government Authorities and Natural Resources all had a share of less than 5%.
13 1 USD = Tsh 1640 14 Tanzania Shillings

41 T h e E a s t A f r i c a n B r i b e r y I n d e x 2 0 1 4
Rank Sector 2014 (%) 2013 (%) Variance
1 Police 25.6 25.1 +0.5
2 Judiciary 18.4 15.8 +2.6
3 Utilities (Water & Electricity) 10.9 9.7 +1.2
4 Land Services 9.6 9.4 +0.2
5 Medical and Health Services 9.3 10.8 -1.5
6 Educational Institutions 9.1 8.0 1.1
7 Registry & Licensing Services 6.1 7.3 -1.2
8 Natural Resources 4.5 - -
9 Local Government Authorities 3.3 5.1 -1.8
10 Tax Services 3.2 7.6 -4.4
Table 46: Share of ‘national’ bribe - Tanzania
Indicator 5: Perceived Impact
This indicator is derived from the respondent’s perception on whether they would have received the services they were seeking if they had not paid a bribe. It brings out the value that the respondents have on the bribes paid as the only way to get services.
Almost half of the respondents that interacted with the Tanzania Police Force felt that they would not have received the services sought if they had not paid a bribe. This was followed by 36.4% that interacted with the Judiciary and 33.6% with Natural Resources who felt the same. Ten percent interacting with utilities (water and electricity) and educational institutions felt that they had to pay a bribe in order to access a service.
Rank Sector 2014 (%) 2013 (%) Variance
1 Police 48.1 52.4 -4.3
2 Judiciary 36.4 38.2 -1.8
3 Natural Resources 33.6 - -
4 Medical and Health Services 21.2 31.0 -9.8
5 Land Services 20.6 25.4 -4.8
6 Tax Services 16.5 25.3 -8.8
7 Registry & Licensing Services 15.9 22.4 -6.5
8 Local Government Authorities 13.6 20.4 -6.8
9 Utilities (Water & Electricity) 10.7 14.8 -4.1
10 Educational Institutions 10.6 12.2 -1.6
Table 47: Perceived impact of bribery - Tanzania
Reasons for paying a bribeThirty eight percent of the respondents that paid bribes while seeking services in Tanzania said they did so to speed up delivery of services. Thirty six percent felt that paying bribes was the only way to access the services. Four percent of the respondents paid a bribe because it was expected. These were the same topmost reasons for paying bribes cited by respondents in 2013.
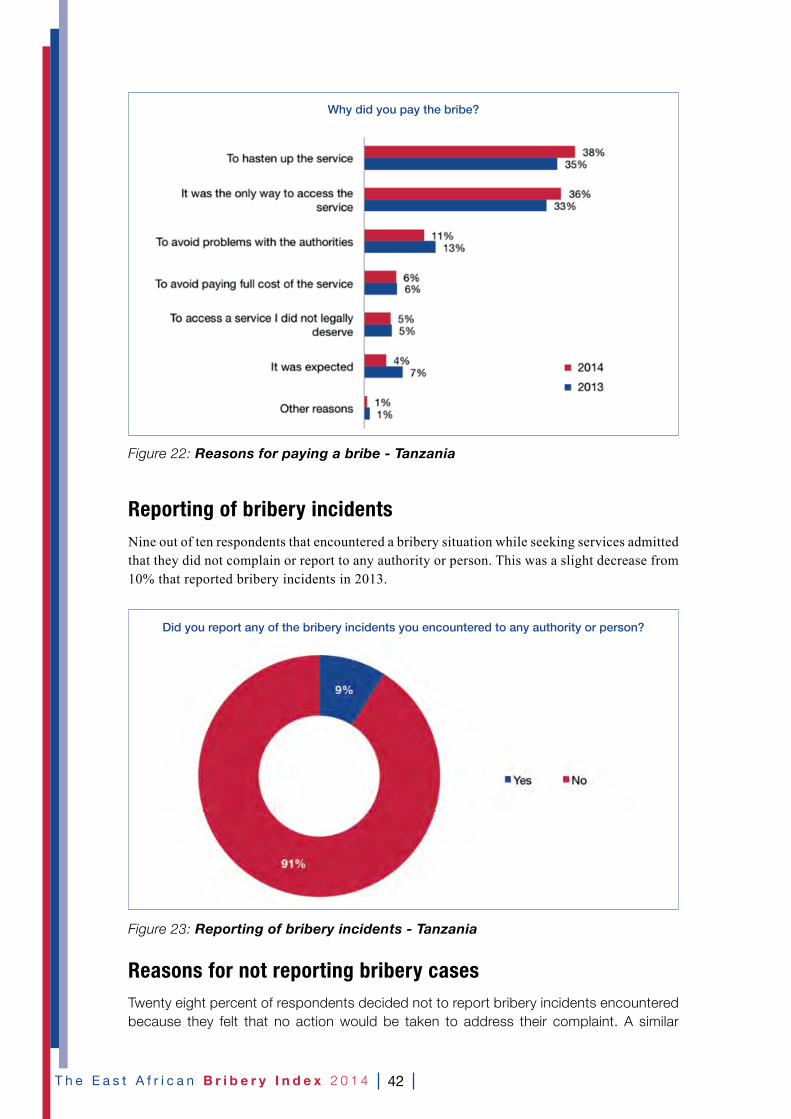
42T h e E a s t A f r i c a n B r i b e r y I n d e x 2 0 1 4
Figure 22: Reasons for paying a bribe - Tanzania
Reporting of bribery incidentsNine out of ten respondents that encountered a bribery situation while seeking services admitted that they did not complain or report to any authority or person. This was a slight decrease from 10% that reported bribery incidents in 2013.
Figure 23: Reporting of bribery incidents - Tanzania
Reasons for not reporting bribery casesTwenty eight percent of respondents decided not to report bribery incidents encountered because they felt that no action would be taken to address their complaint. A similar
Why did you pay the bribe?
Did you report any of the bribery incidents you encountered to any authority or person?

43 T h e E a s t A f r i c a n B r i b e r y I n d e x 2 0 1 4
sentiment expressed by the highest proportion of respondents (37%) in 2013. Other respondents (18%) did not know where to report while the same proportion admitted they were beneficiaries of the transaction and as such did not see the need to report.
Figure 24: Reasons for not reporting bribery cases - Tanzania
CORRUPTION PERCEPTION The survey also sought to establish respondents’ perception towards corruption and the anti-corruption agenda in their countries.
Perceived level of corruptionMajority of the respondents (67.6%) described the current level of corruption in the country as high, 18.3% said it was moderate while 9% said it was low. There was no significant change in this perception compared with 2013.
Figure 25: Perceived current level of corruption - Tanzania
How would you describe the current state of corruption in Tanzania today?
Reasons for not reporting bribery incidences

44T h e E a s t A f r i c a n B r i b e r y I n d e x 2 0 1 4
Perceived change in the level of corruption in Tanzania About half the respondents in Tanzania felt that corruption had increased, with about a third holding the view that it had remained the same. Fifteen percent felt that the level of corruption had decreased. This perceived increase was predicted by half of the respondents in 2013.
Figure 26: Perceived change in the level of corruption - Tanzania
Projected change in the level of corruption Fifty two percent of the respondents did not have a favourable outlook as they felt that corruption would increase in the coming year, while 18% thought it would remain the same. Twenty one percent were positive as they believed that the level of corruption would decrease.
Figure 27: Projected change in the level of corruption - Tanzania
Comparing the current state of corruption with one year ago, would you say corruption has:
Thinking of the next one year, do you think corruption will:

45 T h e E a s t A f r i c a n B r i b e r y I n d e x 2 0 1 4
The main reason given by respondents for the negative future outlook was the observation that no action was taken against corrupt persons hence allowing corruption to thrive (45%). It is noteworthy that 14% projected an increase in corruption because of the general elections to be held in 2015. Other reasons given are highlighted as follows:
Reasons for projected increase in the level of corruption Percent
There is no action taken against corrupt persons 45%
You cannot get a service without paying a bribe 23%
Because of upcoming elections 14%
There is a lot of poverty / High cost of living 11%
Others 7%
Table 48: Reason for projected increase in the level of corruption - Tanzania
Government’s commitment to fight corruption Sixty percent of the respondents in Tanzania felt that their government was not doing enough to fight corruption while 33% felt that the efforts were sufficient.
Figure 28: Government’s commitment to fight corruption - Tanzania
Respondents attributed dissatisfaction with government anti-corruption efforts to lack of visible initiatives among other reasons outlined as follows:
Reasons for dissatisfaction with government anti-corruption efforts Percent
There are no visible anti-corruption efforts 49%
Government officials are the most corrupt and nothing happens to them 36%
You still need to pay a bribe to get a service 15%
Table 49: Reasons for dissatisfaction with government anti-corruption efforts - Tanzania
Do you think the government of Tanzania is doing enough to fight corruption?

46T h e E a s t A f r i c a n B r i b e r y I n d e x 2 0 1 4
Citizens’ efforts in fighting corruption In 2014, the survey sought to establish what citizens had personally done to fight corruption in the past 12 months. Seventy one percent of the respondents admitted that they had not done anything to fight corruption in the period while the rest reported that they raised awareness against bribery (15%), did not receive or give bribes (8%) and reported corruption to the relevant authorities (6%).
What respondents had personally done to fight corruption in the past 12 months
Action taken Percent
I did nothing 71%
I raised awareness against bribery 15%
I didn’t receive or give bribes 8%
I reported to relevant authorities 6%
Table 50: Citizens’ anti-corruption efforts - Tanzania
The most important action to be taken in the fight against corruptionWhen asked the most important action to be taken in the fight against corruption, 37% of the respondents recommended implementation of existing anti-corruption laws while 31% felt that punishment of corrupt officials was the best deterrent measure against the vice.
Actions Percent
Implement the existing anti-corruption laws 37%
Punish corrupt government officials 31%
Create awareness among the citizens 24%
Others 8%
Table 51: The most important action to be taken against corruption - Tanzania

47 T h e E a s t A f r i c a n B r i b e r y I n d e x 2 0 1 4
UGANDA
INTRODUCTION
Key Ugandan public sectors and institutions such as Lands, Police and Judiciary continue to be ranked among the most affected by bribery in the East African Bribery Index. The police play a significant role in maintaining law and order among citizens. However, that role has been marred by claims of bribery (EABI 2013, DTM 2014 ). In 2013, a traffic police officer, Constable Enock Atukunda, was arrested for receiving a UGX 100,000 bribe from a motorist in Kampala while District Police Commander S.P Kavuma was arrested for receiving bribes from fishermen. The case was still in court by the time of publishing this report. These were among the bribery cases reported in the media.
The Judiciary in Uganda has not been spared either. There have been incidents in which judges have been caught receiving bribes at the lower courts, to settle a case out of court or to rule in favour of a particular party. Court clerks are also bribed to direct cases to ‘more favourable’ judges. For instance a chief magistrate was caught red-handed receiving a bribe in Kyazanga-Masaka in 2014. He was arrested and prosecuted.
In the lands sector, an officer in Wakiso District was demoted and transferred over allegations of bribery and extortion while in Oyam District, the District Police Commander was caught receiving UGX 2 million from a group of people seeking the resolution of land issues. He was arrested and referred to an anti-corruption court in Gulu were he was interdicted.
The Government of Uganda has developed appropriate strategies to fight corruption. The challenge lies in their implementation. In 2014, during the 100-year commemoration of Uganda’s Police, the President undertook to improve police welfare. Addressing this will go a long way in minimising corruption in the police force considering the argument that the police demand bribes to supplement poor pay and welfare. The leadership of the police force has undertaken to strengthen the Police Professional Standard Unit that was established and mandated to handle cases of undisciplined officers including bribe takers.
There have been numerous reforms instituted by the Ministry of Lands, Housing and Urban Development. The initiative is geared towards digitising all land titles as a strategy to minimise corruption and address land grabbing.
Some of the political, social and economic trends and events in the country that have had a positive impact on corruption in the past year include:
• Increased media coverage of corruption related cases hence enhancing public participation and awareness.
48T h e E a s t A f r i c a n B r i b e r y I n d e x 2 0 1 4
• The Public Accountability Committee (PAC) in Parliament has been summoning ministries to respond to audit reports on public expenditure with recommendations made accordingly for action.
• Some public institutions have been willing to work jointly with CSOs to address corruption.
• Parliament passed the Anti-Money Laundering Bill 2013 and this was assented to law; it is hoped that the Anti-Corruption Amendment Bill 2013 will be tabled in Parliament for debate and passed into law to further strengthen the anti-corruption regime in the country.
• Increased investigation and prosecution of corruption related cases including high level cases.
• In some areas, citizens have been demonstrating over shoddy work implemented by government agencies, an indication that more Ugandans are exercising their constitutional right to demand for quality services.
Challenges affecting anti-corruption efforts
• The Public Order Management Act 2013 (POMA) provides for the notification and prior vetting of public meetings thus police continuously block rallies, meetings and radio talk shows in various districts in Uganda.
• Citizens have to some extent condoned and glorified the corrupt instead of condemning and ostracising them.
• Implementation of the existing anti-corruption legislation is still weak due to a number of factors including capacity, resources and political interference.
Way forward
• Building partnership between the government and CSOs is paramount in the fight against corruption. This can only be achieved by appreciating each other’s role towards transforming the country.
• Implementation of the existing anti-corruption policies and legislation, and undertaking reviews on the implementation process.
• Civic engagement to increase the public’s appreciation on its role in the fight against corruption.
• Public institutions should dispense their mandate without political interference.
• Continuous anti-corruption research to inform stakeholders is key.
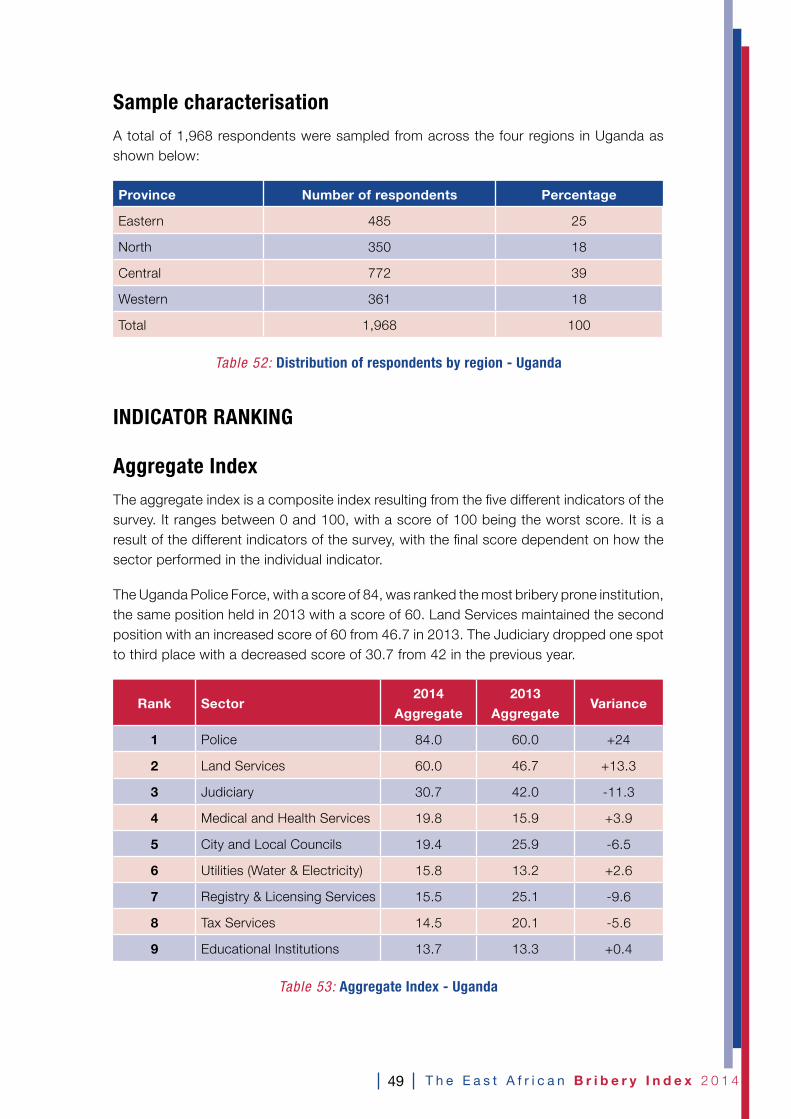
49 T h e E a s t A f r i c a n B r i b e r y I n d e x 2 0 1 4
Sample characterisationA total of 1,968 respondents were sampled from across the four regions in Uganda as shown below:
Province Number of respondents Percentage
Eastern 485 25
North 350 18
Central 772 39
Western 361 18
Total 1,968 100
Table 52: Distribution of respondents by region - Uganda
INDICATOR RANKING
Aggregate IndexThe aggregate index is a composite index resulting from the five different indicators of the survey. It ranges between 0 and 100, with a score of 100 being the worst score. It is a result of the different indicators of the survey, with the final score dependent on how the sector performed in the individual indicator.
The Uganda Police Force, with a score of 84, was ranked the most bribery prone institution, the same position held in 2013 with a score of 60. Land Services maintained the second position with an increased score of 60 from 46.7 in 2013. The Judiciary dropped one spot to third place with a decreased score of 30.7 from 42 in the previous year.
Rank Sector2014
Aggregate
2013
AggregateVariance
1 Police 84.0 60.0 +24
2 Land Services 60.0 46.7 +13.3
3 Judiciary 30.7 42.0 -11.3
4 Medical and Health Services 19.8 15.9 +3.9
5 City and Local Councils 19.4 25.9 -6.5
6 Utilities (Water & Electricity) 15.8 13.2 +2.6
7 Registry & Licensing Services 15.5 25.1 -9.6
8 Tax Services 14.5 20.1 -5.6
9 Educational Institutions 13.7 13.3 +0.4
Table 53: Aggregate Index - Uganda

50T h e E a s t A f r i c a n B r i b e r y I n d e x 2 0 1 4
Indicator 1: LikelihoodThis indicator measures the likelihood of a respondent being asked or expected to pay a bribe when interacting with a particular sector. It also includes respondents who offered to pay a bribe. It is derived from the number of all bribery situations (demanded, expected, offered) registered in a sector as a proportion of all the interactions registered in that particular sector.
The Uganda Police Force rose from position four in 2013 to take the top position in this category with respondents having a 25% likelihood of encountering a bribery incident while seeking services from the Police. Land Services dropped to position two with the bribery likelihood decreasing from 34.8% in 2013 to 22.5% in 2014. City and Local Councils maintained position three but recorded decreased likelihood from 28% to 19.8%.
Rank Sector 2014 (%) 2013 (%) Variance
1 Police 25.6 28.0 -2.4
2 Land Services 22.5 34.8 -12.3
3 City and Local Councils 19.8 28.0 -8.2
4 Registry & Licensing Services 16.9 33.7 -16.8
5 Judiciary 14.1 24.8 -10.7
6 Medical and Health Services 10.5 13.8 -3.3
7 Tax Services 9.7 14.4 -4.7
8 Educational Institutions 5.6 10.4 -4.8
9 Utilities (Water & Electricity) 5.4 8.4 -3
Table 54: Likelihood of bribery - Uganda
Indicator 2: PrevalenceThis indicator measures the probability that a respondent would pay a bribe upon interacting with a particular sector. It is calculated as the proportion of the number of bribes recorded in a particular sector and the total number of interactions registered in that sector. A higher value indicates the high prevalence of bribery in a sector.
The Uganda Police Force recorded the highest probability of respondents actually paying a bribe while seeking a service at 47.9%. They held the same position in 2013, with a similar score. Land Services moved up one spot to take position two with an increased prevalence of 46.5% from 37.7% in the previous year.
Rank Sector 2014 (%) 2013 (%) Variance
1 Police 47.9 47.8 +0.1
2 Land Services 46.5 37.7 +8.8
3 Judiciary 39.8 27.9 +11.9
4 City and Local Councils 36.4 39.1 -2.7
5 Medical and Health Services 22.1 23.4 -1.3
6 Registry & Licensing Services 16.6 30.7 -14.1
7 Utilities (Water & Electricity) 14.0 12.2 +1.8
8 Tax Services 10.7 20.1 -9.4
9 Educational Institutions 7.9 14.4 -6.5
Table 55: Prevalence of bribery - Uganda

51 T h e E a s t A f r i c a n B r i b e r y I n d e x 2 0 1 4
Indicator 3: Average size of bribeThis indicator captures the average amount of bribes paid by respondents while seeking services in a particular sector. It is the arithmetic mean of all bribes paid to a sector, relative to all the respondents reporting having paid a bribe to that sector. Land Services recorded the highest average size of bribe that respondents had to part with to access a service.
Respondents interacting with Land Services reported parting with an average of 550,112.90 Uganda Shillings (approximately USD 21715) to get a service, more than double the amount paid in 2013 (approximately USD 118). The Judiciary, though dropping by two spots, also recorded an increase in the average size of bribe from UGX16 351,003 to 404,448 (USD 134 in 2013 to USD 159).
Rank SectorAverage size
of bribe (UGX) 2014)
Average size of bribe
(UGX) 2013Variance
1 Land Services 550,112.90 218,721.70 +331,391.20
2 Judiciary 404,448.39 351,003.01 +53,445.38
3 Tax Services 242,344.44 272,288.57 -29,944.13
4 Police 108,746.67 89,905.28 +18,841.39
5 Utilities (Water & Electricity) 95,170.67 65,327.42 +29,843.25
6 Educational Institutions 78,290.27 63,811.37 +14,478.90
7 Medical and Health Services 60,634.26 40,895.35 +19,738.91
8 Registry & Licensing Services 59,180.00 65,388.67 -6,208.67
9 City and Local Councils 23,632.70 20,527.12 +3,105.58
Table 56: Average size of bribe - Uganda
Indicator 4: Share of ‘national’ bribeThis is the proportion of bribes a sector accounts for relative to the total amount of bribes recorded by the survey in a particular country. It reflects the proportional culpability of a sector as measured by the amount of bribes received.
The Uganda Police Force received 23.7% of all the bribes reportedly paid followed by Land Services and the Judiciary who took 19.4% and 17.9% of the bribes respectively. Tax Services received the least share of bribes in this list.
Rank Sector 2014 (%) 2013 (%) Variance
1 Police 23.7 27.0 -3.3
2 Land Services 19.4 14.4 +5
3 Judiciary 17.9 18.1 -0.2
4 Medical and Health Services 11.7 9.3 +2.4
5 Utilities (Water & Electricity) 8.9 6.3 +2.6
6 Educational Institutions 7.3 7.7 -0.4
7 City and Local Councils 4.0 5.0 -1
8 Registry & Licensing Services 3.9 6.1 -2.2
9 Tax Services 3.1 5.9 +2.8
Table 57: Share of ‘national’ bribe - Uganda
15 1 USD=2529 Uganda Shillings16 Uganda Shillings

52T h e E a s t A f r i c a n B r i b e r y I n d e x 2 0 1 4
Indicator 5: Perceived ImpactThis indicator is derived from the respondent’s perception on whether they would have received the services they were seeking if they had not paid a bribe. It brings out the value that the respondents have on the bribes paid as the only means to access a service.
Fifty five percent of the respondents interacting with the Uganda Police Force felt that they would not have received the services they were seeking if they had not paid a bribe. This was followed by 41% respondents interacting with Land Services who felt the same. Among the mentioned sectors, educational institutions recorded the least number of respondents who felt they would have been denied a service if they had not paid a bribe.
Rank Sector 2014 (%) 2013 (%) Variance
1 Police 55.6 59.0 -3.4
2 Land Services 41.0 44.3 -3.3
3 Judiciary 37.5 39.9 -2.4
4 City and Local Councils 37.3 43.6 -6.3
5 Medical and Health Services 31.0 27.1 +3.9
6 Utilities (Water & Electricity) 25.2 21.0 +4.2
7 Tax Services 20.2 19.0 +1.2
8 Registry & Licensing Services 15.5 31.3 -15.8
9 Educational Institutions 12.0 17.1 -5.1
Table 58: Perceived impact of bribery - Uganda
Reasons for paying the bribeForty six percent of the respondents said that they paid the bribe because it was the only way to access services, followed by 27% who paid the bribe to expedite the service. In 2013, the highest proportion of the respondents (38%) paid bribes to access services. Five percent admitted to paying bribes to avoid paying the full cost of the service.
Figure 29: Reasons for paying bribes - Uganda
Why did you pay a bribe?

53 T h e E a s t A f r i c a n B r i b e r y I n d e x 2 0 1 4
Reporting of bribery incidentsWhen asked whether they reported or complained about any of the bribery incidents they encountered, 94% said they did not report, while 6% reported. This was a slight decrease from the 7% that reported in 2013.
Figure 30: Reporting of bribery incidents – Uganda
Reasons for not reporting bribery incidentsThirty four percent of respondents in Uganda failed to report the bribery incidents they encountered as they admitted to being beneficiaries of the transaction while 26% felt that no action would be taken to address their complaint. The latter was cited by the highest proportion of respondents (28%) in 2013 as one of the reasons for not reporting bribery.
Figure 31: Reasons for not reporting bribery incidents – Uganda
Did you report any of the bribery incidents you encountered to any authority or person?
Reasons for not reporting bribery incidents

54T h e E a s t A f r i c a n B r i b e r y I n d e x 2 0 1 4
CORRUPTION PERCEPTION The survey also sought to establish respondents’ perception towards corruption and the anti-corruption agenda in their countries.
Perceived level of corruptionEighty two percent of respondents in Uganda described the level of corruption in their country as high with 10% describing it as average and 4% as low. There was no significant change in perception since 2013.
Figure 32: Perceived current level of corruption – Uganda
Perceived change in corruption levels Sixty two percent of the respondents felt that corruption levels in Uganda had increased, while 22% felt that it had remained the same. Thirteen percent felt that corruption levels had decreased. In 2013, 57% of the respondents felt that there would be an increase in the level of corruption in 2014.
Percieved current level of corruption
Comparing the current state of corruption with one year ago, would say corruption has:

55 T h e E a s t A f r i c a n B r i b e r y I n d e x 2 0 1 4
Figure 33: Perceived change in the level of corruption - Uganda
Projected change in the level of corruptionSixty one percent of the respondents had a pessimistic outlook with regard to the level of corruption as they believed that it would increase in 2015. Twelve percent felt that corruption levels would remain the same while 17% felt that corruption levels would decrease.
Figure 34: Projected change in the level of corruption – Uganda
Respondents attributed a projected increase in the level of corruption to rampant greed, poverty and the high cost of living. Other reasons put forward are listed as follows:
Reasons for projected increase in the level of corruption Percent
Corruption and greed is now everywhere in Uganda 44%
Poverty / High cost of living 20%
There are no government strategies and efforts for fighting corruption 19%
There is no change in leadership 10%
Other reasons 7%
Table 59: Reasons for projected increase in the level of corruption - Uganda
Government’s commitment to fight corruption Fifty nine percent of the respondents felt that their government had not taken sufficient measures to fight corruption while 36% were satisfied with the government’s anti-corruption efforts.
In the next one year, do you think the incidents of corruption will:

56T h e E a s t A f r i c a n B r i b e r y I n d e x 2 0 1 4
Figure 35: Government anti-corruption efforts - Uganda
Respondents observed that corruption was still very rampant in government institutions and lack of punishment for corrupt officials were clear indications that the government still needed to invest more effort in the fight against corruption.
Reasons for dissatisfaction with government anti-corruption efforts Percent
Corruption is still rampant in government institutions 55%
Corrupt officials are not punished 22%
Anti-corruption strategies are very weak 16%
Other reasons 7%
Table 60: Reason for dissatisfaction with government anti-corruption efforts - Uganda
Citizens’ efforts in fighting corruption In 2014, the survey sought to establish what citizens had personally done to fight corruption in the preceding 12 months. Seventy one percent reported that they had not done anything while 18% said they had not participated in any corrupt activities.
Actions Percent
I did nothing 71%
I didn’t participate in corrupt activities 18%
I raised awareness against corruption / sensitisation 7%
I reported corruption 4%
Table 61: Citizens’ efforts in fighting corruption - Uganda
Do you think the government of Uganda is doing enough to fight corruption?

57 T h e E a s t A f r i c a n B r i b e r y I n d e x 2 0 1 4
What is the most important action to be taken in the fight against corruption?Thirty two percent of the respondents felt that the best way to fight corruption was to arrest and punish corrupt officials, followed by 25% who felt that civic education was the most important action to be taken to win the war against corruption. Other suggestions are shown in the table as follows:
Recommendation Percent
Arrest and punish the corrupt officials 32%
Civic education / sensitisation on corruption 25%
Make review strict laws to fight corruption 17%
Improve people’s standards of living and civil servants pay 13%
Change the current leadership 12%
Other reasons 1%
Table 62: The most important action to be taken against corruption - Uganda

58T h e E a s t A f r i c a n B r i b e r y I n d e x 2 0 1 4
ANNEX
East Africa Bribery Index 2014 – EA
Interviewer Name (Capital)
Interview date (ddmm)
Start Time (24 hour)
Country Code
Burundi 01
Kenya 02
Rwanda 03
Tanzania 04
Uganda 05
County
Constituency/Sub County
Town Centre/Village
D1. Residence
Rural 1
Urban 2
D2. Gender
Male 1
Female 2
Hello, My name is and I am conducting a survey on behalf of Transparency International. The survey is on bribery and we are interested in your experiences. The interview will not take more than 30 minutes and your responses will be kept completely confidential.
D3. Which of the following age groups do you belong to ?
18 - 29 01
30 - 49 02
50 + 03

59 T h e E a s t A f r i c a n B r i b e r y I n d e x 2 0 1 4
D4. Highest level of education attained
Primary School Only 01
Secondary School 02
Tertiary training 03
Informal education / No formal Education 04
D5. Employment status
Student 01
Unemployed 02
Self-employed /Employed in family business or farm 03
Employed in Private sector 04
Employed by Government /Local Authority /Parastatal 05
Employed in community sector eg church, NGO 06
Retired 07
D6. Personal Income (USD) Per MonthD7. Household Income (USD)
Per Month
Less than 62 USD 01 Less than 62 USD 01
62-186 USD 02 62-186 USD 02
186-620 USD 03 186-620 USD 03
620-12400 USD 04 620-12400 USD 04
Above 1240 USD 05 Above 1240 USD 05
Q1.0 Please tell me which of the following public institutions you have visited/ interacted with personally in the last 12 months, looking for services. Rotate Mentions
1.2 How many times did you interact with these institutions in the last 12 months? (record numerically)
Institution category Institution type1.2 Number of
interactions
1. Educational institutions - schools, colleges, university
ECDE
Primary
Secondary
Technical /vocational training
University
2. Judiciary
3. Medical and Health services

60T h e E a s t A f r i c a n B r i b e r y I n d e x 2 0 1 4
4. Police
Regular
AP- Administration Police
CID
Traffic Police
5. Registry and licensing services (civil registry for birth, marriage, death, business licensing, ID and passport issuance)
Civil Registration
Business Licensing
6. Utilities (Electricity & Water,)Water
Electricity
7. Tax Services (VAT, Customs, Motor Vehicle Licenses etc)
8. Land Services (Buying, Selling, Inheriting, Leasing)
9. City and Local councils
10. Other (Please specify )
Q2.0 When visiting these organisations/institutions/offices, did you encounter any bribery incidents? (interviewer explain to respondent the demanded / expected / offered variables)
Demanded (Explicitly asked) 01 Go to Q 2.1
Expected (Implicitly asked) 02 Go to Q 2.1
Offered 03 Go to Q 2.1
None - Not demanded / expected or offered 04 Go to Q 4.0
Institution category Institution typeBribe demand/
Expectation
1. Educational institutions - schools, colleges, university
Primary 01 02 03 04
Secondary 01 02 03 04
Technical /vocational training 01 02 03 04
University 01 02 03 04
2. Judiciary 01 02 03 04
3. Medical and Health services 01 02 03 04
4. Police
01 02 03 04
01 02 03 04
01 02 03 04
01 02 03 04
5. Registry and licensing services (civil registry for birth, marriage, death, business licensing, ID and passport issuance)
Civil Registration 01 02 03 04
Business Licensing 01 02 03 04

61 T h e E a s t A f r i c a n B r i b e r y I n d e x 2 0 1 4
6. Utilities (Water and Electircity)Water 01 02 03 04
Electricity 01 02 03 04
7. Tax Services (VAT, Customs, Motor Vehicle licenses) 01 02 03 04
8. Land Services (Buying, Selling, Inheriting, Leasing) 01 02 03 04
9. City and Local councils 01 02 03 04
10. Other (Please specify) 01 02 03 04
Q2.1 Did you pay the bribe?
Q2.2 Please tell me the number of times you paid a bribe in the last 12 months in each institution
Q2.3 Please tell me the total amount you paid in the last 12 months in each institution
Institution category Institution type
2.1 Bribe Payment
2.2 Number of times bribe was paid
2.3 Total amount of bribes paid in 12 months
Yes No
1. Educational institutions - schools, colleges, university
Primary 01 02
Secondary 01 02
Technical /vocational training 01 02
University 01 02
2. Judiciary 01 02
3. Medical and Health services 01 02
4. Police
01 02
01 02
01 02
01 02
5. Registry and licensing services (civil registry for birth, marriage, death, business licensing, ID and passport issuance
Civil Registration 01 02
Business Licensing 01 02
6. Utilities (Electricity & Water)
Water 01 02
Electricity 01 02
7. Tax Services (VAT, Customs, Motor Vehicle licenses) 01 02
8. Land Services (Buying, Selling, Inheriting, Leasing) 01 02

62T h e E a s t A f r i c a n B r i b e r y I n d e x 2 0 1 4
9. City and Local councils 01 02
10. Other (Please specify) 01 02
Q2.4 (For those who did not pay) Did you get the service after failing to pay the bribe?
Institution category Institution typeService Access
Yes No
1. Educational institutions-schools, colleges, university
Primary 01 02
Secondary 01 02
Technical /vocational training 01 02
University 01 02
2. Judiciary 01 02
3. Medical and Health services 01 02
4. Police
01 02
01 02
01 02
01 02
5. Registry and licensing services (civil registry for birth, marriage, death, business licensing, ID and passport issuance
Civil Registration 01 02
Business Licensing 01 02
6. Utilities (Electricity & Water) Water 01 02
Electricity 01 02
7. Tax Services (VAT, Customs, Motor Vehicle licenses) 01 02
8. Land Services (Buying, Selling, Inheriting, Leasing) 01 02
9. City and Local councils 01 02
10. Other (Please specify) 01 02
Q2.4.1 (For those who did not pay), how satisfied were you with the service after failing to pay the bribe
SatisfiedNeither Satisfied Nor
DissatisfiedDissatisfied
01 02 03
Q 2.5 (For those who paid) What was the reason why you paid bribe ?

63 T h e E a s t A f r i c a n B r i b e r y I n d e x 2 0 1 4
Institution category Institution typeReason for
Paying Bribes
1. Educational institutions - schools, colleges, university
Primary
Secondary
Technical/vocational training
University
2. Judiciary
3. Medical and Health services
4. Police
5. Registry and licensing services (civil registry for birth, marriage, death, business licensing, ID and passport issuance)
Civil Registration
Business Licensing
6. Utilities (Electricity & Water)Water
Electricity
7. Tax Services (VAT, Customs, Motor Vehicle licenses)
8. Land Services (Buying, Selling, Inheriting, Leasing)
9. City and Local councils
10. Other (Please specify)
Q 2.6 (For those who paid) Do you think you would have received service if you had not paid the bribe?
Institution category Institution type
Service after bribe payment
Yes No
1. Educational institutions - schools, colleges, university
Primary 01 02
Secondary 01 02
Technical/vocational training 01 02
University 01 02
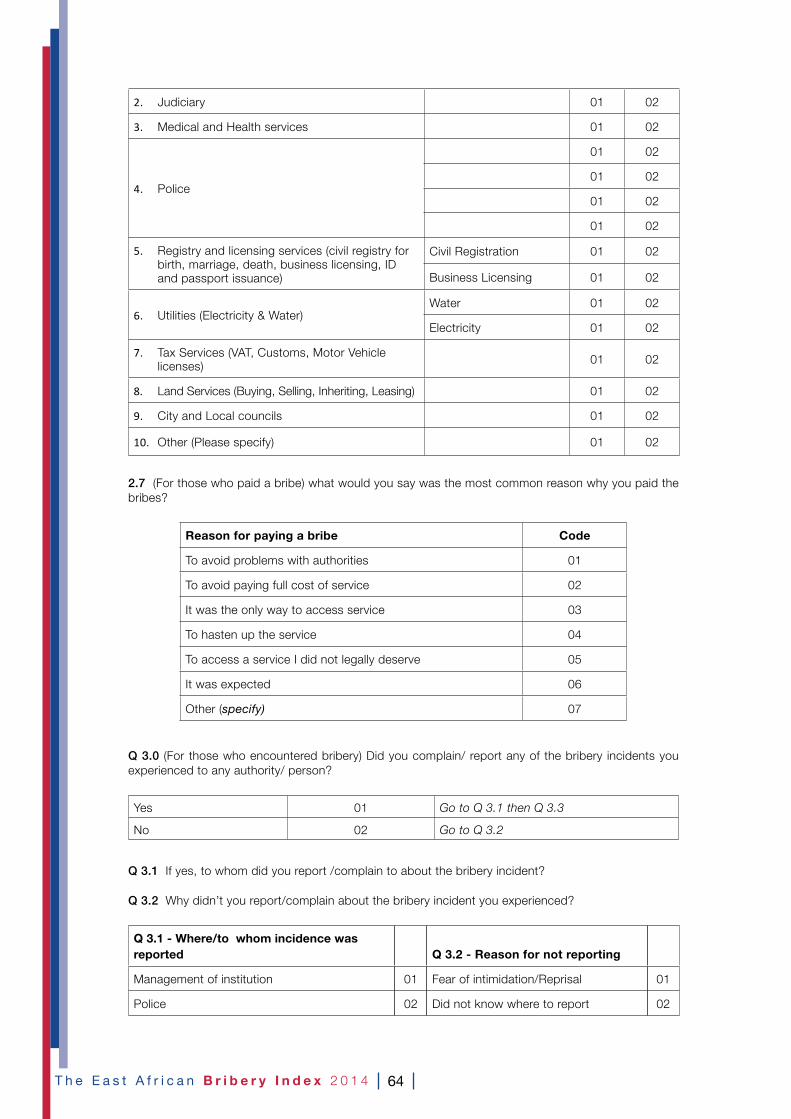
64T h e E a s t A f r i c a n B r i b e r y I n d e x 2 0 1 4
2. Judiciary 01 02
3. Medical and Health services 01 02
4. Police
01 02
01 02
01 02
01 02
5. Registry and licensing services (civil registry for birth, marriage, death, business licensing, ID and passport issuance)
Civil Registration 01 02
Business Licensing 01 02
6. Utilities (Electricity & Water)Water 01 02
Electricity 01 02
7. Tax Services (VAT, Customs, Motor Vehicle licenses) 01 02
8. Land Services (Buying, Selling, Inheriting, Leasing) 01 02
9. City and Local councils 01 02
10. Other (Please specify) 01 02
2.7 (For those who paid a bribe) what would you say was the most common reason why you paid the bribes?
Reason for paying a bribe Code
To avoid problems with authorities 01
To avoid paying full cost of service 02
It was the only way to access service 03
To hasten up the service 04
To access a service I did not legally deserve 05
It was expected 06
Other (specify) 07
Q 3.0 (For those who encountered bribery) Did you complain/ report any of the bribery incidents you experienced to any authority/ person?
Yes 01 Go to Q 3.1 then Q 3.3
No 02 Go to Q 3.2
Q 3.1 If yes, to whom did you report /complain to about the bribery incident?
Q 3.2 Why didn’t you report/complain about the bribery incident you experienced?
Q 3.1 - Where/to whom incidence was reported Q 3.2 - Reason for not reporting
Management of institution 01 Fear of intimidation/Reprisal 01
Police 02 Did not know where to report 02

65 T h e E a s t A f r i c a n B r i b e r y I n d e x 2 0 1 4
Media 03I knew no action would be taken even if I reported
03
MP/Chief /MCA 04 Fear of self incrimination 04
Religious leader 05It did not occur to me that I should report
05
Anti corruption authority (Specify) 06 I was a beneficiary 06
NGOs / CSOs 07 The place to report was inaccessible/far 07
Other (specify) 08 Other (specify) 08
Q 3.3 How satisfied were you with the action taken after you reported the incident?
Satisfied Dissatisfied No action was taken at all
01 02 03
I am now going to ask you about corruption and your perceptions about corruption in (Insert your country)
Q 4.0 How would you describe the current state of corruption in Your country today?
Low Medium High Don’t Know NR
01 02 03 04 98
Q 4.1 Comparing the current state of corruption in Your country with one year ago, would you say corruption has:
Increased Remained the same Decreased Don’t Know NR
01 02 03 04 99
Q4.2 Thinking about the next one year, do you think the incidence of corruption in Your country will:
Increase Remain the same Decrease Don’t Know NR
01 02 03 04 99
Q4.3 Why do you say so?
..............................………………..............................................................................…………………………………
..............................………………..............................................................................…………………………………
Q 4.3 In your view, do you think the government of Your country is doing enough to fight corruption in the country?
Yes No Don’t Know NR
01 02 03 99

66T h e E a s t A f r i c a n B r i b e r y I n d e x 2 0 1 4
Q4.5 Why do you say so?
..............................………………..............................................................................…………………………………
..............................………………..............................................................................…………………………………
..............................………………..............................................................................…………………………………
5. What have you personally done to fight corruption in the past 12 months ?
..............................………………..............................................................................…………………………………
..............................………………..............................................................................…………………………………
..............................………………..............................................................................…………………………………
6. What do you think is the most important thing to be done in the fight against corruption?
..............................………………..............................................................................…………………………………
..............................………………..............................................................................…………………………………
..............................………………..............................................................................…………………………………
Respondent details – THIS PAGE WILL BE TORN OFF
Thank you very much for your time. You have given us a lot of useful information. Occassionally my
supervisor contacts people to see how the survey went. For this purpose, would you please fill in the
following details?
Name
Telephone Number
Interviewer Declaration: I certify that this interview has been personally carried out by me with
the correct respondent. I further declare that all the information is truthful and as told to me by
the respondent. I understand that any discrepancy discovered during back-checking of this
questionnaire will result in the cancellation of this interview.
……………………………………………………………..(Signed)
Stop time (24 Hour)
67 T h e E a s t A f r i c a n B r i b e r y I n d e x 2 0 1 4
FOR SUPERVISOR’S USE :
Quality Control…(Do not ask this question)
ACCOMPANIED 1
SPOT CHECKED 2
PHYSICAL BACK-CHECK 3
TELEPHONE BACK-CHECK 4
Name..............................……………….................................................................................……………………
Signature………..............................................................................…………………...................................……
Date………..............................................................................………………………

For advice on corruption related cases contact the Advocacy and Legal Advisory Centres (ALAC):
KenyaALAC MOMBASA
Ujamaa Center 1st Floor, Simba Road Off Links Road, Nyali, Mombasa
Opposite Kilima GardensMOBILE NUMBER: 0728418822
EMAIL: [email protected]
ALAC ELDORETP.O BOX 842-30100, Eldoret
Catholic Diocese of Eldoret, Uganda Road, Eldoret TEL: +254 53 2033100
MOBILE NUMBER: 0704 899887EMAIL: [email protected]
ALAC NAIROBIP.O. Box 198-00100, Nairobi
Jameson Court, Block D4 Ngong Road
TEL: +254 20 3864230MOBILE NUMBER: 0701471575EMAIL: [email protected]
ALAC WESTERNP.O.BOX 3560-40100,
RIAT along Kisumu-Kakamega Road, Kisumu MOBILE NUMBER: 0716900227EMAIL: [email protected]
RWANDA
Eastern Province Kayonza District
TEL: +250-788387088 Southern Province
Huye District TEL: +250-788387087
Northern Province Musanze District
TEL: +250-0788387090 Western Province
Rubavu District TEL: +250-788387092
Rusizi District TEL: +250-788539345
BURUNDI CAJAC - Centre D’assistance Juridique Et D’action Citoyenne
Avenue du 28 Novembre No 4611/C, Bujumbura TEL: +257- 22 23 76 86
EMAIL: [email protected]


![Index [assets.cambridge.org]assets.cambridge.org/97805218/85041/index/9780521885041_index… · African Book Without a Name, The, Fu-Kiau, K. Kia Bunseki 12 African Methodist Episcopal](https://static.fdocuments.us/doc/165x107/612e64751ecc51586942c8d2/index-african-book-without-a-name-the-fu-kiau-k-kia-bunseki-12-african-methodist.jpg)