Easing the burden of COVID-19 in Uganda
13
Ideas for growth www.theigc.org Easing the burden of COVID-19 in Uganda Lowering food prices by reducing tariffs Policy Note UGA-IH-025 | May 2020 Jakob Rauschendorfer • This note explores a measure to ease economic pressure from COVID-19 in Uganda: the elimination of high import tariffs on four important agricultural products, rice, vegetable oil, sugar and wheat/wheat flour. • Using a dataset on household income derived from as well as expenditure on agricultural products, the researcher estimates that eliminating tariffs on these four items would increase average real household income by up to 1.3 percent. Taking into account imperfect price pass-through of tariff cuts, this figure translates into economy wide gains of around $59 million per year in the form of higher household incomes. • These gains from liberalisation stand against fiscal losses of around $17 million per year from duty revenues foregone that could be offset with higher tariffs on goods that are predominantly consumed by wealthy Ugandans. • In light of these results, Uganda could consider implementing zero tariffs on rice, vegetable oil, sugar and wheat/wheat flour through Stays of Application from the Common External Tariff of the East African Community. In brief This project was funded by IGC Uganda
Transcript of Easing the burden of COVID-19 in Uganda

Ideas for growth www.theigc.org
Easing the burden of COVID-19 in Uganda Lowering food prices by reducing tariffs
Policy Note UGA-IH-025 | May 2020
Jakob Rauschendorfer
• This note explores a measure to ease economic
pressure from COVID-19 in Uganda: the elimination of high import tariffs on four important agricultural products, rice, vegetable oil, sugar and wheat/wheat flour.
• Using a dataset on household income derived from as
well as expenditure on agricultural products, the researcher estimates that eliminating tariffs on these four items would increase average real household income by up to 1.3 percent. Taking into account imperfect price pass-through of tariff cuts, this figure translates into economy wide gains of around $59 million per year in the form of higher household incomes.
• These gains from liberalisation stand against fiscal
losses of around $17 million per year from duty revenues foregone that could be offset with higher tariffs on goods that are predominantly consumed by wealthy Ugandans.
• In light of these results, Uganda could consider implementing zero tariffs on rice, vegetable oil, sugar and wheat/wheat flour through Stays of Application from the Common External Tariff of the East African Community.
In brief This project was funded by IGC Uganda

Policy Note | May 2020 International Growth Centre 2
Introduction 1 The economic ramifications of COVID-19 in Uganda are severe and likely to be long lasting. While the IMF still expects the economy to grow by 3.5% in 2020, this is a sharp fall compared to 2019 when economic growth was at 4.9% (IMF 2020: 18). With a population growth rate of 3.7% from 2017 to 2018 (World Bank 2020), economic growth at this pace will result in declining or stagnating incomes in the short- to medium-term. In this note, I explore a measure to ease the economic pressure on Ugandan households arising from the pandemic, the elimination of import tariffs on four important food items: rice, vegetable oil, sugar, and wheat/wheat flour. All items share four characteristics that make them a suitable choice for (temporary) tariff reductions:
• Import tariffs on these products are high and sometimes prohibitively so. For example, rice, when imported from outside the East African Community (EAC), is subject to a 75% ad valorem tariff or $345/metric ton, whichever is higher;
• The products are consumed by most Ugandan households; • Most Ugandans do not derive income from the production of these products, so that a decline
in domestic prices due to tariff liberalisation is unlikely to result in significant income losses;2 • Local production is insufficient to meet domestic demand: Uganda is a net importer of these
products.3
Liberalising tariffs should incentivise the private sector to import these products in larger volumes and lead to lower consumer prices, which in turn would increase real household incomes. To analytically assess the costs and benefits of removing tariffs, I employ a dataset that combines information on Ugandan household spending on and income derived from 53 agricultural items with product-level data on import tariffs. I use this dataset to analyse the impact of eliminating tariffs on the real income of Ugandan households. I estimate that economy wide income gains from tariff liberalisation would be around $59 million per year, taking into account imperfect price pass-through of tariff cuts. In a second step I use Ugandan customs data that allow me to directly observe the revenues Uganda generates from taxing imports. Fiscal losses from completely eliminating all tariffs on the four agricultural items under review would amount to about $17 million, but could be offset with higher tariffs on imports that are predominantly consumed by wealthy Ugandans. The policy implication following from this analysis is that government has at its disposal a stroke-of-the-pen policy response to declining incomes. Uganda could implement zero tariffs on these goods by applying for Stays of Application from the EAC Common External Tariff (CET), at least for the duration of the crisis. This could be done quickly and comes at zero logistical implementation cost. Once approved, new tariff rates can be implemented by the Uganda Revenue Authority instantaneously. It is important to note that as a policy target, tariff reductions are not unrealistic and common practice even in normal times. In the current financial year 2019/20, Uganda has implemented a total of 309 Stays of Application from the CET and in the past the government already used this mechanism to lower tariffs for some of the products I suggest. For example, in 2017, Uganda removed the 75% tariff on rice for the duration of four months allowing Ugandan millers to import up to 5,000 metric tons each as a response to increasing prices domestically (FAO 2017). Currently, the country implements a tariff of 10% for hard wheat instead of the regular CET rate of 35%. It is also important to note that both Kenya and Rwanda, other members of the EAC Customs Union, currently import rice at 35 and 45%,
1 The author can be reached at [email protected] and would like to thank Paul Brenton, Martin Fowler, Priya Manwaring, Richard Newfarmer, John Spray and Anna Twum for helpful comments and Bob Rijkers for help with the data and modelling. 2 This is the reason why I for example exclude maize despite this product being subject to a tariff of 50% in the CET. Uganda is a major exporter of maize to the region (ca. 460 metric tons in 2018 according to UNComtrade (2020)) and many Ugandans earn income from the crop. 3 The exception is sugar for which Uganda is a net exporter to the EAC. However, the current tariff of 100% ad valorem may simply be prohibitive. Indeed, in the Ugandan customs data I use in this note I find that most sugar is imported under a scheme for “industrial use”.

Policy Note | May 2020 International Growth Centre 3
respectively (cf. EAC 2019: 3). This is a strong indicator that such tariff reductions would find approval at the regional level without undermining cohesion in the EAC. The remainder of this note is organised as follows. Section two provides a brief background on imports and import tariffs in Uganda. Section three estimates consumption gains and income losses from removing tariffs on the four suggested agricultural products. Section four calculates the fiscal losses from tariff liberalisation and section five concludes.
A brief background on imports and import tariffs in Uganda Uganda is a member of the customs union of the East African Community (EAC). Established by Kenya, Uganda, and Tanzania in 2005, and with Rwanda and Burundi joining in 2007, trade between EAC members is tariff and quota free. Imports originating from outside the EAC are subject to the union’s Common External Tariff (CET) regime, which sets product specific tariffs for about 5,600 products (also referred to as tariff lines). Almost all of Uganda’s imports entering the country from outside of the EAC are subject to the CET.3 The common tariff regime consists of a regular three band system (0% for raw materials, 10% for intermediate inputs, and 25% for final goods) as well as a List of Sensitive Items assigning rates of protection of 35% or higher to a small number of items. While EAC members are bound by the rates of the CET, individual countries can deviate from the common tariff regime through Stays of Applications – countrywide, product specific deviations from the CET that are granted by the EAC Council of Ministers for specified time periods (normally one year).4 In Table 1, I employ transaction level customs data from the Uganda Revenue Authority (URA) for the 2018/19 financial year and show the value of imports of the four agricultural products put forward for tariff liberalisation in this note: rice, vegetable oil, sugar and wheat/wheat flour. Together, the four products accounted for roughly 4.3% of Uganda’s overall import volume in 2018/19. Per each product I also present the share of imports that originates tariff free from other EAC members, as well as the share that is sourced from countries outside the union and to which the rates of the CET apply. With the exception of vegetable oil, all products attract sizeable tariffs, with the ones on rice and sugar being extremely high.
Value of imports
Share originating from within the EAC
Share originating from outside the
EAC
Nominal CET rate
Rice 94,200 63% 37% 75 % * Sugar 38,920 15% 85% 100 % ** Vegetable oil 557,979 2% 98% 1.50 % Wheat/wheat flour 444,903 0% 100% 10 % Total 1,136,002 Notes: Value of imports in ‘000 000 Uganda Shilling. *For rice the tariff in the CET is 75% or $345/MT whichever is higher. **For sugar, the rate in the CET is 100% or $460/MT whichever is higher. In both cases I use the ad valorem value for the analysis. For wheat/wheat flour and vegetable oil, there is variation in CET tariff rates for the individual tariff lines assigned to the two products (see annexe to this note). I therefore calculate average tariff rates for these two items where I weigh tariff rates on individual tariff lines by their respective import volumes from outside the EAC.
3 Lower tariffs apply for imports originating from members of the COMESA Free Trade Area of which Uganda is a member. However, COMESA members that are not also EAC members (Burundi, Kenya, and Rwanda) contributed far less than 1% of all of Uganda’s imports in 2018/19. I therefore drop these countries from the analysis for simplicity. 4 An example for a gazetted Stay of Application is as follows: Tariff line 1006.10.00 (“Rice in the husk”): Kenya to stay of application of EAC CET rate of 75% or $345/MT whichever is higher and apply a duty rate of 35% or $200/MT whichever is higher for one year (EAC 2019: 3).
Table 1: Import volumes, origins and nominal tariff rates of targeted products, 2018/19

Policy Note | May 2020 International Growth Centre 4
The gains from liberalising: Higher real incomes through lower cost of consumption What is the impact of eliminating import tariffs on the four suggested products on Ugandan households? Tariff reductions decrease the domestic price of agricultural goods and therefore impact households as consumers on the one hand and as producers and wage earners on the other. In an agriculture-based economy like Uganda, many households will typically benefit from agricultural tariff reductions in the form of lower prices for consumption. However, they may also suffer income losses due to lower prices for products they produce, either as farmers or through earning a wage in a production process (cf. Artuc et al. 2020: 2). A related consideration is that effects of tariff liberalisation are likely to differ by household income. As households get richer the share of income spent on food items decreases and wages become a more important source of income (Artuc et al. 2020: 7 – 8). To empirically assess the impact of tariff reductions on Ugandan households, I employ a novel dataset that combines two types of data. First, Ugandan household data detailing household income derived from, spending on as well as auto-consumption, of 53 agricultural items. The data are aggregated and offer such income and expenditure shares for each percentile of the Ugandan income distribution. The second component of the data set is tariffs at the product level.5 In a first step, it is illustrative to employ this data to explore the validity of one of the assumptions laid out in the introduction of this note, namely that the majority of Ugandans do not derive significant income from the production of rice, vegetable oil, sugar and wheat/wheat flour. If this is the case, a decline in domestic prices due to tariff cuts is unlikely to result in significant income losses. Figure 1 shows (for each percentile of the Ugandan income distribution) the share of households’ income derived from and expenditure on the four products included in this analysis. While there is variation of expenditure shares on these four products along the income distribution, households generally do not generate significant income from their production.
5 This Household Impact of Tariffs (HIT) data set was developed by Artuc et al. (2020) who standardise household expenditure and consumption data for 54 low- and middle-income countries and combine the result with country specific tariffs. I update the tariff data by combining the EAC-CET schedule with Uganda’s 309 Stays of Applications from CET in financial year 2019/20. The annex to this note shows how I map individual tariff lines to the four products considered in this note. Regarding household data, HIT uses information on income and expenditure of 7,350 households surveyed in Uganda’s National Household Survey 2005/2006. Given significant changes in the structure of the Ugandan economy as well as dietary shifts, the size of estimated effects in this note should be interpreted with caution. However, crucial figures like the share of household expenditure spent on the category food, drink, and tobacco have remained remarkably constant over the years. The Uganda National Household Survey 2005/2006 reports a Ugandan average of 44.8% of expenditure for these items (cf. UBOS 2014: 82), while the Uganda National Household Survey 2016/17 presents a combined share in household expenditure of 46.7% for the categories food and non-alcoholic beverages and alcoholic beverages, tobacco, and narcotics (UBOS 2018: 86).

Policy Note | May 2020 International Growth Centre 5
I next explore the household impact of eliminating import tariffs on the four products. When considering Ugandan tariff changes, it is important to be aware that goods from other EAC members are imported tariff-free into Uganda, while imports originating from outside of the EAC are subject to CET rates. Reducing all tariffs to zero is therefore equal to a scenario in which Uganda unilaterally deviates from the CET and implements zero tariffs for the four products.6 I obtain estimates for the first-order effects of these tariff eliminations on household welfare by following the steps laid out in Artuc et al. (2020: 9-11):
• Compute the effect of tariff elimination on domestic prices; • Calculate the change of a household’s real income as the sum of the (negative) change in
income stemming from lower prices for goods sold and the (positive) change of a household’s consumption due to the price reduction. When a tariff cut takes place, net-producers of a good suffer, while net-consumers of a good benefit from a lower price of the product (Artuc et al. 2020: 11).7
I perform these steps for removing tariffs on all four agricultural products considered in this note and 6 In my estimation I take into account that a significant share of imports is sourced tariff-free from other EAC members. Simulating an elimination of CET rates would therefore misrepresent the tariff Ugandan importers actually face for any given product. To illustrate this, in the 2018/19 financial year, Uganda imported rice valued 94 billion Uganda Shilling of which about 60% originated tariff-free from the EAC (Tanzania, notably). Simply simulating a reduction of the rice tariff by 75% would ignore that for some important origin countries, namely the EAC members, the tariff is already zero. For each of the four products I therefore employ trade-weighted averages of the nominal rates in the CET and the zero rates for imports originating from the EAC. For rice this reduces the tariff on imports from 75% (CET-rate) to 28%, which is the value I eliminate in the simulation. 7 It should be noted that this set-up only captures first-order effects of tariff changes on households. I do not consider changes in household income due to changing production patterns such as higher production of processed foods due to lower sugar prices. Similarly, I do not consider changes in consumption patterns, for example consumers substituting an item in their consumption basket with rice as this product becomes cheaper (cf. Artuc et al. (2020): 9-11 for an exposition).
Notes: “Income share” is the share of a household’s income generated from partaking in the production of rice, vegetable oil, sugar, and wheat/wheat flour. “Expenditure share” is the share of household expenditure spent on these items. Own illustration using the Household Impact of Tariffs (HIT) data set developed by Artuc et al. (2020).
Figure 1: The four agricultural products are not a major source of income for Ugandans
Policy Note | May 2020 International Growth Centre 6
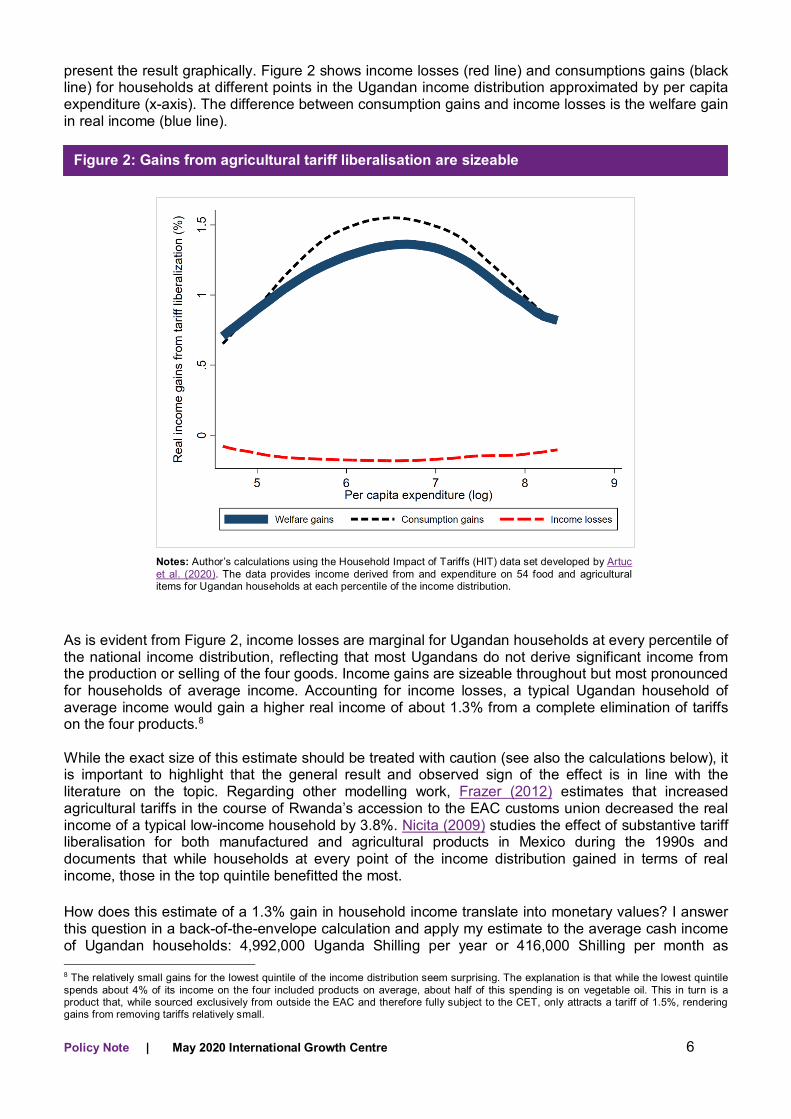
present the result graphically. Figure 2 shows income losses (red line) and consumptions gains (black line) for households at different points in the Ugandan income distribution approximated by per capita expenditure (x-axis). The difference between consumption gains and income losses is the welfare gain in real income (blue line).
As is evident from Figure 2, income losses are marginal for Ugandan households at every percentile of the national income distribution, reflecting that most Ugandans do not derive significant income from the production or selling of the four goods. Income gains are sizeable throughout but most pronounced for households of average income. Accounting for income losses, a typical Ugandan household of average income would gain a higher real income of about 1.3% from a complete elimination of tariffs on the four products.8 While the exact size of this estimate should be treated with caution (see also the calculations below), it is important to highlight that the general result and observed sign of the effect is in line with the literature on the topic. Regarding other modelling work, Frazer (2012) estimates that increased agricultural tariffs in the course of Rwanda’s accession to the EAC customs union decreased the real income of a typical low-income household by 3.8%. Nicita (2009) studies the effect of substantive tariff liberalisation for both manufactured and agricultural products in Mexico during the 1990s and documents that while households at every point of the income distribution gained in terms of real income, those in the top quintile benefitted the most. How does this estimate of a 1.3% gain in household income translate into monetary values? I answer this question in a back-of-the-envelope calculation and apply my estimate to the average cash income of Ugandan households: 4,992,000 Uganda Shilling per year or 416,000 Shilling per month as 8 The relatively small gains for the lowest quintile of the income distribution seem surprising. The explanation is that while the lowest quintile spends about 4% of its income on the four included products on average, about half of this spending is on vegetable oil. This in turn is a product that, while sourced exclusively from outside the EAC and therefore fully subject to the CET, only attracts a tariff of 1.5%, rendering gains from removing tariffs relatively small.
Notes: Author’s calculations using the Household Impact of Tariffs (HIT) data set developed by Artuc et al. (2020). The data provides income derived from and expenditure on 54 food and agricultural items for Ugandan households at each percentile of the income distribution.
Figure 2: Gains from agricultural tariff liberalisation are sizeable

Policy Note | May 2020 International Growth Centre 7
presented in the Ugandan National Household Survey 2016/17 (UBOS 2018: 109). This gives an annual income gain per household of 64,900 Shilling (approximately $17). Since the official number of Ugandan households is 8.5 million (UBOS 2018: 149), this 1.3% gain implies economy wide gains of 551.62 Billion Uganda Shilling per year from liberalising tariffs on the suggested products (about $146 million). An issue with this estimate is that it assumes perfect pass-through of tariffs changes to consumer prices faced by households. This is an unrealistic assumption as tariff changes will have to “work through” the domestic market. The impact of tariff changes on domestic consumer prices will be reduced due to a variety of factors such as mark-ups charged by middlemen or low levels of competition in final goods markets (cf. Nicita 2009: 21). While no estimates for pass-through elasticities of tariff changes to domestic prices are available for Uganda, it is still sensible to repeat the calculation with estimated pass-through elasticities from a different country setting. I therefore recalculate the estimated effect with the pass-through coefficients of tariff changes provided in Marchand (2012) for India, which are found to be significantly lower for rural areas.9 Incorporating these elasticities into the calculation yields estimated economy wide gains of 278.66 billion Uganda Shilling or approximately $59 million per year, with about $24 million accruing to Uganda’s 2.13 million urban households. Beyond the sizeable monetary benefits of liberalising tariffs on these items, it should be noted that there are important non-financial benefits of improved food supply and lower prices, such as higher nutritional levels, lower stunting rates among children, and lower risk of civil unrest especially in urban areas.
Fiscal losses from agricultural tariff liberalisation would be small A major concern regarding trade liberalisation in any least developed country context is that trade taxes are a major source of tax revenue. According to the Uganda Revenue Authority, in financial year 2018/19, the country collected 16,617 billion Uganda Shilling in net revenue, of which 6,875 billion (ca. 41%) was collected from taxing trade (URA 2019: 1-4).10 As all four commodities considered in this brief are subject to sizeable tariffs, it is therefore important to contrast the potential benefits of liberalisation with its fiscal costs, in the form of revenues foregone. To explore this issue, I again employ Ugandan transaction level customs data for 2018/19. The data show tax revenues collected on each individual import shipment under three different tax heads: duties (i.e. revenue from tariffs), VAT on imports, and revenue from the withholding tax.11 Table 2 shows tax figures for each of the four products under review.
9 I take the least favourable estimates for pass-through of tariffs to domestic prices coefficients provided in Marchand (2012: 270): 0.33 and 0.63 for rural and urban areas, respectively. While these estimates are produced using Indian data from 1994-2000, an argument in favour of using these elasticities is that India’s PPP adjusted GDP per capita in 2000 was similar to Uganda’s in 2018 (about $2,100 according to the World Bank (2020)). 10 Trade in the context of taxation in Uganda means imports. Very few exports are subject to taxes to incentivise local value addition (e.g. raw hides and skins). 11 Across all four products collected excise duty totalled 102 million Uganda Shilling in 2018/19. No additional taxes are currently collected on these products. While tariffs are product and country of origin specific, the withholding tax on imports is always 6% of the value of the shipment and VAT on imported goods is always 18% of the value of imports plus the duty paid. However, the data show that a lot of shipments entered under exemption schemes.

Policy Note | May 2020 International Growth Centre 8
Duties VAT Withholding tax Total
Rice 14,565 1,567 1,753 17,885 Sugar 3,575 6,674 173 10,422 Vegetable Oil 1,527 95,604 201 97,332 Wheat/wheat flour 44,518 87,916 1,085 133,519 Total 64,185 191,761 3,212 259,158 Notes: All values are in ‘000 000 Uganda Shilling. The list of specific tariff lines included for each of the four products is provided in the annexe. The key message emerging from this table is that cutting tariffs on all four products to zero would result in a modest revenue loss. Altogether, tariff revenue collected amounted to 64,185 million Ugandan Shilling (roughly $16.9 million), corresponding to about 0.4% of net tax revenue collected in the 2018/19 financial year. Two qualifications to this result are as follows. First, the number presented here should be considered as a static estimate for the fiscal loss from tariff liberalisation. A reduction of the price of imported goods from trading partners outside of the EAC through tariff cuts will inevitably affect volume, origin, and type of imports. This in turn has implications for the tax base of other taxes, most notably the VAT on imports which generates three times as much revenue from imports of the four considered products than customs duties.12 Second, an interesting observation from a detailed examination of the individual shipments underlying the aggregate figures presented in Table 2 is that a considerable share of the imports of these four products enters the country on exemption regimes that relieve an importer from paying (part of the) taxes due at importation.13 The low number of “normal” import shipments may suggest that tariff rates (especially for rice and sugar) are prohibitively high and impede regular private sector importation of these goods. Fiscal losses from liberalising agricultural tariffs could be offset by tariff increases on imports consumed disproportionally by wealthy Ugandans. One possibility would for example be to increase the tariff imposed on those types of motor-vehicles that are mostly used for private purposes (i.e. excluding vehicles like mini-vans, trucks, tractors etc.). In the annexe to this note, I provide results from simulating a zero tariff rate on the four suggested agricultural products, while at the same time increasing the tariff on seven car products from 25 to 35%. As evident from the results, fiscal losses from agricultural tariff liberalisation would be offset almost entirely and amount to only 2.2 billion Uganda shilling (about $0.6 million).14
Concluding remarks In this note, I explore a measure to ease the economic pressure on Ugandans arising from the COVID-19 pandemic. I employ a dataset that combines Ugandan data on household earnings from and expenditure on agricultural products with product-level data on tariffs. Using these data, I show that removing tariffs on four important agricultural items (rice, sugar, vegetable oil and wheat/wheat flour) could increase average real household income by as much as 1.3% through lower consumption prices. Translating these gains into monetary values and taking into account imperfect pass-through of 12 The proportions are in line with the relative tax head contributions across all Ugandan imports as well as the international experience in developing countries. For example, Brenton et al. (2009: 5) report that “in most countries tariff revenue constitutes substantially less than 50% of overall revenue collected at the border (…).” 13 For example, semi- or wholly-milled rice was imported under normal “full” tax treatment, but also completely exempt from all taxes when imported by UN agencies in support of projects in Uganda and other preferential regimes. 14 Increasing tariffs on imported alcoholic beverages (chapter 2 in the CET schedule) from 25 to 50% would generate an additional 2.6 billion Uganda shilling in trade tax revenues. Simulations are conducted using the Tariff Reform Impact Simulation Tool (TRIST) developed in Brenton et al. (2009). TRIST is a partial equilibrium model designed to assess the revenue impact of tariff reform and was customised for this note using Ugandan customs data for 2018/19.
Table 2: Trade taxes collected on agricultural products, 2018/19

Policy Note | May 2020 International Growth Centre 9
tariff cuts to consumer prices suggests that economy wide gains in the form of higher real household incomes would be around $59 million per year. These gains stand against modest fiscal losses from duty revenue foregone which would amount to about $17 million per year, but could be mitigated by increasing tariffs on products that are less socially relevant and consumed predominantly by wealthy Ugandans. In line with these insights my policy recommendation is that Uganda implement zero tariffs on rice, sugar, vegetable oil and wheat/wheat flour to partly offset income losses arising from the current pandemic. From an implementation angle this means that the government would apply for Stays of Application from the EAC-CET for the 21 tariff lines listed in the annexe where I map the four products to tariff lines regulated by the CET. Once approved, zero tariff rates can be implemented by the Uganda Revenue Authority quickly and without any operational cost. In closing it is important to highlight that tariff reductions on some of these items might become a must going forward. Many important origin countries of the four agricultural products under review already have or are considering to impose export bans in light of Covid-19. This in turn will lead to a shortage of supply and higher prices globally. In response to this, other countries have already implemented the policies I suggest in this note. For example, Panama, Mali and El Salvador all considerably removed barriers (tariffs or quotas) for rice imports to secure continued access to this good (cf. ITC 2020).
References Artuc, E, G Porto and B Rijkers (2020), “Household impact of tariffs: Data and results from
agricultural trade protection”, World Bank Economic Review, 00(0), 2020, 1–23. Brenton, P, C Saborowski, C Staritz and E von Uexkull (2009), “Assessing the adjustment
implications of trade policy changes using TRIST (Tariff Reform Impact Simulation Tool)”, World Bank Policy Research Working Paper 5045.
East African Community (EAC) (2019), “East African Community gazette”, Vol. AT 1 – No. 10, Arusha.
Food and Agriculture Organization of the United Nations (FAO) (2017), “Uganda removes rice
import duties”, Food Price Monitoring and Analysis, published online on 10 April 2017. Frazer, G (2012), “The EAC Common External Tariff (CET) and Rwanda”, IGC Working Paper. International Trade Centre (ITC). 2020. “Covid-19 temporary trade measures”.
International Monetary Fund (IMF) (2020), “Regional economic outlook. Sub-Saharan Africa:
COVID-19 an unprecedented threat to development”, International Monetary Fund, Washington DC. Marchand, B (2012), “Tariff pass-through and the distributional effects of trade liberalisation”,
Journal of Development Economics, 99 (2): 265–281. Nicita, A (2009), “The price effect of tariff liberalisation: Measuring the impact on household
welfare”, Journal of Development Economics 89 (1): 19–27. Uganda Bureau of Statistics (UBOS) (2014), “Uganda national household survey 2012/13”,
Kampala Uganda; UBOS. Uganda Bureau of Statistics (UBOS) (2018), “Uganda national household survey 2016/2017”,
Kampala, Uganda; UBOS. Uganda Revenue Authority (URA) (2019), “Annual press brief, period: July 2018 to June 2019”,
Uganda Revenue Authority, Uganda.

Policy Note | May 2020 International Growth Centre 10
United Nations Commodity Trade Database (UNComtrade) (2020), “Uganda, trade flows in
2018”, UNComtrade. World Bank (2020), “World Development Indicators – Population growth of Uganda (%) in
2018”, World Bank Group.
World Bank (2020), “World Development Indicators – GDP per Capita (PPP adjusted)”, World Bank Group.

Policy Note | May 2020 International Growth Centre 11
Annexe I: List of tariff lines suggested for zero tariffs through the Stays of Application mechanism of the East African Community.
Tariff lines per product Uganda's current CET rate (%) Value of imports in 2018/19
Wheat/wheat flour 1001.1900 Durum wheat (not seeds) 0 907
1001.9990 Hard wheat (not seeds) 10 443,456 1101.0000 Wheat or meslin flour 50 540
Rice 1006.1000 Rice in the husk (paddy or rough) 75% or $345/MT whichever is higher 10,812
1006.2000 Husked (brown) rice 75% or $345/MT whichever is higher 16,126 1006.3000 Semi milled or wholly milled rice 75% or $345/MT whichever is higher 32,576 1006.4000 Broken rice 75% or $345/MT whichever is higher 34,685
Vegetable oil 1511.1000 Crude palm oil 0 513,966
1511.9010 Palm Olein 10 3,089 1511.9030 Palm Olein, RBD 25 24,347 1511.9040 Palm Stearin, RBD 10 15,021 1511.9090 Other fractions from palm oil 25 1,556
Sugar 1701.1210 Jaggery beet sugar 100% or $ 460/MT whichever is higher 3
1701.1290 Other beet sugar 100% or $ 460/MT whichever is higher 7 1701.1310 Jaggery cane sugar 100% or $ 460/MT whichever is higher 8 1701.1390 Other cane sugar 100% or $ 460/MT whichever is higher 88 1701.1410 Jaggery - other cane sugar 100% or $ 460/MT whichever is higher 47 1701.1490 Other sugar 100% or $ 460/MT whichever is higher 18 1701.9100 Cane or beet sugar, flavoring or coloring 100% or $ 460/MT whichever is higher 17 1701.9910 Sugar for industrial use 100% or $ 460/MT whichever is higher 32,899 1701.9990 Other cane or beet sugar and chemically pure sucrose, solid 100% or $ 460/MT whichever is higher 5,832
Notes: Value of imports in 2018/2019 is in ‘000 000 Uganda Shilling. Uganda’s current CET rates on the listed tariff lines includes one active Stay of Applications from regular CET rates in financial year 2019/20 for tariff line 1001.9990 (Hard wheat, not seeds). The regular CET rate for this product is 35% ad valorem.

Policy Note | May 2020 International Growth Centre 12
Annexe II: Possible car tariff lines for a 35% tariff to offset fiscal losses from liberalising agricultural tariffs.
Tariff lines Value of imports in 2018/19
Motor cars and other motor vehicles with only spark-ignition internal combustion reciprocating piston engine 8703.1000 Of a cylinder capacity not exceeding 1,000 cc (other) 123 8703.2190 Of a cylinder capacity exceeding 1,000 cc but not exceeding 1,500 cc (other) 752 8703.2290 Of a cylinder capacity exceeding 1,500 cc but not exceeding 3,000 cc (other) 8,135 8703.2390 Of a cylinder capacity exceeding 3,000 cc (other) 343,186
Motor cars and other motor vehicles with only compression-ignition internal combustion piston engine 8703.2490 Of a cylinder capacity not exceeding 1,500 cc (other) 55,207 8703.3390 Of a cylinder capacity exceeding 2,500 cc (other) 75,662 8703.8000 Other vehicles, with only electric motor for propulsion 636
Notes: All listed products are not intended for the transportation of 10 or more people (e.g. mini-vans etc.) or used as capital goods (tractors etc.). Value of imports in 2018/2019 is in ‘000 000 Uganda Shilling. All tariff lines are currently subject to a tariff of 25% in the CET.

Policy Note | May 2020 International Growth Centre 13
Annexe III: Simulation results: Compensating fiscal losses from agricultural tariff liberalisation with tariff increases on cars.
The table shows results from simulating the revenue impact of implementing zero tariffs on the products listed in Annexe I of this note while at the same time implementing a tariff rate of 35% on the products listed in Annexe II of this note, in place of the regular CET rates. The simulation was conducted using the Tariff Reform Impact Simulation Tool (TRIST) provided in Brenton et al. (2009). TRIST is a partial equilibrium model designed to assess the revenue impact of tariff reform and was customised using Ugandan customs data for 2018/19.
Impact on imports Imports before reform 19,124,562,895,643 Imports after reform 19,122,113,803,029
Change in imports (Uganda shilling) -2,449,092,614% change in imports 0.0%
Impact on tariff revenue Tariff revenue: Before reform 1,042,169,131,098 Tariff revenue: After reform 1,040,281,246,808
Change in tariff revenue -1,887,884,290% change in tariff revenue -0.2%
Impact on total tax revenues on imports (tariff, VAT, and excise revenue) Total revenue collected on imports: Before reform 3,240,820,649,367 Total revenue collected on imports: After reform 3,238,576,300,387
Change in total revenue collected on imports -2,244,348,980% change in total revenue collected on imports -0.1%
Notes: Simulation conducted using TRIST customised for Uganda using customs data for financial year 2018/19. Values in Uganda Shilling. The model includes all imports except petroleum products, which are subject to a separate petroleum duty.