The Climate System GEOL 3100 Earth’s Climate and Environment: Past, Present, and Future.
Upload
evangeline-bradfordCategory
view
216download
1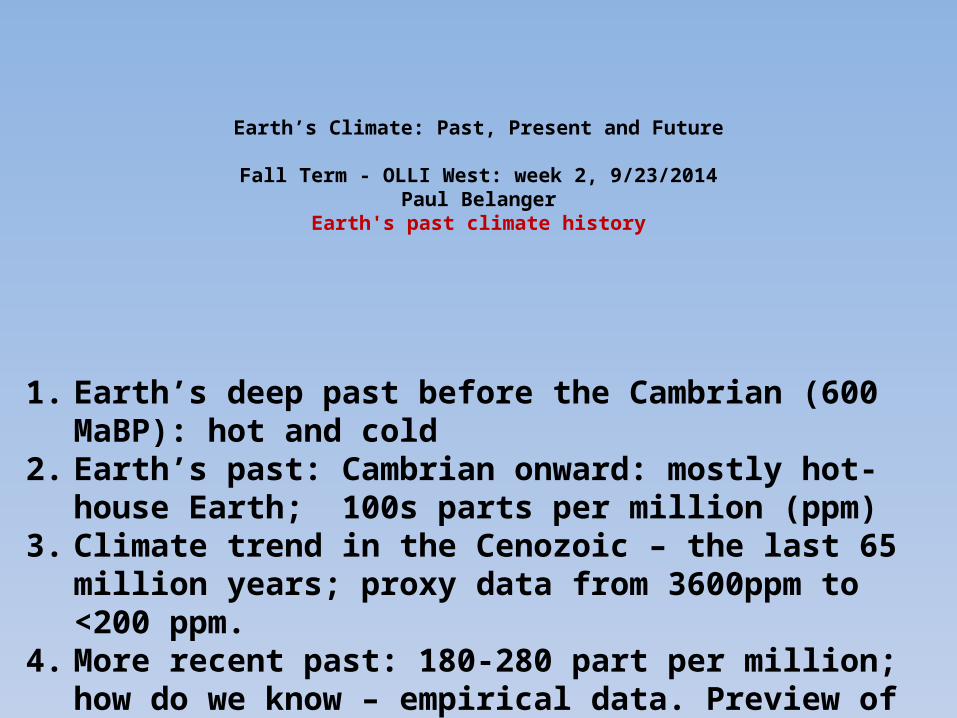
Earth’s Climate: Past, Present and Future
Fall Term - OLLI West: week 2, 9/23/2014Paul Belanger
Earth's past climate history
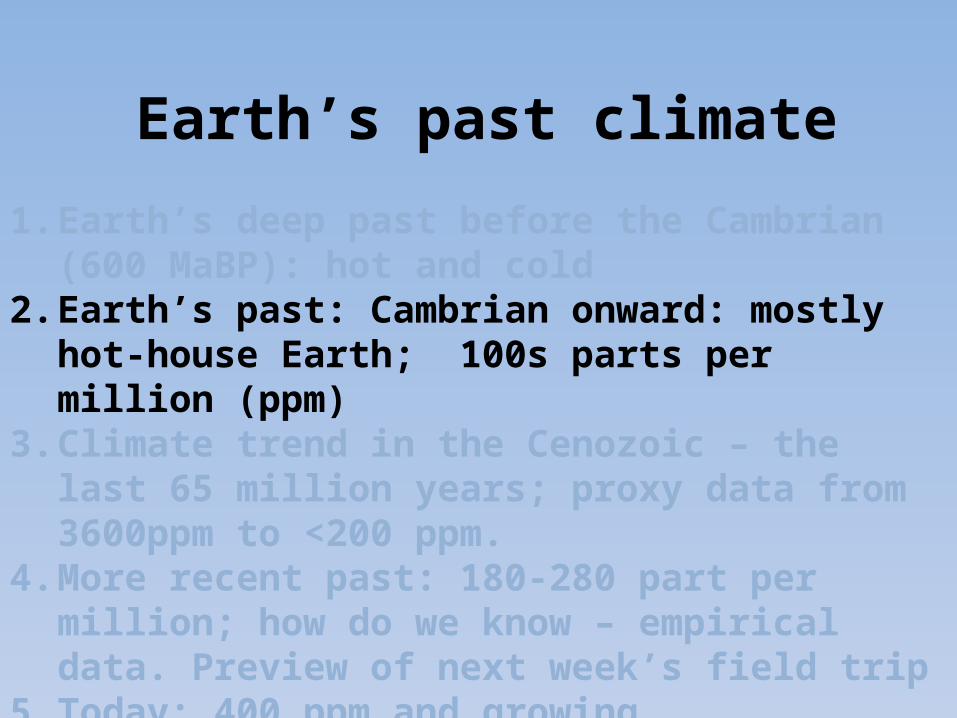
1. Earth’s deep past before the Cambrian (600 MaBP): hot and cold2. Earth’s past: Cambrian onward: mostly hot-house Earth; 100s
parts per million (ppm)3. Climate trend in the Cenozoic – the last 65 million years; proxy
data from 3600ppm to <200 ppm.4. More recent past: 180-280 part per million; how do we know –
empirical data. Preview of next week’s field trip5. Today: 400 ppm and growing 2-3ppm/year
REVIEW OF WEEK 1 ITEM

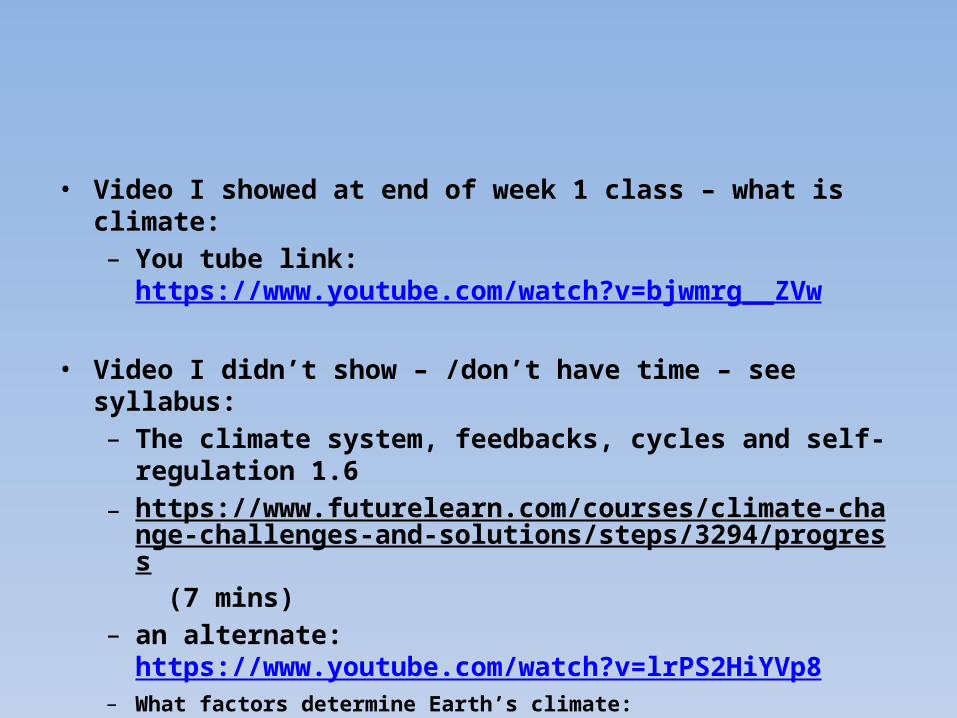
• Video I showed at end of week 1 class – what is climate:– You tube link: https://www.youtube.com/watch?v=bjwmrg__ZVw
• Video I didn’t show – /don’t have time – see syllabus:– The climate system, feedbacks, cycles and self-regulation 1.6– https://www.futurelearn.com/courses/climate-change-challenges-an
d-solutions/steps/3294/progress (7 mins)
– an alternate: https://www.youtube.com/watch?v=lrPS2HiYVp8 – What factors determine Earth’s climate:– See IPCC-AR5 (2013-2014) tab on my web page:– And this link from AR4 (2007) http://denverclimatestudygroup.com/?page_id=63 – http://www.ipcc.ch/publications_and_data/ar4/wg1/en/faq-1-1.html

climate system - the inter-relationship and feedback of: • Atmosphere• Hydrosphere• Biosphere• Cryosphere• Lithosphere (weathering reduces CO2; volcanism increases it)
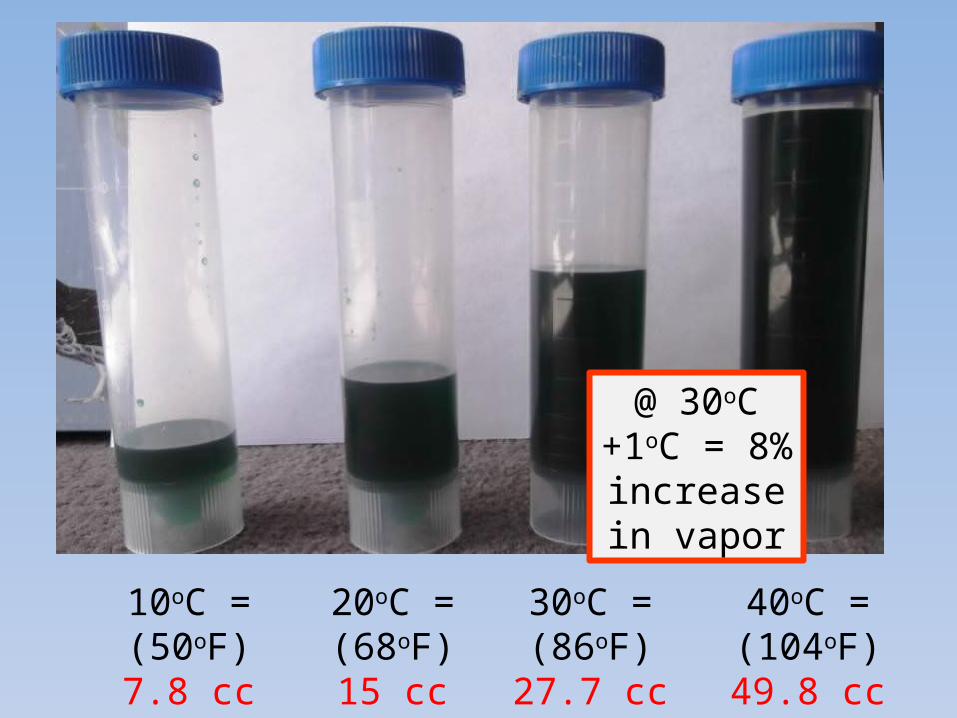
10oC = (50oF)7.8 cc
20oC = (68oF)15 cc
30oC = (86oF)27.7 cc
40oC = (104oF)49.8 cc
@ 30oC +1oC = 8%
increase in vapor
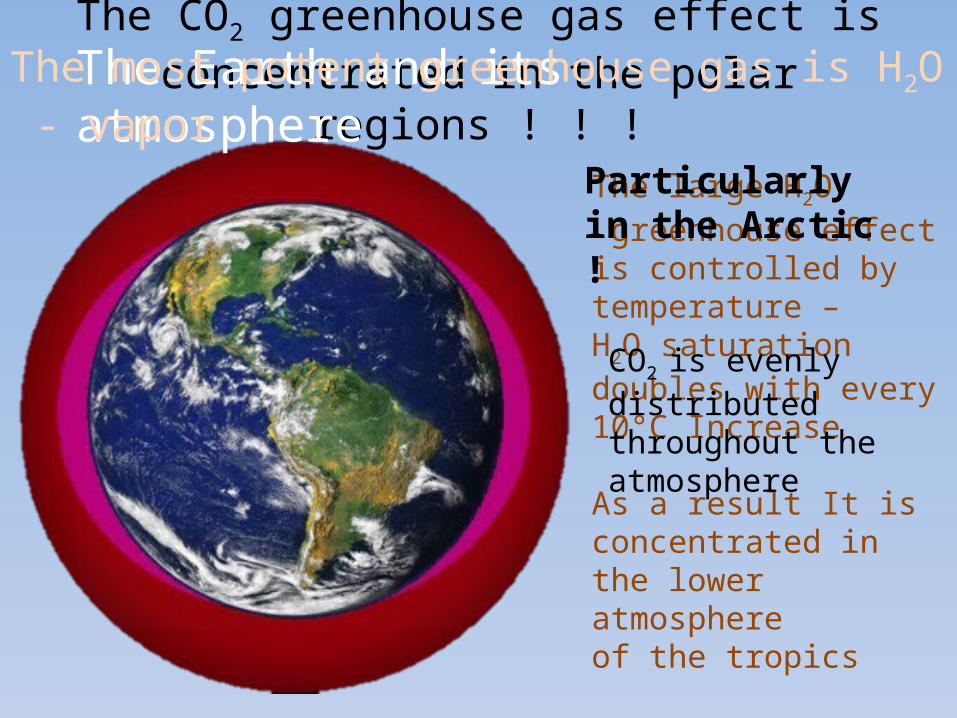
The CO2 greenhouse gas effect is concentrated in the polar regions ! ! !
The large H2O greenhouse effectis controlled by temperature – H2O saturation doubles with every 10°C Increase
As a result It is concentrated in the lower atmosphere of the tropics
CO2 is evenly distributed throughout the atmosphere
Particularly in the Arctic !
The Earth and its atmosphereThe most potent greenhouse gas is H2O - vapor

WEEK 2

1. Earth’s deep past before the Cambrian (600 MaBP): hot and cold
2. Earth’s past: Cambrian onward: mostly hot-house Earth; 100s parts per million (ppm)
3. Climate trend in the Cenozoic – the last 65 million years; proxy data from 3600ppm to <200 ppm.
4. More recent past: 180-280 part per million; how do we know – empirical data. Preview of next week’s field trip
5. Today: 400 ppm and growing
Earth’s past climate

Earth’s deep past and early atmosphere before the Cambrian (600 MaBP): hot and cold• Earth self regulates 2.1 -2.3 Tim Lenton video – 9 minute
overview• Article Link: BBC Nature
http://www.bbc.co.uk/nature/ancient_earth/Snowball_Earth
• You Tube – leaving for you to watch on your own: https://www.youtube.com/results?search_query=snow+ball+earth – various links
Earth’s past climate
1. Earth’s deep past before the Cambrian (600 MaBP): hot and cold
2. Earth’s past: Cambrian onward: mostly hot-house Earth; 100s parts per million (ppm)
3. Climate trend in the Cenozoic – the last 65 million years; proxy data from 3600ppm to <200 ppm.
4. More recent past: 180-280 part per million; how do we know – empirical data. Preview of next week’s field trip
5. Today: 400 ppm and growing
Earth’s past climate

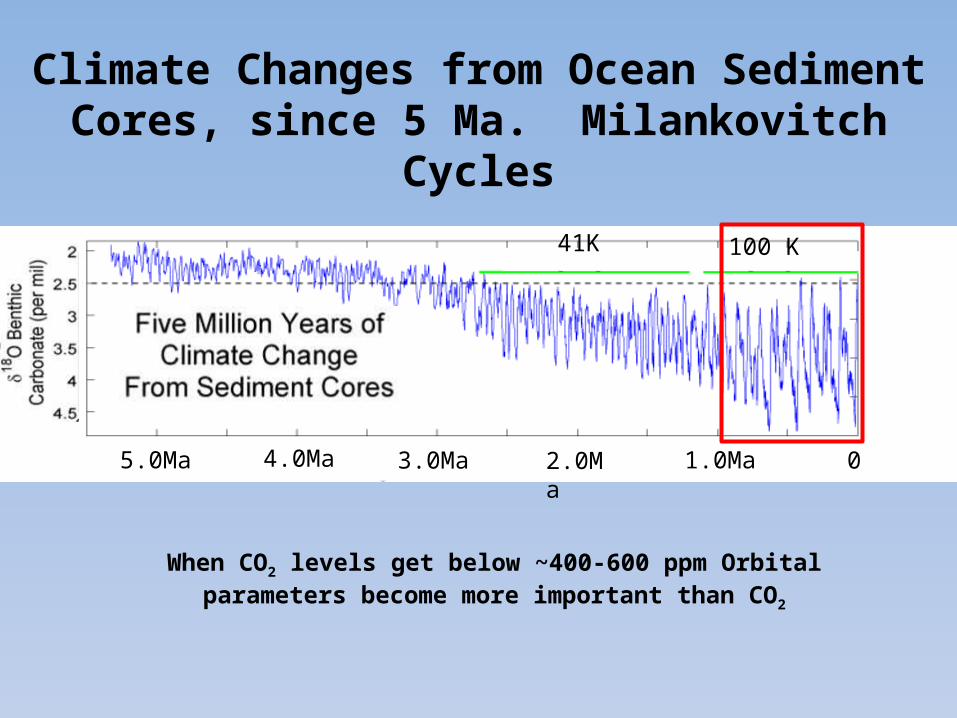
Climate Changes from Ocean Sediment Cores, since 5 Ma. Milankovitch Cycles
41K 100 K
3.0Ma4.0Ma 2.0Ma 1.0Ma5.0Ma 0
When CO2 levels get below ~400-600 ppm Orbital parameters become more important than CO2

1. Earth’s deep past before the Cambrian (600 MaBP): hot and cold
2. Earth’s past: Cambrian onward: mostly hot-house Earth; 100s parts per million (ppm)
3. Climate trend in the Cenozoic – the last 65 million years; proxy data from 3600ppm to <200 ppm.
4. More recent past: 180-280 part per million; how do we know – empirical data. Preview of next week’s field trip
5. Today: 400 ppm and growing
Earth’s past climate
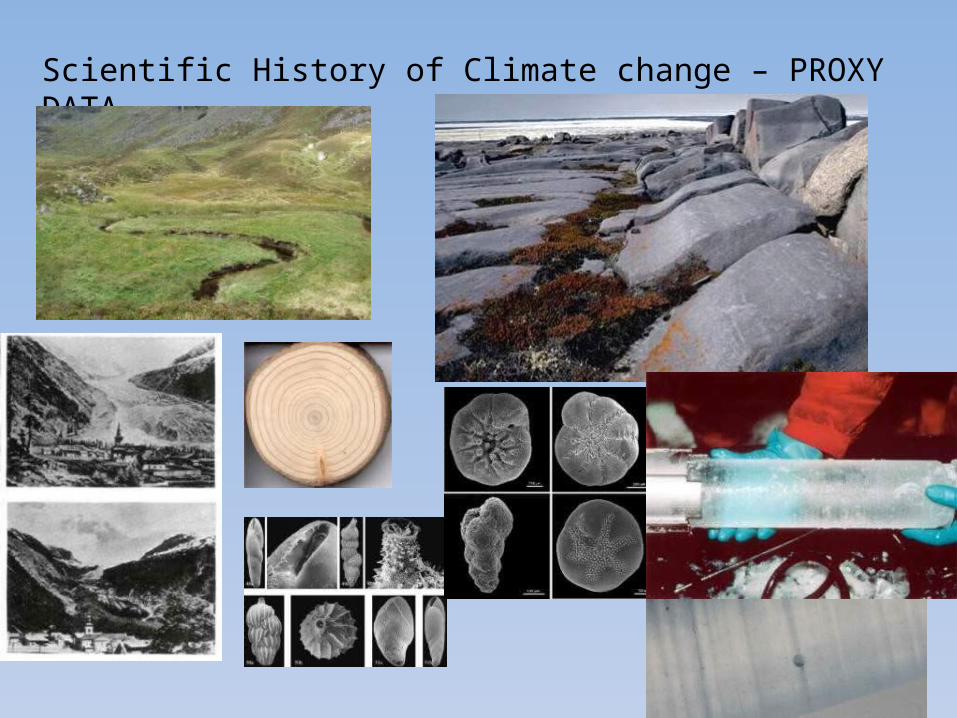
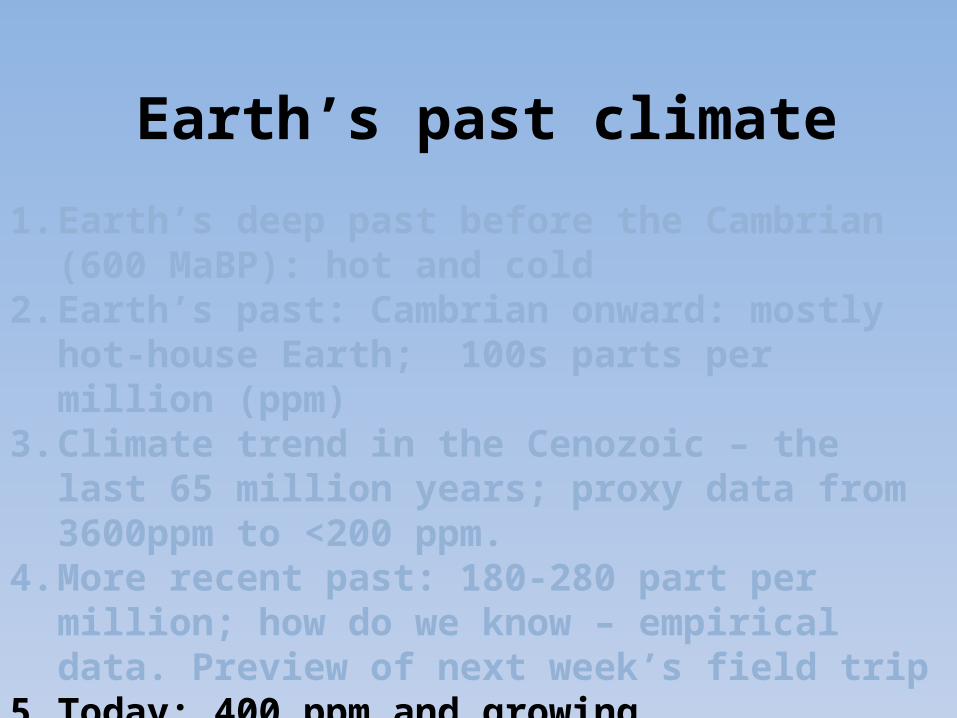
Scientific History of Climate change – PROXY DATA

Royer et al., 2003
Geologic cycles: Climate through the Phanerozoic:Carbon is the culprit
Alternating Greenhouse Earth / Ice-house Earth

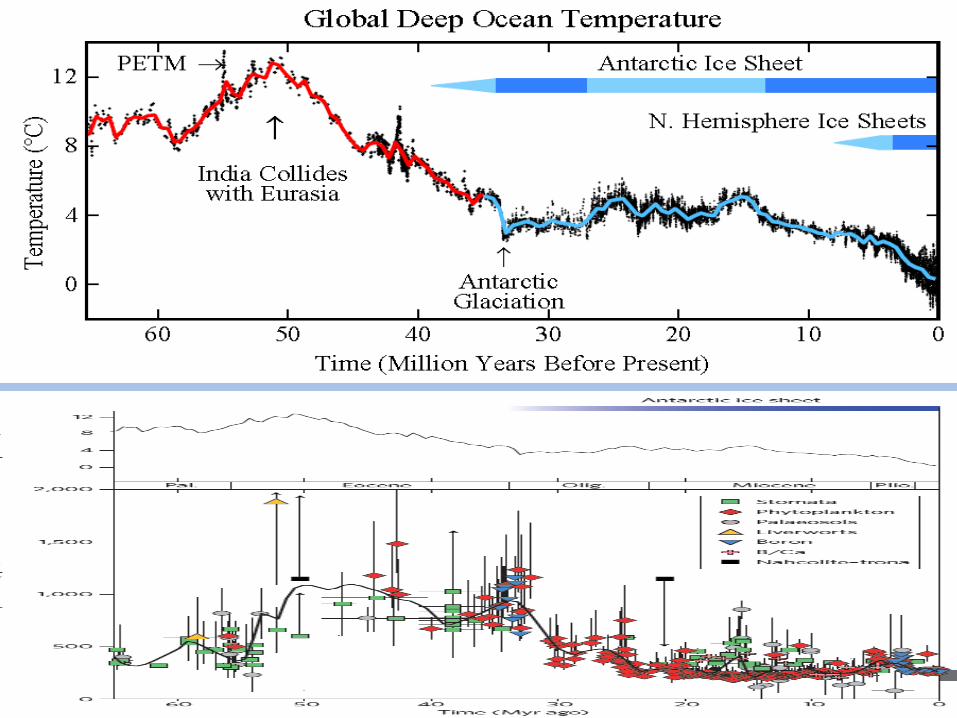
Cenozoic Deep Sea Climate Record
Zachos et al. 2008
hyperthermals
Opening of the Drake passage isolating
Antarctica and further drop in CO2
Closing ofIsthmus
of Panama
41k-100k & amplitude
change:Increase in
Antarctic ice
Azolla sequestering
event
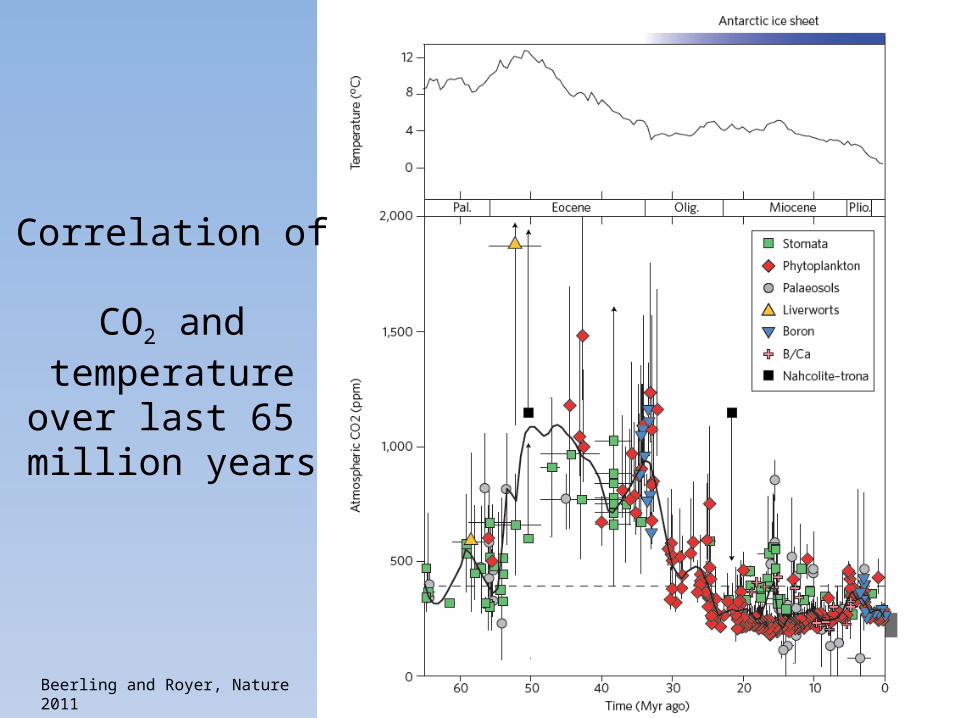
Correlation of CO2 and temperature
over last 65 million years
Beerling and Royer, Nature 2011

Photosynthesis/RespirationCO2 + H20 ↔ CH2O + O2
Weathering/PrecipitationCO2 + CaSiO3 ↔ CaCO3 + SiO2
Long-term Carbon Cycle: rocksTwo generalized reactions…

Berner, 2001
Long-term carbon cycle: rocks

50 million years ago (50 MYA) Earth was ice-free.
Atmospheric CO2 amount was of the order of 1000 ppm 50 MYA.
Atmospheric CO2 imbalance due to plate tectonics ~ 10-4 ppm per year.

1. Earth’s deep past before the Cambrian (600 MaBP): hot and cold
2. Earth’s past: Cambrian onward: mostly hot-house Earth; 100s parts per million (ppm)
3. Climate trend in the Cenozoic – the last 65 million years; proxy data from 3600ppm to <200 ppm.
4. More recent past: 180-280 part per million; how do we know – empirical data. Preview of next week’s field trip
5. Today: 400 ppm and growing
Earth’s past climate

Climate Changes from Ocean Sediment Cores, since 5 Ma. Milankovitch Cycles
41K 100 K
3.0Ma4.0Ma 2.0Ma 1.0Ma5.0Ma 0
When CO2 levels get below ~400-600 ppm Orbital parameters become more important than CO2
1. Earth’s deep past before the Cambrian (600 MaBP): hot and cold
2. Earth’s past: Cambrian onward: mostly hot-house Earth; 100s parts per million (ppm)
3. Climate trend in the Cenozoic – the last 65 million years; proxy data from 3600ppm to <200 ppm.
4. More recent past: 180-280 part per million; how do we know – empirical data. Preview of next week’s field trip
5. Today: 400 ppm and growing
Earth’s past climate

- SO – WHAT CONTROLS CLIMATE
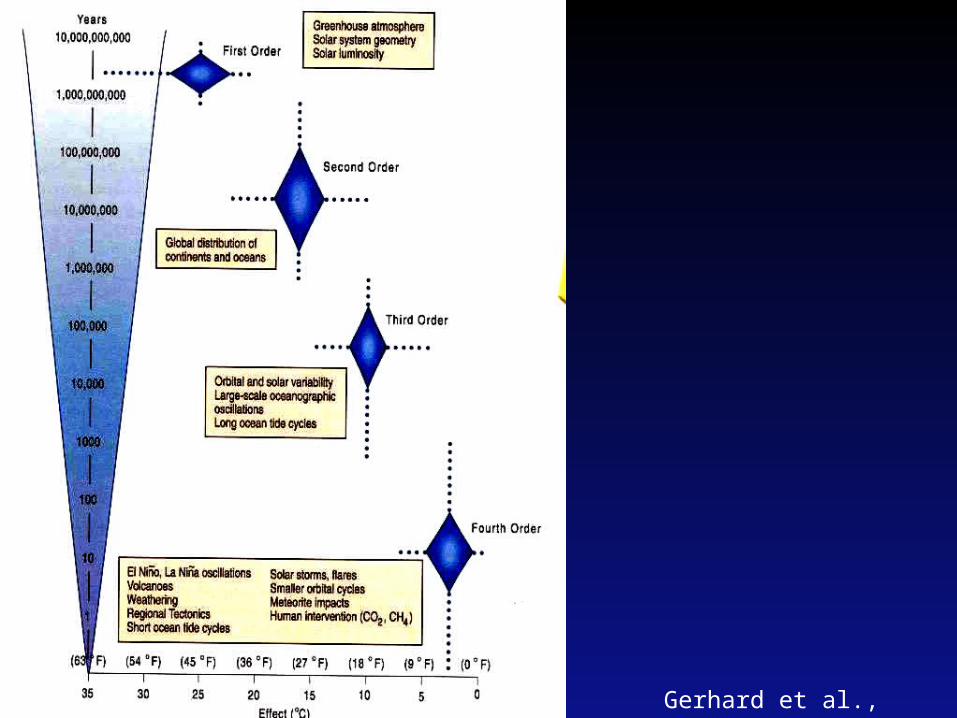
Gerhard et al., 2001

Rohling, et al., (PALAESENS Project mbrs), 2012
1o Forcings
Solar Luminosity
Atm. Comp.
2o Forcings
Continents(latitudes & elevations)
Oceancirculation
weathering
CO2
3o Forcings
Obliquity
Precession
Eccentricity
CO2 /CH4
FEEDBACKS
4o Forcings
Volcanic eruptions
SunspotsCycles
El Nino/La Nina
Cloud
Solar storms

End of week 2EXTRAS FOLLOW

Paleocene/Eocene Thermal MaximumPETM


Wikipedia
Proxy data: stable isotopes


PETM - THE LAND RECORD

Bighorn Basin
PETM interval in fluvial deposits with excellent alluvial paleosols - seen as color bands, which are soil horizons
Found in Willwood Fm
Reds, purples due to iron oxides in B horizons
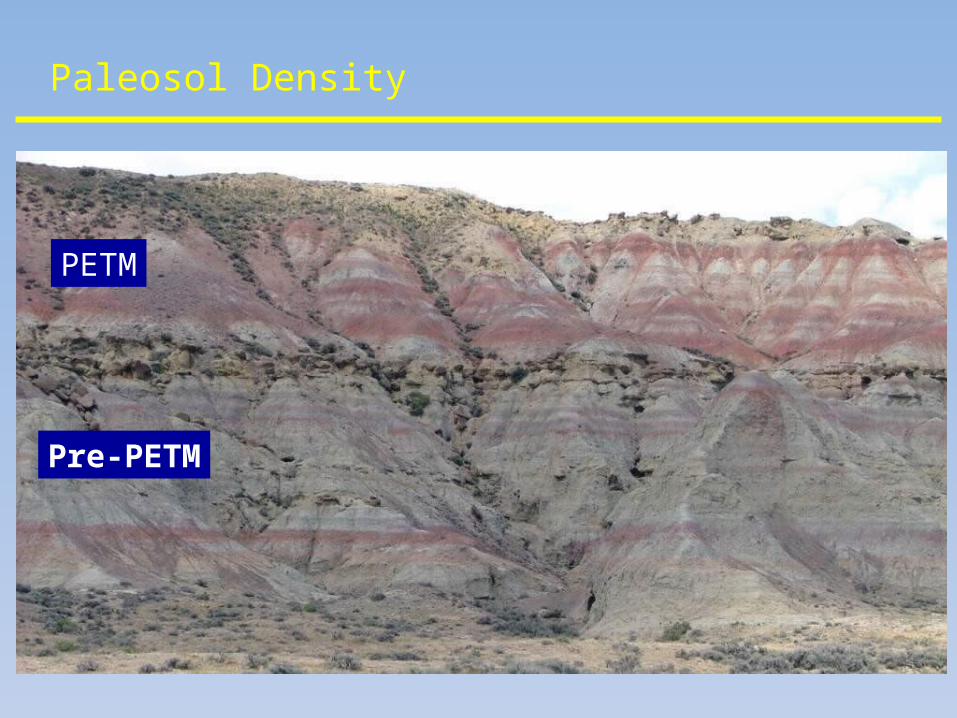
Paleosol Density
Pre-PETM
PETM
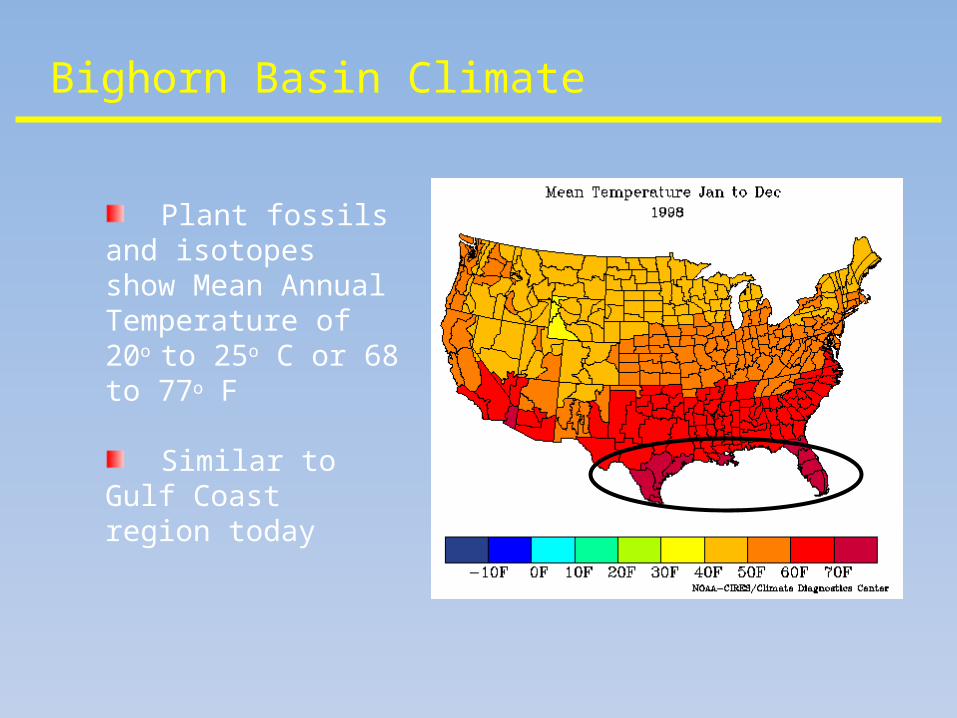
Bighorn Basin Climate
Plant fossils and isotopes show Mean Annual Temperature of 20o
to 25o C or 68 to 77o F
Similar to Gulf Coast region today

PROXY DATA-EXTRAS
FROM CSI TO GSI:GEOLOGICAL SAMPLE
INVESTIGATION
LET THE EVIDENCE SPEAK FOR ITSELF

WE CALL THIS EVIDENCE
“PROXY” DATA

• Strandlines/shorelines• Moraines• Till• Kettle lakes, etc.
SOME OF THE EARLIEST PROXY DATAWAS FROM TERRESTRIAL DEPOSITS
We may know what caused these today, but imagine back then?

IT’S THE INTERPRETATION THAT’S NOT ALWAYS CORRECT
Darwin observed ancient Alpine shorelines:interpreted as ocean shoreline
Agassiz – later correctly interpreted as ice-dammed lake-shore strandlines/shoreline
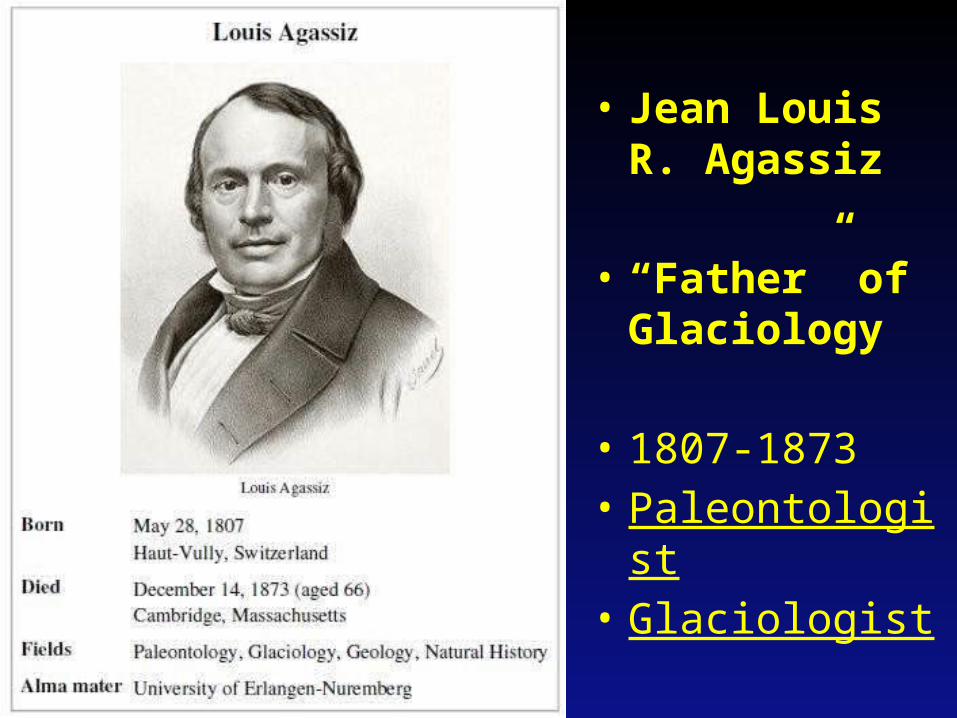
• Jean Louis R. Agassiz
• “Father” of Glaciology
• 1807-1873• Paleontologist• Glaciologist

Photographic proxy data/evidence
Ruddiman, 2008

EARLY PROXY DATA:TREE RINGS

Pollen & Lake core data
Ruddiman, 2008
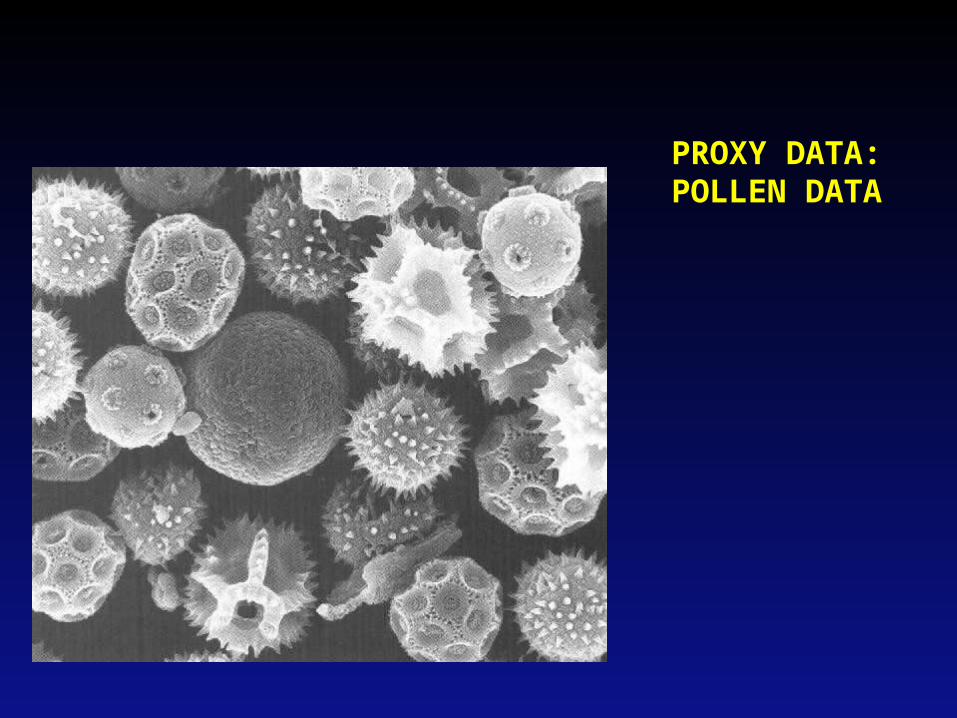
PROXY DATA:POLLEN DATA

PROXY DATA:LEAVES

Tree rings, corals, ice cores
Ruddiman, 2008

PROXY DATA:ICE CORES

TERRESTRIAL DATA
North American:WisconsinIllinoianKansanNebraskan
European:WurmRissMindelGunz

LATER EVIDENCE CAME FROMTHE MARINE RECORD
NOT WITHOUT IT’S PROBLEMS, BUT MORE COMPLETE
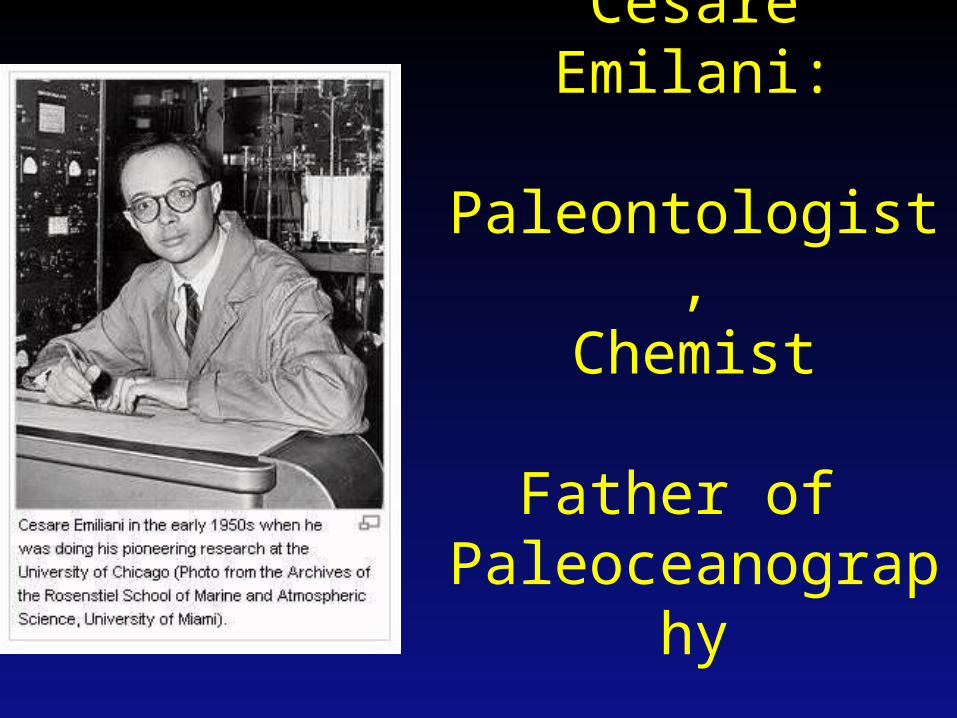
CesareEmilani:
Paleontologist,Chemist
Father of Paleoceanography

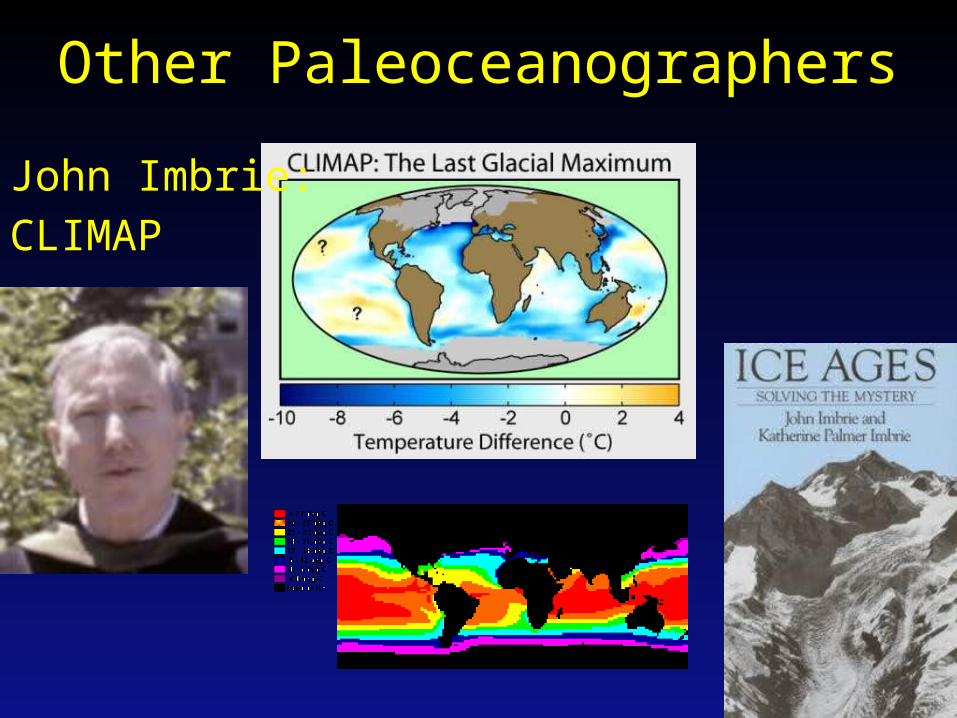
Other Paleoceanographers
Wally BroeckerThermal-haline
“conveyor” belt of circulation

Bill Ruddiman
Nick Shackleton
Other Paleoceanographers
Other Paleoceanographers
John Imbrie:
CLIMAP

PROXY DATA:CORE DATA
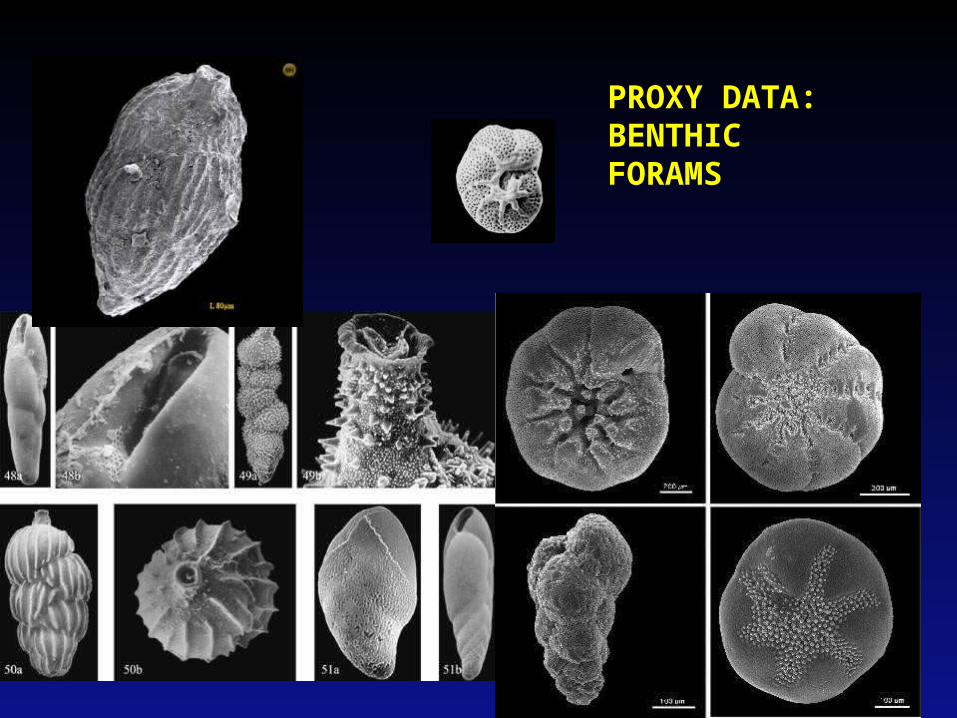
PROXY DATA:BENTHICFORAMS

PROXY DATA:PLANKTONICFORAMS

Deep Sea Coring
Ruddiman, 2008