Chapter 14 · Climatology is the study of Earth’s climate and the factors that affect past,...
50
Chapter 14
Transcript of Chapter 14 · Climatology is the study of Earth’s climate and the factors that affect past,...

Chapter 14

14.1 What is Climate? Objectives
Describe different types of climate data.
Recognize limits associated with the use of normals
Explain why climates vary.

Weather is a current, short-term variation
in the atmosphere.

Climatology
is the study of Earth’s climate and the factors that
affect past, present, and future climate changes.

Climate Data Types of climate data include annual variations
in temperature, precipitation, and wind.
In addition to average weather conditions, climatological data also
describes annual variations and fluctuations of temperature,
precipitation, wind speed, and other variables.

Annual variations
Annual variations give a more accurate view of the temperature fluctuations in an area. This information can be useful in designing buildings or in locating new facilities. It can also help people who have medical conditions that require them to live in certain climates.
Why is it useful to collect annual variations
in climatological data in addition to average
weather conditions?

Climatological normals:
They represent the standard values for a location.
They are averaged on a monthly or annual basis.
The information applies only to the place where the data
was collected.

Water’s Impact Two climates that are at the same latitude may be
different because of bodies of water.
Line of
Latitude

Earth’s Zones (Latitude)
POLAR
TEMPERATE
TROPICAL
Places at different latitudes on
Earth receive different amounts of
solar radiation. Areas closer to the
equator receive more direct solar
radiation for a longer period of
time. This makes them warmer
than places farther from the
equator that receive less direct
solar radiation for a shorter period
of time.
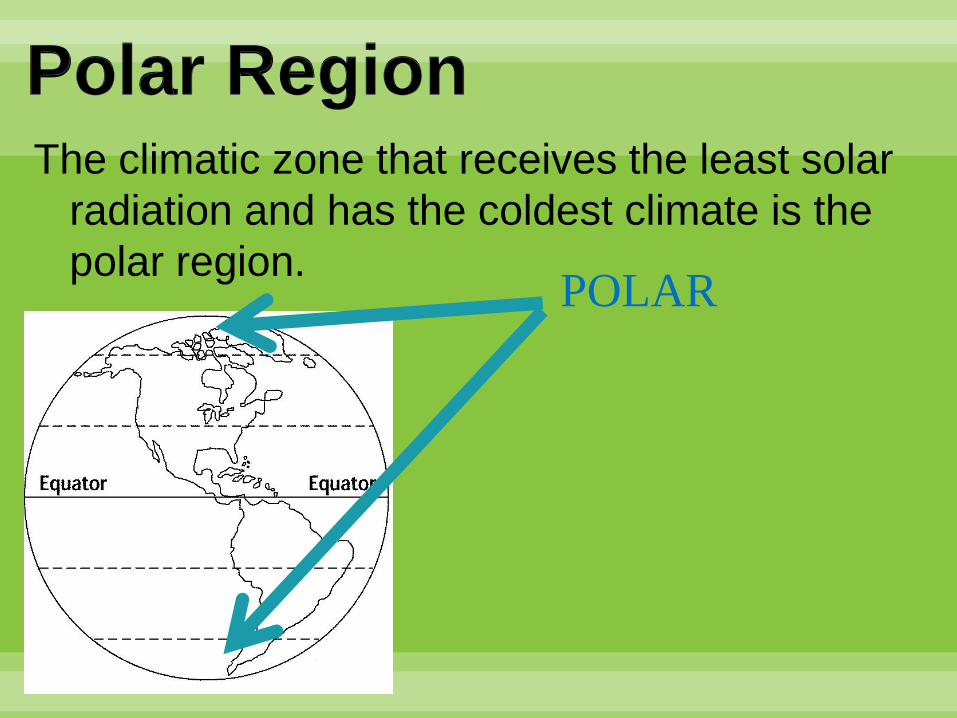
Polar Region The climatic zone that receives the least solar
radiation and has the coldest climate is the
polar region.
POLAR

14.2 Objectives
Describe the criteria used to classify climates.
Compare and Contrast different climates.
Climate
Classifications
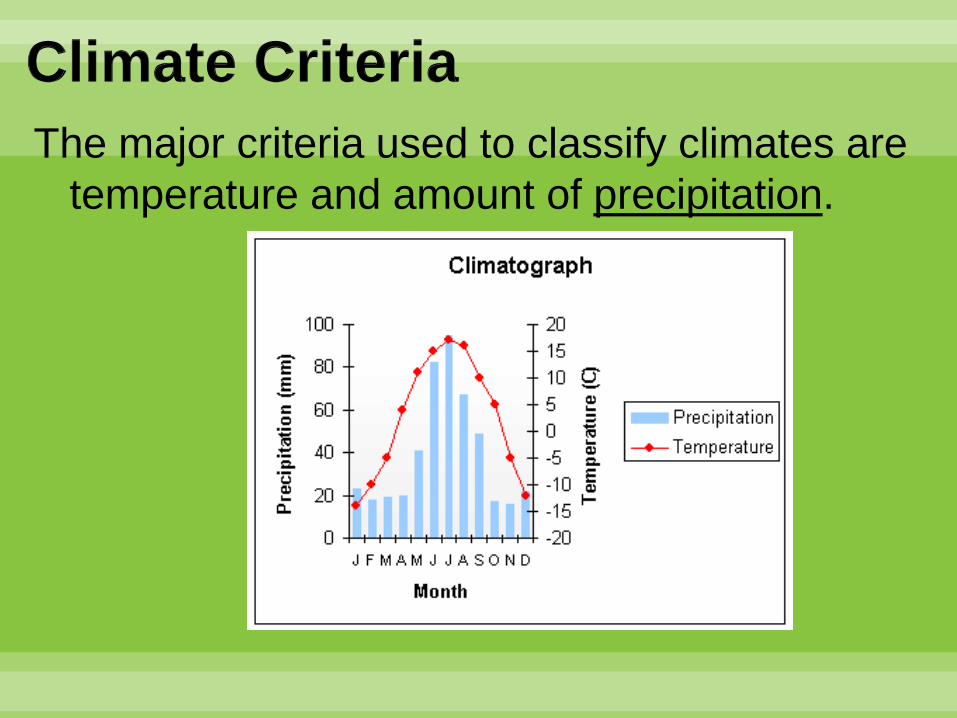
Climate Criteria
The major criteria used to classify climates are
temperature and amount of precipitation.

Koeppen classification
A widely used climate classification system is the
Koeppen system.
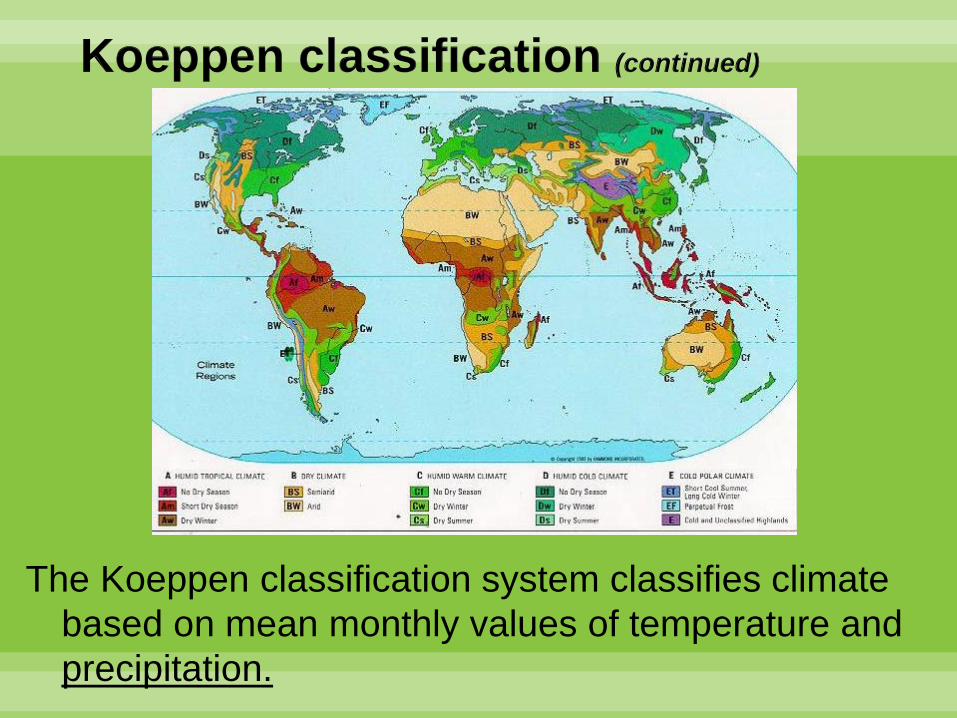
Koeppen classification (continued)
The Koeppen classification system classifies climate
based on mean monthly values of temperature and
precipitation.
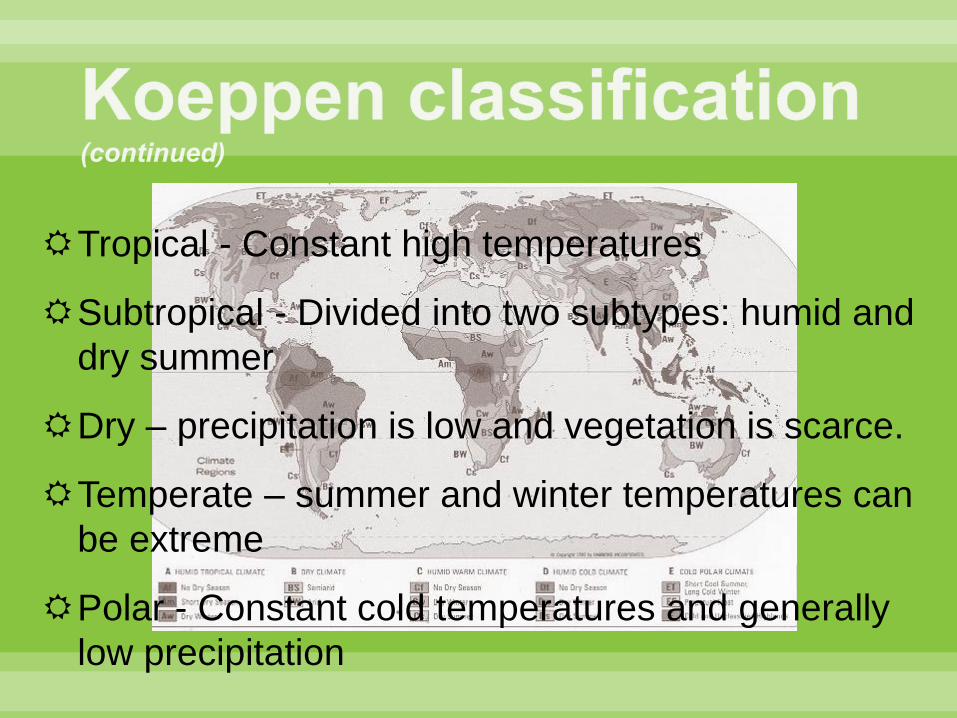
Tropical - Constant high temperatures
Subtropical - Divided into two subtypes: humid and
dry summer
Dry – precipitation is low and vegetation is scarce.
Temperate – summer and winter temperatures can
be extreme
Polar - Constant cold temperatures and generally
low precipitation

Microclimates A microclimate is a localized climate that differs from the main
regional climate around it. May be as small as a few square
meters(for example a garden bed) or as large as many
square kilometers. Microclimates include areas that have
lake-effect snow (Syracuse, NY), areas at the tops of
mountains, (Mt. Washington, NH) and heat islands.

14.3 Climatic Changes Objectives
Distinguish among different types of climatic changes.
Recognize why climatic changes occur.

Ice Ages
Periods of extensive glacial coverage are
called ice ages.
Within Earth’s
recorded history
there are at least 5
recognizable times
when the surface
was covered by
vast sheets of ice.

El Niño A warm ocean
current that
develops off the
west coast of South
America is El Niño.

El Niño Impact. One of the effects of El Niño is that the jet stream
shifts farther south.

Seasons Seasons are short-term period of climatic change
caused by regular variations in daylight,
temperature, and weather patterns.

Earth’s elliptical orbit The shape of Earth’s elliptical orbit and the tilt of its
axis could have triggered climate changes in the
past.

Earth’s elliptical orbit (continued)
When Earth’s elliptical orbit elongates during its
100 000-year cycle, Earth passes closer to
the sun and temperatures become warmer
than normal.
Current ~ 3%
Minimum 1%
Maximum 11%
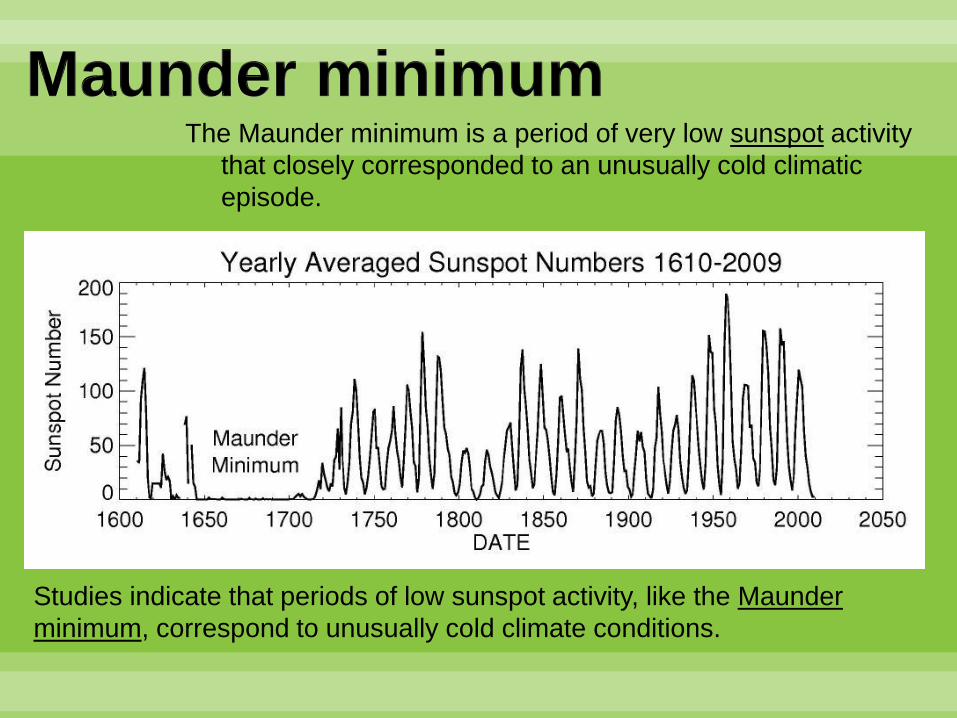
Maunder minimum The Maunder minimum is a period of very low sunspot activity
that closely corresponded to an unusually cold climatic
episode.
Studies indicate that periods of low sunspot activity, like the Maunder
minimum, correspond to unusually cold climate conditions.

14.4 The Human Impact Objectives
Compare and Contrast the greenhouse effect and
global warming.
Identify how humans impact climate.

Greenhouse Effect The greenhouse effect is the natural heating of Earth’s
surface caused by certain gases in the atmosphere.

Could global warming happen without the
greenhouse effect?
No - the greenhouse effect allows Earth’s atmosphere to trap
heat. Global warming, which is the rise in global
temperatures, would not happen if Earth’s atmosphere could
not retain heat through the greenhouse effect.

Global warming (Climate change, in the press)
Greenhouse Effect & Global Warming
Greenhouse effect
The greenhouse effect is the
natural heating of Earth’s
surface caused by atmospheric
gases.
Global warming is the abnormal
rise in global temperatures
due to the increased
concentration of greenhouse
gases in the atmosphere.
Both involve the heating of Earth.

CO2 (carbon dioxide)
The burning of fossil fuels releases large amounts of CO2 (carbon dioxide)
into the atmosphere, which contributes to global warming.

Climate Change
Evidence & you decide...

Land & Ocean Temperatures rising since 1880 (Instrument Measure)

Info slide Last year, 2015 was the warmest year across global land and ocean surfaces since records began in 1880.
The annual global combined land and ocean surface temperature was 0.90°C (1.62°F) above the 20th century average of 13.9°C (57.0°F).
This marks the 39th consecutive year (since 1977) that the yearly global temperature was above average.
Source : http://www.ncdc.noaa.gov/sotc/global/2013/13

Graph speaks for itself

30 year average to December 2015 shows far more increases than decreases

Why?
What will happen to a warmer planet ?

Melting of Glaciers and Polar Ice

...and with that sea-level rise

Storms during sea-level rise
Warmer air masses mean MORE energy for storms –
storm damage and associated cost will only rise.
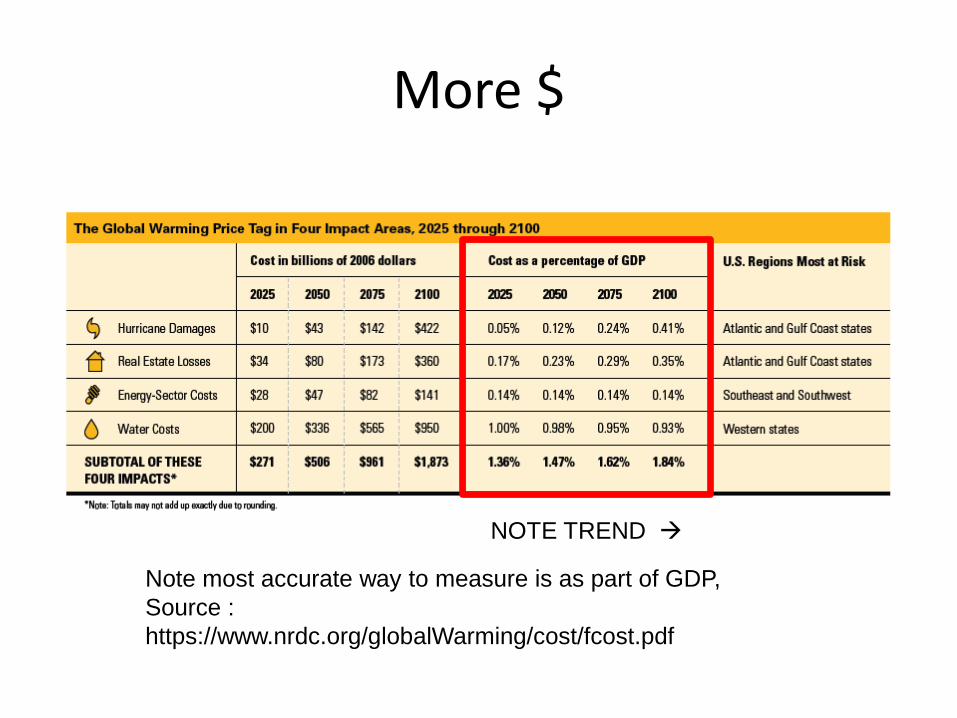
More $
Note most accurate way to measure is as part of GDP,
Source :
https://www.nrdc.org/globalWarming/cost/fcost.pdf
NOTE TREND

Why?

Normal atmospheric CO2 range seems to be 180 to 280 ppm We are now over 400 (and rising)
What would you predict should happen to Earth
temperature?

Why?
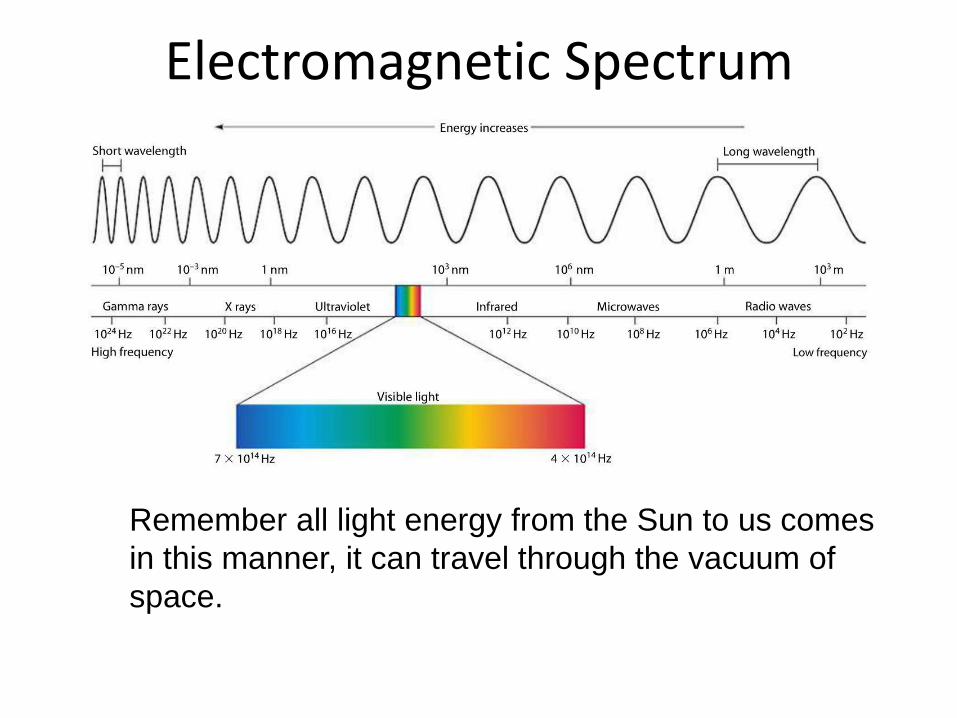
Electromagnetic Spectrum
Remember all light energy from the Sun to us comes
in this manner, it can travel through the vacuum of
space.

Energy Emissions and Wavelenght
Energy coming in from the Sun
Energy back out from the Earth

Atmospheric Composition PERMANENT gases in the atmosphere by percent are:
Nitrogen 78.1% (N2)
Oxygen 20.9% (O2)
(Note that these two permanent gases together comprise 99% of the atmosphere)
Other permanent gases: Argon 0.9% (Ar)
Neon 0.002% (Ne)
Helium 0.0005% (He)
Krypton 0.0001% (Kr)
Hydrogen 0.00005% (H2)
VARIABLE gases in the atmosphere and typical percentage values are: Water vapor 0 to 4% (H2O)
Carbon Dioxide 0.035% actually it is now > 0.04% (CO2)
Methane 0.0002% (CH4)
Ozone 0.000004% (O3)
Water vapor varies from 0% over deserts and locations with temperatures below freezing to 4% over oceans.

Why CO2?
All the ‘double’ atoms are unaffected by both incoming and outgoing.
(Remember the list)
However the ‘triple’ atoms absorb IR energy and turn it thermal.
N N
O C

Why?
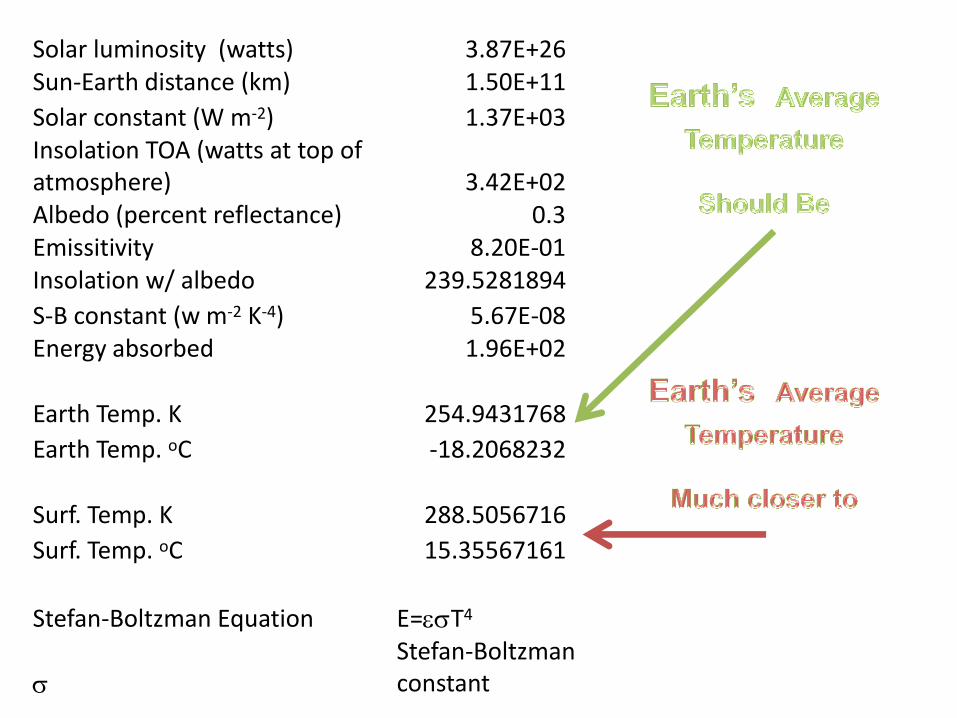
Why? Solar luminosity (watts) 3.87E+26 Sun-Earth distance (km) 1.50E+11
Solar constant (W m-2) 1.37E+03 Insolation TOA (watts at top of atmosphere) 3.42E+02 Albedo (percent reflectance) 0.3 Emissitivity 8.20E-01 Insolation w/ albedo 239.5281894
S-B constant (w m-2 K-4) 5.67E-08 Energy absorbed 1.96E+02
Earth Temp. K 254.9431768
Earth Temp. oC -18.2068232
Surf. Temp. K 288.5056716
Surf. Temp. oC 15.35567161
Stefan-Boltzman Equation E=esT4
s
Stefan-Boltzman constant

Why?