Earth and Planetary Science Lettersby numerical modeling work; late stage terrestrial planet...
12
The onset of the lunar cataclysm as recorded in its ancient crater populations Simone Marchi a, b, c, ⁎, William F. Bottke b , David A. Kring c , Alessandro Morbidelli a a Laboratoire Lagrange, Université de Nice Sophia-Antipolis, CNRS, Observatoire de la Côte d'Azur, France b Center for Lunar Origin & Evolution, SwRI, Boulder, CO, USA c Center for Lunar Science & Exploration, USRA — Lunar and Planetary Institute, Houston, TX, USA abstract article info Article history: Received 21 November 2011 Received in revised form 16 January 2012 Accepted 18 January 2012 Available online 22 February 2012 Editor: T.M. Harrison Keywords: the Moon lunar cataclysm solar system evolution South Pole-Aitken basin The earliest bombardment history of the Moon potentially provides powerful constraints for solar system evolution models. A major uncertainty, however, is how much of this history is actually recorded in lunar cra- ters. For example, some argue that most ancient lunar craters and basins were produced by a declining bom- bardment of leftover planetesimals produced by terrestrial planet formation processes. Others believe that most lunar craters and large basins were formed in a narrow time interval between 3.8 and 4.0 Ga, the so- called lunar cataclysm. In the light of recent improvements in our understanding of early solar system evolu- tion, it is possible that the contributions from both scenarios could be represented in the lunar crater record. If so, when did the declining bombardment end and the lunar cataclysm begin? Here we show, using new counts of 15–150 km diameter craters on the most ancient lunar terrains, that the craters found on or near Nectaris basin appear to have been created by projectiles hitting twice as fast as those that made the oldest craters on various Pre-Nectarian-era terrains. This dramatic velocity increase is consistent with the existence of a lunar cataclysm and potentially with a late reconfiguration of giant planet orbits, which may have strongly modified the source of lunar impactors. This work also suggests that the lunar cataclysm may have started near the formation time of Nectaris basin. This possibility implies that South Pole-Aitken basin (SPA), the largest lunar basin and one of the oldest by superposition, was not created during the cataclysm. This view is strengthened by our interpretation that a substantial fraction of ancient craters on SPA were made by low velocity impactors. Finally, we believe these results shed new light on the impact history of the primordial Earth. © 2012 Elsevier B.V. All rights reserved. 1. Introduction The lunar cratering record is perhaps the most complete, clear, and accessible history available for the inner solar system over the last ~ 4.5 Gy. The spatial density of lunar craters not only provides a mea- sure of the relative age of different surfaces, but can also help us un- derstand the temporal evolution of the impactor flux that has struck the Earth–Moon system over time. The ultimate goals of lunar crater- ing studies are to determine absolute ages using a combination of sample ages and modeling work, and to glean insights into those plan- et formation and evolution processes that produce lunar impactors. The interpretation of craters on the oldest lunar terrains is often di- vided into two broad schools of thought. The first suggests that the left- overs of planetary accretion struck the Moon after it formed, with the flux declining smoothly as the planetesimals were gradually eliminated over hundreds of Myr by collisional and dynamical processes (e.g., Wetherill, 1977). In an end-member case, the declining bombardment phase would dominate the production of lunar craters and basins (i.e., D >300 km diameter craters) until at least 3.7–3.8 Ga, the forma- tion time of the youngest basin Orientale (Hartmann, 1975; Hartmann et al., 1981; Marchi et al., 2009; Neukum and Ivanov, 1994). The second school suggests most basins and craters formed in an impact spike or so-called lunar cataclysm (LC; Kring and Cohen, 2002; Ryder, 2002; Tera et al., 1974). While the actual length of the impact spike is a hotly debated topic, support for some kind of LC comes from the apparent clustering of impact-reset Ar–Ar ages and extensive crustal U–Pb mobilization at 3.8–3.9 Ga found within Apol- lo samples (Tera et al., 1974; Turner et al., 1973) and lunar meteorites (Cohen et al., 2000). Numerical modeling work also indicates it is un- likely that a conventional declining bombardment model could make large lunar basins like Imbrium and Orientale between their observed ages of 3.7–3.9 Ga (Bottke et al., 2007). In an end-member case, near- ly all lunar craters and basins would be made by the LC within a win- dow of time that includes 3.7–3.9 Ga (Ryder, 2002). A possible trigger for the LC could be the putative late migration of the giant planets (Gomes et al., 2005). Both schools are difficult to prove or reject because few of the available lunar samples with solid ages can be definitively linked to specific impact features or terrains (Norman et al., 2010; Stöffler and Ryder, 2001). For example, the observed paucity of impact-reset Earth and Planetary Science Letters 325–326 (2012) 27–38 ⁎ Corresponding author at: Laboratoire Lagrange, Université de Nice Sophia- Antipolis, CNRS, Observatoire de la Côte d'Azur, France. E-mail address: [email protected] (S. Marchi). 0012-821X/$ – see front matter © 2012 Elsevier B.V. All rights reserved. doi:10.1016/j.epsl.2012.01.021 Contents lists available at SciVerse ScienceDirect Earth and Planetary Science Letters journal homepage: www.elsevier.com/locate/epsl
Transcript of Earth and Planetary Science Lettersby numerical modeling work; late stage terrestrial planet...

Earth and Planetary Science Letters 325–326 (2012) 27–38
Contents lists available at SciVerse ScienceDirect
Earth and Planetary Science Letters
j ourna l homepage: www.e lsev ie r .com/ locate /eps l
The onset of the lunar cataclysm as recorded in its ancient crater populations
Simone Marchi a,b,c,⁎, William F. Bottke b, David A. Kring c, Alessandro Morbidelli a
a Laboratoire Lagrange, Université de Nice Sophia-Antipolis, CNRS, Observatoire de la Côte d'Azur, Franceb Center for Lunar Origin & Evolution, SwRI, Boulder, CO, USAc Center for Lunar Science & Exploration, USRA — Lunar and Planetary Institute, Houston, TX, USA
⁎ Corresponding author at: Laboratoire Lagrange,Antipolis, CNRS, Observatoire de la Côte d'Azur, France.
E-mail address: [email protected] (S. Marchi).
0012-821X/$ – see front matter © 2012 Elsevier B.V. Aldoi:10.1016/j.epsl.2012.01.021
a b s t r a c t
a r t i c l e i n f oArticle history:Received 21 November 2011Received in revised form 16 January 2012Accepted 18 January 2012Available online 22 February 2012
Editor: T.M. Harrison
Keywords:the Moonlunar cataclysmsolar system evolutionSouth Pole-Aitken basin
The earliest bombardment history of the Moon potentially provides powerful constraints for solar systemevolution models. A major uncertainty, however, is howmuch of this history is actually recorded in lunar cra-ters. For example, some argue that most ancient lunar craters and basins were produced by a declining bom-bardment of leftover planetesimals produced by terrestrial planet formation processes. Others believe thatmost lunar craters and large basins were formed in a narrow time interval between 3.8 and 4.0 Ga, the so-called lunar cataclysm. In the light of recent improvements in our understanding of early solar system evolu-tion, it is possible that the contributions from both scenarios could be represented in the lunar crater record.If so, when did the declining bombardment end and the lunar cataclysm begin?Here we show, using new counts of 15–150 km diameter craters on the most ancient lunar terrains, that thecraters found on or near Nectaris basin appear to have been created by projectiles hitting twice as fast asthose that made the oldest craters on various Pre-Nectarian-era terrains. This dramatic velocity increase isconsistent with the existence of a lunar cataclysm and potentially with a late reconfiguration of giant planetorbits, which may have strongly modified the source of lunar impactors. This work also suggests that thelunar cataclysm may have started near the formation time of Nectaris basin. This possibility implies thatSouth Pole-Aitken basin (SPA), the largest lunar basin and one of the oldest by superposition, was not createdduring the cataclysm. This view is strengthened by our interpretation that a substantial fraction of ancientcraters on SPA were made by low velocity impactors. Finally, we believe these results shed new light onthe impact history of the primordial Earth.
© 2012 Elsevier B.V. All rights reserved.
1. Introduction
The lunar cratering record is perhaps the most complete, clear, andaccessible history available for the inner solar system over the last~4.5 Gy. The spatial density of lunar craters not only provides a mea-sure of the relative age of different surfaces, but can also help us un-derstand the temporal evolution of the impactor flux that has struckthe Earth–Moon system over time. The ultimate goals of lunar crater-ing studies are to determine absolute ages using a combination ofsample ages andmodelingwork, and to glean insights into those plan-et formation and evolution processes that produce lunar impactors.
The interpretation of craters on the oldest lunar terrains is often di-vided into two broad schools of thought. The first suggests that the left-overs of planetary accretion struck the Moon after it formed, with theflux declining smoothly as the planetesimals were gradually eliminatedover hundreds of Myr by collisional and dynamical processes (e.g.,Wetherill, 1977). In an end-member case, the declining bombardmentphase would dominate the production of lunar craters and basins
Université de Nice Sophia-
l rights reserved.
(i.e., D>300 km diameter craters) until at least 3.7–3.8 Ga, the forma-tion time of the youngest basin Orientale (Hartmann, 1975; Hartmannet al., 1981; Marchi et al., 2009; Neukum and Ivanov, 1994).
The second school suggests most basins and craters formed in animpact spike or so-called lunar cataclysm (LC; Kring and Cohen,2002; Ryder, 2002; Tera et al., 1974). While the actual length of theimpact spike is a hotly debated topic, support for some kind of LCcomes from the apparent clustering of impact-reset Ar–Ar ages andextensive crustal U–Pb mobilization at 3.8–3.9 Ga found within Apol-lo samples (Tera et al., 1974; Turner et al., 1973) and lunar meteorites(Cohen et al., 2000). Numerical modeling work also indicates it is un-likely that a conventional declining bombardment model could makelarge lunar basins like Imbrium and Orientale between their observedages of 3.7–3.9 Ga (Bottke et al., 2007). In an end-member case, near-ly all lunar craters and basins would be made by the LC within a win-dow of time that includes 3.7–3.9 Ga (Ryder, 2002). A possible triggerfor the LC could be the putative late migration of the giant planets(Gomes et al., 2005).
Both schools are difficult to prove or reject because few of theavailable lunar samples with solid ages can be definitively linked tospecific impact features or terrains (Norman et al., 2010; Stöfflerand Ryder, 2001). For example, the observed paucity of impact-reset

28 S. Marchi et al. / Earth and Planetary Science Letters 325–326 (2012) 27–38
argon ages older than 3.9 Ga may be due to an over-reliance on sam-ples taken from the vicinity of Imbrium basin (and its ejecta) ratherthan a true indication that the LC took place (Chapman et al., 2007;Hartmann et al., 2007; Haskin et al., 1998). Still, it is possible thatan either-or choice here may be the wrong question to ask.
In this paper, we argue that both schools should contribute atsome level to the lunar cratering record. This outcome is predictedby numerical modeling work; late stage terrestrial planet formationmodels show a declining bombardment of leftover planetesimals isalmost inevitable in the inner solar system (e.g., Bottke et al., 2007;Morbidelli et al., 2001), while late giant planet migration modelsmay well extract comets and asteroids out of their stable reservoirshundreds of millions of years after the terrestrial planets and Moonhave formed. Thus, in a unified model, the oldest craters and basinswould come from a declining bombardment phase, while somewhatyounger ones would be derived from a LC of limited extent. If true,we might expect a change in the impactor populations between thedeclining bombardment and LC eras. In turn, this would translateinto a change in the crater size-frequency distributions (SFDs) be-tween the oldest lunar terrains and those occurring near the LCevent. The question is whether this signal can be found in the existingcrater data. In this respect, it is important to point out that key differ-ences in the crater SFDs between the ancient lunar highlands and themuch younger post-mare terrains have already been identified byStrom et al. (2005). Their work showed that the oldest lunar terrainshave a crater SFD that looks like the impactors were extracted fromthe main asteroid belt by a size-independent process (e.g., perhapssweeping resonances driven by planet migration; Gomes et al.,2005; Minton and Malhotra, 2009; Strom et al., 2005). The post-mare terrains, however, have a crater SFD that looks like it camefrom the present-day Earth-crossing object population, with the pro-jectiles pulled out of the main belt via a size-dependent process (e.g.,the Yarkovsky thermal drift forces combined with dynamical reso-nances; Morbidelli and Vokrouhlický, 2003).
A final note of caution is warranted here. While the similarity be-tween the existing main belt and ancient lunar terrains identified byStrom et al. (2005) may indeed represent evidence for the LC, wefind it at least remotely conceivable that a comparable signaturecould come from a long-lived leftover planetesimal population grad-ually transitioning into a population dominated by Earth-crossing ob-jects delivered from the main belt. For this model to explain theStrom et al. (2005) observations, it would need to do the following:(i) the population itself would need to collisionally evolve into thesame shape as the main belt size-frequency distribution, and (ii) itwould need to decay much more slowly than suggested by existingdynamical models (e.g., Bottke et al., 2007).
In fact, if a LC took place, and early crater records were not obliterat-ed by this process, the lunar crater record should show two transitions.The first would be between the earliest population of impactors, pre-sumably a combination of leftover planetesimals from terrestrial planetaccretion and early ejected members of small body reservoirs, and alater LC population potentially produced by the dynamical destabiliza-tion of those small body reservoirs. The second would be between LCprojectiles and the same near-Earth object (NEO) population that ap-pears to have dominated the production of lunar craters over the last~3 Ga. Our work here focuses on ancient lunar crater populations inthe hope that a careful analysis of recent high quality lunar data mightreveal the nature of the putative first transition, i.e. between the earlyand LC impactor populations. Here we show, using new crater countsof some of the oldest lunar terrains, that a fingerprint of this transitiondoes exist, and that it supports the lunar cataclysm hypothesis.
2. Terrain selection
Crater identification and counts were performed on the digital ter-rain model (DTM) produced by the Lunar Orbiter Laser Altimeter
(LOLA) (Smith et al., 2010) on board the Lunar Reconnaissance Orbit-er (LRO) spacecraft. The resolution of the DTM was 64-pixel-per-de-gree. During the crater identification processes, we also comparedLOLA DTM to comparable resolution shaded relief maps producedby Lunar Orbiter and Clementine (data available at http://www.mapaplanet.org/explorer/moon.html).
Crater counting was performed with a semi-automated codeaccording to the following steps: i) the regions of interest were divid-ed in sub-regions of about 10×10 deg2; ii) within each sub-region,craters (identified by visual inspection) were registered by mouseclicking on 5 points over their rims; iii) the 5 selected points areused to perform a circular best fit, returning the center position andthe diameter of the craters; iv) all identified craters are saved on anASCII file for post processing. Crater size frequency distributions arebuilt selecting craters which lay within given regions of interest. Inthis work we focus on craters larger than about 15 km, because smal-ler craters may be severely affected by secondary craters (i.e. formedby fragment ejected by other craters; Wilhelms, 1987; Wilhelms etal., 1978) and thus they can strongly alter subsequent analysis.
An important issue was to assess how our crater counts relate tothose that existed in the literature (e.g., Head et al., 2010; Neukumand Ivanov, 1994; Strom et al., 2005; Wilhelms, 1987). The mainproblem in performing such a comparison arises from the choice ofthe terrains. In most cases, published crater counts are not accompa-nied by a detailed map showing the boundaries of the terrains used.The choice of the terrains is indeed crucial, in particular for the oldestterrains that may suffer from episodes of partial resurfacing (e.g., viaformation of nearby basins and volcanic eruptions). Nevertheless, inorder to validate our crater identification and diameter estimate, weperformed several tests with well-known individual craters and cra-ter SFDs over some large basins from Wilhelms (1987). We also com-pared our counts with the global catalog of craters >20 km by Headet al. (2010). For the former, those tests indicate that the discrepancyin our crater diameter estimates is of the order of 1– 3% for individualcraters. We also found that our crater SFDs are in fairly good agree-ment (within the error bars) for terrains near or inside a number oflunar basins (e.g., Apollo, Birkhoff). For the latter, comparisons oversimilar regions showed that the crater counts were within the count-ing Poissonian error bars. Although it is sometimes unclear on whatterrains the crater counts were made that appear in the literature,we explicitly identify our regions of interest in the following sections.
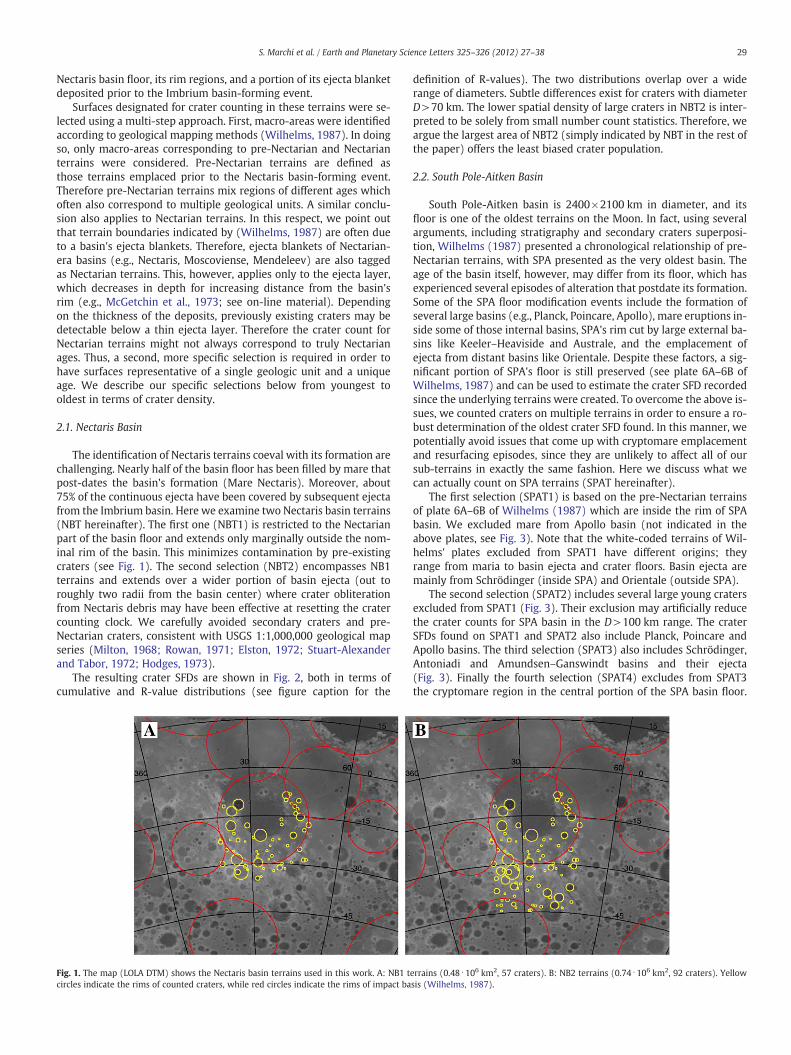
To determine if there is a transition between an older decliningbombardment crater population, or what we will refer to here asthe “early population”, and a younger LC crater population, or whatwe refer to here as a “late population”, we examined three sets of ter-rains. The first two correspond to some of the most ancient terrainson the Moon, where the putative early and late populations are likelyto be combined together in some fashion. The first region analyzedcorresponds to a wide portion of the Pre-Nectarian terrains on thenorthern far side. The second region includes Pre-Nectarian terrainson the floor of the largest impact basin on the Moon, South Pole-Aitken (SPA) basin. For our third region, we wanted to examinelunar terrains that formed well after the oldest terrains, yet one thatstill was older than the transition to the present day Earth-crossingpopulation. Our hypothesis is that this younger terrain would hope-fully be dominated by the late population. We also wanted a largearea that would allow us to avoid small number crater statistics andproduce a broad range of crater diameters. Our choice was to examinethe region near the 860 km diameter Nectaris basin, roughly thetwelfth youngest basin on the Moon and a benchmark used to definetime periods on the Moon (Wilhelms, 1987). Nectaris is also the clos-est large basin to the Apollo 16 landing site. If Apollo 16 samples weredominated by ejecta from this basin, its radiometric age could be asyoung as 3.92 Ga (Stöffler and Ryder, 2001), although impact litholo-gies with still speculative provenance have been found with ages of4.1–4.2 Ga (Norman et al., 2010). In our work, we examined the
29S. Marchi et al. / Earth and Planetary Science Letters 325–326 (2012) 27–38
Nectaris basin floor, its rim regions, and a portion of its ejecta blanketdeposited prior to the Imbrium basin-forming event.
Surfaces designated for crater counting in these terrains were se-lected using a multi-step approach. First, macro-areas were identifiedaccording to geological mapping methods (Wilhelms, 1987). In doingso, only macro-areas corresponding to pre-Nectarian and Nectarianterrains were considered. Pre-Nectarian terrains are defined asthose terrains emplaced prior to the Nectaris basin-forming event.Therefore pre-Nectarian terrains mix regions of different ages whichoften also correspond to multiple geological units. A similar conclu-sion also applies to Nectarian terrains. In this respect, we point outthat terrain boundaries indicated by (Wilhelms, 1987) are often dueto a basin's ejecta blankets. Therefore, ejecta blankets of Nectarian-era basins (e.g., Nectaris, Moscoviense, Mendeleev) are also taggedas Nectarian terrains. This, however, applies only to the ejecta layer,which decreases in depth for increasing distance from the basin'srim (e.g., McGetchin et al., 1973; see on-line material). Dependingon the thickness of the deposits, previously existing craters may bedetectable below a thin ejecta layer. Therefore the crater count forNectarian terrains might not always correspond to truly Nectarianages. Thus, a second, more specific selection is required in order tohave surfaces representative of a single geologic unit and a uniqueage. We describe our specific selections below from youngest tooldest in terms of crater density.
2.1. Nectaris Basin
The identification of Nectaris terrains coeval with its formation arechallenging. Nearly half of the basin floor has been filled by mare thatpost-dates the basin's formation (Mare Nectaris). Moreover, about75% of the continuous ejecta have been covered by subsequent ejectafrom the Imbrium basin. Here we examine two Nectaris basin terrains(NBT hereinafter). The first one (NBT1) is restricted to the Nectarianpart of the basin floor and extends only marginally outside the nom-inal rim of the basin. This minimizes contamination by pre-existingcraters (see Fig. 1). The second selection (NBT2) encompasses NB1terrains and extends over a wider portion of basin ejecta (out toroughly two radii from the basin center) where crater obliterationfrom Nectaris debris may have been effective at resetting the cratercounting clock. We carefully avoided secondary craters and pre-Nectarian craters, consistent with USGS 1:1,000,000 geological mapseries (Milton, 1968; Rowan, 1971; Elston, 1972; Stuart-Alexanderand Tabor, 1972; Hodges, 1973).
The resulting crater SFDs are shown in Fig. 2, both in terms ofcumulative and R-value distributions (see figure caption for the
Fig. 1. The map (LOLA DTM) shows the Nectaris basin terrains used in this work. A: NB1 tcircles indicate the rims of counted craters, while red circles indicate the rims of impact ba
definition of R-values). The two distributions overlap over a widerange of diameters. Subtle differences exist for craters with diameterD>70 km. The lower spatial density of large craters in NBT2 is inter-preted to be solely from small number count statistics. Therefore, weargue the largest area of NBT2 (simply indicated by NBT in the rest ofthe paper) offers the least biased crater population.
2.2. South Pole-Aitken Basin
South Pole-Aitken basin is 2400×2100 km in diameter, and itsfloor is one of the oldest terrains on the Moon. In fact, using severalarguments, including stratigraphy and secondary craters superposi-tion, Wilhelms (1987) presented a chronological relationship of pre-Nectarian terrains, with SPA presented as the very oldest basin. Theage of the basin itself, however, may differ from its floor, which hasexperienced several episodes of alteration that postdate its formation.Some of the SPA floor modification events include the formation ofseveral large basins (e.g., Planck, Poincare, Apollo), mare eruptions in-side some of those internal basins, SPA's rim cut by large external ba-sins like Keeler–Heaviside and Australe, and the emplacement ofejecta from distant basins like Orientale. Despite these factors, a sig-nificant portion of SPA's floor is still preserved (see plate 6A–6B ofWilhelms, 1987) and can be used to estimate the crater SFD recordedsince the underlying terrains were created. To overcome the above is-sues, we counted craters on multiple terrains in order to ensure a ro-bust determination of the oldest crater SFD found. In this manner, wepotentially avoid issues that come up with cryptomare emplacementand resurfacing episodes, since they are unlikely to affect all of oursub-terrains in exactly the same fashion. Here we discuss what wecan actually count on SPA terrains (SPAT hereinafter).
The first selection (SPAT1) is based on the pre-Nectarian terrainsof plate 6A–6B of Wilhelms (1987) which are inside the rim of SPAbasin. We excluded mare from Apollo basin (not indicated in theabove plates, see Fig. 3). Note that the white-coded terrains of Wil-helms' plates excluded from SPAT1 have different origins; theyrange from maria to basin ejecta and crater floors. Basin ejecta aremainly from Schrödinger (inside SPA) and Orientale (outside SPA).
The second selection (SPAT2) includes several large young cratersexcluded from SPAT1 (Fig. 3). Their exclusion may artificially reducethe crater counts for SPA basin in the D>100 km range. The craterSFDs found on SPAT1 and SPAT2 also include Planck, Poincare andApollo basins. The third selection (SPAT3) also includes Schrödinger,Antoniadi and Amundsen–Ganswindt basins and their ejecta(Fig. 3). Finally the fourth selection (SPAT4) excludes from SPAT3the cryptomare region in the central portion of the SPA basin floor.
errains (0.48 ⋅106 km2, 57 craters). B: NB2 terrains (0.74 ⋅106 km2, 92 craters). Yellowsis (Wilhelms, 1987).

Crater diameter (km)
10-6
10-5
10-4
Cum
ulat
ive
num
ber
(km
-2)
NBT1NBT2
1001010010Crater diameter (km)
10-2
10-1
100
R v
alue
NBT1NBT2
BA
Fig. 2. Comparison between Nectaris basin NBT1 and NBT2 crater SFDs. Panel A) shows the cumulative values per unit surface while panel B) the relative values (R-values). R-valuesare computed by cumulative crater SFD normalized to a power law D−2 (Crater Analysis Techniques Working Group et al., 1979). Error bars correspond to the square root of thecount (Poisson statistics) for each bin.
30 S. Marchi et al. / Earth and Planetary Science Letters 325–326 (2012) 27–38
The region covered by cryptomare is defined according to Gibson andJolliff (2011).
The resulting crater SFDs are shown in Fig. 4. The four distribu-tions shown here are in overall good agreement, confirming our as-sessment that the crater SFD of SPA is robust. The main differencebetween SPAT1 and SPAT2 is in the 100bDb200 km range and maybe caused by small number statistics. SPAT2 and SPAT3 differ slightlyfor Db50 km, though they are in good agreement for Db50 km.SPAT3's deficit of smaller craters may be due to erasure of smaller cra-ters in SPAT3 by subsequent basin formation (e.g., Schrödinger, Anto-niadi, Amundsen–Ganswindt, and Schrödinger–Zeeman). Finally,SPAT3 and SPAT4 are basically identical, which implies that the cryp-tomare region did not significantly modify our crater counts overmost of the diameter ranges discussed in this paper. It is possible,though, that cryptomare may have obliterated some of the smallest
Fig. 3. The maps (LOLA DTMs) show the SPA basin terrains used in this work. A: SPAT1 terraiterrains (3.16 ⋅106 km2, 497 craters). D: SPAT4 terrains (2.86 ⋅106 km2, 458 craters). Yellowbasis (Wilhelms, 1987).
craters considered here. For this reason in subsequent analysis ofSPAT crater SFDs, we limit our consideration to D >20 km.
Our interpretation is that SPAT2 (simply indicated as SPAT in therest of the paper) is the most representative of the SPA basin floor,and therefore it has been used in the remainder of our analysis.
2.3. Pre-Nectarian terrains outside SPA basin
Several pre-Nectarian terrains (PNTs) are located outside of theSPA basin (see Plate 6A–6B of Wilhelms, 1987). They are largelymade up of basin floors and ejecta blankets, yet they encompass awide range of geological properties. They have also been affected bysubsequent basin formation and distal ejecta. An interesting questionis whether specific PNT terrains were formed after the SPA basin,were reset by the SPA basin and therefore have the same age as the
ns (2.09 ⋅106 km2, 389 craters). B: SPAT2 terrains (2.41 ⋅106 km2, 429 craters). C: SPAT3circles indicate the rims of counted craters, while red circles indicate the rims of impact

Crater diameter (km)
10-7
10-6
10-5
10-4
SPAT1SPAT2SPAT3SPAT4
10 100 10 100Crater diameter (km)
10-2
10-1
100
R v
alue
SPAT1SPAT2SPAT3SPAT4
A B
Cum
ulat
ive
num
ber
(km
-2)
Fig. 4. Comparison among cumulative (A) and relative-value (B) crater SFDs within the South Pole-Aitken basin. See text for further details.
31S. Marchi et al. / Earth and Planetary Science Letters 325–326 (2012) 27–38
SPA basin, or could actually be older than the SPA basin. We take nostand on this issue, but the chronological relationships of some basinsto the SPA basin are admittedly weak (e.g., Lorentz, Birkhoff and Cou-lomb–Sarton). This issue warrants a closer examination in the futureusing imagery data from LRO.
To make sure our results were not affected by concerns over pre-cise geologic boundaries, we divided PNTs into several sectors andtreated them separately. The first selection (PNT1) is considered thelargest part of the northern Pre-Nectarian terrains (see plate 6B ofWilhelms, 1987; see Fig. 5). These terrains appear to be less affectedby basin formation than any other pre-Nectarian terrains on thelunar far side outside of the rim of SPA basin. The second selection(PNT2) is similar to PNT1, but includes some young large craters(see Section 2.2). Because the resulting crater SFDs show negligibledifferences (see Fig. 6), we choose to use PNT2.
To address the possibility of contamination of PNT2 by ejecta fromSPA, we also examined PNT3 and PNT4. Both correspond to PNT2 ter-rains that have been limited to angular distances from the center ofSPA by >90° and >110°, respectively. For similar reasons, we investi-gated two very old units close to SPA's rim. PNT5 is near the center ofthe far side and is exterior to the Keeler–Heaviside basin. PNT6 is onthe nearside and is comprised of the region between Mutus–Vlacq,Australe and SPA basins (Fig. 5).
The resulting crater SFDs are shown in Fig. 6. The general agree-ment among PNT2 through PNT6 indicates that there are no discern-ible systematic effects of secondary cratering with regards toincreasing distance from SPA's rim or that any other basin (e.g.,Imbrium, Orientale). The spread in crater spatial densities, particular-ly for PNT5 and PNT6, is likely due to limited crater counting areasand small number statistics. The selected terrains are also at differentdistances from the Imbrium basin, which is known to have producedlarge secondary craters (Wilhelms, 1987). Thus, the overall stabilityof the crater SFDs also rule out a significant contamination of second-ary craters from Imbrium basin. The rest of the discussion below willuse crater SFDs from PNT2 (indicated for simplicity by PNT).
Fig. 6 also shows crater counts from the lunar highlands that werereported in Strom et al. (2005). While some small differences existbecause we used different crater bin sizes than Strom et al., ourPNT2 terrains essentially agree with their SFDs for 30bDb200 km.The small discrepancies that do exist, namely for Db30 km andD>200 km, are likely caused by the different terrain choices. In par-ticular, the Strom et al. (2005) crater SFD was constructed using the
nearside highlands for Db180 km and the whole lunar surface forD>180 km.
3. Comparative analysis of the observed crater SFDs
Fig. 7 shows our measured crater SFDs for our three terrains. Atfirst glance, several things stand out. First, while PNT has a higher sur-face crater density than SPAT for 15bDb60 km, both are within errorbars within the range 60bDb150 km. Second, for D>300 km, PNT ishigher than SPAT by a factor of ~2, although the statistics are poorat these crater sizes. Third, the crater density on NBT is lower thanboth SPAT and PNT, as expected given its presumed relatively youn-ger age.
Perhaps the most intriguing observation, however, is that all of thecrater SFDs are well reproduced by two-sloped distributions up toD=150 km (see Fig. 8). The slope of a crater SFD is defined asΔlog(N)/Δlog(D), where N is the cumulative density of craters. Wefound these slopes by plotting the crater data for each terrain inlog-log space and then fitting lines (or power laws) to the small andlarge craters over specific size ranges. The intersection between thederived slopes for the small and large craters was defined as Delbow.By calculating the slopes in this manner, we hope to minimize any is-sues generated by the stochastic nature of cratering itself, namely thatcrater SFDs do not always perfectly reproduce the shape of the impac-tor SFD.
Our crater ranges for small and large craters were carefully chosenfor each terrain, partly to maximize the amount of crater data avail-able for each fit, but also to exclude the intermediate regions wherethe distributions pass from one slope to the other. For small D andlarge D, we selected [15, 50] km, [70, 100] km for NBT; [20, 50] km,[60, 150] km for SPAT; and [15, 40] km, [60, 150] km for PNT. Notethat SPAT craters smaller than 20 km have been excluded becausetheir number may have been affected by cryptomare (seeSection 2.2). Computing the weighted mean values for the slopesfrom PNT, SPAT and NBT together, we found best fits for −1.25±0.03 over small crater diameters and −2.6±0.1 over larger ones,respectively.
We conclude that the three terrains share remarkably similarslopes for their small and large crater populations. With this said,we found that Delbow varies substantially from one distribution to an-other, with the most heavily cratered terrains have Delbow at smallersizes than those on less cratered, younger terrains. Thus, the crater

Fig. 5. The maps (LOLA DTMs) show the pre-Nectarian terrains used in this work. A: PNT1 terrains (1.52 ⋅106 km2, 382 craters). B: PNT2 terrains (1.75 ⋅106 km2, 415 craters).C: PNT3 terrains (1.37 ⋅106 km2, 344 craters). D: PNT4 terrains (0.91 ⋅106 km2, 188 craters). E: PNT5 terrains (0.35 ⋅106 km2, 86 craters). F: PNT6 terrains (0.49 ⋅106 km2, 121 cra-ters). Yellow circles indicate the rims of counted craters, while red circles indicate the rims of impact basis (Wilhelms, 1987).
32 S. Marchi et al. / Earth and Planetary Science Letters 325–326 (2012) 27–38
SFDs are alike in particular ways but very different in other ways. Wefound the differences suggestive enough to pursue them further inthe following section.
4. Are the crater SFDs on PNT and SPAT statistically different?
In order to quantify the differences between the observed craterSFDs and their Delbow values, we turned to Monte Carlo simulations ofhow these cratered terrains were plausibly created. For each trial, wecreated random craters drawn from a source function that duplicatedthe observed cumulative crater SFD for each terrain. Once the observednumber of craters was created, we used the procedure above to mea-sure the slopes for small and large D. The elbow position Delbow wasthen determined by calculating the intercept of the correspondingtwo best fit lines. This was done 1000 times for each crater SFD.
The resulting distributions of Delbow values were then used as ameasure of how statistical fluctuations in the creation of these craterSFDs modify the observed Delbow value. Our work indicates that theDelbow 68.2% (1σ) level of confidence intervals for PNT, SPAT, NBTare [37.9, 54.9] km, [56.6, 66.2] km and [59.8, 75.0] km, respectively.Similarly, the median values of Delbow are 47.7 km, 61.9 km, 68.3 km.We find it interesting that the ∼1σ intervals reported above aredisjoint. This means that a single crater production function (witha single Delbow value) is extremely unlikely to have made all three ofour crater SFDs and can be ruled out at the ∼2σ level.
An alternative way to understand this result is the following.Assume that a single production function is responsible for the craterSFDs on PNT and SPAT. This would imply that the difference in countsfor D>20 km craters is due to the terrains having different ages.Then, multiply the crater SFD on SPAT by a factor 1.27, so that the

1000Crater diameter (km)
10-7
10-6
10-5
10-4
PNT1PNT2HL
10-2
10-1
100
R v
alue
PNT1PNT2HL
Crater diameter (km)
10-7
10-6
10-5
10-4
PNT3PNT4PNT5PNT6PNT2
Crater diameter (km)
10-2
10-1
100
R v
alue
PNT3PNT4PNT5PNT6PNT2
10 100 1000Crater diameter (km)
10 100
100010 100 100010 100
Cum
ulat
ive
num
ber
(km
-2)
Cum
ulat
ive
num
ber
(km
-2)
Fig. 6. Comparsion among the several Pre-Nectarian terrains investigated. Top panels: Comparison between PNT1 and PNT2 crater SFDs. The lunar highland crater SFD of Strom etal. (2005) is also reported (HL). Bottom panels: Comparison among PNT2 through PNT6 crater SFDs.
33S. Marchi et al. / Earth and Planetary Science Letters 325–326 (2012) 27–38
two cumulative SFDs coincide at D=20 km. This change causes thecrater SFDs to separate by more than their respective error bars inthe range 50bDb90 km. In particular, the re-scaled crater SFD forSPAT, once multiplied by the appropriate area, would predict that73±8.5 craters with D>60 km formed on PNT. Instead, the observednumber of D>60 km craters observed on PNT is 54±7.3. The possi-bility that 54±7.3 craters formed if 73±8.5 were expected can alsobe ruled out at the 2.2σ level.
We conclude from this that the Delbow differences between thetwo oldest terrains, PNT and SPAT, are unlikely to be statistical fluctu-ations. Using similar arguments, the same is true for the younger NBTas well. Thus, the observation that Delbow values grow larger as onemoves from older terrains like PNT to younger terrains like SPATand NBT appears robust.
5. On the possible sources of the differences among crater SFDs
5.1. Crater saturation
One concern about our interpretation above involves the potentialinfluence of crater saturation. Saturation takes place when the density
of craters on a given surface exceeds some threshold value, such thatnewly-formed craters erase pre-existing ones (Gault, 1970). Whenthis occurs, the surface density of craters cannot continue to increasewith time, though the shape of the crater SFD can potentially be influ-enced by newly-formed craters. Given that the crater SFDs on PNTand SPAT overlap in the range 60bDb150 km, a possible explanationmight be that these terrains reached crater saturation at these sizes.
To investigate whether our terrains were influenced by saturation,we first examined whether some regions of the Moon were moredensely cratered than PNT. Along these lines, we counted craters onthe Pre-Nectarian Al-Khwarizmi-King terrain (AKKT) as defined byWilhelms (1987). We found that this terrain, though smaller thanPNT, has crater densities that are 30% higher than PNT between25bDb60 km. It also appears to have a similar Delbow value to PNT,though small numbers crater statistics beyond D>60 km prevent usfrom considering this a robust result (see on-line material). As afollow-up, we examined crater statistics from Head et al. (2010),who was first to use the LOLA database to count D>20 km craterson the Moon. Their work indicates there are several lunar regionswith higher crater densities than PNT (i.e., some are 1.5× higher,with a D>20 km crater density of 0.28 km−2 vs. 0.17 km−2 for our

Crater diameter (km)
10-7
10-6
10-5
10-4
PNTSPATNBTHL
Crater diameter (km)
10-1
R v
alue
PNTSPATNBTHL
A B
Cum
ulat
ive
num
ber
(km
-2)
100010 100 100010 100
Fig. 7. Crater size-frequency distributions of the selected terrains. The distributions reportedhere correspond to ourfinal terrain choice:NBT, SPAT, PNT stand for NBT2, SPAT2 and PNT2 ofprevious plots. A: Comparison of the cumulative crater SFDs. The lunar highland crater SFD of Strom et al. (2005) is also reported (HL). B: Relative value distributions. Both panels A and Bshow that PNT and SPAT crater SFDs overlap in the interval 60bDb150 km, while they differ for 15bDb60 km. NBT is less cratered (i.e., younger) than both PNT and SPAT.
34 S. Marchi et al. / Earth and Planetary Science Letters 325–326 (2012) 27–38
PNT). Together, these results demonstrate that lunar crater densitycan locally exceed PNT values, thereby implying that PNT (and SPATand NBT) are not saturated. This conclusion is in agreement with pre-vious observational studies (Strom, 1977; Strom et al., 2005).
Second, we decided to investigate crater saturation using an im-proved version of the crater formation/evolution model by Bottkeand Chapman (2006). Our code simulates the random formation ofcraters on a square surface according to a input production function.Craters are defined by their rims, and when more than 70% of a cra-ter's rim is removed by overlapping craters, the crater is removedfrom the count. The code tracks the progress of the crater SFDthroughout the simulation. In this manner, the overall approach ofour code mimics those described in the literature (Chapman andMcKinnon, 1986; Richardson, 2009; Woronow, 1985).
Crater obliteration in the code is modeled by considering that,when a new crater (D) is formed, it destroys a portion of the rim of
10 100Crater diameter (km)
Ver
tical
ly s
cale
d cu
mul
ativ
e di
stri
butio
ns
PNTSPATNBT
~D-2.60~D
-1.25
Fig. 8. Comparison of PNT, SPAT and NBT crater SFDs. The distributions have been ver-tically rescaled for a better comparison. The dashed lines approximate the observedcrater SFDs for small D. These lines are parallel, thus they show that PNT, SPAT andNBT have the same slopes. A similar conclusion applies for large D (see solid lines).
a crater underneath (Du), but only if Dn>Du/f, where Dn=kD. Inthese expressions f and k (f,k≥1) are parameters that simulate theobliteration processes: f takes into account the capability of small cra-ters to erase the rims of larger ones; while k increases the effectivearea of erasing, as for instance in the presence of significant ejectablanket and/or seismic shaking. Note that for the crater productionfunctions investigated in this paper, f and k are essentially inter-changeable. Thus, for a given f, increasing k would produce thesame results as keeping k fixed and increasing f. While the parametersf,k are unknown a priori, they can potentially be calibrated usingbenchmark data. Here we set these parameters using one of thebest examples of saturated terrain known in the existing lunar data,namely the ∼106 craters counted in the Sinus Medii region (Gault,1970). Fig. 9 (upper panels) shows the best fit achieved with f∼9,k∼1 (in agreement with previous runs by Bottke and Chapman,2006). As far as we know, no other crater evolution code has testedtheir results against this or any comparable data set, yet this is crucialif one is to avoid non-uniqueness issues in chosen model parameters.
Using the same parameters used to fit SinusMedii craters, we simu-lated crater formation on PNT (see Fig. 9, bottom panels). Our resultssuggest that PNT is not expected to be saturated.With this said, howev-er, the crater SFDs of PNT and Sinus Medii have different size ranges, sowe cannot rule out that a different choice of f,k could apply for PNT. Forexample, Head et al. (2010) found that the formation of Orientale basinpartially erased D>20 km craters up to two radii from the basin's cen-ter. In our code, this would translate into k∼1.5. This is a likely upperlimit, with smaller craters perhaps having more difficulty erasing near-by craters than basins, but even the application of k=1.5 to all cratersizes does not allow PNT to enter into saturation (see on-line material).We underline that our finding that PNT is not saturated while themuchyounger Sinus Medii is saturated is indeed possible given the differentcrater size range investigated on these terrains.
It is interesting to note that our results are discordant withRichardson (2009), who found the Strom et al. (2005) crater SFD onthe lunar highlands was indeed saturated. This conclusion was reachedusing a differentmodel of crater erasure than ours; it performs the samebasic functions as our code but it also includes regolith displacementsby seismic shaking and the burial of craters via ejecta blanketing. Wetake no issue with their results, but merely point out that the predic-tions of saturation in either code depends on model parameters thatmay be difficult to constrain given the current state of knowledge. Re-gardless, even if the lunar highlands and PNT were in saturation, both

Fig. 9. Upper panels: The plot report the crater SFD for the saturated lunar Sinus Medii region (Gault, 1970). The SFD is shown in a cumulative fashion in the left panel and in an R-plot in the right panel. The lines correspond to the best fit, achieved for f=9 and k=1. The dashed lines indicated the production population (i.e., no crater obliteration), while thesolid curves correspond to the population of crater left on the surface (i.e., taking into account obliteration processes). Bottom panels: The plots show the evolution of the craterrecord for f=9, k=1 and a two-sloped production function having q=−1.25 for DbDelbow and q=−2.6 for D>Delbow, where Delbow=47.7 km (best value for PNT). The positionof the elbow is marked by the vertical dashed line. The curves are color-coded according to the total number of impacts received, from blue (less cratered, younger surface) to red(more cratered, older surface). Dashed curves indicate the production functions, while solid ones indicate the crater SFDs of the retained craters. The red dots with error bars showthe observed crater SFD on PNT.
35S. Marchi et al. / Earth and Planetary Science Letters 325–326 (2012) 27–38
codes agree with the findings of Chapman and McKinnon (1986), whoshowed that it would not affect the shape of this particular crater SFDover the size range of interest (see Fig. 9).1 Thus, even if PNT weresaturated, its crater SFD could still be compared with SPAT and NBT toinvestigate pre- and post-LC evolution.
Taken together, these results indicate that crater saturation cannotbe the explanation of the intriguing similarities and differences be-tween the crater SFDs on PNT, SPAT, and NBT. Something else is likelyafoot.
5.2. Impactor SFD and target properties
Another potential way to explain the observed differences in cra-ter SFDs between PNT, SPAT and NBT is that the shape of impactor
1 Note that saturation behaves in substantial different ways depending on the slopeof the crater SFD. For crater SFDs having slopes shallower than power law −2, the sat-urated crater SFD keep its original shape. For slopes steeper than −2, the saturatedcrater SFD gets a constant slope equal to −2. This explains why, in the case of SinusMedii, saturation introduced a clear change in the slope of the crater SFD, while thesame would not happen to PNT.
SFD changed with time. We find this plausible, but the subtle natureof the changes needed makes us believe that this is an unlikely wayto explain observations.
For example, as shown by Strom et al. (2005), the impactor SFDthat made craters on the lunar highlands also fits PNT (see Fig. 7)and is a reasonable match for the current main belt asteroid SFD. Nu-merical models indicate that the main belt has experienced extensivecollisional evolution (Bottke et al., 2005), and that a population start-ing with main belt-like initial conditions, perhaps common amonginner solar system planetesimal populations, quickly evolves towardan equilibrium distribution that has the same shape as today's mainbelt SFD. To get substantial differences away from this kind of equilib-rium, some parameter(s) need to change in a major way (e.g., a largebreakup event takes place, a new population is added to the system,etc.). These kinds of events, however, have to be perfectly tuned to ef-fectively make a two-sloped SFD shift to larger sizes. In all of thecollision evolution models we have run to date, we have yet to seesuch behavior in any runs.
Similarly, contributions from populations having different SFDscannot be ruled out, but they would need to be perfectly tuned to ex-plain observations (i.e., similar to the main belt SFD, only shifted in

36 S. Marchi et al. / Earth and Planetary Science Letters 325–326 (2012) 27–38
every size domain, or a population with physical parameters that al-lows their craters at every size to look like a shifted main belt SFD).This conclusion may make it unlikely for lunar craters to have amajor contribution of cometary impactors, unless they can fit theabove criteria. As a side note, we point out that the highly siderophileelement signatures of lunar samples appear to indicate that cometsdid not play a major role in the Moon's early bombardment phase(Kring and Cohen, 2002).
Target properties also play a role in the cratering process, and po-tentially may affect the shape of the crater SFDs. The size of a cratermade by a projectile depends on many factors, including target struc-ture (hard rock vs loose material), density, and mechanical strength.The craters discussed in this paper form in the gravity regime, thus,mechanical strength is not expected to play an important role. Simi-larly, target density should be similar from place to place on theMoon, and it also has a weak influence on crater size (∼ρ−0.3). Infact, depending on how this parameter was manipulated, it couldeven produce the opposite effect what is needed to explain observa-tions (i.e., if all other parameters are constant, higher density terrainssuch as the floor of SPA may produce smaller craters than low densityterrains like PNT). Finally, according to crater scaling relationships, achange in target structure should also produce a change in the slopeof the crater SFD. This is not observed. Indeed the nearly identicalslopes of the crater SFDs of our terrains and the consistent shift inelbow positions from older to younger terrains appear to us to bestrong constraints that are difficult to explain using the effects de-scribed above.
Thus, while we agree that some ad-hoc combination of the aboveparameters might be able to reproduce observations, we would alsoargue that those conditions will most likely run the gamut from un-likely to unphysical.
6. Discussion and implications
In the previous sections, we argued that the crater SFDs of PNT,SPAT, and NBT likely reflect the impactors that formed them, andthat their shapes are remarkably similar to one another. Their maindifference is that the location of Delbow increases as we move fromolder to younger terrains. What could cause such a change? Some
Crater diameter (km)
10-6
10-5
10-4
NBTLate Pop.
Crater d
A B
Cum
ulat
ive
num
ber
(km
-2)
10 100 10
Fig. 10. Two impactor populations best fits of the observed crater SFDs. The fit is obtained apopulation producing Delbow=45 km and Delbow=60 km. Each panel corresponds to a diffeand in particular, given the predicted shift in the impact velocity (and therefore in the crat
precedent for our situation can be found in Strom and Neukum(1988). They report that the most ancient crater SFDs found on Mer-cury, the Moon, and Mars have main belt-like shapes, but those onMercury and Mars are shifted to larger and smaller diameters, respec-tively, compared those found in the lunar highlands. One way to dothis is to assume the projectiles hit Mercury and Mars much fasterand slower, respectively, than they hit the Moon (e.g., assuming theprojectiles came from the main belt, Minton and Malhotra (2010) es-timate they hit Mercury, the Moon, and Mars at 38.1 km/s, 18.9 km/sand 12.4 km/s, respectively). By inserting these velocities into crater-scaling relationships, they found that they could reproduce the ob-served crater SFD shifts on these worlds even though target proper-ties may have also affected crater sizes (Ivanov, 2006).
Accordingly, the simplest way to explain our results is to assumethat the impactor SFD remained the same in the time interval whenPNT and Nectaris basin received most of their craters, but the impactvelocity increased between the oldest and the youngest of the threeterrains considered here (i.e., from PNT to NBT). To test this, however,we need to assess the populations hitting the Moon at different times.This is challenging because older terrains accumulate early and lateimpactors. In some fashion, we need to remove the late crater signa-tures on PNT and SPAT to explore the early ones.
Here we return to our original hypothesis, namely that the PNTand SPAT crater SFDs may have recorded, in sequence, an early andlate impactor population with distinct impact velocities and Delbow
values. As shown in Fig. 10, we assume here that NBT was hit unique-ly by an impactor population producing Delbow∼60 km. We will referto this as our “late population”. By subtracting NBT's contributionfrom PNT and SPAT, we gain a residual than can be used to estimatethe nature of the “early population”, or what originally struck PNTand SPAT. The fact that PNT and SPAT have the same slopes of NBTrequires that the early and late populations had the sameslopes. Thus, our best fits to observations show the early populationhad Delbow∼45 km rather than ∼60 km.
Overall, the early population accounts for 48% and 32% of the cra-ters D≥15 km observed on PNT and SPAT, respectively. The restcomes from the late population superposed on these terrains. The cra-ter SFDs obtained by this combination of impacting populations passthrough the error bars of all the data on all terrains, with one
iameter (km)
SPATLate Pop.Early Pop.Early+Late Pop.
Crater diameter (km)
PNTLate Pop.Early Pop.Early+Late Pop.
C
100 10 100
ssuming that each terrain records a different combination of an early and late impactorrent terrain as labeled. The presented model is able to explain the observed crater SFDs,er size) it naturally explains why SPAT and PNT partially overlap.
37S. Marchi et al. / Earth and Planetary Science Letters 325–326 (2012) 27–38
exception (the data-point at D=90 km on SPAT, which anomalouslydeviates from a smooth curve; Fig. 10B). Moreover, about 50% of thesynthetic crater SFDs generated by these production functions haveelbows within the corresponding 1-sigma confidence ranges for thethree terrains. Considering that 68.2% is the statistical measure for aperfect fit, we believe our results are reasonable.
In the light of these findings, we conclude that the observed shiftin Delbow is most likely due to a variation in mean impact velocity be-tween the early and late populations. According to Pi-group craterscaling (Schmidt and Housen, 1987), crater diameter is ∝v0.44,where v is the impact velocity. Therefore, we estimate that the shiftin Delbow from the early to the late population corresponds to a factorof ∼2 increase in impact velocity (i.e., =(60/45)1/0.44). This change issignificant enough to suggest important implications for the early his-tory of the solar system.
One way to produce the observed velocity change is through lategiant planet migration, which could modify the degree of dynamicalexcitation experienced by objects reaching or residing within theinner solar system. A numerical study of this idea (Bottke et al.,submitted for publication), within the context of the so-called Nicemodel (Gomes et al., 2005), implies that median impact velocitieson the Moon before and after giant planet migration is 9 and21 km/s, respectively. The origin of the low velocity population maybe a combination of early fugitives from the inner asteroid belt(Bottke et al., submitted for publication) and/or leftover planetesi-mals residing in the terrestrial planet region after the Moon's forma-tion (Walsh et al., 2011).
Several important benchmarks in the early lunar evolutionemerge from this work. First, the existence of distinct low and highimpact velocity populations supports the existence of a lunar cata-clysm. In particular, the high Delbow of NBT suggests that these ter-rains record a negligible contribution of the early population,implying that Nectaris basin is close to or at the onset of the LC.This result is consistent with independent modeling work by Bottkeet al. (submitted for publication) based on the overall crater densityat NBT. This makes the formation age of Nectaris basin a key datapoint in understanding the evolution of the solar system.
Second, despite the lack of precise age measurements for our old-est terrains, it is clear that PNT and SPAT preserve a record of impactsof low velocity impacts, many which may have come before the LCfrom the early population. PNT was struck by nearly the sameamount of pre-LC and LC impactors. This implies that PNT is veryold. Our interpretation that the cataclysm started near the formationtime of Nectaris basin also implies that the ancient SPA basin did notform during the LC but instead was derived from an earlier phase oflunar history. The fact that SPAT records at least some of the lowvelocity population provides additional support for this idea, thoughprecise modeling is needed to better understand the very beginningof the LC. Depending on the solidification time of the lunar crust (e.g.,Elkins-Tanton et al., 2011) and the early populations impactflux, both surfaces potentially recorded hundreds of My of pre-Nectarian history. This sets the stage for using crater data from an-cient lunar terrains to constrain terrestrial planet formation models,at least as far as their predictions for the impact flux of leftoverplanetesimals.
Third, we find that PNT has as much as twice the early populationrecorded on its terrain than SPAT, implying a clear difference in thecratering retention age between the two terrains. While our workdoes not constrain whether the SPAT crater retention age is substan-tially younger than or similar in age to SPA basin itself, we find thelatter possibility provocative and worthy of additional study. Perhapsa re-analysis of the Moon using LRO or GRAIL data will show that SPAbasin is much younger than previously thought.
Finally, we find that despite its oft-used name, the lunar cataclysmonly accounted for roughly half or perhaps one-third of the observedancient crater history now recorded on the Moon. Regardless, the
surprisingly and unusual impact velocity fingerprint described herepotentially provides additional evidence that the early solar systemrearranged itself hundreds of millions years after the first solidsformed.
Acknowledgment
Simone Marchi (SM) started this project in 2008 while at PaduaUniversity. As his appreciation of the knowledge and numerical sub-tlety needed to bring this project to fruition grew, so did the author-ship list. Between 2008 and 2012, not only did new lunar databecome available from LRO, but also SM moved to different institutes(OCA in Nice first, then NASA's Lunar Science Institute in Boulder,CO). During this time, SM prepared multiple drafts of this manuscript,each one reviewed, de-assembled, and put back together in a strongerform as he and his co-authors learned more and more about crateringprocesses and the Moon itself. In total, this work took advantage ofuntold numbers of discussions with crater and lunar experts. Wewish to thank all of them for their criticisms and positive commentsthat made this document what it is today. In particular, we wish tothank our three EPSL reviewers: N. G. Barlow; N. Artemieva and G.Collins. The contributions of SM, W. F. Bottke, and D. A. Kring weresupported by the NASA Lunar Science Institute (Center for LunarOrigin and Evolution at the Southwest Research Institute inBoulder, CO - NASA Grant NNA09DB32A; Center for Lunar Scienceand Exploration at the Lunar and Planetary Institute in Houston,TX). A. Morbidelli and SM are grateful to the Helmholtz Alliance"Planetary Evolution and Life" for support. This is LPI ContributionNo. 1655.
Appendix A. Supplementary data
Supplementary data to this article can be found online at doi:10.1016/j.epsl.2012.01.021.
References
Bottke,W.F., Chapman, C.R., 2006. 37th Annual Lunar and Planetary Science Conference,37, p. 1349.
Bottke, W.F., Durda, D.D., Nesvorný, D., Jedicke, R., Morbidelli, A., Vokrouhlický, D.,Levison, H.F., 2005. Icarus 179, 63.
Bottke, W.F., Levison, H.F., Nesvorný, D., Dones, L., 2007. Icarus 190, 203.Bottke et al., Nature, submitted for publication.Chapman, C.R., McKinnon, W.B., 1986. IAU Colloq. 77: Some Background about Satellites,
492.Chapman, C.R., Cohen, B.A., Grinspoon, D.H., 2007. Icarus 189, 233.Cohen, B.A., Swindle, T.D., Kring, D.A., 2000. Science 290, 1754.Crater Analysis Techniques Working GroupArvidson, R.E., Boyce, J., et al., 1979. Icarus
37, 467.Elkins-Tanton, L.T., Burgess, S., Yin, Q.-Z., 2011. Earth Planet. Sci. Lett. 304, 326.Elston, D.P., 1972. USGS Geologic map of the Colombo quadrangle (I-714).Gault, D.E., 1970. Radio Sci. 5, 273.Gibson, K.E., Jolliff, B.L., 2011. Lunar and Planetary Institute Science Conference
Abstracts, 42, p. 2326.Gomes, R., Levison, H.F., Tsiganis, K., Morbidelli, A., 2005. Nature 435, 466–469.Hartmann, W.K., 1975. Icarus 24, 181.Hartmann, W.K., et al., 1981. Chronology of Planetary Volcanism by Comparative
Studies of Planetary Craters, Basaltic Volcanism on the Terrestrial Planets.Pergamon Press, Elmsford, NY, pp. 1050–1127.
Hartmann, W.K., Quantin, C., Mangold, N., 2007. Icarus 186, 11.Haskin, L.A., Korotev, R.L., Rockow, K.M., Jolliff, B.L., 1998. Meteorit. Planet. Sci. 33,
959.Head, J.W., Fassett, C.I., Kadish, S.J., Smith, D.E., Zuber, M.T., Neumann, G.A., Mazarico,
E., 2010. Science 329, 1504.Hodges, C.A., 1973. USGS Geologic map of the Langrenus quadrangle (I-739).Ivanov, B.A., 2006. Icarus 183, 504.Kring, D.A., Cohen, B.A., 2002. J. Geophys. Res. Planets 107, 5009.Marchi, S., Mottola, S., Cremonese, G., Massironi, M., Martellato, E., 2009. Astron. J. 137,
4936.McGetchin, T.R., Settle, M., Head, J.W., 1973. Earth Planet. Sci. Lett. 20, 226.Milton, D.J., 1968. USGS Geologic map of the Theophilus quadrangle (I-546).Minton, D.A., Malhotra, R., 2009. Nature 457, 1109.Minton, D.A., Malhotra, R., 2010. Icarus 207, 744.Morbidelli, A., Vokrouhlický, D., 2003. Icarus 163, 120.Morbidelli, A., Petit, J.-M., Gladman, B., Chambers, J., 2001. Meteorit. Planet. Sci. 36, 371.

38 S. Marchi et al. / Earth and Planetary Science Letters 325–326 (2012) 27–38
Neukum, G., Ivanov, B.A., 1994. Hazards Due to Comets and Asteroids. p. 359.Norman, M.D., Duncan, R.A., Huard, J.J., 2010. Geochim. Cosmochim. Acta 74, 763–783.Richardson, J.E., 2009. Icarus 204, 697.Rowan, L.C., 1971. USGS Geologic map of the Rupes Altai quadrangle (I-690).Ryder, G., 2002. J. Geophys. Res. Planets 107, 5022.Schmidt, R.M., Housen, K.R., 1987. Int. J. Impact Eng. 5, 543.Smith, D.E., et al., 2010. J. Geophys. Res. 37, 18204.Stöffler, D., Ryder, G., 2001. Space Sci. Rev. 96, 9.Strom, R.G., 1977. Phys. Earth Planet. Inter. 15, 156.Strom, R.G., Neukum, G., 1988. Mercury. University of Arizona Press, p. 336.Strom, R.G., Malhotra, R., Ito, T., Yoshida, F., Kring, D.A., 2005. Science 309, 1847.
Stuart-Alexander, D.E., Tabor, R.W., 1972. USGS Geologic map of the Fracastoriusquadrangle (I-720).
Tera, F., Papanastassiou, D.A., Wasserburg, G.J., 1974. Earth Planet. Sci. Lett. 22, 1.Turner, G., Cadogan, P.H., Yonge, C.J., 1973. Proc. Fourth Lunar Sci. Conf. pp. 1889–1914.Walsh, K.J., Morbidelli, A., Raymond, S.N., O'Brien, D.P., Mandell, A.M., 2011. Nature
475, 206.Wetherill, G.W., 1977. Meteoritics 12, 387.Wilhelms, D.E., 1987. The Geologic History of the Moon. (U.S. Geol. Surv. Prof. Pap. 1348).Wilhelms, D.E., Oberbeck, V.R., Aggarwal, H.R., 1978. Lunar and Planetary Science
Conference Proceedings, 9, p. 3735.Woronow, A., 1985. J. Geophys. Res. 90, 817.