
e-Procurement @ IOCL€¦ · · 2018-02-16e-Procurement @ IOCL Smart Procurement t Application of...
9
e-Procurement @ IOCL Smart Procurement – Application of ICT and other tools Presented By: Sh. O P Tiwari General Manager - Information System, IOCL Global Procurement Summit 2018
Transcript of e-Procurement @ IOCL€¦ · · 2018-02-16e-Procurement @ IOCL Smart Procurement t Application of...
e-Procurement @ IOCL Smart Procurement – Application of ICT and other tools
Presented By:
Sh. O P Tiwari
General Manager - Information System, IOCL
Global Procurement Summit 2018

• OBJECTIVES
• E-PROCUREMENT JOURNEY
• CRITICAL SUCCESS FACTORS
• FUNCTIONAL BENEFITS
• PERFORMANCE BENEFITS
• GREEN BENEFITS
Table of Contents

R O B U S T M E C H A N I S M
S E C U R I T Y & C O M P L I A N C E
PA P E R L E S S PA R T I C I PAT I O N
Objectives
TR AN S PAR E N CY
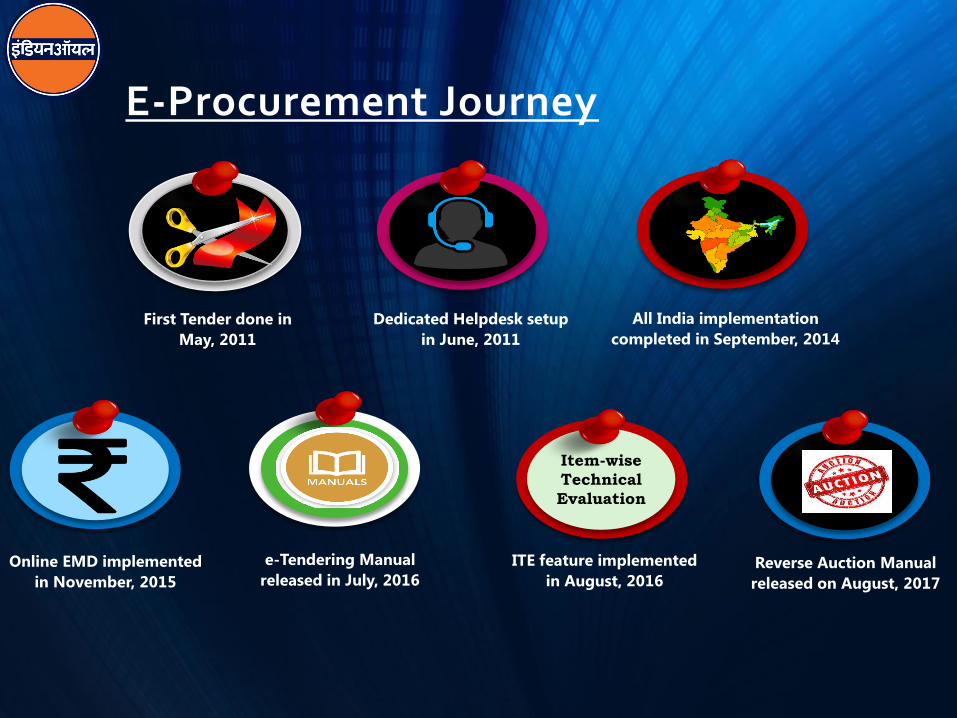
E-Procurement Journey
Item-wise
Technical
Evaluation
First Tender done in
May, 2011
Dedicated Helpdesk setup
in June, 2011
All India implementation
completed in September, 2014
Online EMD implemented
in November, 2015
ITE feature implemented
in August, 2016
e-Tendering Manual
released in July, 2016
Reverse Auction Manual
released on August, 2017

Critical Success Factors
Earning Support of &
engaging Top Management
Establishing
Support
Infrastructure
Educating Bidders
of all corporate sizes
spread across India & beyond
Continuous training of internal users for
Policy update & System enhancements

Functional Benefits
IOCL e-Tendering Portal
User Management : Authentication &
Authorization
Report Management
Reduction in complaints, litigation and RTI Queries
Completely Digital Process
Procurement Governance
24X7 system availability
Increased Participation leading to better competition & prices received
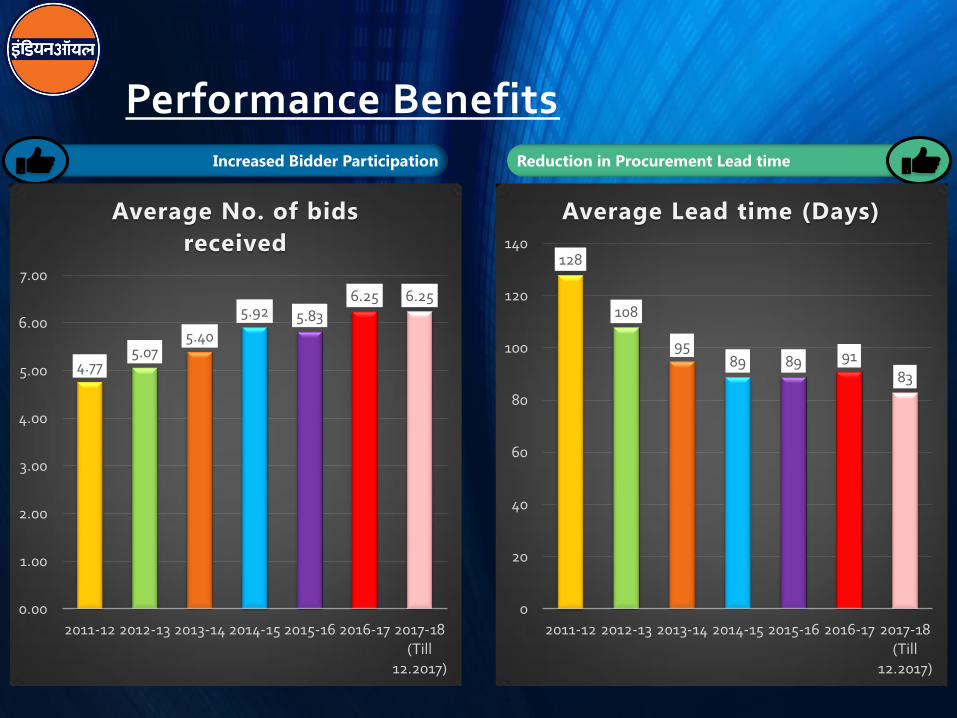
Performance Benefits
Increased Bidder Participation Reduction in Procurement Lead time
4.77 5.07
5.40
5.92 5.83
6.25 6.25
0.00
1.00
2.00
3.00
4.00
5.00
6.00
7.00
2011-12 2012-13 2013-14 2014-15 2015-16 2016-17 2017-18
(Till
12.2017)
Average No. of bids
received 128
108
95 89 89 91
83
0
20
40
60
80
100
120
140
2011-12 2012-13 2013-14 2014-15 2015-16 2016-17 2017-18
(Till
12.2017)
Average Lead time (Days)

Prevented CO2 release (pounds)
Green Benefits
Paperless Process Trees Saved
265
11857
29472
40337
52435
66699
46847
0
10000
20000
30000
40000
50000
60000
70000
80000
Reams Saved
16
697
1734
2373
3084
3923
2756
0
500
1000
1500
2000
2500
3000
3500
4000
4500
Trees Saved
1713
76724
190701
261006
339283
431584
303125
0
50000
100000
150000
200000
250000
300000
350000
400000
450000
500000
Prevented CO2 release
in Atmosphere (in
Pounds)
Global Procurement Summit 2018