Sales Force Automation For Managing Sales Team With Mobility

PwC Autofacts® | Strategy&
Foresight to drive the industryApril 2020
E-Mobility SalesReview Q2 2020
PwC Autofacts® | Strategy&
Electrification highlighted
0. Executive summary and outlook
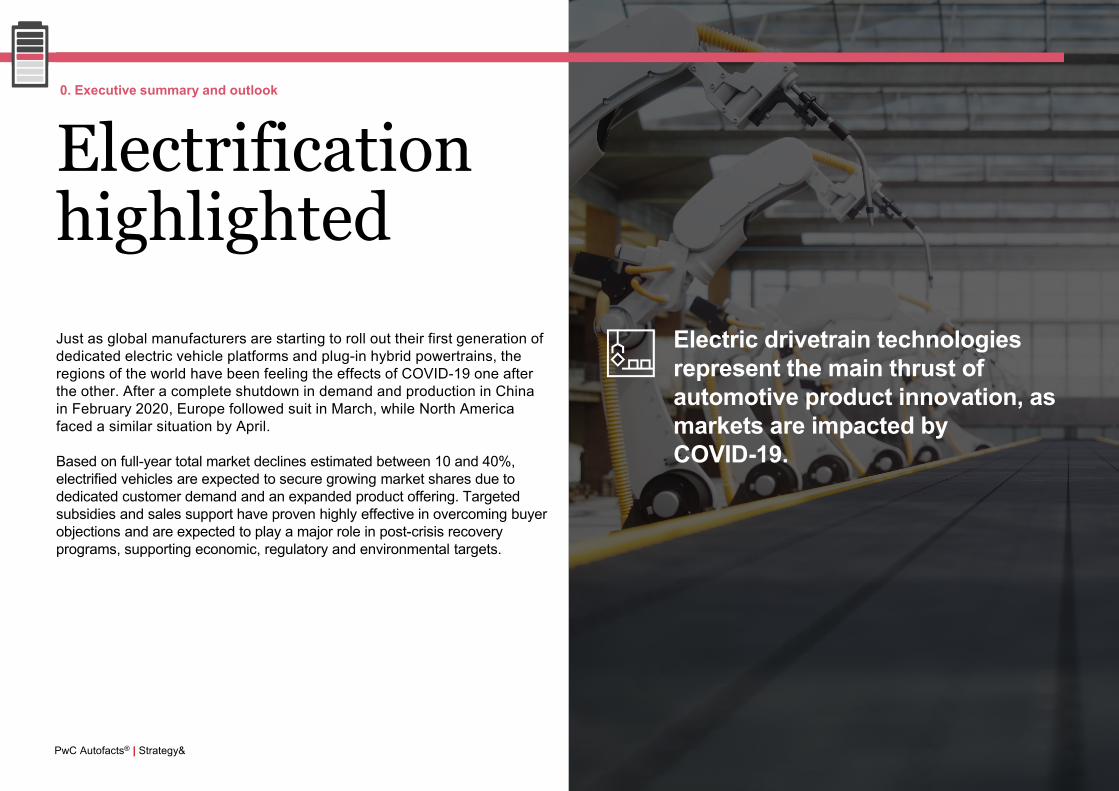
Just as global manufacturers are starting to roll out their first generation of dedicated electric vehicle platforms and plug-in hybrid powertrains, the regions of the world have been feeling the effects of COVID-19 one after the other. After a complete shutdown in demand and production in China in February 2020, Europe followed suit in March, while North America faced a similar situation by April.
Based on full-year total market declines estimated between 10 and 40%, electrified vehicles are expected to secure growing market shares due to dedicated customer demand and an expanded product offering. Targeted subsidies and sales support have proven highly effective in overcoming buyer objections and are expected to play a major role in post-crisis recovery programs, supporting economic, regulatory and environmental targets.
Electric drivetrain technologies represent the main thrust of automotive product innovation, as markets are impacted by COVID-19.
PwC Autofacts® | Strategy&
Global EV sales stalled in Q1
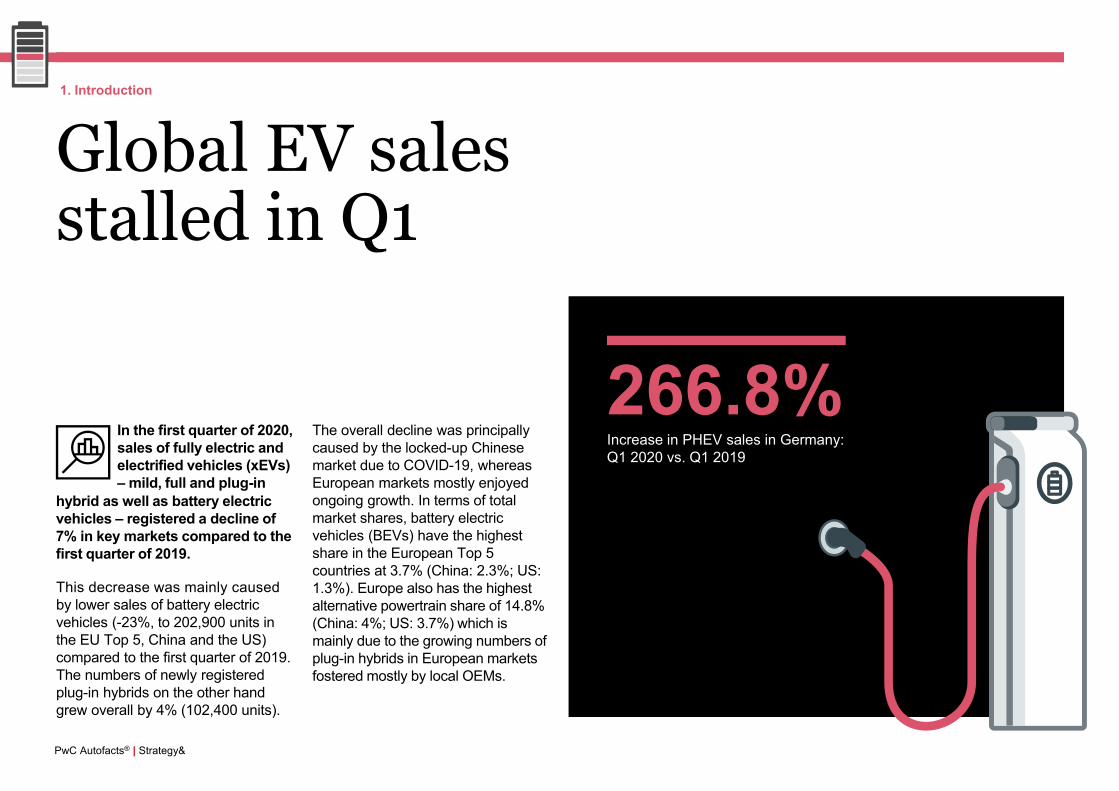
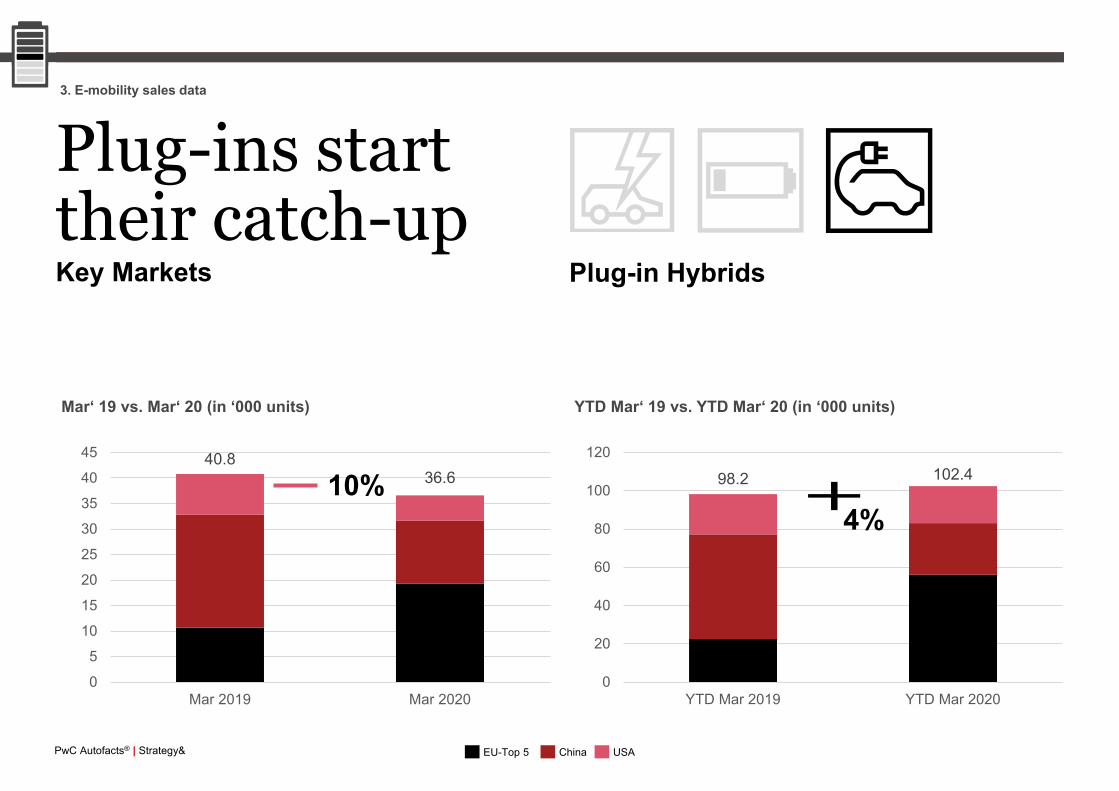
266.8%Increase in PHEV sales in Germany: Q1 2020 vs. Q1 2019
1. Introduction
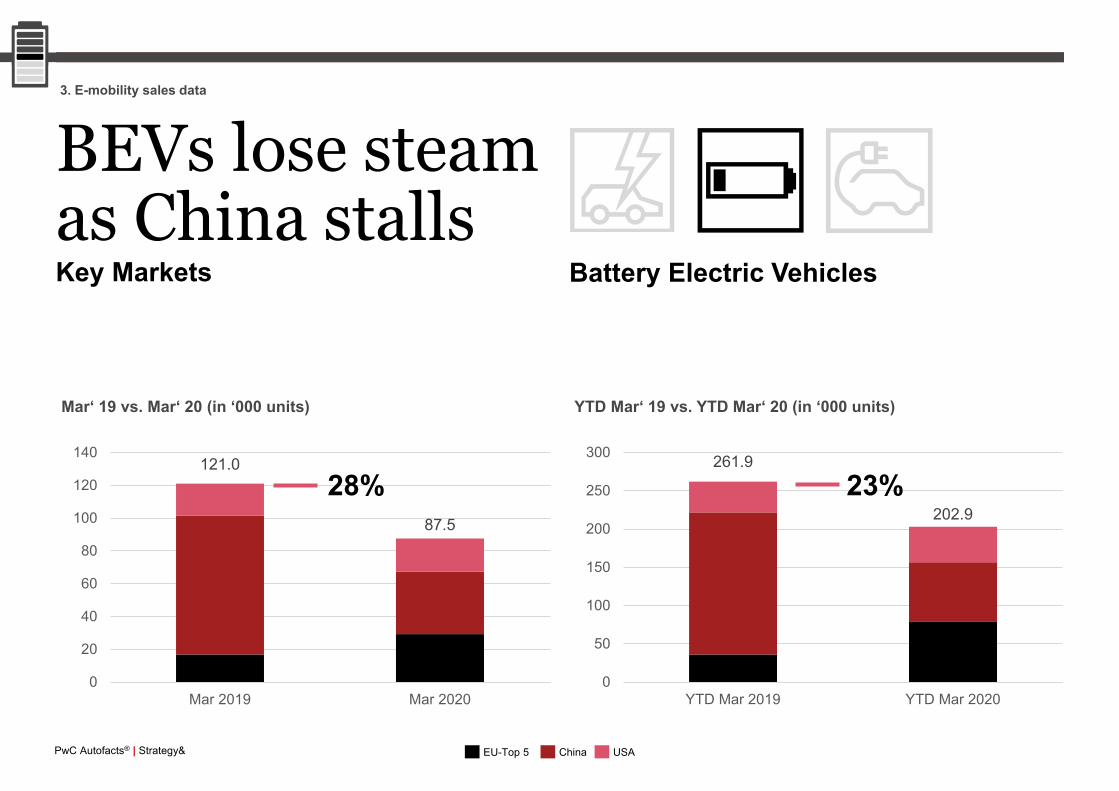
This decrease was mainly caused by lower sales of battery electric vehicles (-23%, to 202,900 units in the EU Top 5, China and the US) compared to the first quarter of 2019. The numbers of newly registered plug-in hybrids on the other hand grew overall by 4% (102,400 units).
The overall decline was principally caused by the locked-up Chinese market due to COVID-19, whereas European markets mostly enjoyed ongoing growth. In terms of total market shares, battery electric vehicles (BEVs) have the highest share in the European Top 5 countries at 3.7% (China: 2.3%; US: 1.3%). Europe also has the highest alternative powertrain share of 14.8% (China: 4%; US: 3.7%) which is mainly due to the growing numbers of plug-in hybrids in European markets fostered mostly by local OEMs.
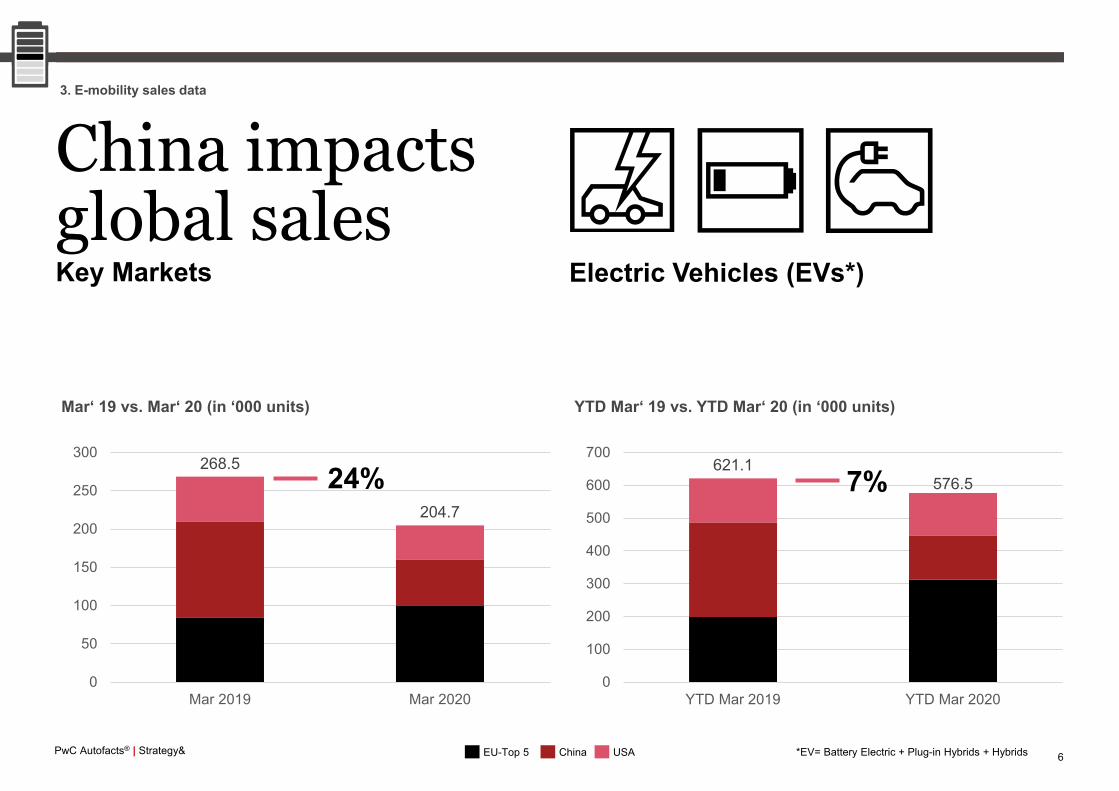
In the first quarter of 2020, sales of fully electric and electrified vehicles (xEVs) – mild, full and plug-in
hybrid as well as battery electric vehicles – registered a decline of 7% in key markets compared to the first quarter of 2019.
PwC Autofacts® | Strategy&
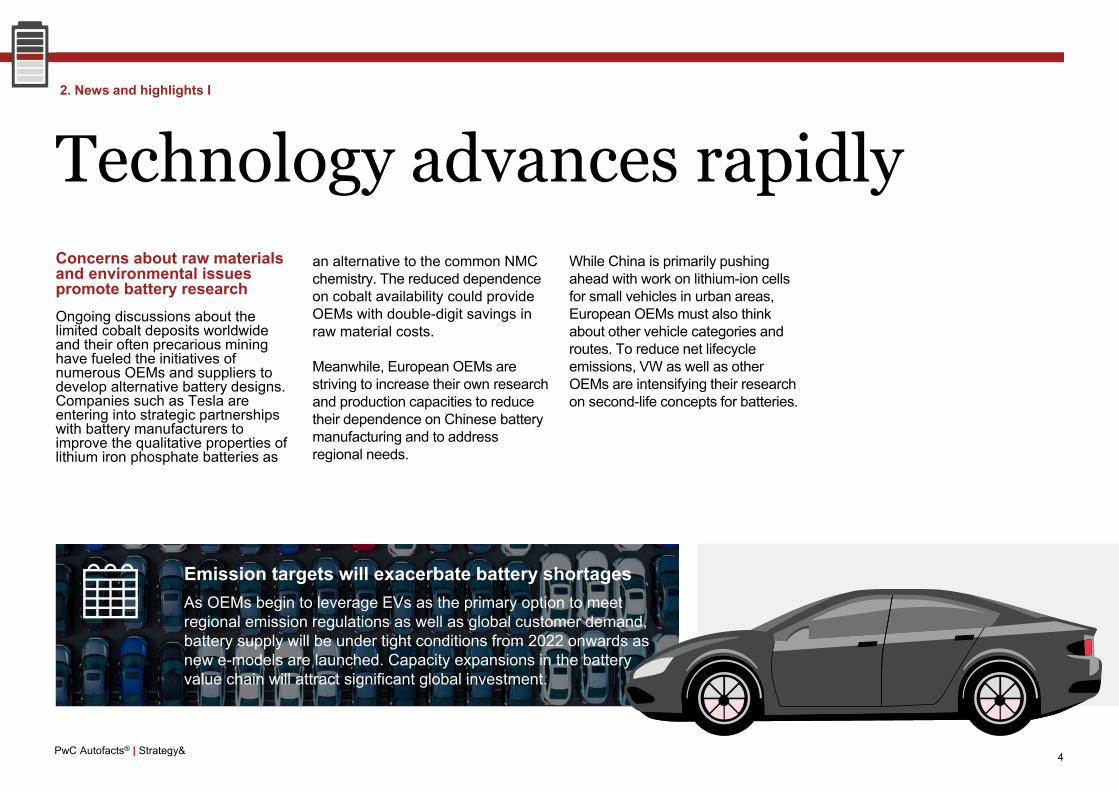
Technology advances rapidlyConcerns about raw materials and environmental issues promote battery researchOngoing discussions about the limited cobalt deposits worldwide and their often precarious mining have fueled the initiatives of numerous OEMs and suppliers to develop alternative battery designs. Companies such as Tesla are entering into strategic partnerships with battery manufacturers to improve the qualitative properties of lithium iron phosphate batteries as
an alternative to the common NMC chemistry. The reduced dependence on cobalt availability could provide OEMs with double-digit savings in raw material costs.
Meanwhile, European OEMs are striving to increase their own research and production capacities to reduce their dependence on Chinese battery manufacturing and to address regional needs.
Emission targets will exacerbate battery shortagesAs OEMs begin to leverage EVs as the primary option to meet regional emission regulations as well as global customer demand, battery supply will be under tight conditions from 2022 onwards as new e-models are launched. Capacity expansions in the battery value chain will attract significant global investment.
4
2. News and highlights I
While China is primarily pushing ahead with work on lithium-ion cells for small vehicles in urban areas, European OEMs must also think about other vehicle categories and routes. To reduce net lifecycle emissions, VW as well as other OEMs are intensifying their research on second-life concepts for batteries.
PwC Autofacts® | Strategy&
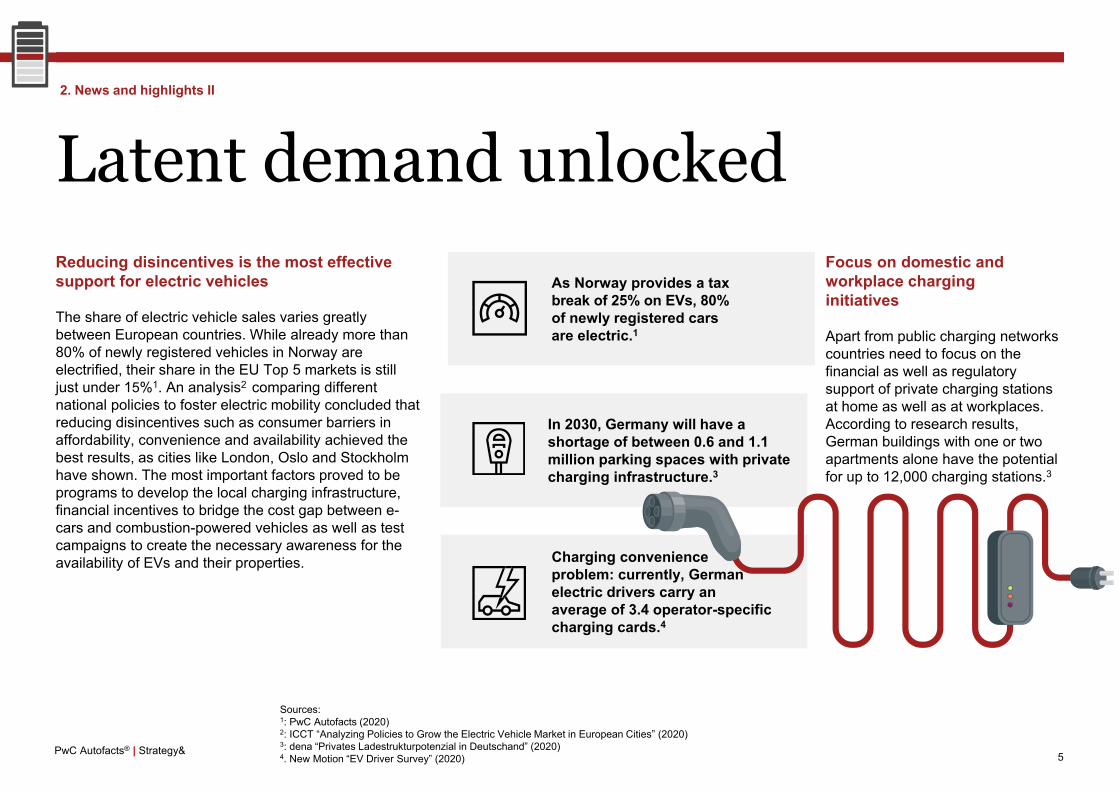
Latent demand unlocked
Sources:1: PwC Autofacts (2020)2: ICCT “Analyzing Policies to Grow the Electric Vehicle Market in European Cities” (2020)3: dena “Privates Ladestrukturpotenzial in Deutschand” (2020)4. New Motion “EV Driver Survey” (2020)
Focus on domestic and workplace charging initiatives
Apart from public charging networks countries need to focus on the financial as well as regulatory support of private charging stations at home as well as at workplaces. According to research results, German buildings with one or two apartments alone have the potential for up to 12,000 charging stations.3
As Norway provides a tax break of 25% on EVs, 80% of newly registered cars are electric.1
In 2030, Germany will have a shortage of between 0.6 and 1.1 million parking spaces with private charging infrastructure.3
Charging convenience problem: currently, German electric drivers carry an average of 3.4 operator-specific charging cards.4
5
Reducing disincentives is the most effective support for electric vehicles
The share of electric vehicle sales varies greatly between European countries. While already more than 80% of newly registered vehicles in Norway are electrified, their share in the EU Top 5 markets is still just under 15%1. An analysis2 comparing different national policies to foster electric mobility concluded that reducing disincentives such as consumer barriers in affordability, convenience and availability achieved the best results, as cities like London, Oslo and Stockholm have shown. The most important factors proved to be programs to develop the local charging infrastructure, financial incentives to bridge the cost gap between e-cars and combustion-powered vehicles as well as test campaigns to create the necessary awareness for the availability of EVs and their properties.
2. News and highlights II
PwC Autofacts® | Strategy&
Electric Vehicles (EVs*)
China impactsglobal salesKey Markets
6
3. E-mobility sales data
621.1576.5
0
100
200
300
400
500
600
700
YTD Mar 2019 YTD Mar 2020
YTD Mar‘ 19 vs. YTD Mar‘ 20 (in ‘000 units)
7%268.5
204.7
0
50
100
150
200
250
300
Mar 2019 Mar 2020
Mar‘ 19 vs. Mar‘ 20 (in ‘000 units)
24%
EU-Top 5 China USA *EV= Battery Electric + Plug-in Hybrids + Hybrids
PwC Autofacts® | Strategy&
Battery Electric Vehicles
BEVs lose steamas China stallsKey Markets
3. E-mobility sales data
261.9
202.9
0
50
100
150
200
250
300
YTD Mar 2019 YTD Mar 2020
YTD Mar‘ 19 vs. YTD Mar‘ 20 (in ‘000 units)
121.0
87.5
0
20
40
60
80
100
120
140
Mar 2019 Mar 2020
Mar‘ 19 vs. Mar‘ 20 (in ‘000 units)
28% 23%
EU-Top 5 China USA
PwC Autofacts® | Strategy&
Plug-in Hybrids
Plug-ins starttheir catch-upKey Markets
3. E-mobility sales data
98.2 102.4
0
20
40
60
80
100
120
YTD Mar 2019 YTD Mar 2020
YTD Mar‘ 19 vs. YTD Mar‘ 20 (in ‘000 units)
40.836.6
0
5
10
15
20
25
30
35
40
45
Mar 2019 Mar 2020
Mar‘ 19 vs. Mar‘ 20 (in ‘000 units)
4%10%
EU-Top 5 China USA

PwC Autofacts® | Strategy&
EU Top 5
2020 Q1 Comparison to 2019 Q1
BEV 79,000 +120%
PHEV 56,000 +149%
Hybrid 177,000 +27%
Total 313,000 +58%
France, Germany, Italy, Spain, and the UK
Although the European automotive industry was hit by the effects of COVID-19 from mid-March, registrations of electrified cars continued to grow strongly in the first quarter of 2020 compared to the equivalent quarter of last year. Within the first three months of this year, 313,000 new electrified vehicles were registered in the EU Top 5 markets, marking a total increase of 58%. The reason for this growth is to be found in both a pull factor of customers who are interested in e-mobility and a push factor of OEMs seeking to place electric vehicles in the market in order to meet CO2 fleet emission targets.Taking a closer look at the growth rates, the figures show that this boom was mainly driven by PHEVs as the strongest-growing segment (+149%) due to increasing product availability followed by BEVs with a growth rate of 120%. Registrations of hybrid cars continued to climb with a rise of 27% compared to the first quarter of 2019. These developments were fostered by stand-out markets like Germany where overall registrations went up by 81.3% with a remarkable boom in PHEVs (+266.8%; 26,407 units). European EV leaders such as the Netherlands show exponential growth rates (+40.7% regarding EV registrations), while Norway reached a market share of 80.2%.
9
4. EU Top 5

PwC Autofacts® | Strategy&
United States
USA
Registrations of PHEVs and hybrids declined by 8% and 13% respectively. However, BEV sales increased by 15% to 46,000 units compared to the first quarter of last year. This was again mainly due to best-selling vehicles like the Tesla Model 3.
The impact of COVID-19 measures on sales is expected to be severe in April 2020, as well as in the months ahead. Due to the further relaxation of federal fuel efficiency standards, automakers offer EV products for strategic and product-feature reasons rather than compliance. Given the participation of established brands as well as well-funded startups, the segment holds out the promise of intriguing new entries and significant growth prospects.
10
4. United States
2020 Q1 Comparison to 2019 Q1
BEV 46,000 +15%
PHEV 19,000 -8%
Hybrid 63,000 -13%
Total 129,000 -4%
PwC Autofacts® | Strategy&
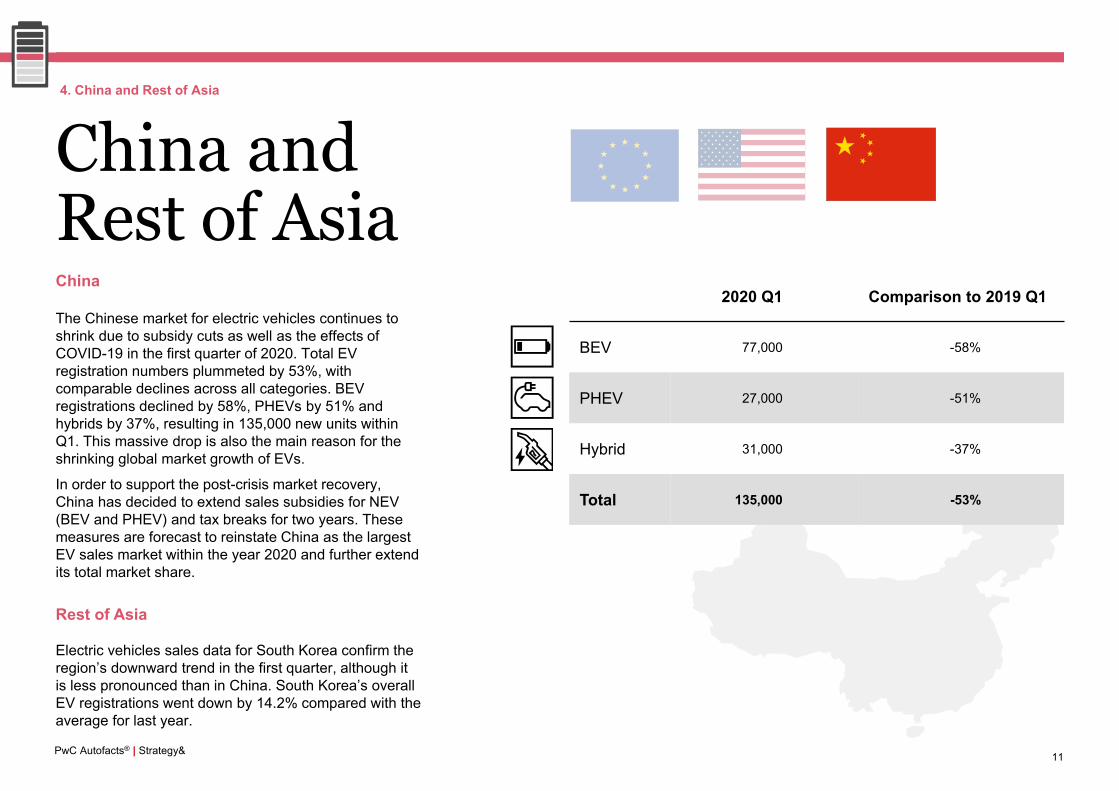
2020 Q1 Comparison to 2019 Q1
BEV 77,000 -58%
PHEV 27,000 -51%
Hybrid 31,000 -37%
Total 135,000 -53%
China and Rest of AsiaChina
The Chinese market for electric vehicles continues to shrink due to subsidy cuts as well as the effects of COVID-19 in the first quarter of 2020. Total EV registration numbers plummeted by 53%, with comparable declines across all categories. BEV registrations declined by 58%, PHEVs by 51% and hybrids by 37%, resulting in 135,000 new units within Q1. This massive drop is also the main reason for the shrinking global market growth of EVs.
In order to support the post-crisis market recovery, China has decided to extend sales subsidies for NEV (BEV and PHEV) and tax breaks for two years. These measures are forecast to reinstate China as the largest EV sales market within the year 2020 and further extend its total market share.
Rest of Asia
Electric vehicles sales data for South Korea confirm the region’s downward trend in the first quarter, although it is less pronounced than in China. South Korea’s overall EV registrations went down by 14.2% compared with the average for last year.
11
4. China and Rest of Asia
PwC Autofacts® | Strategy&
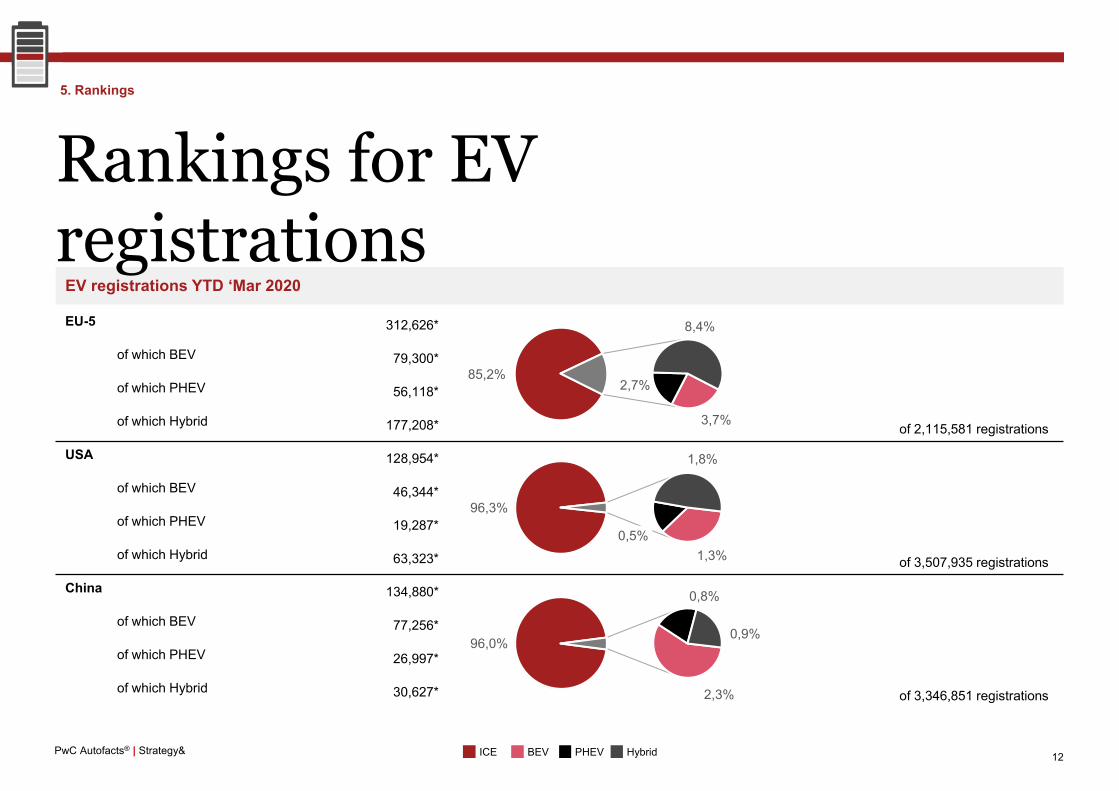
EV registrations YTD ‘Mar 2020
EU-5 312,626*
of which BEV 79,300*
of which PHEV 56,118*
of which Hybrid 177,208* of 2,115,581 registrations
USA 128,954*
of which BEV 46,344*
of which PHEV 19,287*
of which Hybrid 63,323* of 3,507,935 registrations
China 134,880*
of which BEV 77,256*
of which PHEV 26,997*
of which Hybrid 30,627* of 3,346,851 registrations
Rankings for EV registrations
12
85,2%
3,7%
2,7%
8,4%
96,3%
1,3%0,5%
1,8%
96,0%
2,3%
0,8%
0,9%
5. Rankings
ICE BEV PHEV Hybrid
PwC Autofacts® | Strategy&
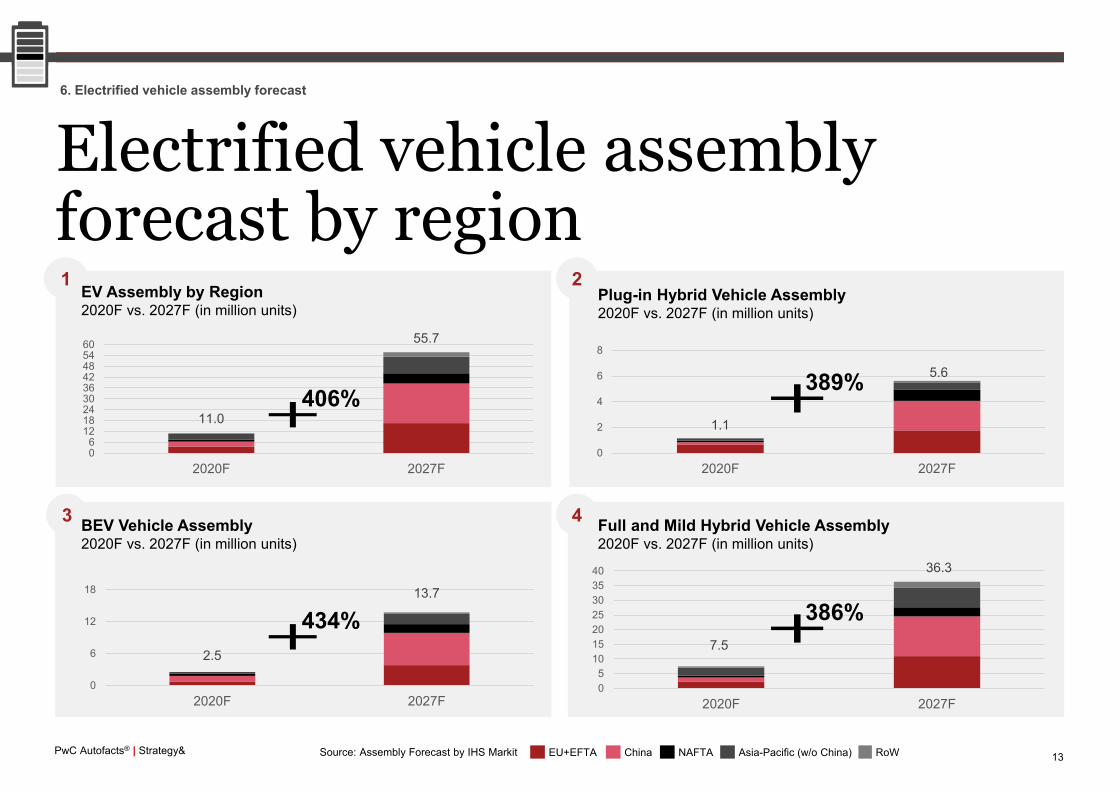
2.5
13.7
0
6
12
18
2020F 2027F
Electrified vehicle assembly forecast by region
13
11.0
55.7
06
121824303642485460
2020F 2027F
406%1.1
5.6
0
2
4
6
8
2020F 2027F
389%
7.5
36.3
05
10152025303540
2020F 2027F
1 2
43
EV Assembly by Region2020F vs. 2027F (in million units)
BEV Vehicle Assembly2020F vs. 2027F (in million units)
Full and Mild Hybrid Vehicle Assembly2020F vs. 2027F (in million units)
Plug-in Hybrid Vehicle Assembly2020F vs. 2027F (in million units)
6. Electrified vehicle assembly forecast
Source: Assembly Forecast by IHS Markit EU+EFTA China NAFTA Asia-Pacific (w/o China) RoW
386%434%
PwC Autofacts® | Strategy& 14
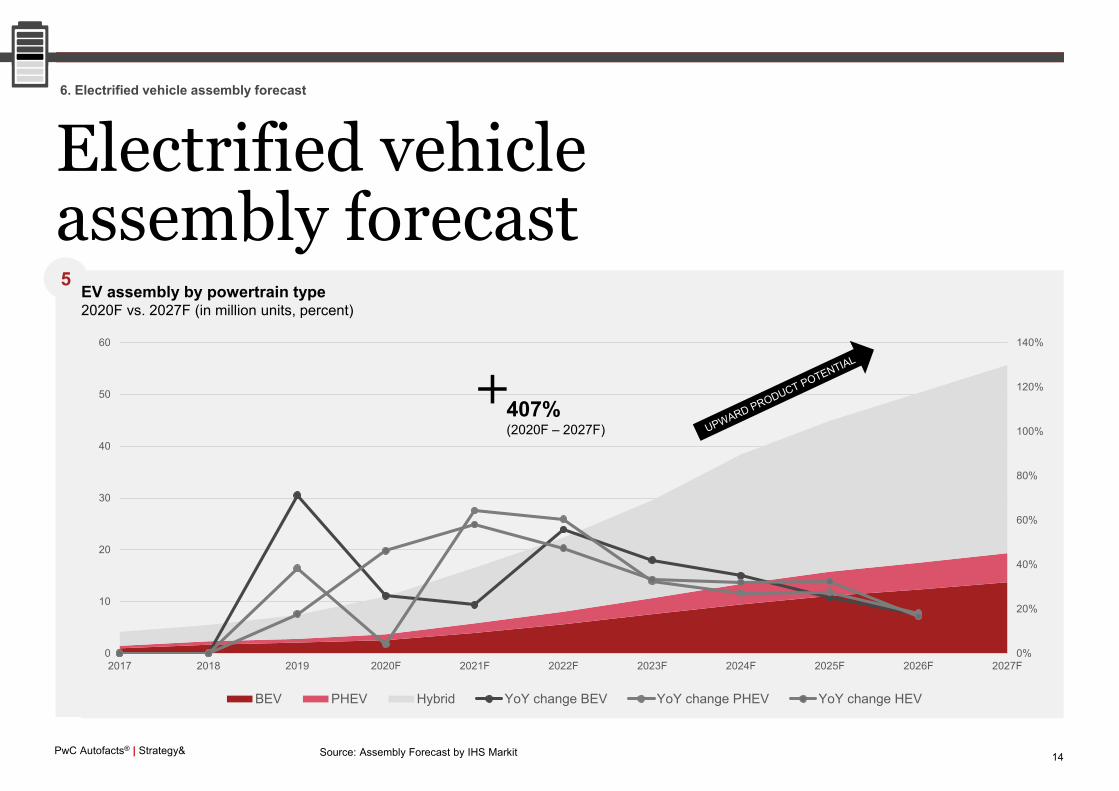
Electrified vehicleassembly forecast5
6. Electrified vehicle assembly forecast
Source: Assembly Forecast by IHS Markit
0%
20%
40%
60%
80%
100%
120%
140%
0
10
20
30
40
50
60
2017 2018 2019 2020F 2021F 2022F 2023F 2024F 2025F 2026F 2027F
BEV PHEV Hybrid YoY change BEV YoY change PHEV YoY change HEV
407%(2020F – 2027F)
EV assembly by powertrain type2020F vs. 2027F (in million units, percent)

PwC Autofacts® | Strategy&
Authors and press contact
Felix KuhnertPartner, Global Automotive Leader, PwC GermanyPhone: +49 711 [email protected]
Christoph StürmerGlobal Lead Analyst PwC Autofacts®, PwC GermanyPhone: +49 69 [email protected]
Joern NeuhausenDirector,Strategy& GermanyPhone: +49 211 [email protected]
7. Contacts
Annabelle KliesingSenior PR Lead,Strategy& GermanyPhone: +49 89 [email protected]

strategyand.pwc.com
© 2020 PwC. All rights reserved.PwC refers to the PwC network and/or one or more of its member firms, each of which is a separate legal entity. Please see pwc.com/structure for further details.Disclaimer: This content is general information purposes only, and should not be used as a substitute for consultation with professional advisors.
Thank you
PwC Autofacts® | Strategy&
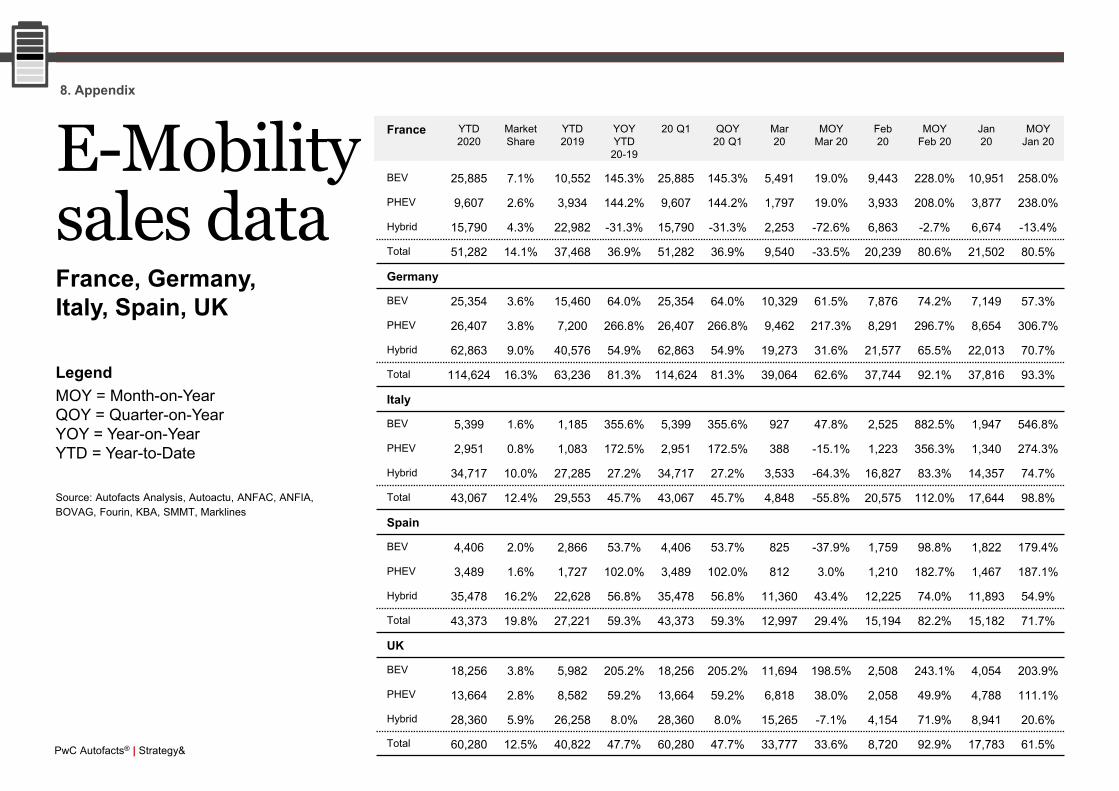
France YTD 2020
Market Share
YTD 2019
YOY YTD
20-19
20 Q1 QOY20 Q1
Mar 20
MOY Mar 20
Feb 20
MOYFeb 20
Jan 20
MOYJan 20
BEV 25,885 7.1% 10,552 145.3% 25,885 145.3% 5,491 19.0% 9,443 228.0% 10,951 258.0%
PHEV 9,607 2.6% 3,934 144.2% 9,607 144.2% 1,797 19.0% 3,933 208.0% 3,877 238.0%
Hybrid 15,790 4.3% 22,982 -31.3% 15,790 -31.3% 2,253 -72.6% 6,863 -2.7% 6,674 -13.4%
Total 51,282 14.1% 37,468 36.9% 51,282 36.9% 9,540 -33.5% 20,239 80.6% 21,502 80.5%
Germany
BEV 25,354 3.6% 15,460 64.0% 25,354 64.0% 10,329 61.5% 7,876 74.2% 7,149 57.3%
PHEV 26,407 3.8% 7,200 266.8% 26,407 266.8% 9,462 217.3% 8,291 296.7% 8,654 306.7%
Hybrid 62,863 9.0% 40,576 54.9% 62,863 54.9% 19,273 31.6% 21,577 65.5% 22,013 70.7%
Total 114,624 16.3% 63,236 81.3% 114,624 81.3% 39,064 62.6% 37,744 92.1% 37,816 93.3%
Italy
BEV 5,399 1.6% 1,185 355.6% 5,399 355.6% 927 47.8% 2,525 882.5% 1,947 546.8%
PHEV 2,951 0.8% 1,083 172.5% 2,951 172.5% 388 -15.1% 1,223 356.3% 1,340 274.3%
Hybrid 34,717 10.0% 27,285 27.2% 34,717 27.2% 3,533 -64.3% 16,827 83.3% 14,357 74.7%
Total 43,067 12.4% 29,553 45.7% 43,067 45.7% 4,848 -55.8% 20,575 112.0% 17,644 98.8%
Spain
BEV 4,406 2.0% 2,866 53.7% 4,406 53.7% 825 -37.9% 1,759 98.8% 1,822 179.4%
PHEV 3,489 1.6% 1,727 102.0% 3,489 102.0% 812 3.0% 1,210 182.7% 1,467 187.1%
Hybrid 35,478 16.2% 22,628 56.8% 35,478 56.8% 11,360 43.4% 12,225 74.0% 11,893 54.9%
Total 43,373 19.8% 27,221 59.3% 43,373 59.3% 12,997 29.4% 15,194 82.2% 15,182 71.7%
UK
BEV 18,256 3.8% 5,982 205.2% 18,256 205.2% 11,694 198.5% 2,508 243.1% 4,054 203.9%
PHEV 13,664 2.8% 8,582 59.2% 13,664 59.2% 6,818 38.0% 2,058 49.9% 4,788 111.1%
Hybrid 28,360 5.9% 26,258 8.0% 28,360 8.0% 15,265 -7.1% 4,154 71.9% 8,941 20.6%
Total 60,280 12.5% 40,822 47.7% 60,280 47.7% 33,777 33.6% 8,720 92.9% 17,783 61.5%
8. Appendix
E-Mobilitysales dataFrance, Germany, Italy, Spain, UK
Source: Autofacts Analysis, Autoactu, ANFAC, ANFIA, BOVAG, Fourin, KBA, SMMT, Marklines
LegendMOY = Month-on-Year QOY = Quarter-on-Year YOY = Year-on-YearYTD = Year-to-Date
PwC Autofacts® | Strategy&
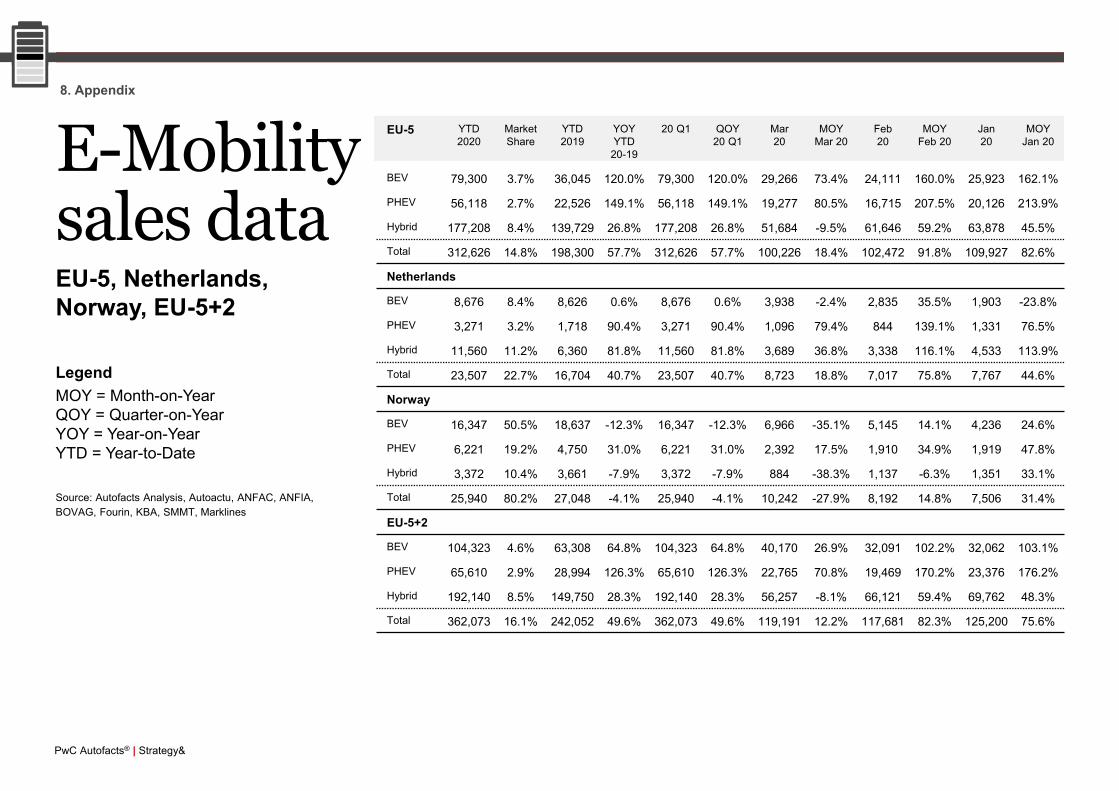
EU-5 YTD 2020
Market Share
YTD 2019
YOY YTD
20-19
20 Q1 QOY20 Q1
Mar 20
MOY Mar 20
Feb 20
MOYFeb 20
Jan 20
MOYJan 20
BEV 79,300 3.7% 36,045 120.0% 79,300 120.0% 29,266 73.4% 24,111 160.0% 25,923 162.1%
PHEV 56,118 2.7% 22,526 149.1% 56,118 149.1% 19,277 80.5% 16,715 207.5% 20,126 213.9%
Hybrid 177,208 8.4% 139,729 26.8% 177,208 26.8% 51,684 -9.5% 61,646 59.2% 63,878 45.5%
Total 312,626 14.8% 198,300 57.7% 312,626 57.7% 100,226 18.4% 102,472 91.8% 109,927 82.6%
Netherlands
BEV 8,676 8.4% 8,626 0.6% 8,676 0.6% 3,938 -2.4% 2,835 35.5% 1,903 -23.8%
PHEV 3,271 3.2% 1,718 90.4% 3,271 90.4% 1,096 79.4% 844 139.1% 1,331 76.5%
Hybrid 11,560 11.2% 6,360 81.8% 11,560 81.8% 3,689 36.8% 3,338 116.1% 4,533 113.9%
Total 23,507 22.7% 16,704 40.7% 23,507 40.7% 8,723 18.8% 7,017 75.8% 7,767 44.6%
Norway
BEV 16,347 50.5% 18,637 -12.3% 16,347 -12.3% 6,966 -35.1% 5,145 14.1% 4,236 24.6%
PHEV 6,221 19.2% 4,750 31.0% 6,221 31.0% 2,392 17.5% 1,910 34.9% 1,919 47.8%
Hybrid 3,372 10.4% 3,661 -7.9% 3,372 -7.9% 884 -38.3% 1,137 -6.3% 1,351 33.1%
Total 25,940 80.2% 27,048 -4.1% 25,940 -4.1% 10,242 -27.9% 8,192 14.8% 7,506 31.4%
EU-5+2
BEV 104,323 4.6% 63,308 64.8% 104,323 64.8% 40,170 26.9% 32,091 102.2% 32,062 103.1%
PHEV 65,610 2.9% 28,994 126.3% 65,610 126.3% 22,765 70.8% 19,469 170.2% 23,376 176.2%
Hybrid 192,140 8.5% 149,750 28.3% 192,140 28.3% 56,257 -8.1% 66,121 59.4% 69,762 48.3%
Total 362,073 16.1% 242,052 49.6% 362,073 49.6% 119,191 12.2% 117,681 82.3% 125,200 75.6%
E-Mobilitysales dataEU-5, Netherlands, Norway, EU-5+2
Source: Autofacts Analysis, Autoactu, ANFAC, ANFIA, BOVAG, Fourin, KBA, SMMT, Marklines
8. Appendix
LegendMOY = Month-on-Year QOY = Quarter-on-Year YOY = Year-on-YearYTD = Year-to-Date
PwC Autofacts® | Strategy&
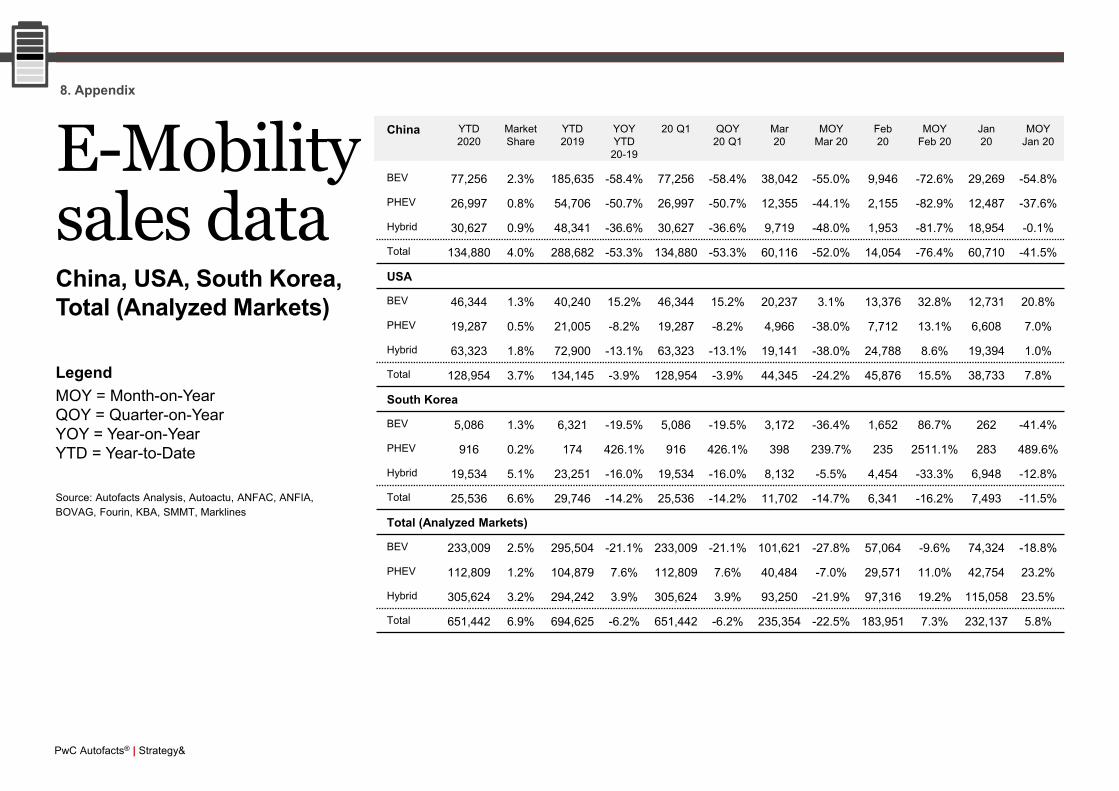
E-Mobilitysales dataChina, USA, South Korea,Total (Analyzed Markets)
China YTD 2020
Market Share
YTD 2019
YOY YTD
20-19
20 Q1 QOY20 Q1
Mar 20
MOY Mar 20
Feb 20
MOYFeb 20
Jan 20
MOYJan 20
BEV 77,256 2.3% 185,635 -58.4% 77,256 -58.4% 38,042 -55.0% 9,946 -72.6% 29,269 -54.8%
PHEV 26,997 0.8% 54,706 -50.7% 26,997 -50.7% 12,355 -44.1% 2,155 -82.9% 12,487 -37.6%
Hybrid 30,627 0.9% 48,341 -36.6% 30,627 -36.6% 9,719 -48.0% 1,953 -81.7% 18,954 -0.1%
Total 134,880 4.0% 288,682 -53.3% 134,880 -53.3% 60,116 -52.0% 14,054 -76.4% 60,710 -41.5%
USA
BEV 46,344 1.3% 40,240 15.2% 46,344 15.2% 20,237 3.1% 13,376 32.8% 12,731 20.8%
PHEV 19,287 0.5% 21,005 -8.2% 19,287 -8.2% 4,966 -38.0% 7,712 13.1% 6,608 7.0%
Hybrid 63,323 1.8% 72,900 -13.1% 63,323 -13.1% 19,141 -38.0% 24,788 8.6% 19,394 1.0%
Total 128,954 3.7% 134,145 -3.9% 128,954 -3.9% 44,345 -24.2% 45,876 15.5% 38,733 7.8%
South Korea
BEV 5,086 1.3% 6,321 -19.5% 5,086 -19.5% 3,172 -36.4% 1,652 86.7% 262 -41.4%
PHEV 916 0.2% 174 426.1% 916 426.1% 398 239.7% 235 2511.1% 283 489.6%
Hybrid 19,534 5.1% 23,251 -16.0% 19,534 -16.0% 8,132 -5.5% 4,454 -33.3% 6,948 -12.8%
Total 25,536 6.6% 29,746 -14.2% 25,536 -14.2% 11,702 -14.7% 6,341 -16.2% 7,493 -11.5%
Total (Analyzed Markets)
BEV 233,009 2.5% 295,504 -21.1% 233,009 -21.1% 101,621 -27.8% 57,064 -9.6% 74,324 -18.8%
PHEV 112,809 1.2% 104,879 7.6% 112,809 7.6% 40,484 -7.0% 29,571 11.0% 42,754 23.2%
Hybrid 305,624 3.2% 294,242 3.9% 305,624 3.9% 93,250 -21.9% 97,316 19.2% 115,058 23.5%
Total 651,442 6.9% 694,625 -6.2% 651,442 -6.2% 235,354 -22.5% 183,951 7.3% 232,137 5.8%
Source: Autofacts Analysis, Autoactu, ANFAC, ANFIA, BOVAG, Fourin, KBA, SMMT, Marklines
8. Appendix
LegendMOY = Month-on-Year QOY = Quarter-on-Year YOY = Year-on-YearYTD = Year-to-Date