East Baton Rouge Real Estate Multi Family Sales Q2 2011 vs Q2 2014
18
Q2-2014 91,500 Q2-2011 85,100 % 8 Change 6,400 Q2-2011 vs Q2-2014: The median sold price is up 8% Median Sold Price by quarter Accurate Valuations Group Q2-2011 vs. Q2-2014 William Cobb Clarus MarketMetrics® 07/14/2014 Information not guaranteed. © 2014 - 2015 Terradatum and its suppliers and licensors (www.terradatum.com/about/licensors.td). 1/2 MLS: GBRAR Bedrooms: All All Construction Type: All 3 Year Quarterly SqFt: Bathrooms: Lot Size: All All Square Footage Period: All County: Property Types: : Multi-Family East Baton Rouge Price:
-
Upload
bill-cobb-appraiser -
Category
Real Estate
-
view
57 -
download
0
Transcript of East Baton Rouge Real Estate Multi Family Sales Q2 2011 vs Q2 2014

Q2-201491,500
Q2-201185,100
%8
Change6,400
Q2-2011 vs Q2-2014: The median sold price is up 8%Median Sold Price by quarter
Accurate Valuations Group
Q2-2011 vs. Q2-2014
William Cobb
Clarus MarketMetrics® 07/14/2014Information not guaranteed. © 2014 - 2015 Terradatum and its suppliers and licensors (www.terradatum.com/about/licensors.td).
1/2
MLS: GBRAR Bedrooms:AllAll
Construction Type:All3 Year Quarterly SqFt:
Bathrooms: Lot Size:All All Square FootagePeriod:All
County:Property Types: : Multi-Family
East Baton RougePrice:

Median Sold Price by quarterQ2-2011 vs Q2-2014: The median sold price is up 8%
Accurate Valuations GroupWilliam Cobb
Sold Median Price Units Avg DOMTime Period
Q2 2014 91,500 16 111
Q1 2014 72,299 15 162
Q4 2013 98,500 22 292
Q3 2013 104,500 30 66
Q2 2013 70,000 25 174
Q1 2013 75,000 33 101
Q4 2012 78,000 26 90
Q3 2012 90,000 19 85
Q2 2012 92,500 22 111
Q1 2012 82,950 18 112
Q4 2011 105,000 31 178
Q3 2011 58,715 18 105
Q2 2011 85,100 21 59
Clarus MarketMetrics® 07/14/2014Information not guaranteed. © 2014 - 2015 Terradatum and its suppliers and licensors (www.terradatum.com/about/licensors.td).
22/
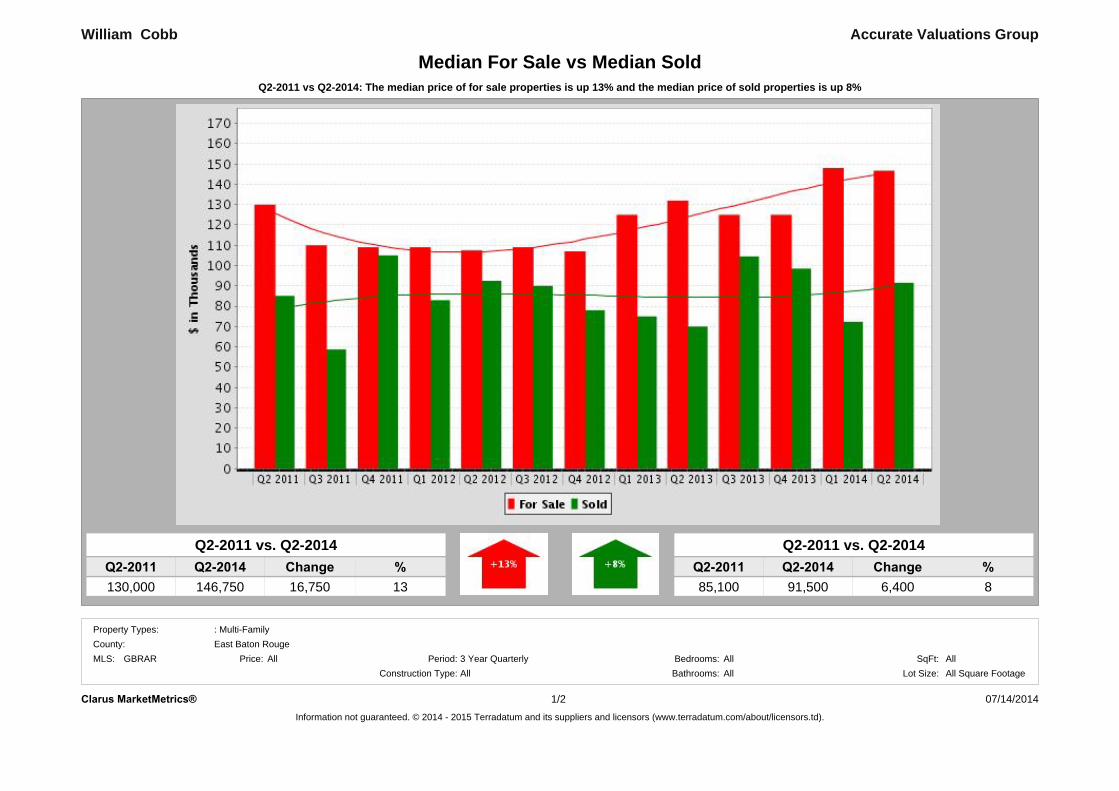
Q2-2011 vs Q2-2014: The median price of for sale properties is up 13% and the median price of sold properties is up 8%
Accurate Valuations Group
Q2-2011 vs. Q2-2014
130,000 13
William Cobb
146,750Q2-2014
Median For Sale vs Median Sold
ChangeQ2-2011 %16,750
Q2-2011 Q2-2014 %85,100 8
Q2-2011 vs. Q2-2014
91,500Change
6,400
Clarus MarketMetrics® 07/14/2014Information not guaranteed. © 2014 - 2015 Terradatum and its suppliers and licensors (www.terradatum.com/about/licensors.td).
1/2
MLS: GBRAR Bedrooms:AllAll
Construction Type:All3 Year Quarterly SqFt:
Bathrooms: Lot Size:All All Square FootagePeriod:All
County:Property Types: : Multi-Family
East Baton RougePrice:

Median For Sale vs Median SoldQ2-2011 vs Q2-2014: The median price of for sale properties is up 13% and the median price of sold properties is up 8%
Accurate Valuations GroupWilliam Cobb
For SaleMedian SoldMedianFor Sale # Properties # PropertiesSold Price Difference
Time Period
Q2 2014 116 16146,750 91,500 -55,250Q1 2014 111 15148,000 72,299 -75,701Q4 2013 130 22125,000 98,500 -26,500Q3 2013 134 30125,000 104,500 -20,500Q2 2013 133 25132,000 70,000 -62,000Q1 2013 137 33125,000 75,000 -50,000Q4 2012 133 26107,000 78,000 -29,000Q3 2012 148 19109,000 90,000 -19,000Q2 2012 140 22107,500 92,500 -15,000Q1 2012 129 18109,000 82,950 -26,050Q4 2011 130 31109,000 105,000 -4,000Q3 2011 119 18110,000 58,715 -51,285Q2 2011 119 21130,000 85,100 -44,900
Clarus MarketMetrics®Information not guaranteed. © 2014 - 2015 Terradatum and its suppliers and licensors (www.terradatum.com/about/licensors.td).
07/14/201422/

Q2-201416
Q2-201121
%-24
Change-5
Q2-2011 vs Q2-2014: The number of Sold properties is down -24%Sold Properties by quarter
Accurate Valuations Group
Q2-2011 vs. Q2-2014
William Cobb
Clarus MarketMetrics® 07/14/2014Information not guaranteed. © 2014 - 2015 Terradatum and its suppliers and licensors (www.terradatum.com/about/licensors.td).
1/2
MLS: GBRAR Bedrooms:AllAll
Construction Type:All3 Year Quarterly SqFt:
Bathrooms: Lot Size:All All Square FootagePeriod:All
County:Property Types: : Multi-Family
East Baton RougePrice:

Sold Properties by quarterQ2-2011 vs Q2-2014: The number of Sold properties is down -24%
Accurate Valuations GroupWilliam Cobb
Time Period Units Median Price Avg DOM
Q2 2014 91,50016 111Q1 2014 72,29915 162Q4 2013 98,50022 292Q3 2013 104,50030 66Q2 2013 70,00025 174Q1 2013 75,00033 101Q4 2012 78,00026 90Q3 2012 90,00019 85Q2 2012 92,50022 111Q1 2012 82,95018 112Q4 2011 105,00031 178Q3 2011 58,71518 105Q2 2011 85,10021 59
Clarus MarketMetrics® 07/14/2014Information not guaranteed. © 2014 - 2015 Terradatum and its suppliers and licensors (www.terradatum.com/about/licensors.td).
22/

Q2-201419
Q2-201122
%-14
Change-3
Q2-2011 vs Q2-2014: The number of Under Contract properties is down -14%Under Contract Properties by quarter
Accurate Valuations Group
Q2-2011 vs. Q2-2014
William Cobb
Clarus MarketMetrics® 07/14/2014Information not guaranteed. © 2014 - 2015 Terradatum and its suppliers and licensors (www.terradatum.com/about/licensors.td).
1/2
AllBathrooms: SqFt:All
: Multi-Family
All Square FootageConstruction Type: Lot Size:GBRAR
East Baton Rouge
Period: 3 Year QuarterlyPrice:MLS:
All AllAll
Property Types:
Bedrooms:
County:

Under Contract Properties by quarterQ2-2011 vs Q2-2014: The number of Under Contract properties is down -14%
Accurate Valuations GroupWilliam Cobb
Units Avg DOMMedian PriceTime PeriodQ2 2014 148,50019 77Q1 2014 60,00011 230Q4 2013 107,00027 266Q3 2013 77,05024 56Q2 2013 85,00023 116Q1 2013 85,00029 128Q4 2012 100,00029 120Q3 2012 76,00023 78Q2 2012 99,90021 114Q1 2012 41,90025 95Q4 2011 135,00022 149Q3 2011 80,41325 168Q2 2011 90,00022 66
Clarus MarketMetrics® 07/14/2014Information not guaranteed. © 2014 - 2015 Terradatum and its suppliers and licensors (www.terradatum.com/about/licensors.td).
22/

Q2-201434
Q2-201136
%-6
Change-2
Q2-2011 vs Q2-2014: The number of New properties is down -6%New Properties by quarter
Accurate Valuations Group
Q2-2011 vs. Q2-2014
William Cobb
Clarus MarketMetrics® 07/14/2014Information not guaranteed. © 2014 - 2015 Terradatum and its suppliers and licensors (www.terradatum.com/about/licensors.td).
1/2
MLS: GBRAR Bedrooms:AllAll
Construction Type:All3 Year Quarterly SqFt:
Bathrooms: Lot Size:All All Square FootagePeriod:All
County:Property Types: : Multi-Family
East Baton RougePrice:
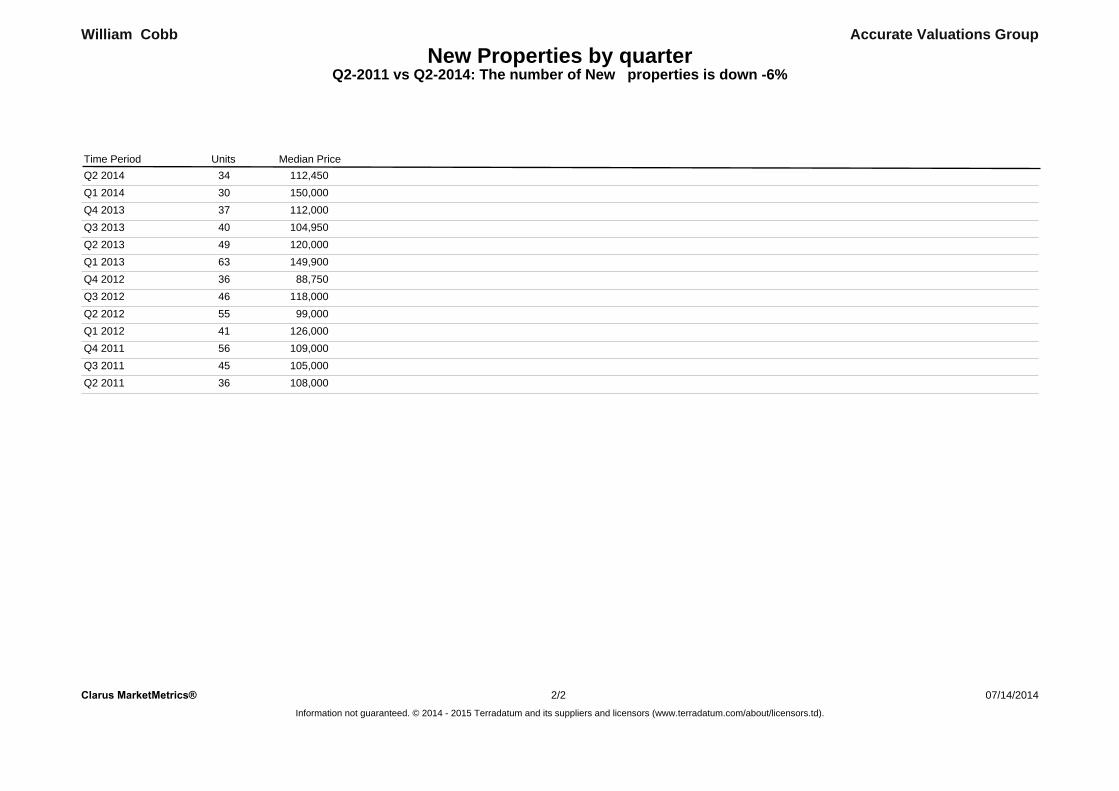
New Properties by quarterQ2-2011 vs Q2-2014: The number of New properties is down -6%
Accurate Valuations GroupWilliam Cobb
Units Median PriceTime PeriodQ2 2014 112,45034Q1 2014 150,00030Q4 2013 112,00037Q3 2013 104,95040Q2 2013 120,00049Q1 2013 149,90063Q4 2012 88,75036Q3 2012 118,00046Q2 2012 99,00055Q1 2012 126,00041Q4 2011 109,00056Q3 2011 105,00045Q2 2011 108,00036
Clarus MarketMetrics® 07/14/2014Information not guaranteed. © 2014 - 2015 Terradatum and its suppliers and licensors (www.terradatum.com/about/licensors.td).
22/
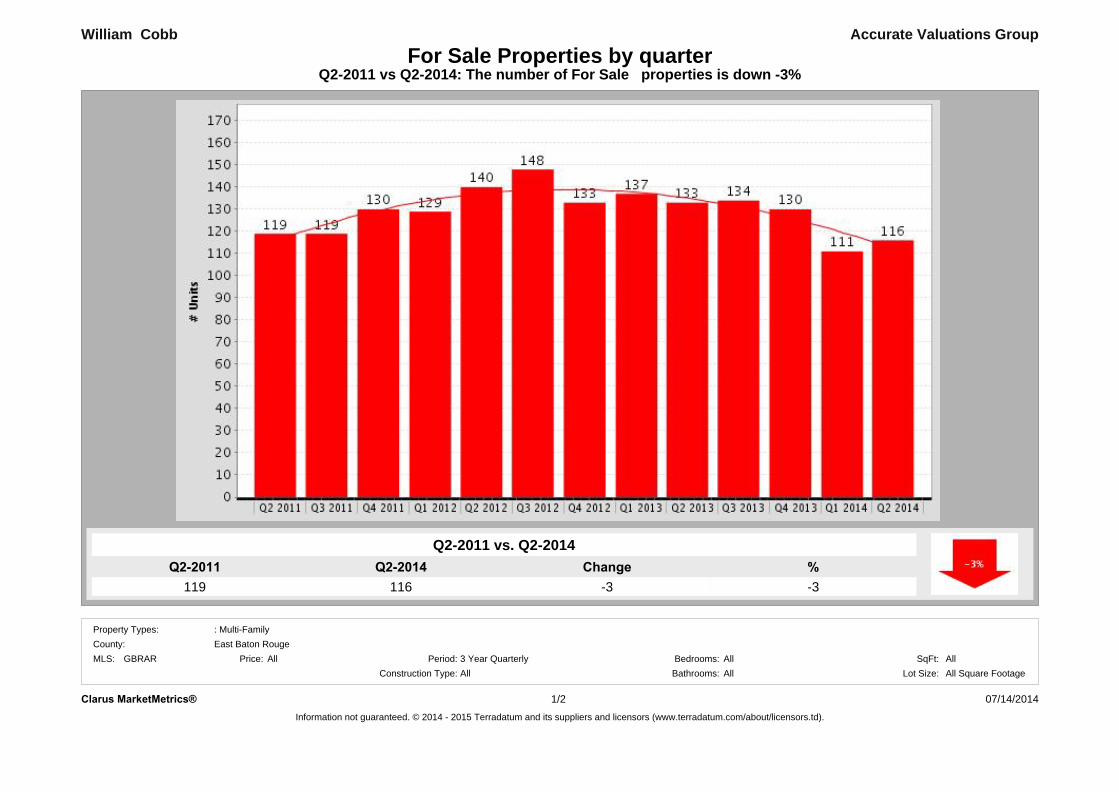
Q2-2014116
Q2-2011119
%-3
Change-3
Q2-2011 vs Q2-2014: The number of For Sale properties is down -3%For Sale Properties by quarter
Accurate Valuations Group
Q2-2011 vs. Q2-2014
William Cobb
Clarus MarketMetrics® 07/14/2014Information not guaranteed. © 2014 - 2015 Terradatum and its suppliers and licensors (www.terradatum.com/about/licensors.td).
1/2
MLS: GBRAR Bedrooms:AllAll
Construction Type:All3 Year Quarterly SqFt:
Bathrooms: Lot Size:All All Square FootagePeriod:All
County:Property Types: : Multi-Family
East Baton RougePrice:
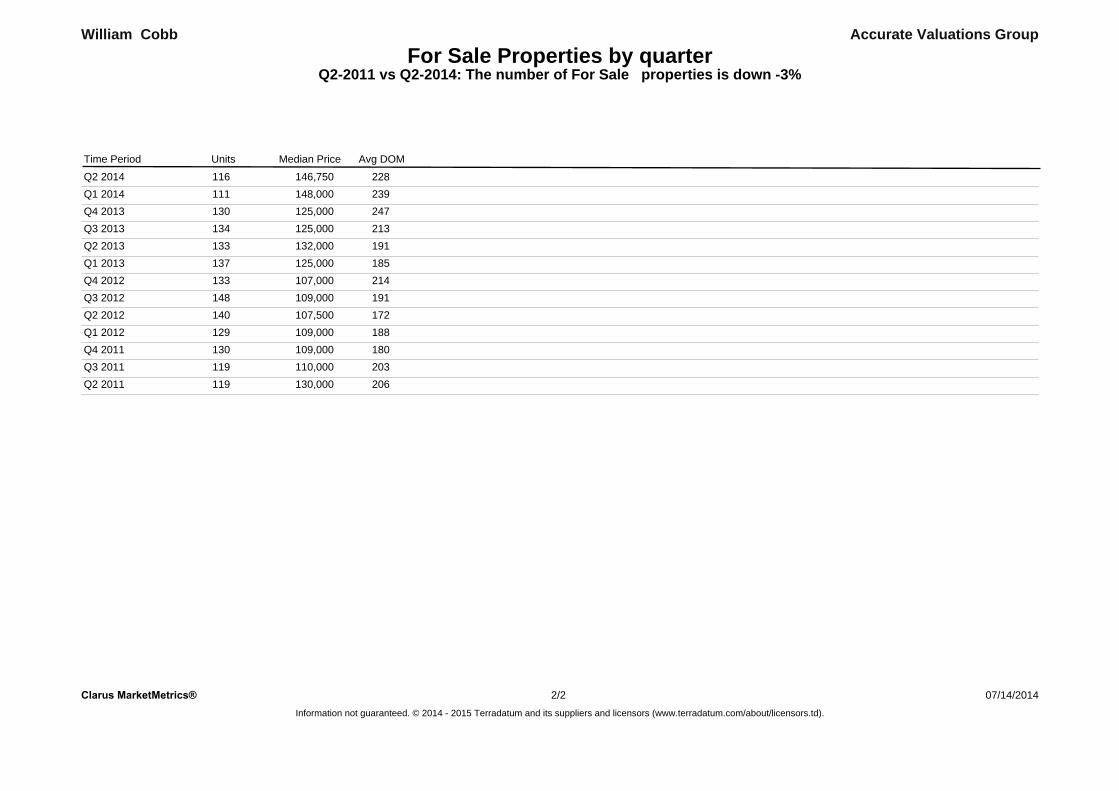
For Sale Properties by quarterQ2-2011 vs Q2-2014: The number of For Sale properties is down -3%
Accurate Valuations GroupWilliam Cobb
Units Avg DOMMedian PriceTime Period
Q2 2014 146,750116 228Q1 2014 148,000111 239Q4 2013 125,000130 247Q3 2013 125,000134 213Q2 2013 132,000133 191Q1 2013 125,000137 185Q4 2012 107,000133 214Q3 2012 109,000148 191Q2 2012 107,500140 172Q1 2012 109,000129 188Q4 2011 109,000130 180Q3 2011 110,000119 203Q2 2011 130,000119 206
Clarus MarketMetrics® 07/14/2014Information not guaranteed. © 2014 - 2015 Terradatum and its suppliers and licensors (www.terradatum.com/about/licensors.td).
22/

Q2-201417
Q2-201123
%-26
Change-6
Q2-2011 vs Q2-2014: The number of Expired properties is down -26%Expired Properties by quarter
Accurate Valuations Group
Q2-2011 vs. Q2-2014
William Cobb
07/14/2014Clarus MarketMetrics® 1/2
MLS: GBRAR Bedrooms:AllAll
Construction Type:All3 Year Quarterly SqFt:
Bathrooms: Lot Size:All All Square FootagePeriod:All
County:Property Types: : Multi-Family
East Baton RougePrice:

Expired Properties by quarterQ2-2011 vs Q2-2014: The number of Expired properties is down -26%
Accurate Valuations GroupWilliam Cobb
Avg DOMUnits Median PriceQ2 2014 120,00017 288Q1 2014 91,50018 259Q4 2013 148,50022 256Q3 2013 149,90017 196Q2 2013 138,50016 188Q1 2013 127,00024 184Q4 2012 113,50030 246Q3 2012 147,45028 232Q2 2012 109,00017 189Q1 2012 70,00019 332Q4 2011 129,95020 200Q3 2011 139,95020 255Q2 2011 145,00023 273
Clarus MarketMetrics® 07/14/2014Information not guaranteed. © 2014 - 2015 Terradatum and its suppliers and licensors (www.terradatum.com/about/licensors.td).
22/

Q2-2011 vs Q2-2014: The number of for sale properties is down -3% and the number of sold properties is down -24%
Accurate Valuations Group
Q2-2011 vs. Q2-2014
119 -3
William Cobb
116Q2-2014
Supply & Demand by quarter
ChangeQ2-2011 %-3
Q2-2011 Q2-2014 %21 -24
Q2-2011 vs. Q2-2014
16Change
-5
Clarus MarketMetrics® 07/14/2014Information not guaranteed. © 2014 - 2015 Terradatum and its suppliers and licensors (www.terradatum.com/about/licensors.td).
1/2
MLS: GBRAR Bedrooms:AllAll
Construction Type:All3 Year Quarterly SqFt:
Bathrooms: Lot Size:All All Square FootagePeriod:All
County:Property Types: : Multi-Family
East Baton RougePrice:
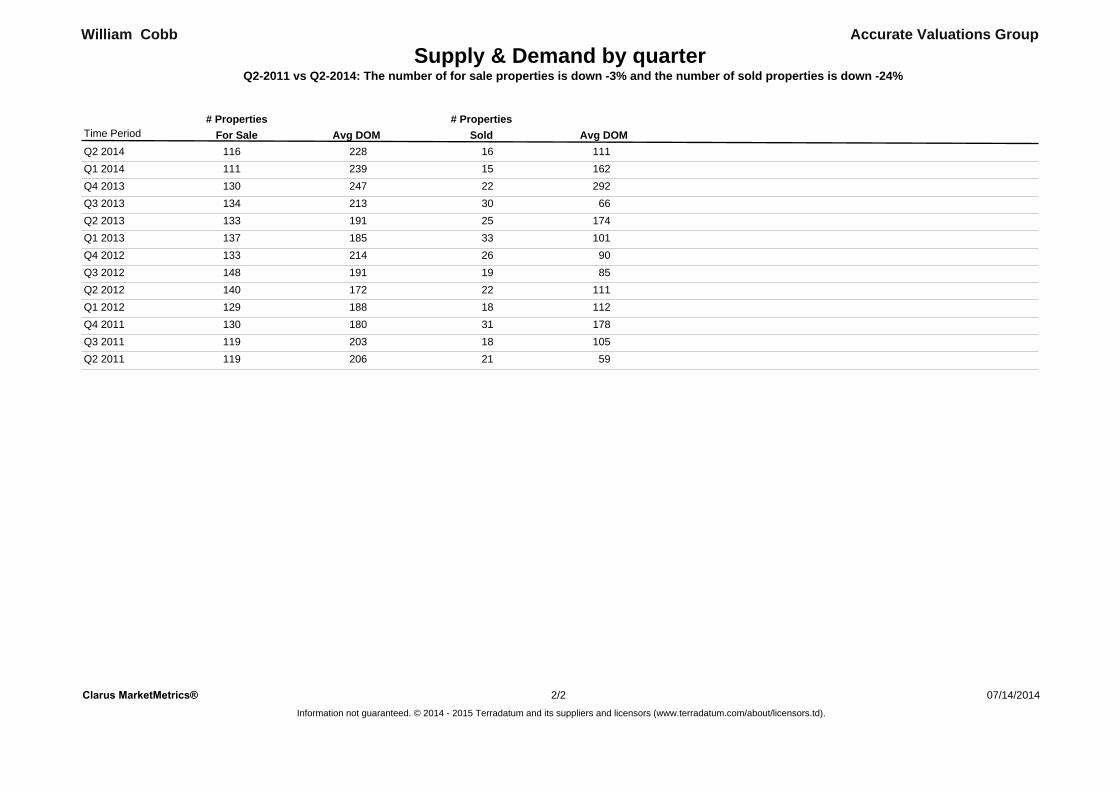
Supply & Demand by quarterQ2-2011 vs Q2-2014: The number of for sale properties is down -3% and the number of sold properties is down -24%
William Cobb Accurate Valuations Group
For Sale Sold# Properties
Avg DOM Avg DOM# Properties
Time Period
Q2 2014 228 111116 16Q1 2014 239 162111 15Q4 2013 247 292130 22Q3 2013 213 66134 30Q2 2013 191 174133 25Q1 2013 185 101137 33Q4 2012 214 90133 26Q3 2012 191 85148 19Q2 2012 172 111140 22Q1 2012 188 112129 18Q4 2011 180 178130 31Q3 2011 203 105119 18Q2 2011 206 59119 21
Clarus MarketMetrics® 07/14/2014Information not guaranteed. © 2014 - 2015 Terradatum and its suppliers and licensors (www.terradatum.com/about/licensors.td).
22/

Q2-201477
Q2-201166
%16
Change11
Q2-2011 vs Q2-2014: The average days on market is up 16%The Average Days on Market by quarter
Accurate Valuations Group
Q2-2011 vs. Q2-2014
William Cobb
East Baton RougeAll 3 Year Quarterly
County:Period:Price:
Property Types: : Multi-Family
07/14/20141/2Clarus MarketMetrics®
All Square FootageBedrooms: All AllSqFt:
All Lot Size:Bathrooms:AllConstruction Type:MLS: GBRAR

The Average Days on Market by quarterQ2-2011 vs Q2-2014: The average days on market is up 16%
Accurate Valuations GroupWilliam Cobb
# UC UnitsAvg DOMTime PeriodQ2 2014 1977Q1 2014 11230Q4 2013 27266Q3 2013 2456Q2 2013 23116Q1 2013 29128Q4 2012 29120Q3 2012 2378Q2 2012 21114Q1 2012 2595Q4 2011 22149Q3 2011 25168Q2 2011 2266
Clarus MarketMetrics® 2/2 07/14/2014Information not guaranteed. © 2014 - 2015 Terradatum and its suppliers and licensors (www.terradatum.com/about/licensors.td).