e g - eisdocs.dsdip.qld.gov.aueisdocs.dsdip.qld.gov.au/Santos GLNG Gas Field Development/EIS... ·...
82
Water resource management plan AE Enter Go back to contents
Transcript of e g - eisdocs.dsdip.qld.gov.aueisdocs.dsdip.qld.gov.au/Santos GLNG Gas Field Development/EIS... ·...
Ae
. wA
Te
r r
eso
ur
ce
m
An
Ag
em
en
T p
lAn
Water resource management plan AeEnter Go back to contents

Gas Field Development Project Water Resources Management Plan
Gas Field Development Project 2014
i
Con
tent
s
Contents
1 Introduction 1
1.1 Purpose 1
1.2 Project description 1
1.3 Legislative setting 4
1.3.1 State (Queensland) legislation 5
1.3.2 Commonwealth legislation 7
1.4 Santos GLNG policy framework 8
1.5 Management approach 9
1.5.1 Development constraints 9
1.6 Structure of document 10
2 Groundwater resources 15
2.1 Environmental values 16
2.2 Sensitive groundwater receptors 17
2.2.1 Springs 18
2.2.2 Wetlands and vegetation 20
2.3 Potential impacts 21
2.3.1 Landholder bores 26
2.3.2 Springs 28
2.3.3 Hydraulic fracturing 34
2.3.4 Hydraulic connectivity 35
2.3.5 Vertical groundwater flux 36
2.3.6 Subsidence 36
2.4 Management approach 37
2.4.1 Development constraints 39
2.4.2 Location and frequency of monitoring 40
2.4.3 Response framework 42
2.4.4 Exceedance response 50
2.4.5 Emergency response 51
2.5 Residual impacts 53
3 Surface water resources 54
3.1 Environmental values 54
3.2 Sensitive receptors 55
Gas Field Development Project 2014
ii
Con
tent
s
3.3 Potential impacts 58
3.4 Management approach 61
3.4.1 Development constraints 61
3.4.2 Baseline assessment 63
3.4.3 Coal seam water management 65
3.4.4 Surface Water Monitoring 67
3.4.5 Response framework 68
3.4.6 Exceedance response 69
3.4.7 Emergency or unplanned discharge 69
3.5 Residual impacts 72
4 Performance management 73
4.1 Reporting requirements 73
5 References 74
Tables Table 1-1 Summary of state legislation applicable to the GFD Project 6 Table 1-2 Summary of Commonwealth legislation applicable to the GFD Project 7 Table 1-3 Summary of Santos GLNG corporate policies and Environment, Health and Safety
Management System as relevant to this WRMP 8 Table 1-4 Summary of Environment Hazard Standards informing water resources
management in the GFD Project area 9 Table 1-5 Overview of Reports and Environmental Management Documents relating to the
WRMP 12 Table 2-1 EVs identified for groundwater resources within the GFD Project area (Fitzroy
Basin; as defined in Schedule 1 of the EPP Water) 17 Table 2-2 Conservation ranking for GAB springs (adopted from Fensham et al., 2012) 18 Table 2-3 Spring vents located in GFD Project tenures 19 Table 2-4 Watercourse springs located in GFD Project tenures 20 Table 2-5 Change in maximum depressurisation and area of impact under the EIS Scenario
compared to the UWIR Scenario 23 Table 2-6 Potential impacts to groundwater EVs resulting from GFD Project activities 24 Table 2-7 Additional water bores cumulatively impacted under the EIS Scenario compared to
the UWIR Scenario, in the Surat CMA 27 Table 2-8 Additional water bores cumulatively impacted under the EIS Scenario compared to
the UWIR Scenario, within GFD Project tenures 27 Table 2-9 Spring complexes at risk of depressurisation impacts within or near GFD Project
tenures 29 Table 2-10 Watercourse springs at risk of depressurisation impacts within or near GFD Project
tenures 31 Table 2-11 Status of Santos GLNG hydraulic connectivity studies 36

Gas Field Development Project 2014
iii
Con
tent
s
Table 2-12 Constraints applied to GFD Project development for the protection of groundwater resources 39
Table 2-13 Summary of regional groundwater locations 40 Table 2-14 Summary of groundwater monitoring approach for the GFD Project 44 Table 2-15 Residual impacts to groundwater EVs after implementation of mitigation and
management measures 53 Table 3-1 EVs identified for surface water resources within the GFD Project area (Fitzroy
Basin; as defined in Schedule 1 of the EPP Water) 56 Table 3-2 EVs identified for surface water resources within the GFD Project area
(Condamine-Balonne Basin; as defined by QMDC 2012, Figure 3, p12) 57 Table 3-3 Potential impacts to surface water EVs resulting from GFD Project activities 59 Table 3-4 Constraints planning process 61 Table 3-5 Summary of surface water monitoring for the GFD Project 70 Table 3-6 Residual impacts to surface water EVs after implementation of mitigation and
management measures 72
Figures Figure 1-1 GFD Project area and primary infrastructure 3 Figure 1-2 Proposed GFD Project development schedule 4 Figure 1-3 Management hierarchy 10 Figure 2-1 Regional hydro-stratigraphy (from OGIA 2012) 16 Figure 2-2 Springs at risk of impacts within or near GFD Project tenures 33 Figure 2-3 Framework for management and mitigation of potential impacts to groundwater
resources within the GFD Project area 38 Figure 2-4 Existing groundwater monitoring locations within the GFD Project area 43 Figure 2-5 Monitoring and response plan for springs associated with an EPBC Act listing (from
Appendix B (2013 JIP) 52 Figure 3-1 Framework for management and mitigation of potential impacts to surface water
resources within the GFD Project area 62 Figure 3-2 Existing surface water monitoring locations within the GFD Project area (2014) 64
Appendices Appendix A Hydraulic connectivity characterisation Appendix B Joint industry plan for an early warning system for the monitoring and protection of
EPBC springs Appendix C Evaluation of prevention or mitigation options for Fairview springs Appendix D Stimulation impact monitoring program Appendix E Ground deformation monitoring and management plan Appendix F Hydraulic fracturing risk assessment: Compendium of assessed fluid systems Appendix G Dawson river discharge scheme receiving environment monitoring program
summary
Gas Field Development Project 2014
iv
Con
tent
s
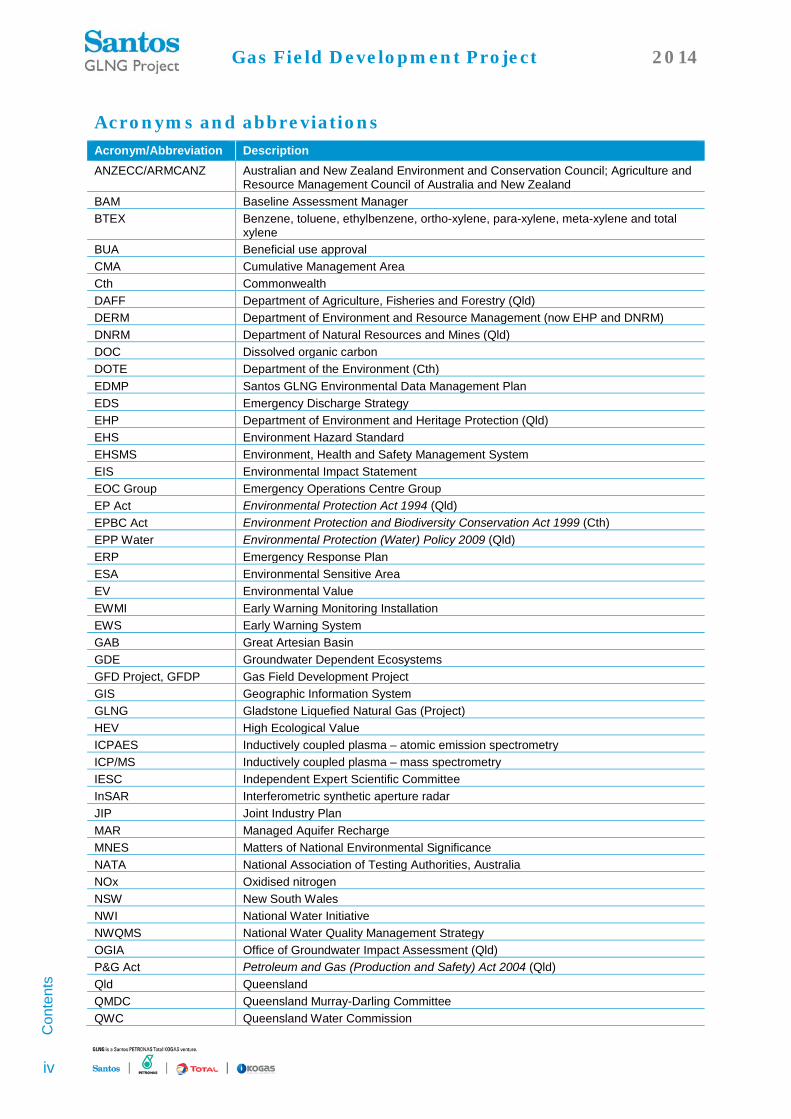
Acronyms and abbreviations Acronym/Abbreviation Description ANZECC/ARMCANZ Australian and New Zealand Environment and Conservation Council; Agriculture and
Resource Management Council of Australia and New Zealand BAM Baseline Assessment Manager BTEX Benzene, toluene, ethylbenzene, ortho-xylene, para-xylene, meta-xylene and total
xylene BUA Beneficial use approval CMA Cumulative Management Area Cth Commonwealth DAFF Department of Agriculture, Fisheries and Forestry (Qld) DERM Department of Environment and Resource Management (now EHP and DNRM) DNRM Department of Natural Resources and Mines (Qld) DOC Dissolved organic carbon DOTE Department of the Environment (Cth) EDMP Santos GLNG Environmental Data Management Plan EDS Emergency Discharge Strategy EHP Department of Environment and Heritage Protection (Qld) EHS Environment Hazard Standard EHSMS Environment, Health and Safety Management System EIS Environmental Impact Statement EOC Group Emergency Operations Centre Group EP Act Environmental Protection Act 1994 (Qld) EPBC Act Environment Protection and Biodiversity Conservation Act 1999 (Cth) EPP Water Environmental Protection (Water) Policy 2009 (Qld) ERP Emergency Response Plan ESA Environmental Sensitive Area EV Environmental Value EWMI Early Warning Monitoring Installation EWS Early Warning System GAB Great Artesian Basin GDE Groundwater Dependent Ecosystems GFD Project, GFDP Gas Field Development Project GIS Geographic Information System GLNG Gladstone Liquefied Natural Gas (Project) HEV High Ecological Value ICPAES Inductively coupled plasma – atomic emission spectrometry ICP/MS Inductively coupled plasma – mass spectrometry IESC Independent Expert Scientific Committee InSAR Interferometric synthetic aperture radar JIP Joint Industry Plan MAR Managed Aquifer Recharge MNES Matters of National Environmental Significance NATA National Association of Testing Authorities, Australia NOx Oxidised nitrogen NSW New South Wales NWI National Water Initiative NWQMS National Water Quality Management Strategy OGIA Office of Groundwater Impact Assessment (Qld) P&G Act Petroleum and Gas (Production and Safety) Act 2004 (Qld) Qld Queensland QMDC Queensland Murray-Darling Committee QWC Queensland Water Commission

Gas Field Development Project 2014
v
Con
tent
s
Acronym/Abbreviation Description QWQG Queensland Water Quality Guidelines REMP Receiving Environment Monitoring Program ROP Resource Operations Plan Santos GLNG Santos Gladstone Liquefied Natural Gas Pty Limited SDPWO Act State Development and Public Work Organisation Act 1971 (Qld) SEWPaC Department of Sustainability, Environment, Water, Population and Communities (Cth) SMART Specific, Measurable, Achievable, Relevant and Timely STP Sewage Treatment Plant TKN Total Kjeldahl Nitrogen TOC Total organic carbon UWIR Underground Water Impact Report VWP Vibrating wire piezometer WMS Water Management Strategy WQO Water Quality Objective WRMP Water Resource Management Plan WRP Water Resource Plan
Gas Field Development Project EIS 2014
1
Intro
duct
ion
1 Introduction
Santos GLNG intends to progressively develop coal seam gas resources in the Surat and Bowen Basins of central and southern Queensland through the Gas Field Development (GFD) Project (GFD Project) (refer Section 2). The Project is an extension of the existing approved Santos Gladstone Liquefied Natural Gas (GLNG) Project, and has been declared a:
• ‘Controlled action’ by the Commonwealth Minister under the Commonwealth Environment Protection and Biodiversity Conservation Act 1999 (EPBC Act)
• ‘Significant project’ by the Queensland Coordinator General under the State Development and Public Works Organisation Act 1971 (SDPWO Act, Queensland).
As such, the GFD Project requires its own Environmental Impact Statement (EIS), prepared through the Coordinator-General’s EIS assessment process and bilateral agreement (2012), which administers both Commonwealth and State approvals on behalf of the State of Queensland.
This Water resources management plan (WRMP) is developed in support of the GFD Project EIS to document management and monitoring associated to manage the potential risk of adverse impacts to Matters of National Environmental Significance (MNES) related to the water resources controlling provision of the EPBC Act. In the event of approval of the GFD Project, it is expected that the Minister for the Department of the Environment (DOTE) will impose conditions, under the EPBC Act, relating to the monitoring and management of water resources. This WRMP seeks to proactively address how the potential risk of adverse impact to water resources, as EPBC MNES, will be monitored and managed.
1.1 Purpose The purpose of this WRMP is to detail how the potential risk of adverse impacts to water resources within the GFD Project area will be managed and monitored on both a development-specific basis and cumulatively along with the approved GLNG Project and other developments in the Surat and Bowen Basins. It includes information regarding:
• The surface water and groundwater resources of the GFD Project area • The potential extent and significance of impacts to water resources • How the risk of adverse impacts will be monitored and managed to an acceptable level.
The WRMP is based upon the existing environmental management framework and practices developed and implemented for the GLNG Project, and incorporates experience and knowledge gained from implementation across existing operations along with updated information pertinent to the GFD Project area. It has the specific aim of setting out how the risk of significant impacts to water resources associated with the GFD project will be managed and monitored, in accordance with the relevant provisions.
1.2 Project description Santos GLNG intends to further develop its Queensland gas resources to augment supply of gas to its existing and previously approved GLNG Project.
The GFD Project is an extension of the existing approved gas field development and will involve the construction, operation, decommissioning and rehabilitation of production wells and the associated supporting infrastructure needed to provide additional gas over a project life exceeding 30 years.

Gas Field Development Project EIS 2014
2
Intro
duct
ion
Specifically, the GFD Project seeks approval to expand the GLNG Project’s gas fields from 6,887 km2 to 10,676 km2 and develop up to an additional 6,100 production wells to the currently authorised 2,650 wells; resulting in a maximum of up to 8,750 production wells.
The GFD Project will continue to progressively develop the Arcadia, Fairview, Roma and Scotia gas fields across 35 Santos GLNG petroleum tenures in the Surat and Bowen basins, and associated supporting infrastructure in these tenures and in adjacent areas. The location of the GFD Project area and primary infrastructure is shown in Figure 1-1.
This GFD Project will include the following components:
• Production wells • Fluid injection wells, monitoring bores and potentially underground gas storage wells • Gas and water gathering lines • Gas and water transmission pipelines • Gas compression and treatment facilities • Water storage and management facilities • Access roads and tracks • Accommodation facilities and associated services (e.g. sewage treatment) • Maintenance facilities, workshops, construction support, warehousing and administration buildings • Utilities such as water and power generation and supply (overhead and/or underground) • Lay down, stockpile and storage areas • Borrow pits and quarries • Communications.
The final number, size and location of the components will be determined progressively over the GFD Project life and will be influenced by the location, size and quality of the gas resources identified through ongoing field development planning processes, which include consideration of land access agreements negotiated with landholders, and environmental and cultural heritage values.
Where practical, the GFD Project will utilise existing or already approved infrastructure (e.g. accommodation camps, gas compression and water management facilities) from the GLNG Project or other separately approved developments. The GFD Project may also involve sourcing gas from third-party suppliers, as well as the sharing or co-location of gas field and associated facilities with third parties.
For the purposes of transparency this EIS shows an area off-tenure that may be used for infrastructure such as pipelines and temporary camps (supporting infrastructure area). While not assessed specifically in this EIS, any infrastructure that may be located within this area would be subject to further approval processes separate to this EIS. Approved exploration and appraisal activities are currently underway across the GFD Project’s petroleum tenures to improve understanding of the available gas resources. As the understanding of gas resources improves, investment decisions will be made about the scale, location and timing of the next stages of field development.

Draft
Warrego Hwy
Carna
rvon H
wy
Lake NugaNuga
Leichha
rdt Hw
y
Dawson Hwy
Balonn
e River
Dawson River
Condamine River
Comet River
Surat
MilesYuleba
WallumbillaRomaMitchell
Wandoan
Injune
Taroom
MouraBauhinia
RollestonBiloela
Springsure
Blackwater
150°
150°
149°
149°
148°
148°
-24°
-24°
-25°
-25°
-26°
-26°
-27°
-27°
GFD PROJECT EIS GFD PROJECT AREA AND PRIMARY INFRASTRUCTURE
Whilst every care is taken by URS to ensure the accuracy of the digital data, URS makes no representation or warranties about its accuracy, reliability, completeness, suitability for any particular purpose and disclaims all responsibility and liability (including without limitation, liability in negligence) for any expenses,losses, damages (including indirect or consequential damage) and costs which may be incurred as a result of data being inaccurate in any way for any reason. Electronic files are provided for information only. The data in these files is not controlled or subject to automatic updates for users outside of URS.
Source: Client supplied dataThis map may contain data sourced from: © Mapinfo Australia Pty Ltd and PSMA Australia Ltd., © Commonwealth of Australia (Geoscience Australia) 2012 , © The State of Queensland 2012, Bing Maps © Microsoft Corporation and its data suppliers.
This d
rawing
is sub
ject to
COPY
RIGHT
.BN
E
10 0 10 20 30 40 Km
1:2,000,000Projection: GDA94
GLNG Project infrastructureProposed (indicative) facilityOperating/Under construction facility
Gladstone gas transmission pipelineGLNG Project tenures
GFD Project infrastructure*Potential gas compression and water management facility Potential gas compression facility
GFD Project areaArcadia gas fieldFairview gas fieldRoma gas fieldScotia gas fieldPossible area forsupporting infrastructure
TownsRailwaysMajor roadsMajor drainage
* Indicative infrastructure locations - to be located within this area. For assessment purposes only. *
File No: 42627338-g-004d.mxd Drawn: MH/XL Approved: RS Date:
Figure:
A4
1-1Rev. B23-10-2014
WATER RESOURCES MANAGEMENT PLAN

Gas Field Development Project EIS 2014
4
Intro
duct
ion
For the purposes of this EIS, a scenario based on the maximum development case was developed at the approval of the ToR. This scenario assumed that production from the wells and upgrading of the gas compression facilities in the Scotia gas field would commence in 2016, followed by the GFD Project wells in the Roma, Arcadia and Fairview gas fields in mid-2019. This schedule is indicative only and was used for the purpose of the impact assessment in this EIS.
The proposed GFD Project schedule is outlined in Figure 1-2. This schedule provides an overall field development scenario for the purposes of assessment in the EIS.
Figure 1-2 Proposed GFD Project development schedule
Decommissioning and rehabilitation will occur progressively throughout the life of the GFD Project as construction activities cease and exhausted gas wells are decommissioned. However, final decommissioning and rehabilitation will occur at the end of gas production in accordance with relevant approvals and regulatory requirements.
1.3 Legislative setting The GFD Project is subject to regulation and approval administered by a bilateral agreement between the Queensland and Commonwealth Governments, under Section 45 of the EPBC Act (2012). The agreement was initiated in an attempt to streamline the environmental assessment process for “actions requiring approval from both the Commonwealth Environment Minister (under the EPBC Act) and the State of Queensland” (Department of the Environment (DOTE) 2012, p1). As such, several state and Commonwealth legislation and policies are considered for this WRMP. Environmental authorities for the GFD Project will be issued by the Department of Environment and Heritage Protection (EHP).

Gas Field Development Project EIS 2014
5
Intro
duct
ion
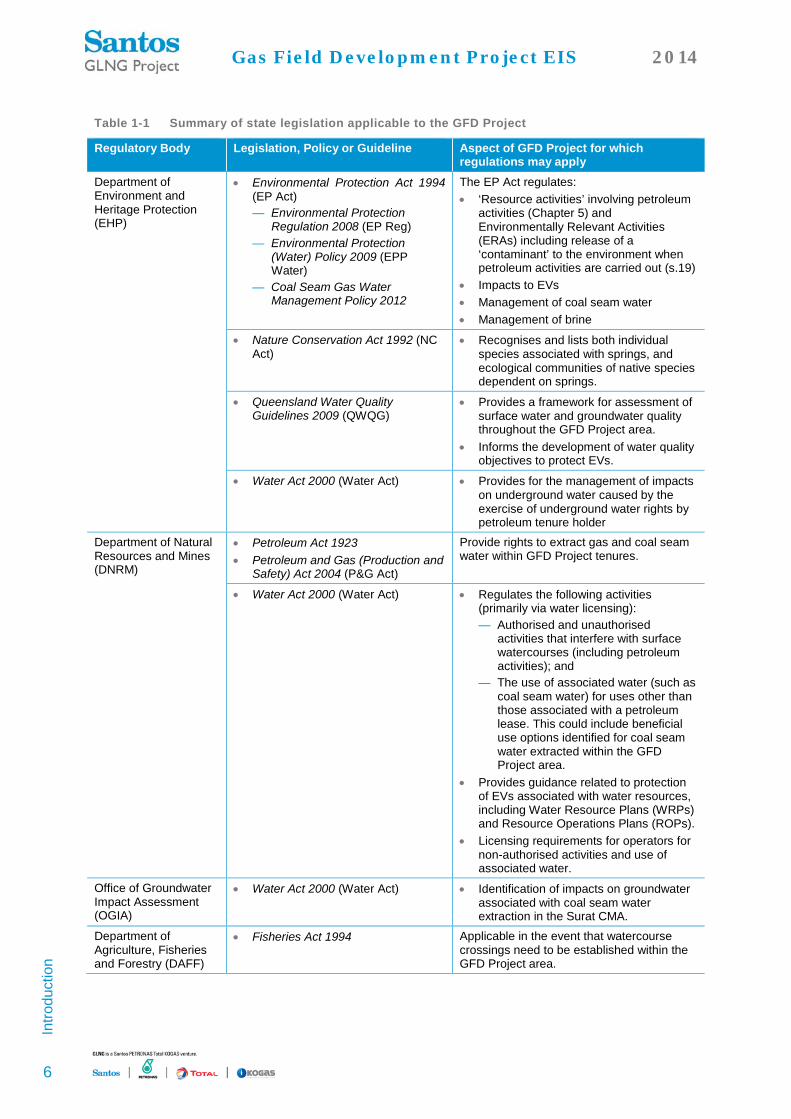
1.3.1 State (Queensland) legislation A summary of the state legislation relevant to the GFD Project, and particularly for this WRMP, is provided in Table 1-1.
The Environmental Protection Act 1994 (Qld) (EP Act) aims to protect Queensland’s environment while allowing for development that improves the total quality of life, both now and in the future, in a way that maintains the ecological processes on which life depends. The primary instrument by which surface water management is achieved is the Environmental Protection (Water) Policy 2009 (Qld) (EPP Water). For certain catchments, this document identifies specific environmental values (EVs) to be protected alongside defined water quality objectives (WQOs) to ensure their protection. Another instrument which supports the EP Act is the Coal Seam Gas Water Management Policy (2012), which outlines preferred approaches to the management of coal seam water and informs environmental authorities (EAs) and the supporting Draft Environmental management plan (Draft EM Plan) for activities relating to coal seam water management.
The Water Act 2000 (Qld) (Water Act) provides a framework to deliver sustainable water planning, allocation management and supply processes to provide for the improved security of water resources in Queensland. The risk of adverse impacts associated with the extraction of coal seam water from gas seams on groundwater supplies is managed under this Act. The Water Act also governs Water Resource Plans (WRPs) and Resource Operation Plans (ROPs) as part of the state government’s commitment under the National Water Initiative (NWI). WRPs establish a framework for sharing water between human consumptive needs and environmental values. ROPs are developed in parallel with WRPs and provide a framework by which objectives from which the WRPs are implemented, including water allocations and administrative directions. Water resources within the GFD Project area are primarily managed under the Fitzroy Basin Water Resource Plan 2011; the Condamine-Balonne Water Resource Plan 2004; the Great Artesian Basin Water Resource Plan 2006, and the Great Artesian Basin Resource Operations Plan 2007 (amended 2012).
The Queensland Government’s regulatory framework for coal seam gas development also includes the management of impacts to groundwater caused by gas extraction. This function is delivered by the Office of Groundwater Impact Assessment (OGIA), an independent entity established under the Water Act. The OGIA is required to prepare cumulative assessments of the impacts of gas extraction in regions defined by the Queensland Government as Cumulative Management Areas (CMA). The GFD Project lies within the Surat CMA, therefore the Underground Water Impact Report (UWIR) for the Surat CMA (prepared by the OGIA (2012)) is relevant. Queensland’s regulatory framework requires that the OGIA review and update the UWIR at least every three years. The new UWIR for the Surat CMA is due to be prepared in 2015.
Management measures, monitoring and reporting for the GFD Project are aligned with commitments under the UWIR and include:
• Completion of baseline assessments of landholder bores; • Undertaking groundwater and spring monitoring; • Development of Spring Impact Mitigation Strategies; and • Completion of bore assessments and make good agreements with specified landholders.
These commitments are ongoing, and will be adjusted in response to subsequent updates to the UWIR. In this event the Santos GLNG approach will be adapted accordingly, to ensure appropriate management and monitoring for the GFD Project activities. Further detail on UWIR commitments are outlined in Section 2.4 of this WRMP.
Gas Field Development Project EIS 2014
6
Intro
duct
ion
Table 1-1 Summary of state legislation applicable to the GFD Project
Regulatory Body Legislation, Policy or Guideline Aspect of GFD Project for which regulations may apply
Department of Environment and Heritage Protection (EHP)
• Environmental Protection Act 1994 (EP Act) — Environmental Protection
Regulation 2008 (EP Reg) — Environmental Protection
(Water) Policy 2009 (EPP Water)
— Coal Seam Gas Water Management Policy 2012
The EP Act regulates: • ‘Resource activities’ involving petroleum
activities (Chapter 5) and Environmentally Relevant Activities (ERAs) including release of a ‘contaminant’ to the environment when petroleum activities are carried out (s.19)
• Impacts to EVs • Management of coal seam water • Management of brine
• Nature Conservation Act 1992 (NC Act)
• Recognises and lists both individual species associated with springs, and ecological communities of native species dependent on springs.
• Queensland Water Quality Guidelines 2009 (QWQG)
• Provides a framework for assessment of surface water and groundwater quality throughout the GFD Project area.
• Informs the development of water quality objectives to protect EVs.
• Water Act 2000 (Water Act) • Provides for the management of impacts on underground water caused by the exercise of underground water rights by petroleum tenure holder
Department of Natural Resources and Mines (DNRM)
• Petroleum Act 1923 • Petroleum and Gas (Production and
Safety) Act 2004 (P&G Act)
Provide rights to extract gas and coal seam water within GFD Project tenures.
• Water Act 2000 (Water Act) • Regulates the following activities (primarily via water licensing): — Authorised and unauthorised
activities that interfere with surface watercourses (including petroleum activities); and
— The use of associated water (such as coal seam water) for uses other than those associated with a petroleum lease. This could include beneficial use options identified for coal seam water extracted within the GFD Project area.
• Provides guidance related to protection of EVs associated with water resources, including Water Resource Plans (WRPs) and Resource Operations Plans (ROPs).
• Licensing requirements for operators for non-authorised activities and use of associated water.
Office of Groundwater Impact Assessment (OGIA)
• Water Act 2000 (Water Act) • Identification of impacts on groundwater associated with coal seam water extraction in the Surat CMA.
Department of Agriculture, Fisheries and Forestry (DAFF)
• Fisheries Act 1994 Applicable in the event that watercourse crossings need to be established within the GFD Project area.
Gas Field Development Project EIS 2014
7
Intro
duct
ion
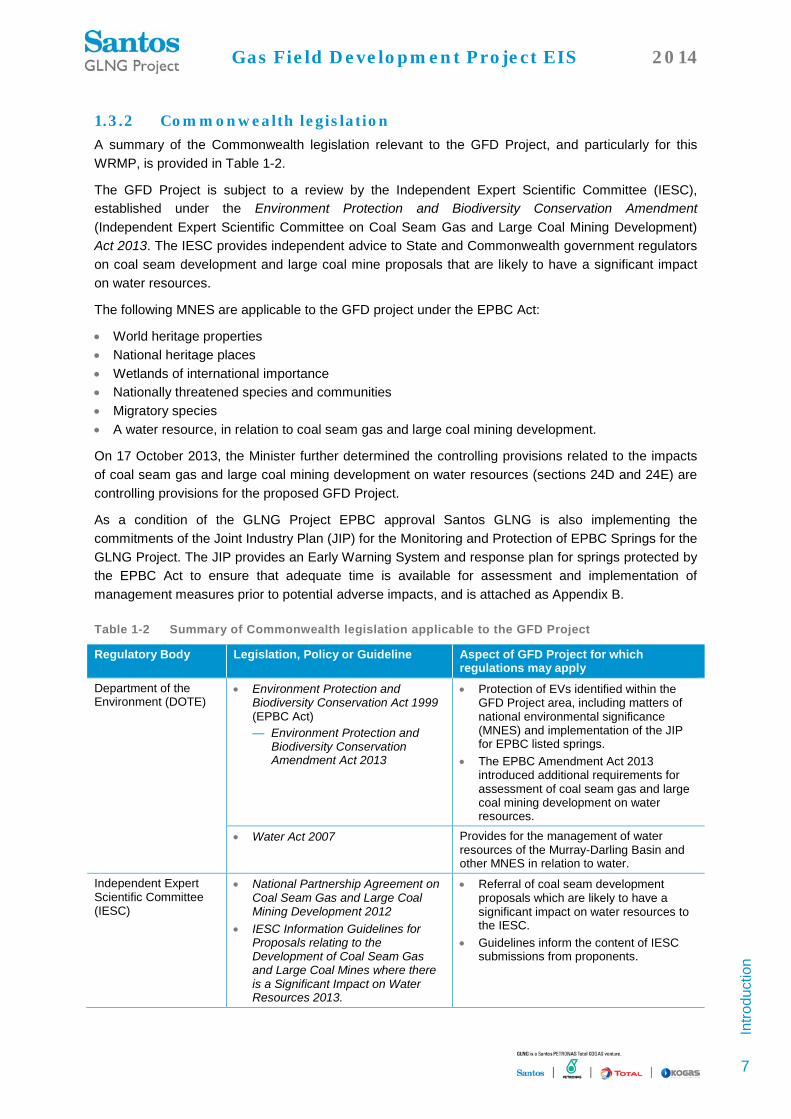
1.3.2 Commonwealth legislation A summary of the Commonwealth legislation relevant to the GFD Project, and particularly for this WRMP, is provided in Table 1-2.
The GFD Project is subject to a review by the Independent Expert Scientific Committee (IESC), established under the Environment Protection and Biodiversity Conservation Amendment (Independent Expert Scientific Committee on Coal Seam Gas and Large Coal Mining Development) Act 2013. The IESC provides independent advice to State and Commonwealth government regulators on coal seam development and large coal mine proposals that are likely to have a significant impact on water resources.
The following MNES are applicable to the GFD project under the EPBC Act:
• World heritage properties • National heritage places • Wetlands of international importance • Nationally threatened species and communities • Migratory species • A water resource, in relation to coal seam gas and large coal mining development.
On 17 October 2013, the Minister further determined the controlling provisions related to the impacts of coal seam gas and large coal mining development on water resources (sections 24D and 24E) are controlling provisions for the proposed GFD Project.
As a condition of the GLNG Project EPBC approval Santos GLNG is also implementing the commitments of the Joint Industry Plan (JIP) for the Monitoring and Protection of EPBC Springs for the GLNG Project. The JIP provides an Early Warning System and response plan for springs protected by the EPBC Act to ensure that adequate time is available for assessment and implementation of management measures prior to potential adverse impacts, and is attached as Appendix B.
Table 1-2 Summary of Commonwealth legislation applicable to the GFD Project
Regulatory Body Legislation, Policy or Guideline Aspect of GFD Project for which regulations may apply
Department of the Environment (DOTE)
• Environment Protection and Biodiversity Conservation Act 1999 (EPBC Act) — Environment Protection and
Biodiversity Conservation Amendment Act 2013
• Protection of EVs identified within the GFD Project area, including matters of national environmental significance (MNES) and implementation of the JIP for EPBC listed springs.
• The EPBC Amendment Act 2013 introduced additional requirements for assessment of coal seam gas and large coal mining development on water resources.
• Water Act 2007 Provides for the management of water resources of the Murray-Darling Basin and other MNES in relation to water.
Independent Expert Scientific Committee (IESC)
• National Partnership Agreement on Coal Seam Gas and Large Coal Mining Development 2012
• IESC Information Guidelines for Proposals relating to the Development of Coal Seam Gas and Large Coal Mines where there is a Significant Impact on Water Resources 2013.
• Referral of coal seam development proposals which are likely to have a significant impact on water resources to the IESC.
• Guidelines inform the content of IESC submissions from proponents.

Gas Field Development Project EIS 2014
8
Intro
duct
ion
1.4 Santos GLNG policy framework Santos GLNG has an existing Environment, Health and Safety Management System (EHSMS) which informs corporate responsibility and key principles across existing Santos GLNG operations at the corporate level. These standards will also apply to the GFD Project, and this WRMP.
The Santos GLNG corporate Environmental Policy (P040) details the corporate Environmental Vision to “continuously seek new ways to minimise our environmental impact across the lifecycle of our activities”; it includes specific commitments for maintenance and improvement of the EHSMS, and provides general principles of environmental stewardship responsibilities for Santos GLNG employees and contractors. The Environmental Policy also outlines a commitment to operational compliance, including monitoring, auditing, review and reporting processes.
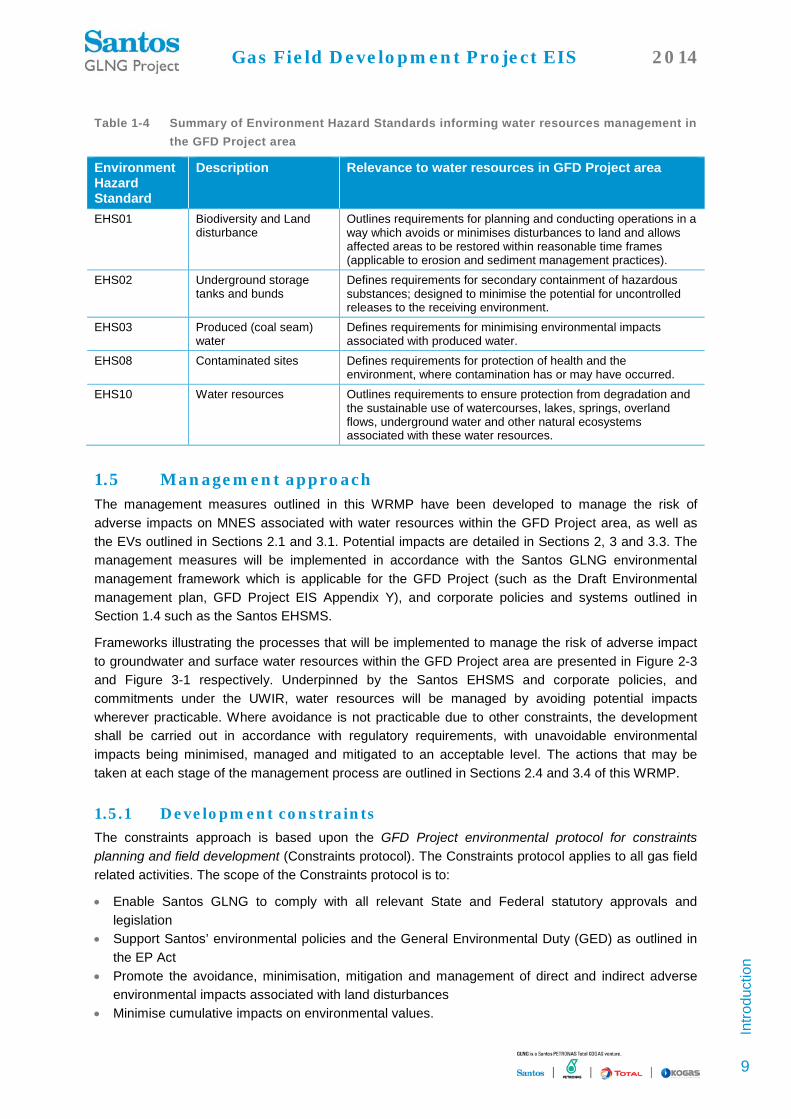
The EHSMS and accompanying Environment Hazard Standards (EHS) are designed to facilitate achievement of the commitments outlined at corporate level, and therefore provide practical guidance and procedures for operational activities. These standards have been applied in the development of this WRMP, in alignment with other management plans which govern operations that have the potential to impact on water resources. Table 1-3 and Table 1-4 explain how each of the EHSMS standards and EHS, respectively, are applicable to management of water resources within the GFD project area. These standards have been incorporated into the management approach for protection of water resources within the GFD Project area, outlined throughout this WRMP.
Table 1-3 Summary of Santos GLNG corporate policies and Environment, Health and Safety Management System as relevant to this WRMP
EHSMS Description Relevance to surface and ground water in GFD Project area
EHSMS01 Environmental health and safety policies
Activities of Santos GLNG employees and contractors with regards to improving environment, health and safety performance.
EHSMS02 Legal obligations and other requirements
Compliance with EA conditions; legislation; permits; industry codes; commitments and other obligations.
EHSMS03 Environmental health and safety objectives, targets and improvement plans
Specific, Measurable, Achievable, Relevant, and Timely (SMART) targets set to “measure and drive continuous improvement in environment, health and safety, and process safety performance across Santos GLNG”. EHS and process safety improvement plans set out the specific initiatives, actions and milestones for achieving these targets.
EHSMS05 EHS responsibility and accountability
Assigns roles, responsibilities and accountability for the implementation, maintenance and improvement of the EHSMS.
EHSMS09 Managing environmental health and safety risks
Outlines processes to systematically identify environmental hazards, assess their risk, and adopt control strategies to reduce risk to as low as reasonably practicable.
EHSMS11 Operations integrity Describes process safety management systems and tools that will be applied to prevent major hazards or catastrophic events that could lead to significant environmental harm (for example, standard operating procedures for design, construction, operation and decommissioning of facilities)
Gas Field Development Project EIS 2014
9
Intro
duct
ion
Table 1-4 Summary of Environment Hazard Standards informing water resources management in the GFD Project area
Environment Hazard Standard
Description Relevance to water resources in GFD Project area
EHS01 Biodiversity and Land disturbance
Outlines requirements for planning and conducting operations in a way which avoids or minimises disturbances to land and allows affected areas to be restored within reasonable time frames (applicable to erosion and sediment management practices).
EHS02 Underground storage tanks and bunds
Defines requirements for secondary containment of hazardous substances; designed to minimise the potential for uncontrolled releases to the receiving environment.
EHS03 Produced (coal seam) water
Defines requirements for minimising environmental impacts associated with produced water.
EHS08 Contaminated sites Defines requirements for protection of health and the environment, where contamination has or may have occurred.
EHS10 Water resources Outlines requirements to ensure protection from degradation and the sustainable use of watercourses, lakes, springs, overland flows, underground water and other natural ecosystems associated with these water resources.
1.5 Management approach The management measures outlined in this WRMP have been developed to manage the risk of adverse impacts on MNES associated with water resources within the GFD Project area, as well as the EVs outlined in Sections 2.1 and 3.1. Potential impacts are detailed in Sections 2, 3 and 3.3. The management measures will be implemented in accordance with the Santos GLNG environmental management framework which is applicable for the GFD Project (such as the Draft Environmental management plan, GFD Project EIS Appendix Y), and corporate policies and systems outlined in Section 1.4 such as the Santos EHSMS.
Frameworks illustrating the processes that will be implemented to manage the risk of adverse impact to groundwater and surface water resources within the GFD Project area are presented in Figure 2-3 and Figure 3-1 respectively. Underpinned by the Santos EHSMS and corporate policies, and commitments under the UWIR, water resources will be managed by avoiding potential impacts wherever practicable. Where avoidance is not practicable due to other constraints, the development shall be carried out in accordance with regulatory requirements, with unavoidable environmental impacts being minimised, managed and mitigated to an acceptable level. The actions that may be taken at each stage of the management process are outlined in Sections 2.4 and 3.4 of this WRMP.
1.5.1 Development constraints The constraints approach is based upon the GFD Project environmental protocol for constraints planning and field development (Constraints protocol). The Constraints protocol applies to all gas field related activities. The scope of the Constraints protocol is to:
• Enable Santos GLNG to comply with all relevant State and Federal statutory approvals and legislation
• Support Santos’ environmental policies and the General Environmental Duty (GED) as outlined in the EP Act
• Promote the avoidance, minimisation, mitigation and management of direct and indirect adverse environmental impacts associated with land disturbances
• Minimise cumulative impacts on environmental values.

Gas Field Development Project EIS 2014
10
Intro
duct
ion
The Constraints protocol is implemented to guide site selection and placement of infrastructure to align with the management frameworks shown in Figure 2-3 and Figure 3-1. The Constraints protocol targets the highest level of the management framework; avoidance, and then minimisation of impacts where practicable and in accordance with regulatory requirements. It includes a streamlined process to assess the location of infrastructure in order to firstly avoid, or then minimise, impact to environmentally sensitive areas such as wetlands, springs and watercourses. Monitoring is recognised as a critical component to manage risk across all management options. Further details regarding specific steps involved in implementing the Constraints protocol are outlined for both groundwater and surface water resources within this WRMP (sections 2.4.1and 3.4.1, respectively).
Figure 1-3 Management hierarchy
1.6 Structure of document This WRMP has been designed for use within field development planning and operational settings across the GFD Project area. It includes a summarised overview of the MNES, EVs and sensitive receptors identified during the course of the EIS process for water resources; describes the potential impacts on those aspects that have been identified as associated with GFD Project activities, and outlines the management approach that will be applied by Santos GLNG across the GFD Project to manage and mitigate the risk of adverse potential impacts.
This WRMP has also been developed to provide the level of information regarding impact mitigation that is required by the IESC Information Guidelines (2013). These requirements include the preparation of “a plan for the ongoing management and monitoring of the impact of the development on water resources [with a focus on] mitigating, managing and monitoring risks and assets identified in the assessment of the project, and be capable of tracking changes against pre-development conditions” (IESC 2013, p11).
Gas Field Development Project EIS 2014
11
Intro
duct
ion
The WRMP is informed by, and interacts with, a number of reports and environmental management documents that have been developed for the GLNG Project:
• Hydraulic connectivity characterisation (Appendix A) • Joint industry plan for an early warning system for the monitoring and protection of EPBC springs
(Appendix B) • Evaluation of prevention or mitigation options for Fairview springs (Appendix C) • Stimulation Impact Monitoring Program (Appendix D) • Ground deformation monitoring and management plan (Appendix E) • Santos GLNG Upstream Hydraulic fracturing risk assessment: Compendium of assessed fluid
systems (Appendix F) • Dawson river discharge scheme receiving environment monitoring program summary (Appendix G)
A brief overview of these documents is provided in Table 1-5 below.

Gas Field Development Project EIS 2014
12
Intro
duct
ion
Table 1-5 Overview of Reports and Environmental Management Documents relating to the WRMP
Document Title Description Santos GLNG CSG fields hydraulic connectivity characterisation
The focus of the hydraulic connectivity characterisation was to examine the hydraulic connectivity between the CSG production coal beds and the overlying and underlying aquifers to better estimate potential impacts from CSG water production on Great Artisan Basin (GAB) aquifers. The data gathered in this work will address several objectives: • Refinement of the conceptual hydrogeological model and update of the regional
cumulative Undeground Water Impact Report (UWIR; by the Office of Groundwater Impact Assessment - OGIA)). Findings are publically reported by the OGIA annually and are carried out in collaboration with CSIRO; Geoscience Australia; universities, and petroleum tenure holders;
• Characterisation of aquifer behaviour and hydrogeochemical characteristics which will be useful for a range of projects such as private bore assessments, springs characterisation or managed aquifer recharge. At a larger scale, Santos is sponsoring a research project lead by the University of Queensland which aims at developing a water chemistry atlas for the Surat and Bowen Basin CSG fields. The research will assess water quality data using a 3D approach with the objective of determining local scale geological controls on hydrological regime and consequent chemical characteristics.
• Regulatory compliance with the Project Conditions under the Environment and Protection and Biodiversity Act (EPBC Act 1999) by providing to the Commonwealth Department of Sustainability, Environment, Water Population and Communities (SEWPaC, now the Department of the Environment) the program of studies and current results regarding the hydraulic connectivity between CSG beds and aquifer sources of EPBC springs.
Hydraulic connectivity characterisation is being addressed by Santos GLNG through three types of activities: • Field programs, either specific to a study or ongoing; • Desktop based data collation and assessments; and • Update of the conceptual hydrogeological model and update and calibration of the
regional cumulative groundwater impact model. This report provides description of both the hydraulic connectivity studies carried out to date and their result; and the details of the development of the ongoing and upcoming studies. It is Santos GLNG’s understanding that the OGIA will take full responsibility for the direction and implementation of any future hydraulic connectivity studies post-2014, with technical support (e.g. data collection, data interpretation) provided by industry.
Joint industry plan for an early warning system for the monitoring and protection of EPBC springs
The coal seam gas operators in the southern Bowen and Surat Basins, Santos, Origin Energy and Origin Energy on behalf of APLNG (and the Queensland Gas Company (QGC) (the Proponents) have developed a Joint Industry Plan (JIP) for a groundwater monitoring and management system to ensure springs protected by the Environment Protection and Biodiversity Conservation Act 1999 (EPBC Act) are not impacted by coal seam gas production. The fundamental concepts and primary principles of the JIP are: • To ensure consistency in the approach to springs monitoring and management
between the proponents • To measure groundwater drawdown at locations and times such that meaningful
responses can be undertaken before there is any impact on Matters of National Environmental
• Significance (MNES) springs; • An early warning approach based on modelling and monitoring to manage
increasing levels of risk; • The use of the Surat CMA cumulative impact model (CIM) to assess risks to the
springs; • A clearly defined network of monitoring bores allocated to each of the proponents; • Single proponent responsibility for each EPBC spring aligning with Surat
Cumulative Management Area (CMA) Underground Water Impact Report (UWIR) Springs Strategy;
• Differences in approaches to limit/trigger setting at monitoring bores for on-tenure and off-tenure springs; and
• Alignment on exceedance response process and timing.

Gas Field Development Project EIS 2014
13
Intro
duct
ion
Document Title Description Evaluation of prevention or mitigation options for Fairview springs
The report addresses a condition issued to Santos under Water Act 2000 that options be identified to prevent or mitigate potential impacts to three spring complexes that may be caused by production of CSG from the Santos Fairview project area. The assessment and selection of spring impact prevention or mitigation options relies on: • The definition of the understanding of the hydrogeological settings for each spring
complex • The level of impact expected at the spring complex based on the model prediction
published in the Surat 2012 Underground Water Impact Report (Queensland Water Commission, 2012)
• The understanding of the vulnerability of the environmental values at the springs • An analysis of a wide range of options, based on a range of criteria that include
effectiveness and site specific hydrogeological information. The identified preferred options for preventing or mitigating potential spring impacts are set out in the report. The options are classified as to whether they are prevention (e.g. stopping changes in groundwater levels well before they reach the spring areas) or as mitigation (e.g. preventing adverse impacts at the springs).
Stimulation impact monitoring program
The Stimulation impact monitoring program has been developed prior to the carrying out of hydraulic fracturing activities (hereafter referred to as stimulation activities) and is being implemented by Santos to address the requirements for monitoring the stimulation activities which will be conducted in the following coal seam gas fields of the GLNG Project areas: • Arcadia Valley Project Area (AVPA) • Fairview Project Area (FPA) • Roma Shallow Gas Project Area (RSGPA) The purpose of the Stimulation Impact Monitoring Program is to: • provide practices and procedures for monitoring stimulation activities to detect
potential adverse impacts to water quality and/or the connection of a target gas producing formation and another aquifer, should they occur; and
• outline rectification measures that will be taken immediately if Santos becomes aware that stimulation activities have resulted in a change in water quality other than that within the stimulation impact zone of the target gas producing formation or that stimulation activities have caused the connection of the target gas producing formation and another aquifer.
The Stimulation impact monitoring program presents a general description of the stimulation activities to be conducted by Santos, the regulatory requirements pertinent to stimulation monitoring as well as the practices and procedures which comprise the monitoring program.
Dawson river discharge scheme receiving environment monitoring program summary
The need to release treated coal seam water to the Dawson River, within the Fairview gas field, was considered as part of the coal seam water management strategy for the GLNG Project EIS (released in 2009). Following detailed studies of the potential impacts on the surface water and groundwater environmental values, in 2012 the Dawson river release strategy was identified as being the only remaining viable, sustainable option to utilise the balance of coal seam water produced from the Fairview gas field once on-tenure operational use (mainly for dust suppression) and irrigation had taken place. The overall purpose of the Receiving Environment Monitoring Program (REMP) is to monitor, identify and describe any adverse impacts to surface water environmental values, quality and flows as a result of authorised releases of treated coal seam water to the Dawson River (EPPG00928713). The REMP will be structured to include the elements specifically listed by the EA; however, a high level summary is included here to provide an indication of its content, and demonstrate how the REMP will be relevant for the Gas Field Development Project.

Gas Field Development Project EIS 2014
14
Intro
duct
ion
Document Title Description Ground deformation monitoring and management plan
The management plan address the conditions relating to the potential coal seam gas extractions that could potentially result in ground subsidence. The conditions state that: • Baseline and ongoing geodetic programs to quantify deformation at the land surface
within the proponents tenures. This should link from the tenure scale to the wider region across which groundwater extraction activities are occurring and any relevant regional program of monitoring;
• Modelling to estimate the potential hydrogeological implications of the predicted surface and subsurface deformation;
• Measures for linking surface and subsurface deformation arising from CSG activities; and
• Within 12 months of the survey completion, provide to the minister, a management plan for all relevant springs which includes special mechanism to avoid, minimise and manage risks, and response actions that can be taken by the proponent where subsidence or surface deformation occurs, particularly if it impacts on surface or groundwater hydrology.
The report includes a baseline assessment that was undertaken in 2011 and 2012 for the extent of the CSG fields in the Surat and Bowen basins. This assessment included 13 to 24 satellite images per track (i.e. measurements) dating from December 2006 to February 2011. These images were used to establish radar stable points to be used to extract precise displacement and position information over the project area. The consultant that completed the initial assessment has been engaged to continue ongoing monitoring for an additional 2.5 years. Should the subsidence trigger be exceeded, Santos GLNG will carry out an investigation to identify the process resulting in the exceedance.
Santos GLNG Upstream hydraulic fracturing risk assessment: Compendium of assessed fluid systems
The report addresses all regulatory requirements contained within the Environment Protection and Biodiversity Conservation Act 1999 (EPBC Act) approval, CG conditions and Environmental Authority (EA) and synthesizes the findings of all hydraulic fracturing risk assessments completed to date. The document includes information and assessment on all the hydraulic fracturing fluids currently used by Santos GLNG and provides a framework for inclusion of new fluids systems within the risk assessment document. In accordance with the regulatory requirements, this report also documents the conditions in all of Santos GLNG’s gas fields, herein referred to as project areas, the Roma Shallow Gas Project Area (RSGPA), FPA (Fairview Project Area), AVPA (Arcadia Valley Project Area), and Scotia Project Area (SPA) and describes the process by which hydraulic fracturing is conducted and monitored. It should be noted that for the purposes of this document the RSGPA also incorporates tenures to the east, which are referred to as the Roma Shallow Gas Project Area East (RSGPAE).

Gas Field Development Project EIS 2014
15
Gro
undw
ater
reso
urce
s
2 Groundwater resources
The GFD Project tenures are underlain by a number of aquifers that provide water supply for agriculture and industry. The major aquifers that occur within the GFD Project area are associated with the Great Artesian Basin (GAB), which comprises groundwater bearing units of the Surat Basin and the upper Bowen Basin, as well as water bearing zones within Tertiary rocks and alluvial deposits. The Rewan Group forms the basal unit of the GAB on a regional scale. The GFD Project is located in the recharge area of the GAB.
The main productive water bearing formations in the GFD Project area include:
• Quaternary alluvial aquifer systems associated with the unconsolidated sediments of the Condamine-Balonne River, the Dawson River and the Comet River systems
• Minor aquifers within Tertiary fractured basalt and sediments caps • Water bearing formations of the GAB. These include the Clematis Sandstone, Precipice
Sandstone, Hutton Sandstone, Springbok Sandstone, Gubberamunda Sandstone, Mooga Sandstone and Bungil Formation.
An overview of the regional hydro-stratigraphy (geological formations and their associated aquifer systems) underlying the GFD Project area is provided in Figure 2-1. The Bungil and Orallo formations are generally not considered to be aquifers, but are used for water supply in limited areas of the GFD Project area. Alluvial aquifer systems exist in the vicinity of GFD Project tenures associated with the main drainage systems: the Condamine-Balonne River system in the southern Roma area, the Dawson River system in the central-eastern Taroom area and the Comet River system in the northern area near Rolleston. The Condamine Alluvium, located near Dalby, is the most significant and highly developed alluvial system in the Surat CMA, however it is remote from the GFD Project tenures.
Natural discharge from aquifers in GFD Project tenures occurs through vent springs, baseflow to rivers (watercourse springs), natural vertical leakage between aquifers and subsurface flow into adjoining areas. Appendix A contains an assessment program of hydraulic connectivity between GAB aquifers associated with the GFD Project area, in addition to the summary provided in Section 2.3.3 below.
A detailed assessment of the groundwater resources within the GFD Project area was undertaken as part of the EIS process (refer to Parsons Brinckerhoff 2014 and EIS Appendix U2 MNES Water Resources); the findings are summarised here to provide context to the management measures that are outlined in this WRMP. The WRMP has also been developed in consideration of the findings of the UWIR 2012 completed for the Surat CMA by the Queensland Water Commission (QWC), now the Office of Groundwater Impact Assessment (OGIA).

Gas Field Development Project EIS 2014
16
Gro
undw
ater
reso
urce
s
Figure 2-1 Regional hydro-stratigraphy (from OGIA 2012)
2.1 Environmental values The EVs that are applicable to groundwater within the GFD Project area are summarised in Table 2-1. They were defined on the basis of the following documents:
• Comet River Sub-basin Environmental Values and Water Quality Objectives (DERM 2011a) • Dawson River Sub-basin Environmental Values and Water Quality Objectives (DERM, 2011b) • Draft Environmental Values for the Groundwaters of the Condamine Catchment, Queensland
(Condamine Alliance 2012a) • Draft Environmental Values for the Surface Waters of the Condamine Catchment, Queensland
(Condamine Alliance 2012b).

Gas Field Development Project EIS 2014
17
Gro
undw
ater
reso
urce
s
Surface water EVs are relevant to this assessment because watercourse springs occur in each of the gas fields.
The assessment of EVs for groundwater and surface water were undertaken separately (at different times) and therefore used different information sources and reference documents. The receiving water environments that groundwater may discharge to are listed in the surface water section (Section 3.1 below). The Arcadia, Fairview and Scotia gas fields are located within the Comet and Dawson river sub-basins of the Fitzroy River Basin. The Roma gas field is located in the Condamine-Balonne River Basin. The existing EVs for the related surface water environments are summarised in Table 3-1 and Table 3-2, Section 3.1.
Table 2-1 EVs identified for groundwater resources within the GFD Project area (Fitzroy Basin; as defined in Schedule 1 of the EPP Water)
EVs Comet River Sub-basin
Dawson River Sub-basin
Condamine-Balonne River Basin
Protection of aquatic ecosystem
Primary contact recreation (e.g. swimming)*
Secondary recreation (e.g. boating)*
Visual (no contact) recreation*
Drinking water supplies
Crop irrigation
Stock watering
Farm supply/use
Aquaculture (e.g. red claw, barramundi)
Human consumers of aquatic food
Industrial use (including manufacturing plants, power generation)
Protection of cultural and spiritual activities
= EV identified for groundwater resources within the GFD Project area. X = EV not applicable for groundwater resources within the GFD Project area *Primary, secondary and visual recreational contact, aquaculture and human consumers of aquatic food have been included as EV’s for groundwater due to groundwater contributions to surface water baseflow in some tenure.
2.2 Sensitive groundwater receptors Groundwater dependent ecosystems (GDEs) are communities of plants, animals and other organisms that depend on groundwater for survival. A GDE may be either entirely dependent on groundwater for survival, or may use groundwater opportunistically or for a supplementary source of water.
Within the GFD Project area, the main types of surface expression GDEs present are associated with spring vents and watercourse springs fed by natural discharge from GAB aquifers which are managed through the EPBC Act and the Qld Water Act (refer to Appendix U2 MNES Water Resources section 4.4.1 for details).

Gas Field Development Project EIS 2014
18
Gro
undw
ater
reso
urce
s
The sensitive groundwater receptors in the GFD Project area are:
• users that access groundwater from hydrogeological units for domestic water supplies and stock watering, and to a lesser extent, agriculture, aquaculture, urban and industrial purposes
• ecosystems dependent on groundwater from springs, including spring vents and watercourse springs which provide baseflow to streams.
2.2.1 Springs The groundwater assessment undertaken during the EIS process identified a number of spring vents and watercourse springs within the portions of the Surat CMA that are overlaid by the GFD Project area. The findings are summarised here for the purpose of illustrating the extent and general nature of potentially sensitive groundwater receptors identified, and therefore providing context to the management measures that will be implemented to manage the risk of adverse impacts to these receptors within the GFD Project area. The potential impacts on springs within the GFD Project are summarised in Section 2.3.2, as context to the management approach outlined in Section 2.4
2.2.1.1 Spring complexes Spring complexes identified within the GFD Project area were recognised as requiring protection under the EPBC Act are considered to be MNES (as ‘nationally threatened species and ecological communities’). Spring complexes are groups of spring vents in close proximity to each other; spring vents are single points in the landscape where groundwater is discharged at the surface.
Numerical groundwater model results for the EIS scenario were used to conduct an initial screening to identify springs of interest (Parsons Brinckerhoff 2014). Springs of interest are springs underlain by a formation (including coal seams) where the long-term maximum predicted impact on water pressures at the location of the spring (but not necessarily in the source aquifer of the spring) exceeds 0.2 m or is within 10 km of 0.2 m depressurisation. As a precautionary approach, EPBC springs located up to an additional 5 km outside the 10 km buffer were also included. The buffers were considered precautionary as they allow for the limitations associated with modelling very small changes in water pressure.
A total of 45 springs complexes and 33 watercourse springs were identified as springs of interest in the Surat Cumulative Management Area (CMA). Of these, a total of 13 springs complexes and 19 watercourse springs have been identified as being at risk of depressurisation impacts due to the cumulative development of gas in the Surat CMA under the EIS scenario.
Spring vents have been assigned a conservation ranking, to inform management of the risk of potential impacts associated with the GFD Project. Definitions of each ranking category are listed in Table 2-2. A list of the spring complexes located within or adjacent to the GFD Project area is provided in Table 2-3.
Table 2-2 Conservation ranking for GAB springs (adopted from Fensham et al., 2012)
Conservation ranking Description
Category 1a Contains at least one GAB endemic species not known from another location beyond this spring complex.
Category 1b Contains endemic species known from more than one spring complex; or has populations of threatened species listed under State or Commonwealth legislation that do not conform to Category 1a.
Category 2 Provides habitat for populations of plant and/or animal species not known from habitat other than spring wetlands within 250km.

Gas Field Development Project EIS 2014
19
Gro
undw
ater
reso
urce
s
Conservation ranking Description
Category 3 Spring wetland vegetation without isolated populations (Category 2) with at least one native plant species that is not a widespread coloniser of disturbed areas.
Category 4a Spring wetland vegetation comprised of exotic and/or only native species that are wide spread colonisers of disturbed areas.
Category 4b The original spring wetland is destroyed by impoundment or excavation. The probability of important biological values being identified in the future is very low.
Category 5 All springs inactive.
Table 2-3 Spring vents located in GFD Project tenures
Complex number
Complex name Vent number Source aquifer(s) Gas field
EPB
C A
ct
Con
serv
atio
n R
anki
ng
78 78 551, 552 Clematis Sandstone Arcadia 3
229* Ponies 284 Hutton Sandstone Fairview 2
230 Lucky Last
287, 340, 686, 687, 687.1, 687.2, 687.3, 687.4, 687.5, 687.6, 688, 689
Evergreen Formation (Boxvale Sandstone), Precipice Sandstone
Fairview 1b
308 308 nv383 Clematis Sandstone Arcadia -
311 311
499, 500, 500.1, 535, 536, 536.1, 536.2, 537, 692, 693, 694, 695, 696, 697, 698, 699, 704
Precipice Sandstone Fairview 2
327 327 nv385 Precipice Sandstone Fairview -
507^ VI_mile 188, 679, 680, 680.1
Gubberamunda Sandstone Roma 4b
561 Spring Rock Creek 285
Evergreen Formation (Boxvale Sandstone), Precipice Sandstone
Fairview 3
583@ Lenore Hills nv621 Tertiary Volcanics. Clematis Sandstone Arcadia 3
591 Yebna 2 534 Evergreen Formation, Precipice Sandstone Fairview 3
592# Abyss 286, 286.1, 286.2, 286.3 Hutton Sandstone Fairview 286+ 1b
These springs are most likely associated with perched groundwater systems and therefore unlikely to be affected by water level changes in the aquifer ^ Vent 187 not located within GFD Project tenures # Vents 682 and 716 not located within GFD Project tenures @ Vents 710 and nv622 not located within GFD Project tenures + Vent 286 is listed under the EPBC Act.

Gas Field Development Project EIS 2014
20
Gro
undw
ater
reso
urce
s
2.2.1.2 Watercourse springs A watercourse spring is a section of a watercourse where groundwater enters the stream from an aquifer through the streambed. Watercourse springs provide base-flow to streams and support in-stream aquatic ecosystems, and may be of particular ecological importance during periods of low rainfall. Eleven watercourse springs have been identified within the GFD project area; these are summarised in Table 2-4. Information regarding the risk of impacts to these watercourse springs is provided in Section 2.3.2, as context to the management approaches outlined in Section 2.4.
Table 2-4 Watercourse springs located in GFD Project tenures
Site number Source aquifer (OGIA, 2013) Watercourse receiving baseflow Gas field
W10 Mooga Sandstone, Gubberamunda Sandstone
Blyth Creek Roma
W14 Hutton Sandstone Bungaban Creek Scotia W17 Mooga Sandstone Bungeworgorai Creek Roma W18 Gubberamunda Sandstone Bungil Creek Roma W19 Mooga Sandstone Bungil Creek Roma W26 Clematis Sandstone Clematis Creek Arcadia W35 Clematis Sandstone Conciliation Creek Arcadia W40 Precipice Sandstone Dawson River Fairview W81 Hutton Sandstone Hutton Creek Fairview W82 Hutton Sandstone Injune Creek Fairview W164 Mooga Sandstone Yuleba Creek Roma
2.2.2 Wetlands and vegetation The Qld GDE mapping indicates a low or moderate confidence that the wetlands and streams in the Surat CMA are groundwater dependent. There is one wetland and 385 streams that fall within GFD tenures.
The Robinson and Palm Tree Creeks Wetland, located in the north of ATP 803P in the Scotia gas field, is supported by surface water and not groundwater. A report prepared by Alluvium (2014) for the Fitzroy Basin Association highlighted the key characteristics and environmental values associated with the wetland systems of Palm Tree and Robinson Creeks. The complex covers approximately 50,223 ha and includes around 154 wetlands; 134 of which are associated with Palm Tree Creek, while the remaining 20 are associated with Robinson Creek. These wetlands are considered to be semi-permanent, and their areal extent and depth changes in response to rainfall. Alluvium (2014) identified the following ecosystem services that are provided by the Palm Tree and Robinson Creeks wetland systems:
• Regionally unique wetland complex, which is not well represented in other areas of the Fitzroy River Basin.
• Diverse and abundant native wetland flora; particularly a low population of serious invasive weeds, and with a biodiversity status designated as ‘Of concern’ (EHP 2013c, cited in Alluvium, p13). The wetland flora also provides habitat and food for aquatic macroinvertebrates; fish; turtles, and waterbirds.
• Habitat for threatened species, including the nationally vulnerable squatter pigeon; and the turquoise parrot; cotton pygmy-goose; black-necked stork, and freckled duck which are all designated as threatened species in Queensland (Briggs 2013, cited in Alluvium 2014, p. v)
• Refuge habitat, especially during period when adjacent regions are in drought. • Water resource for stock from surrounding pastoral land. • Recreation and amenity values; particularly for swimming, bird watching, picnics, and boating.

Gas Field Development Project EIS 2014
21
Gro
undw
ater
reso
urce
s
There are numerous vegetation ecosystems within the GFD Project area (Aurecon, 2014), although only a small sub-set of these are likely to be groundwater dependent. Where vegetation ecosystems are dependent on groundwater, the dependence will generally be on the formation that outcrops at that location (i.e. the shallow, surficial groundwater system). The Queensland GDE mapping identified terrestrial ecosystems with the potential to be dependent on groundwater from the GAB aquifers. The Queensland GDE mapping indicates a low or moderate confidence that the terrestrial ecosystems in the Surat CMA are groundwater dependent. The biodiversity status of the Regional Ecosystems in these areas is ‘no concern at present’.
2.3 Potential impacts The Queensland Government has implemented a legislative regime to ensure the petroleum and gas industry develops in a responsible way. The regime applies to conventional petroleum and gas production as well as non-conventional (coal seam) gas production.
Under the regime, petroleum tenure holders have the right to extract groundwater in the process of petroleum and gas production (P&G Act), but are required to monitor and manage the impacts on springs and water supplies (Water Act). This includes a requirement to ‘make good’ impairment (due to changes in pressure or water quality) of private bore supplies caused by the exercise of these rights.
In areas where gas fields are being developed by multiple companies, the impacts of water extraction on groundwater levels may overlap. In these situations a cumulative approach is required to assess and manage impacts and a CMA may be declared (as has occurred for the Surat CMA). The OGIA is responsible for assessing cumulative impacts in these areas and establishing integrated management arrangements through the preparation of an UWIR.
The UWIR for the Surat CMA was released in 2012 and is a statutory instrument under the Water Act. The report assesses the cumulative impacts of water extraction by petroleum tenure holders on groundwater in the Surat CMA, and establishes integrated management arrangements. In preparing the UWIR, the OGIA undertook numerical groundwater modelling to predict potential impacts on water pressure. This modelling must be reviewed and replaced every three years under Queensland legislation; a new UWIR for the Surat CMA is due in 2015.

Gas Field Development Project EIS 2014
22
Gro
undw
ater
reso
urce
s
Since the UWIR was released in 2012, and for the purpose of determining potential groundwater impact from the proposed GFD Project, the numerical groundwater flow model has been refined and run twice. The first simulation provided a baseline scenario, referred to as ‘the UWIR Scenario’. This regional groundwater flow model for the Surat CMA included Santos GLNG’s production activities, as well as other production developments including all petroleum tenure holders.
In mid-2013 the OGIA modelled the regional groundwater flow for the Surat CMA to simulate development changes associated with the GFD Project and more development proposed by another proponent. This second simulation is referred to as ‘the EIS Scenario’.
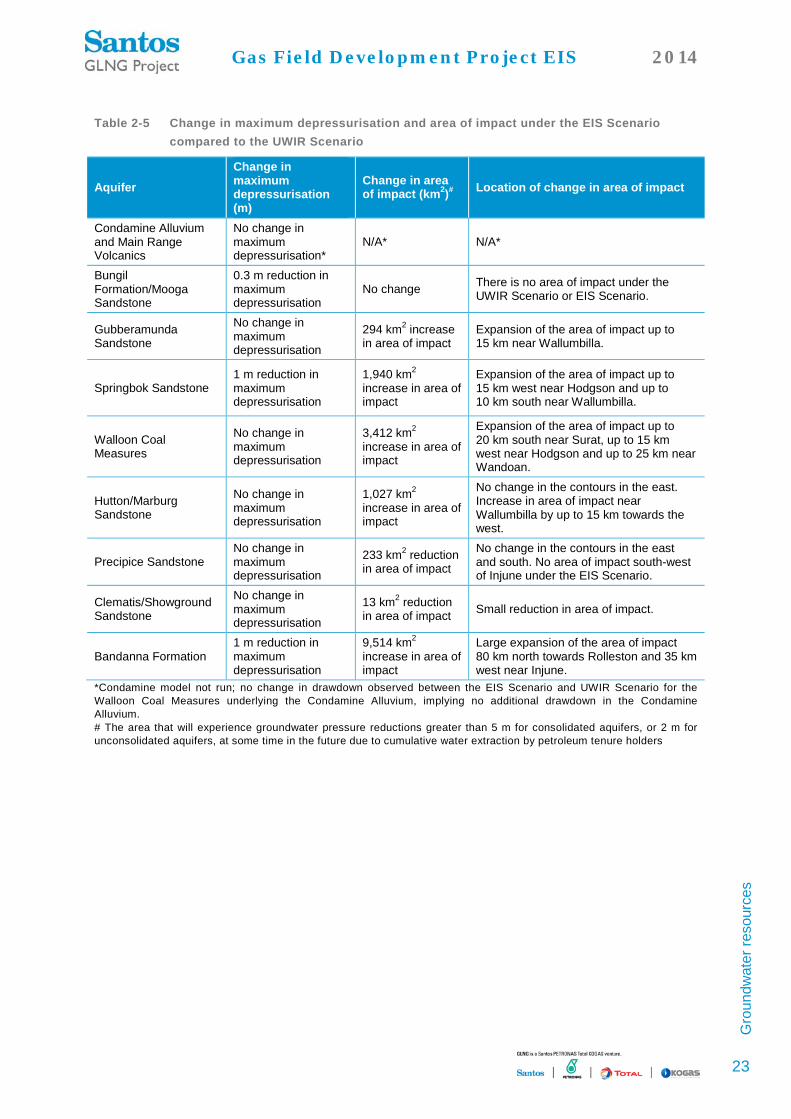
The predicted, potential impacts outlined in this WRMP were primarily identified using the outcomes of the EIS Scenario numerical groundwater modelling, in comparison with the results of the ‘UWIR Scenario’ model. Santos GLNG has also prepared conceptual water balance models for the Fairview, Arcadia, Roma and Scotia gas fields within the GFD Project; these models incorporate numerical groundwater modelling results from the UWIR. Further discussion of the risk-based methodology for assessment of impacts to groundwater can be found in Appendix U2 of the GFD Project EIS. Table 2-5 provides a summary of the predicted (quantified) impacts for the EIS Scenario, compared with the UWIR Scenario. The numerical groundwater model identified no impacts to alluvial aquifers associated with the GFD Project and are therefore not discussed further. Impacts to unconsolidated aquifers have not been predicted for the GFD Project using numerical groundwater modelling.
In addition to the predicted impacts to groundwater resources quantified by the numerical groundwater modelling, impacts to groundwater resources that may occur as a result of GFD Project activities were evaluated using a significance assessment methodology. The significance assessment identified where there may be impacts in relation to project activities. A degree of sensitivity (low, moderate, or high) was assigned to the EVs identified for groundwater resources (as outlined in Section 2.1), and the magnitude of potential impacts to the EVs was also assessed on a scale of low, moderate or high. Together, these factors were then examined to determine the significance of potential impacts arising from GFD Project activities. Table 2-6 outlines the GFD Project activities that could potentially have an impact on groundwater EVs at different phases of development. An approach for managing these predicted and qualitatively assessed impacts to groundwater is outlined in Section 2.4.
Gas Field Development Project EIS 2014
23
Gro
undw
ater
reso
urce
s
Table 2-5 Change in maximum depressurisation and area of impact under the EIS Scenario compared to the UWIR Scenario
Aquifer Change in maximum depressurisation (m)
Change in area of impact (km2)# Location of change in area of impact
Condamine Alluvium and Main Range Volcanics
No change in maximum depressurisation*
N/A* N/A*
Bungil Formation/Mooga Sandstone
0.3 m reduction in maximum depressurisation
No change There is no area of impact under the UWIR Scenario or EIS Scenario.
Gubberamunda Sandstone
No change in maximum depressurisation
294 km2 increase in area of impact
Expansion of the area of impact up to 15 km near Wallumbilla.
Springbok Sandstone 1 m reduction in maximum depressurisation
1,940 km2 increase in area of impact
Expansion of the area of impact up to 15 km west near Hodgson and up to 10 km south near Wallumbilla.
Walloon Coal Measures
No change in maximum depressurisation
3,412 km2 increase in area of impact
Expansion of the area of impact up to 20 km south near Surat, up to 15 km west near Hodgson and up to 25 km near Wandoan.
Hutton/Marburg Sandstone
No change in maximum depressurisation
1,027 km2 increase in area of impact
No change in the contours in the east. Increase in area of impact near Wallumbilla by up to 15 km towards the west.
Precipice Sandstone No change in maximum depressurisation
233 km2 reduction in area of impact
No change in the contours in the east and south. No area of impact south-west of Injune under the EIS Scenario.
Clematis/Showground Sandstone
No change in maximum depressurisation
13 km2 reduction in area of impact Small reduction in area of impact.
Bandanna Formation 1 m reduction in maximum depressurisation
9,514 km2 increase in area of impact
Large expansion of the area of impact 80 km north towards Rolleston and 35 km west near Injune.
*Condamine model not run; no change in drawdown observed between the EIS Scenario and UWIR Scenario for the Walloon Coal Measures underlying the Condamine Alluvium, implying no additional drawdown in the Condamine Alluvium. # The area that will experience groundwater pressure reductions greater than 5 m for consolidated aquifers, or 2 m for unconsolidated aquifers, at some time in the future due to cumulative water extraction by petroleum tenure holders

Gas Field Development Project EIS 2014
24
Gro
undw
ater
reso
urce
s
Table 2-6 Potential impacts to groundwater EVs resulting from GFD Project activities
Potential impacts Construction phase activities
Operations phase activities
Decommissioning and rehabilitation phase activities
Applicable management plans
Aquifer depressurisation
Decline in groundwater levels/pressure in bores and reduced supply to groundwater users
• Drilling and construction of production wells, re-injection wells, water supply bores and monitoring bores
• Sub-surface activities, including the construction of borrow pits, quarries laydown areas, buried pipelines and storage ponds or dams
• Operation of production wells, i.e. extraction of groundwater for gas production Operation and maintenance of water supply bores
Decommissioning of production wells
• Underground Water Impact Report for the Surat Cumulative Management Area
• Joint-Industry Early Warning System for EPBC Springs Quality Plan (Early Warning System (EWS) Plan)
• Constraints protocol • Water resource
management plan (WRMP)
• Draft EM plan
Reduced stream baseflow (watercourse spring flow) and loss or reduction of supply to downstream surface water users Reduced spring flow and loss or degradation of dependent ecosystems (including EPBC listed springs) Reduced stream baseflow (watercourse spring flow) and loss or degradation of dependent aquatic ecosystems (including EPBC listed springs) Subsidence, altering groundwater flow paths and aquifer storage
• None • Operation of production wells, i.e. extraction of groundwater for gas production
None applicable • Water resource management plan WRMP
• Underground Water Impact Report for the Surat Cumulative Management Area
• Ground deformation monitoring and management plan (GDMMP)
Subsidence, causing ground surface displacement and altering surface water flow paths

Gas Field Development Project EIS 2014
25
Gro
undw
ater
reso
urce
s
Potential impacts Construction phase activities
Operations phase activities
Decommissioning and rehabilitation phase activities
Applicable management plans
Changes to water quality
Degradation of the beneficial use of groundwater supplies
• Drilling and construction of production wells, re-injection wells, water supply bores and monitoring bores
• Sub-surface activities, including the construction of borrow pits, quarries, laydown areas, buried pipelines and storage ponds or dams
• Construction of surface infrastructure
• Hydraulic fracturing • Storage of brine
generated during treatment of water from coal seams
• Brine disposal through injection into deep formations
• Storage of water from coal seams
• Disposal of treated water from coal seams through reinjection into aquifers (Managed Aquifer Recharge)
• Disposal of treated water from coal seams through beneficial reuse for irrigation and stock watering
• Hydro-testing of gas or treated water pipelines
• Sewage treatment facilities
• Decommissioning of production wells
• Rehabilitation of surface infrastructure
• Constraints protocol • Water resource
management plan (WRMP)
• Underground Water Impact Report for the Surat Cumulative Management Area
• Coal seam water management strategy
• Draft EM plan • Hydraulic fracturing
risk assessment • Contingency plan for
emergency environmental incidents (Contingency plan)
• Land release management plan (LRMP)
• Stimulation Impact Monitoring Program
Loss or degradation of ecosystems dependent on springs sourced from affected aquifers

Gas Field Development Project EIS 2014
26
Gro
undw
ater
reso
urce
s
2.3.1 Landholder bores Alluvial aquifers in the GFD Project tenures have been variably developed for irrigation, stock and domestic and town water supplies. Data from registered landholder bores in the alluvium indicates yields range between 1-23 L/s and water quality is typically fresh and slightly acidic to neutral. There are 29 registered landholder bores screened in the various alluvial aquifer systems in the GFD Project tenures mostly located near Scotia of which all are reported to support stock and domestic purposes with an estimated take of 87 ML/year (OGIA, 2013).
The Tertiary Main Range Volcanics host aquifers used for irrigation, stock and domestic and town supplies. The aquifers occur at depths ranging from 2 to 155 m below ground surface with thicknesses generally varying from 10 to 30 m. Bore yields are highly variable due to variable aquifer properties. They range from less than 5 L/s to 50 L/s, with an average of approximately 20 L/s. There are eight registered landholder bores screened in the Tertiary basalts in the GFD Project tenures of which all are reported to support stock and domestic purposes with an estimated take of 24 ML/year (OGIA, 2013).
A quantitative impact assessment of potential cumulative impacts to landholder (landholder includes all private bores including industrial, urban, domestic, or agricultural) water bores was undertaken based on the results of the initial OGIA groundwater modelling (2012; using the UWIR Scenario). Additional modelling was undertaken to identify potential cumulative impacts for the EIS Scenario.
The two impacts that are potentially most significant for water bores are drawdown and depressurisation. Drawdown is when the groundwater level in a bore within a confined groundwater system, or the elevation of a water table in an unconfined groundwater system, changes due to the extraction of groundwater. Depressurisation involves a reduction in groundwater pore pressure (pressure head) in a confined groundwater system due to extraction of groundwater.
The area of impact has been assessed in a similar way to the long-term affected area (LAA) described in the UWIR. The LAA is the area that may experience groundwater pressure reductions greater than 5 m for consolidated aquifers, or 2 m for unconsolidated aquifers, at some time in the future due to cumulative water extraction by petroleum tenure holders.
The results indicate the area of impact will increase due to the expansion of areas being developed. The largest increases in depressurisation impacted areas occur within the two target coal formations (the Walloon Coal Measures and the Bandanna Formation). There are also increases in the extent of the depressurisation impacted areas within the overlying Springbok Formation, the Hutton Sandstone and the Gubberamunda Sandstone.
Landholder bores where aquifer pressure is predicted to decline within three years (by more than 5 m for consolidated aquifers and 2 m for unconsolidated aquifers) were identified in the UWIR in 2012. The predicted changes in depressurisation due to the proposed GFD Project will not result in additional impacts to landholder bores before 2015, as the additional production wells are not proposed to start production until after that date.
The UWIR in 2012 predicted that 528 landholder bores would be cumulatively impacted due to petroleum and gas development in Surat CMA. Under the EIS Scenario, an additional 73 private water bores in the Surat CMA, 48 of which are in the GFD Project tenures, are predicted to be impacted. The numerical groundwater model identified that no bores associated with unconsolidated aquifers were potentially impacted.
The change in number of bores that will potentially be impacted under the EIS Scenario, compared with the UWIR scenario, is summarised in Table 2-7.
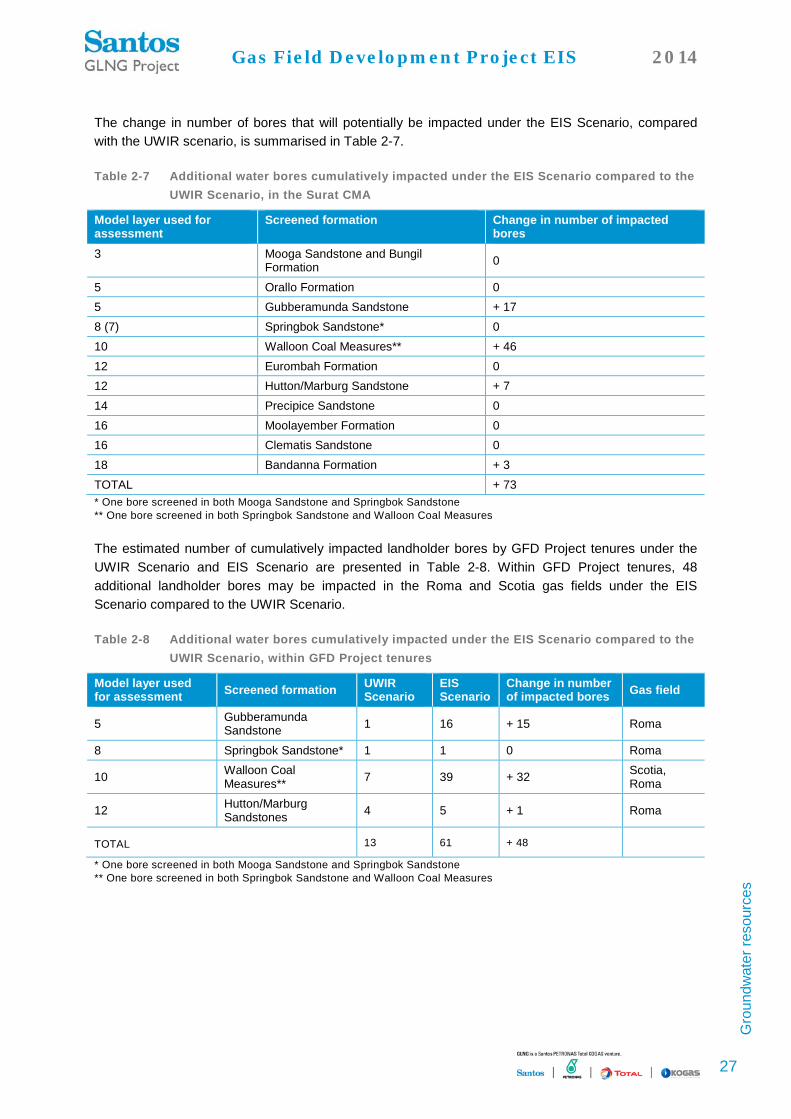
Gas Field Development Project EIS 2014
27
Gro
undw
ater
reso
urce
s
The change in number of bores that will potentially be impacted under the EIS Scenario, compared with the UWIR scenario, is summarised in Table 2-7.
Table 2-7 Additional water bores cumulatively impacted under the EIS Scenario compared to the UWIR Scenario, in the Surat CMA
Model layer used for assessment
Screened formation Change in number of impacted bores
3 Mooga Sandstone and Bungil Formation 0
5 Orallo Formation 0 5 Gubberamunda Sandstone + 17 8 (7) Springbok Sandstone* 0 10 Walloon Coal Measures** + 46 12 Eurombah Formation 0 12 Hutton/Marburg Sandstone + 7 14 Precipice Sandstone 0 16 Moolayember Formation 0 16 Clematis Sandstone 0 18 Bandanna Formation + 3 TOTAL + 73 * One bore screened in both Mooga Sandstone and Springbok Sandstone ** One bore screened in both Springbok Sandstone and Walloon Coal Measures
The estimated number of cumulatively impacted landholder bores by GFD Project tenures under the UWIR Scenario and EIS Scenario are presented in Table 2-8. Within GFD Project tenures, 48 additional landholder bores may be impacted in the Roma and Scotia gas fields under the EIS Scenario compared to the UWIR Scenario.
Table 2-8 Additional water bores cumulatively impacted under the EIS Scenario compared to the UWIR Scenario, within GFD Project tenures
Model layer used for assessment Screened formation UWIR
Scenario EIS Scenario
Change in number of impacted bores Gas field
5 Gubberamunda Sandstone 1 16 + 15 Roma
8 Springbok Sandstone* 1 1 0 Roma
10 Walloon Coal Measures** 7 39 + 32 Scotia,
Roma
12 Hutton/Marburg Sandstones 4 5 + 1 Roma
TOTAL 13 61 + 48
* One bore screened in both Mooga Sandstone and Springbok Sandstone ** One bore screened in both Springbok Sandstone and Walloon Coal Measures

Gas Field Development Project EIS 2014
28
Gro
undw
ater
reso
urce
s
The UWIR and OGIA model relies on Queensland Government databases to identify the number and location of private bores. Experience of gas proponents to date has been that up to one third of bores in OGIA database have been abandoned or can no longer be found. Baseline assessments, which include site visits, are performed to obtain basic information about private bores. The GLNG Baseline Assessment Program seeks to benchmarks data for the private water bores located on its tenures, prior to any impact of production activities. The Baseline Assessment Program indicates that of the 48 impacted bores which are located on GFD Project tenures:
• 66% (32) were observed to be in use by the landholder • 23% (11) could not be located by the landholder, or else were not in use or were abandoned • 10% (5) of private water bores have not yet been surveyed, and will be assessed in accordance
with the UWIR.
2.3.2 Springs Numerical groundwater model results for the EIS Scenario (additional to the UWIR completed in 2012) have been used to conduct an initial screening to identify springs of interest for the GFD Project, as described in Section 2.2.1.
A risk-based methodology was employed to assess the likelihood of the springs of interest experiencing impacts due to the development of gas. The methodology was developed in consultation with the OGIA and followed a similar approach to that used in the UWIR for the Surat CMA.
Of the 13 springs complexes and 19 watercourse springs in the Surat CMA identified as being at risk (refer to Section 2.2.1.1), a total of eight spring complexes and 12 watercourse springs were identified as being at risk of impacts within or near the GFD Project area, as a result of the risk-based assessment. These spring complexes and watercourse springs are depicted in Figure 2-2. Table 2-9 and Table 2-10 include summaries of predicted maximum depressurisation in springs potential source aquifers, year of maximum depressurisation and year the 0.2 m trigger (defined in the Water Act) is exceeded under the EIS Scenario for these springs. The UWIR identified 6 spring complexes and 12 watercourse springs located within or near Santos GLNG tenures to be at risk of impacts. Two additional spring complexes (302 and 339) and one additional watercourse spring (W141) located within or near GFD Project tenures have been assessed to be at risk of impacts under the EIS scenario. The following should be considered in relation to Table 2-9 and Table 2-10:

Gas Field Development Project EIS 2014
29
Gro
undw
ater
reso
urce
s
Table 2-9 Spring complexes at risk of depressurisation impacts within or near GFD Project tenures
Spring complex name
Spring complex number
Vent number(s) Most likely source aquifer (OGIA, 2013)
Impacted underlying formations where the source aquifer is not impacted*
Gas field
Summary of model predictions for the EIS Scenario
Maximum impact to source aquifer (m)
(UWIR scenario maximum impact)
Year 0.2 m trigger is exceeded
Maximum impact^
(m)
Year of maximum
impact
Ponies 229 284 Hutton Sandstone
Precipice Sandstone, Clematis Sandstone, Bandanna Formation
Fairview <0.2 1999 508
2018
Lucky Last 230 287,340, 686, 687, 687.1, 687.2, 687.3, 687.4, 687.5, 687.6, 688, 689
Evergreen Formation (Boxvale Sandstone), Precipice Sandstone
NA Fairview 1.68
(1–1.5)
2016 1.68
2052
302 302 539, 539.1 Precipice Sandstone
Bandanna Formation
East of Arcadia
<0.2 2093 26.3 2585
311 311 499, 500, 500.1, 535, 536, 536.1, 536.2, 537, 692, 693, 694, 695, 696, 697, 698, 699
Precipice Sandstone
NA Fairview <0.2
(0.2–0.5)
NA <0.2
2054
Lonely Eddie
339 706, 707, 708, 709
Precipice Sandstone
NA NW of Fairview
<0.2 NA <0.2 2125
Spring Rock Creek
561 285 Evergreen Formation (Boxvale
NA Fairview 1.89
(1–1.5)
2016 1.89
2054

Gas Field Development Project EIS 2014
30
Gro
undw
ater
reso
urce
s
Spring complex name
Spring complex number
Vent number(s) Most likely source aquifer (OGIA, 2013)
Impacted underlying formations where the source aquifer is not impacted*
Gas field
Summary of model predictions for the EIS Scenario
Maximum impact to source aquifer (m)
(UWIR scenario maximum impact)
Year 0.2 m trigger is exceeded
Maximum impact^
(m)
Year of maximum
impact
Sandstone), Precipice Sandstone
Yebna 2 591 534 Evergreen Formation, Precipice Sandstone
NA Fairview <0.2
(0.2–0.5)
NA <0.2
2069
Abyss 592 286, 286.1, 286.2, 286.3, 682, 716
Hutton Sandstone
Precipice Sandstone, Clematis Sandstone, Bandanna Formation
Fairview <0.2 2000 391 2017
1) NA – Not applicable 2) Bold Impacted under the EIS Scenario but not the UWIR Scenario. 3) * Impacted underlying formations shown where the source aquifer is not impacted 4) ^ Impact assessment results are presented for the formation shown in italics

Gas Field Development Project EIS 2014
31
Gro
undw
ater
reso
urce
s
Table 2-10 Watercourse springs at risk of depressurisation impacts within or near GFD Project tenures
Watercourse spring site number
Watercourse name
Most likely source aquifer (OGIA, 2013)
Impacted underlying formations where the source aquifer is not impacted*
Gas field Summary of model predictions for the EIS Scenario
Maximum impact to source aquifer (m)
Year 0.2 m trigger is exceeded
Maximum impact^ (m)
Year of maximum impact
W10 Blyth Creek Mooga Sandstone, Gubberamunda Sandstone
NA Roma 5.1 2027 5.1 2235
W14 Bungaban Creek Hutton Sandstone
NA Scotia 0.7 2056 0.7 2205
W15 Bungaban Creek (North)
Hutton Sandstone
NA East of Scotia
0.7 2056 0.7 2205
W16 Bungeworgorai Creek
Gubberamunda Sandstone
NA North West of Roma
<0.2 NA <0.2 2535
W18 Bungil Creek Gubberamunda Sandstone
NA Roma <0.2 NA <0.2 2125
W19 Bungil Creek Mooga Sandstone
NA Roma 0.21 2425 0.21 2535
W40 Dawson River (Central)
Precipice Sandstone
NA Fairview <0.2 NA <0.2 2076
W80 Hutton Creek Hutton Sandstone
Precipice Formation, Clematis Sandstone, Bandanna Formation
West of Fairview
<0.2 2000 70.1 2020

Gas Field Development Project EIS 2014
32
Gro
undw
ater
reso
urce
s
Watercourse spring site number
Watercourse name
Most likely source aquifer (OGIA, 2013)
Impacted underlying formations where the source aquifer is not impacted*
Gas field Summary of model predictions for the EIS Scenario
Maximum impact to source aquifer (m)
Year 0.2 m trigger is exceeded
Maximum impact^ (m)
Year of maximum impact
W81 Hutton Creek Hutton Sandstone
Precipice Formation, Clematis Sandstone, Bandanna Formation
Fairview <0.2 1996 714 2017
W82 Injune Creek Hutton Sandstone
Precipice Formation, Clematis Sandstone, Bandanna Formation
Fairview <0.2 1998 417 2017
W141 Robinson Creek
Hutton Sandstone
NA West of Scotia
<0.2 NA <0.2 2062
W164 Yuleba Creek Mooga Sandstone
NA Roma 0.54 2145 0.54 2475
1. NA – Not applicable 2. Bold Impacted under the EIS Scenario but not the UWIR Scenario. 3. * Impacted underlying formations shown where the source aquifer is not impacted 4. ^ Impact assessment results are presented for the formation shown in italics

Draft
!
!
!!!
!
!
!
!
!!
!
!
!
!
Warrego Hwy
Carna
rvon H
wy
Lake NugaNuga
Leichha
rdt Hw
y
Dawson Hwy
Surat
MilesYuleba
WallumbillaRomaMitchell
Wandoan
Injune
Taroom
MouraBauhinia
RollestonBiloela
Springsure
Blackwater
Balonn
e River
Dawson River
Cond amine R iver
Comet River
W15
W82
W19
W16
W18
W40W81
W10 W164
W141
W14
W80
229230
302
311
339
561 591
592
594
150°
150°
149°
149°
148°
148°
-24°
-24°
-25°
-25°
-26°
-26°
-27°
-27°
/
GFD PROJECT EIS SPRINGS AT RISK OF IMPACTS WITHIN OR NEAR THE GFD PROJECT TENURE
Whilst every care is taken by URS to ensure the accuracy of the digital data, URS makes no representation or warranties about its accuracy, reliability, completeness, suitability for any particular purpose and disclaims all responsibility and liability (including without limitation, liability in negligence) for any expenses,losses, damages (including indirect or consequential damage) and costs which may be incurred as a result of data being inaccurate in any way for any reason. Electronic files are provided for information only. The data in these files is not controlled or subject to automatic updates for users outside of URS.
Source:Data supplied by client and by Parsons BrickenhoffThis map may contain data sourced from: © Mapinfo Australia Pty Ltd and PSMA Australia Ltd., © Commonwealth of Australia (Geoscience Australia) 2012 , © The State of Queensland 2012, Bing Maps © Microsoft Corporation and its data suppliers.
This d
rawing
is sub
ject to
COPY
RIGHT
.BN
E
10 0 10 20 30 40 Km
1:2,000,000Projection: GDA94
! TownsRailwaysMajor roadsMajor drainage
Arcadia gas fieldFairview gas fieldRoma gas fieldScotia gas fieldPossible area for supportinginfrastructure
GFD Project areaProduction tenure of other proponents "
Spring complex at risk of impacts (EISscenario)
) EPBC spring complexWatercourse springs at risk of impacts(EIS scenario)
Surat cumulative management area
File No:
WATER RESOURCES MANAGEMENT PLAN42627338-g-003.mxd Drawn: MH Approved: RS Date:
Figure:
A4
2-2Rev. A27-08-2014
Gas Field Development Project EIS 2014
34
Gro
undw
ater
reso
urce
s
2.3.3 Hydraulic fracturing Hydraulic fracturing, or coal seam stimulation, is a process used to improve the efficiency of natural gas extraction from coal seams. Hydraulic fracturing is not used for all wells and most wells drilled to date in Queensland have not been fracture stimulated. Hydraulic fracturing is generally, although not exclusively, used in areas where the coal seams have lower permeability. By improving the production efficiency, it potentially reduces the number of required wells to deliver the required rate of gas production. The process of hydraulic fracturing, and the types of substances that may be utilised, is detailed further in Section 4 of Appendix F
In the hydraulic fracturing process, fluid is pumped down a well and then into the coal seams through small holes or perforations in the steel casing. The fluid is pumped at sufficient pressure to open small passageways into the coal seam and interconnect the naturally occurring fractures or cleats. Once the coal seam has been fractured, sand size particles (known as a propant) are placed by the fluid to hold open (prop open) the fracture connections. The fluid used in the stimulation process is then allowed to flow back into the well and is pumped to the surface.
Hydraulic fracturing fluid typically includes up to 99% water and sand, with about 1% of a range of additives in diluted quantities. The additives assist in carrying and dispersing the sand into the coal seam. The materials used by Santos GLNG in the hydraulic fracturing process have been subjected to a risk assessment (Appendix F) and are publicly disclosed on the EHP website. A summary of this risk assessment is provided in Section 2.3.2.1 below. In accordance with Queensland regulations the materials used do not include benzene, toluene, ethylbenzene, xylene (BTEX) orpolycyclic aromatic hydrocarbons (PAHs) compounds as additives.
The hydraulic fracturing process has the potential to impact groundwater levels or pressures by creating or enhancing a pathway between the coal seam and an aquifer. The likelihood of this occurring is considered to be low. The hydraulic fracturing process is engineered and designed to ensure that fracturing remains within the target coal seam, thus preventing the formation of new pathways to aquifers. Fractures created during the hydraulic stimulation process generally are of the order of several millimetres wide and may propagate many metres horizontally away from the well.
Transport of gas and remnant hydraulic fracturing fluids have the potential to impact water quality within the target coal seams and hydrogeological units connected to them. This may subsequently affect the water quality of landholder water supplies and springs (if present). The transport of gas and fluids from the coal seams may occur along faults or fractures/unconformities within the rock, or as a result of failures in the casing or seals of production wells.
The results of groundwater modelling indicate that the coal seams have limited connectivity with the adjacent aquifers. The majority of gas and fracturing fluid transport is therefore likely to occur within the target coal seams themselves. The hydraulic fracturing process is designed to ensure that fracturing remains within the target seam, thus preventing the formation of new pathways to other aquifers.
2.3.3.1 Hydraulic fracturing fluid quantitative risk assessment Santos GLNG has completed a qualitative and quantitative risk assessment (QRA) of the risks posed by hydraulic fracturing fluid mixtures that may be used in the gas extraction process for the GFD Project. The QRA evaluated the toxicity of individual substances that may be used, for a range of exposure pathways, and characterised the cumulative risks of the total effluent toxicity and ecotoxicity for each substance in accordance with the National Water Quality Management Strategy (NWQMS). The assessment included an initial screening of the individual constituent concentrations against trigger values contained within Australian and New Zealand Environment and Conservation Council; Agriculture and Resource Management Council of Australia and New Zealand (ANZECC 2000), or

Gas Field Development Project EIS 2014
35
Gro
undw
ater
reso
urce
s
other relevant international screening values and conservatively derived chemical specific trigger values. Toxicity for each constituent was assessed for the following attributes:
• Persistence • Bio-accumulation and aquatic toxicity • Terrestrial toxicity • Human health toxicity.
Following the initial screening, the QRA assessed the cumulative risks posed by each constituent to human health and terrestrial receptors (consistent with enHealth methodology).
It was determined that the chemicals used in hydraulic fracturing fluid systems can be generally characterized as non-hazardous with no high hazard chemicals identified in the semi-quantitative assessments. Overall, the health concerns from these chemicals are limited with the primary concerns identified associated with potential risks to aquatic receptors. No carcinogenic compounds are used in any of the hydraulic fracturing fluid systems used by Santos GLNG. The chemicals used in the hydraulic fracturing process do not contain BTEX or polycyclic aromatic hydrocarbons as additives.
The only potentially complete exposure pathways (as identified by the risk assessment (for all aspects of the environment; Appendix F) were:
• incidental ingestion and dermal contact by potential trespassers at well pads; • livestock and native fauna exposure to flow-back fluids (ingestion only) at the well pads; and • potential releases (i.e. spill) of transported or stored chemicals or flow-back fluids to aquatic
environments.
These three exposure pathways occur at the ground surface only and will therefore be managed at the surface (i.e. they are not relevant for groundwater). Further detail on the risk assessments (including the QRA) completed for hydraulic fracturing fluids within the GFD Project is outlined in Appendix F.
2.3.4 Hydraulic connectivity Santos GLNG has assessed the hydraulic connectivity between formations to characterise the level of hydraulic connectivity between the gas producing coal beds and the overlying and underlying aquifers. Santos GLNG is also further assessing potential horizontal pathways for impact propagation, i.e. assessing the horizontal variability of formation characteristics. This includes characterisation of the formations considered as aquitards.
The studies carried out to date include (Santos GLNG, 2013):
• Monitoring of water pressures at a number of multi-level pressure monitoring bores and vibrating wire piezometers to inform on horizontal and vertical groundwater gradients
• Monitoring water quality including isotopes (12C and 13C) at landholder bores, monitoring bores and gas wells to define the chemical signature of formations
• A deep aquifer monitoring program involving conversion of eight conventional gas wells into monitoring wells
• Fitting of existing landholder bores with pressure gauges and automatic recording loggers to observe response to pumping from nearby production activities
• A field coring program involving in-situ and laboratory testing of hydraulic conductivity • The Managed Aquifer Recharge (MAR) trials at Hermitage (within the Roma gas field), which
comprised injection and pumping tests and the assessment of the hydraulic responses • Ongoing testing of hydraulic conductivity for the major coal seams of the Walloon Coal Measures.
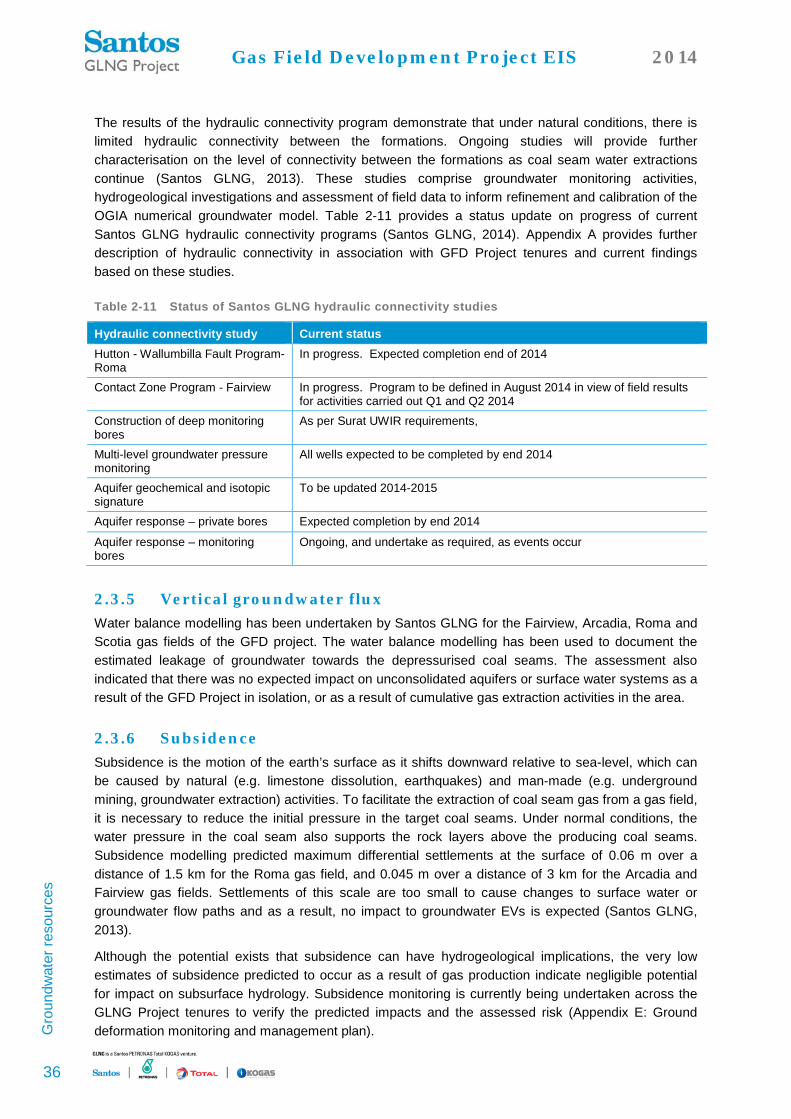
Gas Field Development Project EIS 2014
36
Gro
undw
ater
reso
urce
s
The results of the hydraulic connectivity program demonstrate that under natural conditions, there is limited hydraulic connectivity between the formations. Ongoing studies will provide further characterisation on the level of connectivity between the formations as coal seam water extractions continue (Santos GLNG, 2013). These studies comprise groundwater monitoring activities, hydrogeological investigations and assessment of field data to inform refinement and calibration of the OGIA numerical groundwater model. Table 2-11 provides a status update on progress of current Santos GLNG hydraulic connectivity programs (Santos GLNG, 2014). Appendix A provides further description of hydraulic connectivity in association with GFD Project tenures and current findings based on these studies.
Table 2-11 Status of Santos GLNG hydraulic connectivity studies
Hydraulic connectivity study Current status Hutton - Wallumbilla Fault Program- Roma
In progress. Expected completion end of 2014
Contact Zone Program - Fairview In progress. Program to be defined in August 2014 in view of field results for activities carried out Q1 and Q2 2014
Construction of deep monitoring bores
As per Surat UWIR requirements,
Multi-level groundwater pressure monitoring
All wells expected to be completed by end 2014
Aquifer geochemical and isotopic signature
To be updated 2014-2015
Aquifer response – private bores Expected completion by end 2014
Aquifer response – monitoring bores
Ongoing, and undertake as required, as events occur
2.3.5 Vertical groundwater flux Water balance modelling has been undertaken by Santos GLNG for the Fairview, Arcadia, Roma and Scotia gas fields of the GFD project. The water balance modelling has been used to document the estimated leakage of groundwater towards the depressurised coal seams. The assessment also indicated that there was no expected impact on unconsolidated aquifers or surface water systems as a result of the GFD Project in isolation, or as a result of cumulative gas extraction activities in the area.
2.3.6 Subsidence Subsidence is the motion of the earth’s surface as it shifts downward relative to sea-level, which can be caused by natural (e.g. limestone dissolution, earthquakes) and man-made (e.g. underground mining, groundwater extraction) activities. To facilitate the extraction of coal seam gas from a gas field, it is necessary to reduce the initial pressure in the target coal seams. Under normal conditions, the water pressure in the coal seam also supports the rock layers above the producing coal seams. Subsidence modelling predicted maximum differential settlements at the surface of 0.06 m over a distance of 1.5 km for the Roma gas field, and 0.045 m over a distance of 3 km for the Arcadia and Fairview gas fields. Settlements of this scale are too small to cause changes to surface water or groundwater flow paths and as a result, no impact to groundwater EVs is expected (Santos GLNG, 2013).
Although the potential exists that subsidence can have hydrogeological implications, the very low estimates of subsidence predicted to occur as a result of gas production indicate negligible potential for impact on subsurface hydrology. Subsidence monitoring is currently being undertaken across the GLNG Project tenures to verify the predicted impacts and the assessed risk (Appendix E: Ground deformation monitoring and management plan).
Gas Field Development Project EIS 2014
37
Gro
undw
ater
reso
urce
s
2.4 Management approach The management measures outlined in this WRMP have been developed to manage the risk of potential adverse impact to EVs associated with water resources identified within the GFD Project area as outlined in Section 2.3. These measures will be implemented in the context of the wider management framework for the GFD Project (such as the draft environmental management plan, GFD Project EIS Appendix Y); corporate policies outlined in Section 1.4, such as the Santos GLNG EHSMS, and commitments under the UWIR as outlined in Section 1.3.
A decision matrix illustrating the process that will be implemented to manage groundwater resources within the GFD Project area is contained in Figure 2-3. The following sub-sections outline the actions that may be taken at each stage of the management process.
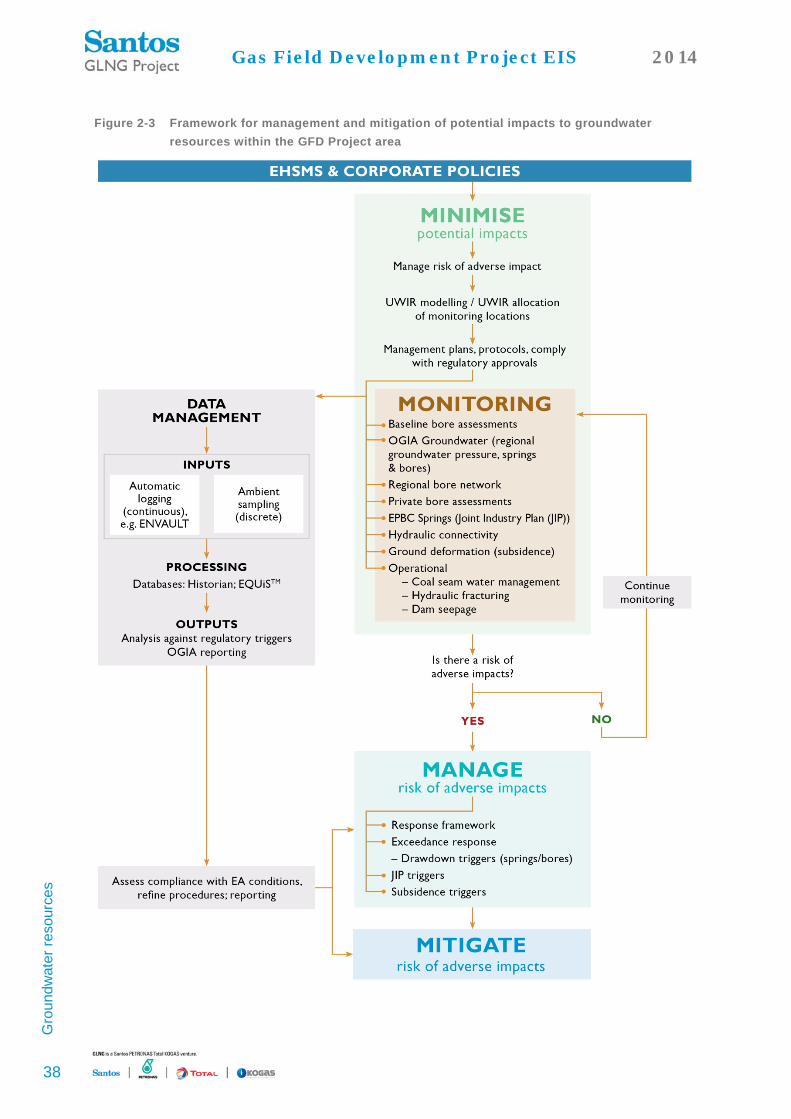
Gas Field Development Project EIS 2014
38
Gro
undw
ater
reso
urce
s
Figure 2-3 Framework for management and mitigation of potential impacts to groundwater resources within the GFD Project area

Gas Field Development Project EIS 2014
39
Gro
undw
ater
reso
urce
s
2.4.1 Development constraints Specific constraints for GFD Project development have been identified and categorised in relation to groundwater resources; these are summarised in Table 2-12. It is noted that potential impacts to groundwater associated with drawdown and depressurisation are managed via statutory requirements associated with UWIR from all proponents within the Surat CMA, including Santos GLNG.
Table 2-12 Constraints applied to GFD Project development for the protection of groundwater resources
Constraint categories
Development constraint Constraint details (relevant to groundwater resources)
No-go area No GFD Project activities permitted in these areas.
• EPBC Act-listed spring vents and complexes including primary 200 m buffer.
• Wetlands of national importance, including 200 m buffer.
• Wetlands of high ecological significance or high conservation value.
Surface development exclusion area
Only low impact petroleum activities1 permitted.
• Primary 200 m buffer for Category A ESA's. • Ramsar sites listed as wetlands of international
importance. High constraint area Low impact petroleum
activities1 and linear infrastructure2 permitted.
• Wetlands defined as ‘general ecologically significant wetland’ or ‘wetland of other environmental value’.
• Spring vents and complexes (not protected under the EPBC Act) located within Santos GLNG tenures, including primary 200 m buffer.
Moderate constraint area
Low impact petroleum activities1, linear infrastructure2 and limited petroleum activities3 are permitted.
• Secondary 100 m buffer for Category A ESAs. • Secondary 100 m buffer for spring vents and spring
complexes protected under the EPBC Act. • MNES including habitats (threatened species habitat
and migratory species habitat), threatened ecological communities (derived from state regional ecosystem mapping or verified from field surveys) and flora species.
• Endangered regional ecosystems including primary 200 m buffer.
Low constraint area All petroleum activities4 are permitted.
No constraints relevant to groundwater.
1 Low impact petroleum activities means petroleum activities that do not result in the clearing of native vegetation, earthworks or excavation work that cause either, a significant disruption to the soil profile or permanent damage to vegetation that cannot be easily rehabilitated immediately after the activity is completed. Examples of such activities include (but are not necessarily limited to) coreholes, geophysical surveys, seismic surveys, soil surveys, topographic surveys, cadastral surveys, ecological surveys, installation of environmental monitoring equipment (including surface water).
2 Linear infrastructure means linear infrastructure including (but not limited to) gas and water gathering lines, low and high pressure gas and water transmission pipelines, power lines, communication, roads and access tracks. 3 Limited petroleum activities mean any low impact petroleum activity and single well leases (includes observation, pilot, injection and production wells) and associated infrastructure (water pumps and generators, sumps, flare pits or dams) located on the well lease; multi-well leases and associated infrastructure (water pumps and generators, sumps, flare pits, dams or tanks) located on the well leases; construction of new access tracks that are required as part of the construction or servicing a petroleum activity; upgrading or maintenance of existing roads or tracks, power and communication lines, gas gathering lines from a well lease to the gas compression facility; water gathering lines from a well lease to water storage; and camps within well lease that may involve sewage treatment works that are a no release works. 4 Petroleum activities include low impact petroleum activities, limited petroleum activities, and all other GFD Project activities including major facilities such as permanent accommodation camps, gas treatment facilities, air strips, gas compression facilities, water management facilities such as water storage and water treatment facilities.

Gas Field Development Project EIS 2014
40
Gro
undw
ater
reso
urce
s
The Constraints protocol prioritises avoidance of impacts to water resources during field planning by identifying those areas that are not amenable to development (particularly those listed in Table 2-12). Santos GLNG has several management plans and policies in place to direct the development approach in the event that development does need to proceed in areas with identified constraints (as illustrated in Figure 2-3). The approach has been developed to minimise the potential impact to groundwater environmental values.
2.4.2 Location and frequency of monitoring Groundwater monitoring across the GFD Project area is undertaken according to the Draft EM Plan (EIS Appendix Y), relevant regulatory criteria, and requirements under the UWIR.
Since 2008, Santos GLNG has implemented a regional groundwater monitoring program to establish background groundwater characteristics and to provide a baseline against which to monitor predicted impact to groundwater resources as a result of gas production activities. The monitoring network continues to be implemented based on the requirements of the UWIR (OGIA 2012) and 2013 JIP (Appendix B). There are three components to the program:
• Dedicated monitoring bores targeting specific aquifers, water level and quality • Bore baseline assessment undertaken by Santos GLNG between 2009 and 2013, visiting 793
private bores across GFD Project tenures (Golder 2011 and URS 2013) • Multi-level water pressure gauges to enable monitoring of water pressure in various units within the
same borehole.
Table 2-13 summarises the number of groundwater locations monitored by Santos GLNG as part of current operations throughout the proposed GFD Project area. All existing groundwater monitoring locations are also shown on Figure 2-4.
Table 2-13 Summary of regional groundwater locations
Formation Private bores (including
telemetered farm bores)
Santos GLNG vibrating wire
piezometers
Santos GLNG groundwater
monitoring bores
TOTAL
Bungil Formation 5 - - 5
Mooga Sandstone 27 9 4 40 Orallo Formation 20 - 3 23 Gubberamunda Sandstone 14 15 14 43 Westbourne Formation - 4 - 4 Springbok Sandstone - 5 - 5 Walloon Coal Measures 10 38 - 48 Hutton Sandstone 8 - - 8 Precipice Sandstone - 8 5 13 Clematis Sandstone 1 - - 1 Bandanna Formation - 21 - 21 TOTAL 85 100 26 211 Note: “-“ indicates that monitoring is not currently undertaken for the associated location.
Groundwater monitoring locations have also been or are in the process of being installed as a requirement of the UWIR’s Regional Monitoring Network (Appendix G of the UWIR, OGIA 2012).

Gas Field Development Project EIS 2014
41
Gro
undw
ater
reso
urce
s
The groundwater monitoring program applies to:
• Regional and local groundwater levels and quality • Groundwater bores in the vicinity of hydraulic stimulation activities (refer to Appendix F) • EPBC springs (refer to Appendix B) • Hydraulic connectivity studies (such as that presented in Appendix A) • Beneficial use programs (i.e. MAR).
The groundwater monitoring program utilises three types of monitoring infrastructure including:
• Dedicated groundwater monitoring bores that target the water levels and water quality of specific aquifers
• Private bores identified through an extensive bore inventory as suitable for groundwater quality and/or groundwater level monitoring (the selected bores target a single known aquifer)
• Multi-level VWP or, quartz or sapphire pressure gauge installations, measuring the pressure of the surrounding formation at their installed depth. Multi-level installations allow for monitoring of water levels in various units within the same borehole. The piezometers, in the case of VWPs, are cement grouted during installation therefore no water sample can be collected from VWPs.
In addition to the existing network, Santos GLNG is installing the following:
• Additional groundwater monitoring locations as required by the Surat UWIR (2012). These additional bores are part of a larger network defined in the Surat UWIR, taking into account the cumulative effects (estimated groundwater drawdown) of gas operations in the Surat CMA. The program of implementation for this regional groundwater monitoring system required by OGIA (2012) for Santos GLNG tenures was submitted to OGIA prior to April 2014.
• An EPBC spring specific monitoring network: Santos GLNG and its industry collaborators have assimilated the estimated drawdown from OGIA (2012) groundwater model results in order to develop a systematic, ‘small-footprint’ approach to monitoring the cumulative impact of aquifer drawdown across the production tenures and adjacent impact areas. This monitoring system is focussed on established MNES values (currently based on the EPBC-listed springs identified in the Queensland Herbarium’s report (2012)). Specific information on this program can be found in Appendix B.
Table 2-14 presents a summary of the groundwater monitoring program applied across the GFD Project area. Specific GIS coordinates for each existing monitoring location are listed in Appendix H.
2.4.2.1 Data management Data from Santos GLNG’s monitoring network is captured and stored electronically in three main purpose deigned databases. The primary databases used by the project are:
• EQuiS • Envault • BAM (Baseline Assessment Manager).
Water quality data encompasses surface water and groundwater directly used or potentially affected by Santos GLNG operations, as well as regional monitoring. The EQuIS database captures and stores both field results and lab analysed water quality data. The database contains a number of internal quality control measures to ensure incoming and outgoing data is of high quality standard. Due to the flexibility of data that can be stored in EQuIS, it also captures other data sets which can be utilised for analysis or auditing such as logger climate, water level and water pressure data. EQuIS also serves as the source for the data sets published on the Santos Water Portal.

Gas Field Development Project EIS 2014
42
Gro
undw
ater
reso
urce
s
2.4.3 Response framework The management response to changes in the condition of the groundwater environment pertaining to the GFD Project varies depending on the type of groundwater receptor that is potentially impacted. In general, incidents related to acute impacts will be responded to in accordance with Santos EHSMS 15 (Incident Investigation and Response) as described in Section 1.4 (Table 1-3). Specific response procedures related to different groundwater receptors are detailed in Sections 2.4.4 and 2.4.5 below. This sub-section details the process followed by Santos GLNG to manage potential impacts to groundwater receptors in the event that an exceedance to a pre-defined trigger is detected. All management and mitigation actions constituting the response will be undertaken in alignment with the framework outlined in Figure 2-3.
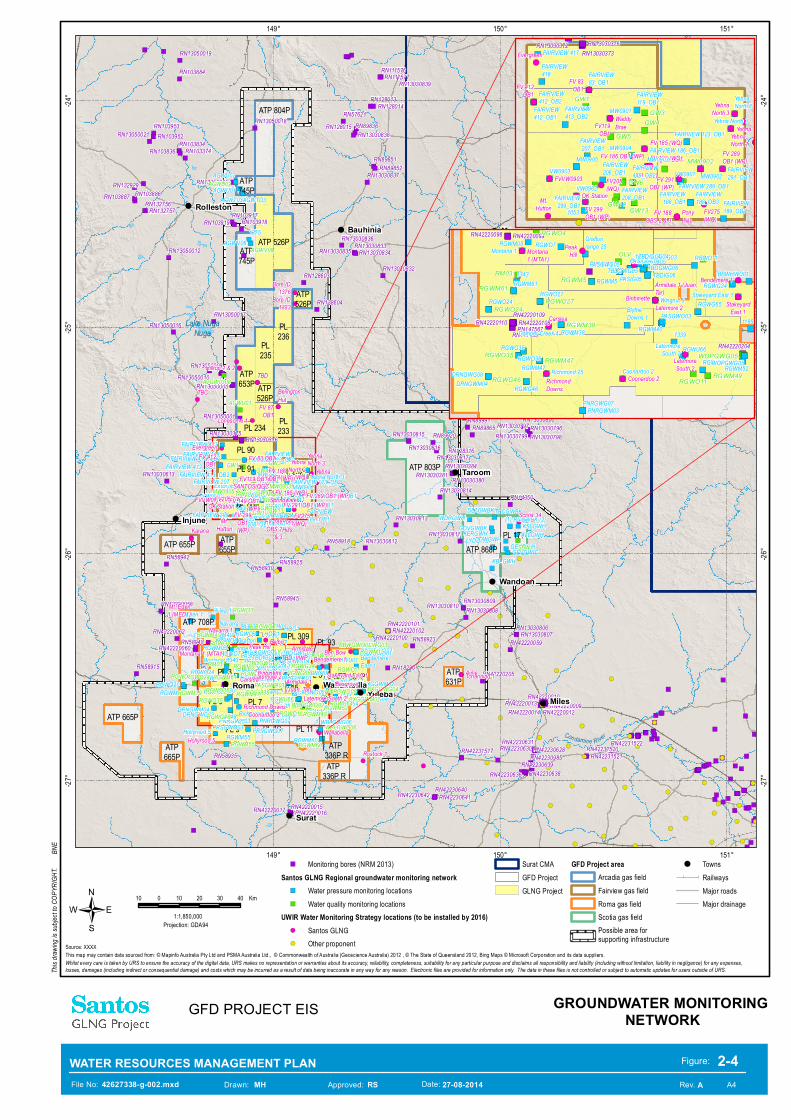
Draft")")")
")
")
")
")
")
")")")
")")")")")")")")")")")")")")")")
")
")
")")
")")") ")") ")
")")
")
")")")
")")
")")
")
")
")")
")
")
")
")")")
")")
")
")
")
")
")
")
")
")")")
")
")
")
")
")")")")")")")
")") ")")")")")
")
")")")")")")")")
")")")")")")")")")
")")")
") ") ")")")")")")")")")
") ") ") ")
") ") ")
") ") ")
") ") ") ")") ")") ")
") ")")")") ")
")")")")") ")")
")")")
")")") ") ")
")")
")
")")
")
")
")")")")")
")")
")")")")")
")")")
")")")
")")
")")")")")")")")")
")")")")")")
")
")")
")")")")")")")")")")")")")")")")")")")")") ")")")")")")")")")")
")")")")")")")")")")")")")")")")")")")")")")")")")")")")")")")")")")")")")")")")")")")")")")")
")
")")")")")")")")")")")")")")")")")")")")")")")")")")")")")")")")")")")")")")")")")")")")")")")")")")")")")")")")")")")")")")")")")")")")")")")")")")")")")")")")")")")")")")")")")")")")")")")")")")")")")")")")")")")
")")")
")")")")")")")")")")")")")")
")")")")")")")")
")
")")")")
")
")
")")
")
")
")
")
")
")
")")")")")")")")")")")")")")")")")")")")")")
")")")")")")")")")")")")")")")")")")")")")")")")")")")")")
")")
")
")")
")")")
")
")
")")
")")
")")
")")")
")
")
")")")
")")")")")")")")
")
")
")
")
") ")
")
")
")
")
")
")
")
")")")")")")
")")
")
")
")
")")
")
")")")
")
")")
")")")")") ")")")") ")
")
")
")")
")")
")")")")")")")")")")")")")")")")")
") ")
")
")
")
")
") ")
")
")")
")
")")")")
")
")")
")
")
")
")
")
")")
")
")")
")
")")
")")")")")")")")
")
")
")
")")
")
")")
")
")
")") ")
")")
")")")")")")")")")")")")")
")
")")")")")
")
")")")
")")")")")")")")")")")
")")")")")
")")")")")")")")
")
")")")")")
")")")
")
")")")")")")")")")")")")
")")
")")
")
")
")
")
")")")
")
")")
")
")
")
")
")
")")")")")")")
")
")
")")")")
")")")")")
")
")
")
")
")
")
")
")
")")")
")")
")
")
")")
")
")
")")")")
")
")")
")
")
")")
")")
")
")")
")
")
")")
")
") ")")
")
")
")
")
")
")
")")
")
")
")")")
")
")
")
")
")
")
")
")")
")")")
")")
")
!(!(
!(!(!(
!(
!(
!(!(!(
!(
!(!(!( !(
!(!(!(
!(!(
!(!(
!( !(
!(!(
!( !(
!(!(!(
!(!(
!( !(!(
!(!(!(
!(!( !(
!(!(
!(!( !( !(
!(
!(!(
!(
!(
!(!( !(
!(!(
!(
!(
!(
!(
!(
!(
!(
!(
!(
!(
!(
!(
!(
!(
!(
!( !(!(
!(!(
!(
!(!(!(
!(!( !( !(!(
!(!(
!(!( !(
!(!(
!(
!(
!(!(
!(
!(!(!(!(
!(
!(
!(
!(!(
!(!(
!(!(
!(
!(
!(!(
!(
!(!(
!(
!(
!(!(
!(
!(
!(
!(
!(
!(!(
!(
!(
!(
!(
!(!(
!(!(
!(
!(
!(!(
")
")
")
")
")")
")
")")
")
")")")
")
")
")")
")")")
")")")
")")
")
")
")
")
")
")
") ")
")
")")
")
")
")
")")
")
")
")")
")
")
")")
")
")
")")
")
")
")
")
")")
")")
")") ")
")")
") ")")") ") ")")") ") ")")") ")") ")")
") ") ")")")") ") ")") ")")") ")
")")") ") ")")
")") ") ") ")")")")") ")")")") ")")")")")")")") ")") ")")")
")")") ") ")")")")
")
")")
")
")")")")
")")") ") ")")
") ")")
")")")
")")")")
")")
")")")
")
")
")")")
")
")
")
")
")
")
")
")")
")
")
")
")
")
")
")
")
")
")")
")")
!
!
!!!
!
!
!
!!
!
!
!
!
ATP 336P R
ATP 665PPL 6 PL 7 PL 8
PL 9
PL 3
ATP 708P
PL 11PL 10
PL 13 PL 314PL 309
PL 310PL 315
ATP665P
ATP 655P
PL 93
ATP 868P
ATP 631P ATP 631P
ATP 336P R
PL 99
PL 90PL 91PL 92
PL 234
PL 100
PL 232
ATP 655P
PL 235
PL 236
PL 233
ATP 653P ATP
526P
Lake NugaNuga
ATP 803P
PL 176
ATP 526P
ATP 804P
ATP 745P
ATP 745P
ATP 526P
RN42220015RN42220016RN42220017
RN42230640RN42230641RN42230642
RN58915
RN58925RN58930
RN58935
RN58942
RN58943
RN58945RN42220058
RN42220060
RN42220062
RN18230
RN58923
RN13030808RN13030809RN13030810
RN42220100RN42220101
RN42220102
RN42220205
RN42231517
RN13030806RN13030807
RN42220009RN42220010
RN42220012RN42220013
RN42220014
RN42220059
RN42230628RN42230630RN42230631
RN42230636 RN42230638RN42230639
RN42230985RN42231520
RN42231521RN42231522
RN13030375RN13030376
RN13030613
RN13050001
RN13050005
RN13050009RN13050010
RN13050016
RN58918
RN89905RN89991
RN89865
RN89877
RN89920
RN128316
RN13030380RN13030381RN13030384
RN13030811RN13030812
RN13030813
RN13030814
RN13030815RN13030816
RN13030817
RN14350
RN13030796RN13030797RN13030798RN13030799
RN13030800
RN103886RN103887
RN103374RN103834
RN103836
RN103953RN103952
RN103917RN103918RN103919
RN128604
RN128603
RN132756RN132757
RN132929
RN13050012
RN13050015
RN13050017
RN13050018RN13050021
RN57621RN89836
RN89851RN89852
RN128015
RN13030832
RN13030833RN13030834RN13030835
RN13030836
RN13030837
RN13030838
RN103884
RN13050019
RN111576RN111577
RN128013RN128014
RN13030839
RGWM55 RGWM60Hollyrood 5 PRSGWG07
WBLGWG06PNRGWG07PNRGWM03RGWG46 Coonardoo 2DRNGWM04DRNGWG08 Richmond25
RGWM50RGWM52RGWM47
RGWU66WOPGWO02WOPGWG05
RGWO35 LatermoreSouth 2
RGWO36RGWU64
13411339 BXGGWG04
BXGGWM021185RGWM19
RGWO20 Damper Creek 4Blythe Downs 1
RGWM38 PASGWO03RGWG65RGWO24 RGWO27Wingnut 3Stakeyard East 1RGWM61
RGWG341343RGWM5
BBWHWU01 BendemereEast 1
TBDGWG06TBDIG06
PASGWG05PASIG05TBDGWG05
TBDIG05PASGWG04PASIG04 RGWO11TBDIG03TBDGWG03TBDGWG02
TBDGWG04TBDIG04
Graftonrange 25
Montana 1BBWGWG03RGWO7
RGWM15BBWGWO01RGWM05
RGWO4Gundale 1RGWM40 RGWO3 HINJBLBGWM01BLBGWG01Navarra 1
Mt Eden 1 Hi-lea 1
KBLGWHGEVGWICGEVGWHLYDGWBKDDWGWH AVLGWHKERGWHGDVGWBK
TRCGWBK (2)KSLGWH
TRCGWBK(1)WDRGWH
DLZGWBK1053
VW0902 VW0901VW0903
MW0902MW0903MW0905
MW0904
AGWV081375
AGWTO3AGWT03AGWU01AGWU02
MW0901
HOG1HIG1
HOO1
PRSGWM03
FAIRVIEW 123_OB1
FAIRVIEW189_OB1
FAIRVIEW 206_OB1
FAIRVIEW 207_OB1
FAIRVIEW208_OB1
FAIRVIEW 412_OB2
FAIRVIEW 413_OB2
FAIRVIEW119_OB1
FAIRVIEW149_OB2
FAIRVIEW188_OB3
FAIRVIEW 186_OB1
FAIRVIEW188_OB1
FAIRVIEW 289_OB1FAIRVIEW 299_OB1
FAIRVIEW 291_OB1
FAIRVIEW 412_OB1
FAIRVIEW 417FAIRVIEW 418 FAIRVIEW 83_OB1
Yebna North 3
YebnaNorth 2
Con damin e R iver
Surat
MilesYulebaWallumbillaRoma
Wandoan
Injune
Taroom
MouraBauhinia
RollestonBiloela
AGWU01
AGWU02
AGWV08
AVGW0308
BBWGWG03BBWGWO01
BLBGWG01
BXGGWG04BXGGWM02
GW1
GW10GW11GW12
GW13
GW3GW4
GW5GW6
GW7GW8 GW9MW0902MW0903MW0904MW0905
OLV
PASGWO03
RGWG34
RGWG46
RGWG65
RGWM15
RGWM19 RGWM38
RGWM40
RGWM47
RGWM49
RGWM5RGWM50
RGWM52
RGWM55 RGWM60
RGWM61
RGWO11
RGWO20RGWO24 RGWO27
RGWO3
RGWO35RGWO36
RGWO4
RGWO7
RGWU64RGWU66
RM03
SBW
TBDGWG02
WBLGWG06
WOPGWG05WOPGWO02
Hollyrood 5Wallabella
Coonardoo 2Richmond Downs
Latemore South 2BoxgroveCarslea
BinbinetteLatemore 2 Stakeyard East 1 AirlieTchanning 1
Bendemere 1TBD_VWPPeak Hill
Montana 1 (MTA1) Ben BowArmidaleBelbri
Navarra 1
Mt. Eden1 (MED1)
PonyHills
FV 188OBS 2
& 3
OK StationFVVW0903 Springwater
SANTOS/QGCYebna
Evergreen
Lonesome 1
BelingtonHut
FV 87OB1
TBDHilltop 1 & 2
Bore ID1333
Bore ID1376
Karana
Scotia 34Mt.Hutton
Waddy BraeFV119 OB1
TBC
Armidale 1(Juan, Tar)
FV 299OB1(WP)
FV205 (WQ) FV 289 OB1 (WP)FV 291 OB1 (WP)
FV275(WQ)
FV 185 (WQ)
FV 185 (WQ)FV 149 OB1
(WP)
FV 186OB1 (WP)
YebnaNorth 3Yebna
North 2FV 412
OB1 FV 83 OB1
Rostock 1
151°
151°
150°
150°
149°
149°
-24°
-24°
-25°
-25°
-26°
-26°
-27°
-27°
/Whilst every care is taken by URS to ensure the accuracy of the digital data, URS makes no representation or warranties about its accuracy, reliability, completeness, suitability for any particular purpose and disclaims all responsibility and liability (including without limitation, liability in negligence) for any expenses,losses, damages (including indirect or consequential damage) and costs which may be incurred as a result of data being inaccurate in any way for any reason. Electronic files are provided for information only. The data in these files is not controlled or subject to automatic updates for users outside of URS.
Source: XXXXThis map may contain data sourced from: © Mapinfo Australia Pty Ltd and PSMA Australia Ltd., © Commonwealth of Australia (Geoscience Australia) 2012 , © The State of Queensland 2012, Bing Maps © Microsoft Corporation and its data suppliers.
This d
rawing
is sub
ject to
COPY
RIGHT
.BN
E
10 0 10 20 30 40 Km
1:1,850,000Projection: GDA94
")
")
")
")
")
")
")
")")
")
")")
")
")")
")")")")")")")")
")
")
")
")")
")
")")
")
")
")")")
")
")
")
")
")
")
")
")
")
")
")
")
")
")
")
")
")")
")")
")
")
")")
")")
")
")")
")
")
") ")
")")
") ")")") ")")
")")") ")")") ")") ")")
")
")")") ") ")") ")")") ")
")")") ") ")
")")") ") ")
")")")") ")")")") ")")")")")")
")")")
")
")")") ") ")
")")")
")
")")")
")
!(!(!(
!(!(
!(
!(
!(!( !(
!(
!(
!(!(
!(!(
!(
!(
!(
RN58939
RN147566RN147567
RN42220098 RN42220099
RN42220108RN42220109
RN42220110
RN42220204
OLV
RGWG46
RGWM38
RGWM47
RGWM49
RGWM5RGWM61
RGWO11
RGWO24RGWO27
RGWO35
RGWO4
RM03
WOPGWG05
Coonardoo 2RichmondDowns
LatemoreSouth 2
Carslea
BinbinetteLatemore 2 Stakeyard
East 1
Bendemere 1
TBD_VWPPeak
HillMontana1 (MTA1)
Armidale 1 (Juan,Tar)
PNRGWG07PNRGWM03
RGWG46
Coonardoo 2DRNGWM04
DRNGWG08 Richmond 25RGWM50RGWM52RGWM47
RGWU66WOPGWO02WOPGWG05
RGWO35 LatermoreSouth 2RGWO36
13391185
Damper Creek 4
BlytheDowns 1
RGWM38
PASGWO03RGWM40
RGWG65RGWO24RGWO27 Wingnut 3 Stakeyard East 1
RGWM61 RGWG341343
RGWM5BBWHWU01TBDGWG06
TBDIG06PASGWG05
PASIG05TBDGWG05
TBDIG05PASGWG04PASIG04 RGWO11TBDIG03TBDGWG03TBDGWG02TBDGWG04TBDIG04
Graftonrange 25Montana 1 RGWO7RGWM05
") Monitoring bores (NRM 2013)Santos GLNG Regional groundwater monitoring network
") Water pressure monitoring locations") Water quality monitoring locations
UWIR Water Monitoring Strategy locations (to be installed by 2016)!( Santos GLNG!( Other proponent
Surat CMAGFD ProjectGLNG Project
GFD Project areaArcadia gas fieldFairview gas fieldRoma gas fieldScotia gas fieldPossible area for supporting infrastructure
! TownsRailwaysMajor roadsMajor drainage
GFD PROJECT EIS GROUNDWATER MONITORING NETWORK
")
")")")")")")")
")
")
")")")")
")")")")")
")
!(
!(
")
")")
")
")
")
")")
")")
")
")
")")
")
")
")
")
")")
")")")
")
")
")
")
")
")
")
")
")
")
")
")
")
")
")
")
")
")
")
")")
")
")
!(!(
!(
!(
!(!(!(
!(
!(
!(
!(!(
!(
!(!(
!(
!(
!(
!(
!(
!(
!(
!(
!(
!(
!(
!(
!(
!(
RN13030372RN13030373
RN13030376
GW1
GW10 GW13
GW3GW4
GW5
GW6
MW0902
PonyHills
FV 188OBS 2 & 3
OK Station
FVVW0903
SpringwaterSANTOS/QGC
Yebna
Evergreen
Mt.Hutton
WaddyBraeFV119
OB1
FV 299OB1 (WP)
FV205(WQ)
FV 289OB1 (WP)
FV 291OB1 (WP)
FV275(WQ)
FV 185 (WQ)
FV 185 (WQ)FV 149OB1 (WP)
FV 186 OB1 (WP)
YebnaNorth 3
YebnaNorth 2
FV 83OB1FV 412
OB1
1053
VW0902VW0901VW0903 MW0902
MW0903MW0905MW0904
MW0901
FAIRVIEW 123_OB1
FAIRVIEW189_OB1
FAIRVIEW206_OB1
FAIRVIEW207_OB1
FAIRVIEW208_OB1
FAIRVIEW412_OB2
FAIRVIEW413_OB2
FAIRVIEW119_OB1
FAIRVIEW149_OB2
FAIRVIEW188_OB3
FAIRVIEW 186_OB1
FAIRVIEW188_OB1
FAIRVIEW 289_OB1FAIRVIEW299_OB1
FAIRVIEW291_OB1
FAIRVIEW412_OB1
FAIRVIEW 417FAIRVIEW418 FAIRVIEW
83_OB1
Yebna North 3
YebnaNorth 2
File No:
WATER RESOURCES MANAGEMENT PLAN42627338-g-002.mxd Drawn: MH Approved: RS Date:
Figure:
A4
2-4Rev. A27-08-2014
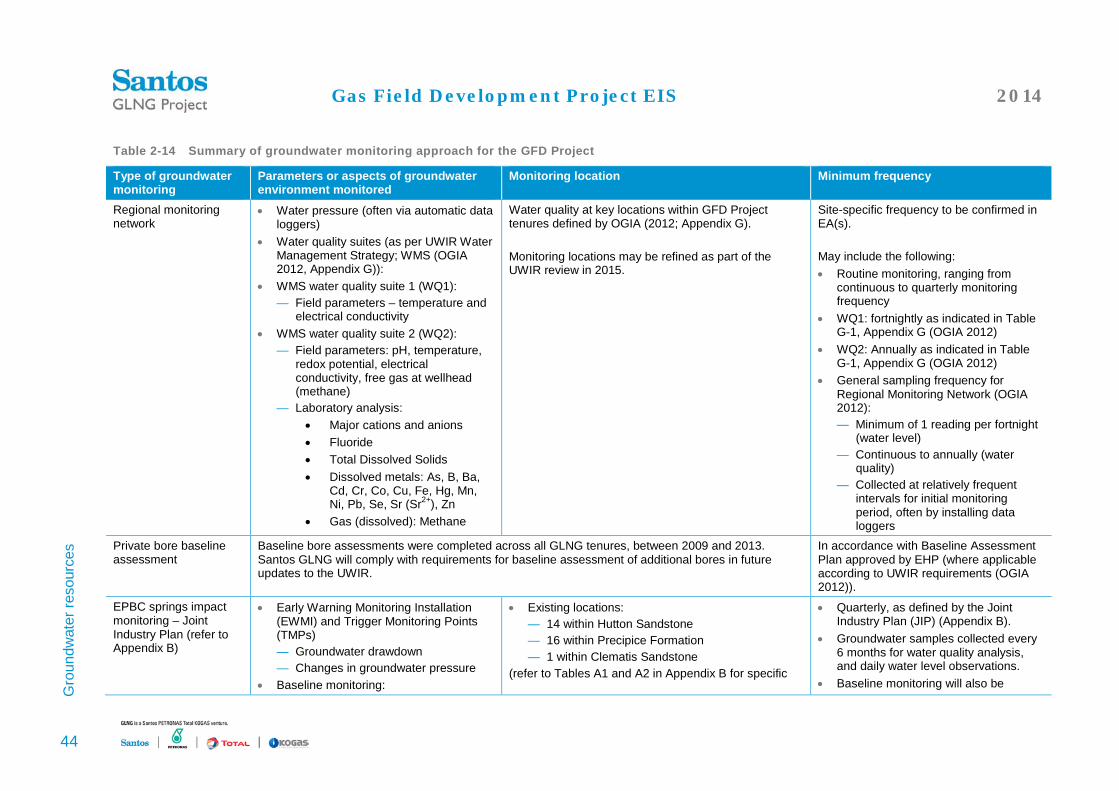
Gas Field Development Project EIS 2014
44
Gro
undw
ater
reso
urce
s
Table 2-14 Summary of groundwater monitoring approach for the GFD Project
Type of groundwater monitoring
Parameters or aspects of groundwater environment monitored
Monitoring location Minimum frequency
Regional monitoring network
• Water pressure (often via automatic data loggers)
• Water quality suites (as per UWIR Water Management Strategy; WMS (OGIA 2012, Appendix G)):
• WMS water quality suite 1 (WQ1): — Field parameters – temperature and
electrical conductivity • WMS water quality suite 2 (WQ2):
— Field parameters: pH, temperature, redox potential, electrical conductivity, free gas at wellhead (methane)
— Laboratory analysis: • Major cations and anions • Fluoride • Total Dissolved Solids • Dissolved metals: As, B, Ba,
Cd, Cr, Co, Cu, Fe, Hg, Mn, Ni, Pb, Se, Sr (Sr2+), Zn
• Gas (dissolved): Methane
Water quality at key locations within GFD Project tenures defined by OGIA (2012; Appendix G). Monitoring locations may be refined as part of the UWIR review in 2015.
Site-specific frequency to be confirmed in EA(s). May include the following: • Routine monitoring, ranging from
continuous to quarterly monitoring frequency
• WQ1: fortnightly as indicated in Table G-1, Appendix G (OGIA 2012)
• WQ2: Annually as indicated in Table G-1, Appendix G (OGIA 2012)
• General sampling frequency for Regional Monitoring Network (OGIA 2012): — Minimum of 1 reading per fortnight
(water level) — Continuous to annually (water
quality) — Collected at relatively frequent
intervals for initial monitoring period, often by installing data loggers
Private bore baseline assessment
Baseline bore assessments were completed across all GLNG tenures, between 2009 and 2013. Santos GLNG will comply with requirements for baseline assessment of additional bores in future updates to the UWIR.
In accordance with Baseline Assessment Plan approved by EHP (where applicable according to UWIR requirements (OGIA 2012)).
EPBC springs impact monitoring – Joint Industry Plan (refer to Appendix B)
• Early Warning Monitoring Installation (EWMI) and Trigger Monitoring Points (TMPs) — Groundwater drawdown — Changes in groundwater pressure
• Baseline monitoring:
• Existing locations: — 14 within Hutton Sandstone — 16 within Precipice Formation — 1 within Clematis Sandstone
(refer to Tables A1 and A2 in Appendix B for specific
• Quarterly, as defined by the Joint Industry Plan (JIP) (Appendix B).
• Groundwater samples collected every 6 months for water quality analysis, and daily water level observations.
• Baseline monitoring will also be

Gas Field Development Project EIS 2014
45
Gro
undw
ater
reso
urce
s
Type of groundwater monitoring
Parameters or aspects of groundwater environment monitored
Monitoring location Minimum frequency
— Fauna, flora and macro-invertebrates — Isotope analysis of groundwater — Weather station data (ambient)
names of existing locations and GPS coordinates) Lucky Last, Yebna 2 and Abyss are specific to the GFD Project.
completed on a quarterly basis for the first year (Appendix B).
Additional Spring Monitoring (UWIR requirements, in future)
• Physical condition of spring as per Table H-6 of UWIR (Appendix H, OGIA 2012): — Ambient (total rainfall, weather
station observations) — Spring flow — Spring area — Water chemistry (field
measurements) — Photograph spring vents (not
required for watercourse springs) • Water quality parameters (as per Tables
H-4 and H-7 of UWIR (Appendix H, OGIA 2012): — Suite A:
• Field parameters (pH, electrical conductivity, redox, temperature, free gas)
— Suite B: • Field parameters (pH,
electrical conductivity, redox, temperature, free gas)
• Laboratory analytes: - Total Dissolved Solids - Alkalinity; total alkalinity
as CaCO3, bicarbonate as CaCO3, carbonate as CaCO3, hydroxide as CaCO3
- Sulphate – SO4 by ICPAES1
- Chloride
• Spring complexes • Watercourse springs (5 within GFD Project or
GLNG Project tenures; and 5 off-tenure) Specific locations will be confirmed in the applicable EA following GFD Project approval. Water suites are allocated to each spring vent according to Table H-4 of the UWIR (Appendix H, OGIA 2012). The list of springs may be updated during the UWIR review in 2015.
Quarterly, as defined for the Spring Monitoring Program (OGIA 2012). Results are reported to the OGIA every 6 months.
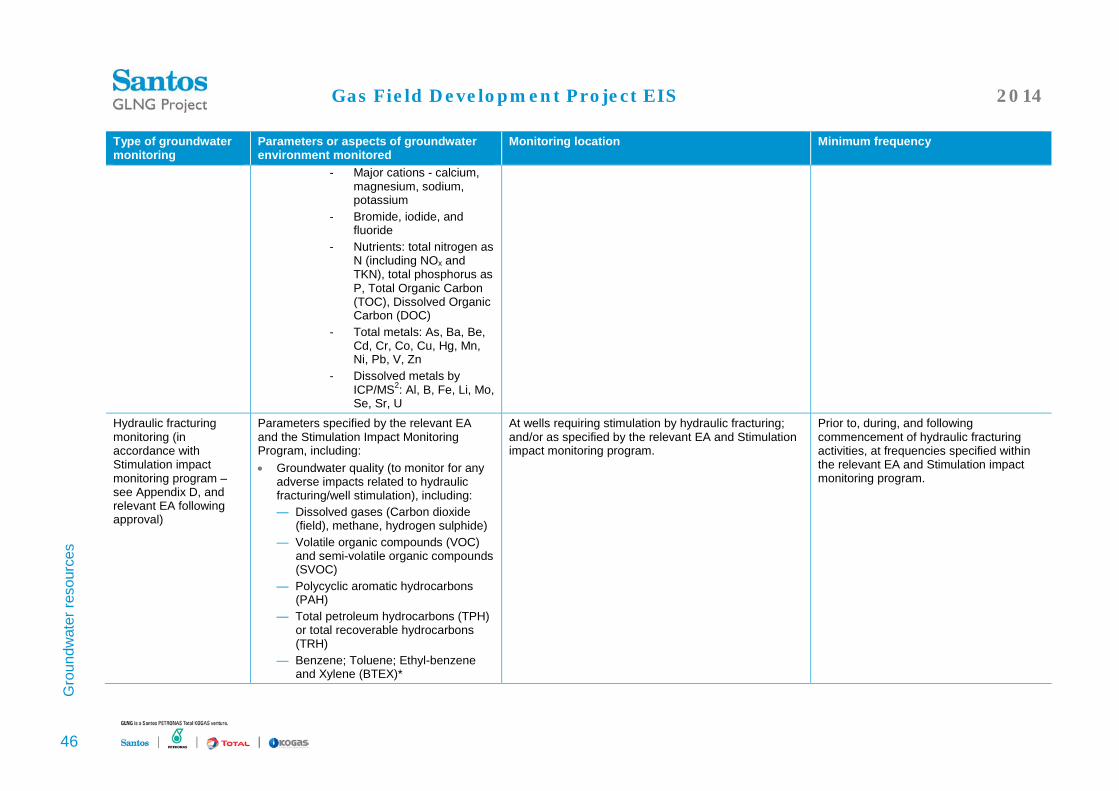
Gas Field Development Project EIS 2014
46
Gro
undw
ater
reso
urce
s
Type of groundwater monitoring
Parameters or aspects of groundwater environment monitored
Monitoring location Minimum frequency
- Major cations - calcium, magnesium, sodium, potassium
- Bromide, iodide, and fluoride
- Nutrients: total nitrogen as N (including NOx and TKN), total phosphorus as P, Total Organic Carbon (TOC), Dissolved Organic Carbon (DOC)
- Total metals: As, Ba, Be, Cd, Cr, Co, Cu, Hg, Mn, Ni, Pb, V, Zn
- Dissolved metals by ICP/MS2: Al, B, Fe, Li, Mo, Se, Sr, U
Hydraulic fracturing monitoring (in accordance with Stimulation impact monitoring program – see Appendix D, and relevant EA following approval)
Parameters specified by the relevant EA and the Stimulation Impact Monitoring Program, including: • Groundwater quality (to monitor for any
adverse impacts related to hydraulic fracturing/well stimulation), including: — Dissolved gases (Carbon dioxide
(field), methane, hydrogen sulphide) — Volatile organic compounds (VOC)
and semi-volatile organic compounds (SVOC)
— Polycyclic aromatic hydrocarbons (PAH)
— Total petroleum hydrocarbons (TPH) or total recoverable hydrocarbons (TRH)
— Benzene; Toluene; Ethyl-benzene and Xylene (BTEX)*
At wells requiring stimulation by hydraulic fracturing; and/or as specified by the relevant EA and Stimulation impact monitoring program.
Prior to, during, and following commencement of hydraulic fracturing activities, at frequencies specified within the relevant EA and Stimulation impact monitoring program.

Gas Field Development Project EIS 2014
47
Gro
undw
ater
reso
urce
s
Type of groundwater monitoring
Parameters or aspects of groundwater environment monitored
Monitoring location Minimum frequency
— Napthalene* — Phenanthrene* — Benzo(a)pyrene* — Sodium hypochlorate* — Sodium hydroxide* — Formaldehyde* — Ethanol* — Dissolved and total metals (Al, As,
Ba, Be, B, Cd, Cr, Co, Cu, Fe, Mn, Hg, Mo, Ni, Se, U, V, Zn
— Major anions and cations (calcium, chloride, fluoride, magnesium, potassium, sodium, sulphate)
Alkalinity (Total alkalinity as CaCO3, bicarbonate as CaCO3, carbonate as caCO3, hydroxide as HCO3, total hardness) — Analytes and physico-chemical
parameters aligned with baseline bore and well assessments
• Sampling of stimulation fluids and flow back waters (analysis will include a similar suite of parameters to those listed above for groundwater monitoring)
Dam seepage monitoring
• Seepage monitoring in the vicinity of dam(s)
Shallow monitoring bores As specified by relevant EA
Coal seam water - MAR In accordance with site-specific Injection Management Plan and/or EA conditions Coal seam water– irrigation
In accordance with site-specific Management Plan, EA or general BUA conditions; the latter is currently available from EHP at https://www.ehp.qld.gov.au/management/non-mining/documents/general-bua-irrigation-of-associated-water.pdf The monitoring parameters, locations and frequencies detailed below have been provided as a high level indication of monitoring that may be
undertaken where coal seam water produced from GFD Project is applied for beneficial use. Actual monitoring programs will be dictated by the relevant regulatory conditions applied as required.
• Groundwater — Water quality parameters (listed in
Locations as described within the relevant, specific BUA
• Continuous measurement of water level, flow rate, electrical conductivity,

Gas Field Development Project EIS 2014
48
Gro
undw
ater
reso
urce
s
Type of groundwater monitoring
Parameters or aspects of groundwater environment monitored
Monitoring location Minimum frequency
specific BUA): - Water level - Flow rate - Electrical conductivity - pH - Temperature - Groundwater pressure - Total dissolved solids - Total petroleum
hydrocarbons - Benzene, Toluene, Ethyl-
benzene, Xylenes - Polycyclic aromatic
hydrocarbons - Ortho-Phosphorus - Nitrate-N - Nitrate + Nitrite as N - Nitrate-N
— Sulphur as SO4
pH, temperature, groundwater pressure and total dissolved solids.
Bi-annually for all other monitoring parameters.
• Springs — Water quality parameters (listed in
specific BUA): - Flow rate - Electrical conductivity - Total dissolved solids - pH - Ortho-Phosphorus - Nitrate-N - Nitrate + Nitrite as N - Nitrate-N - Sulphur as SO4
Locations as described within the relevant regulatory conditions, as detailed above
• Continuous measurement of flow and electrical conductivity
• Bi-annually for all other monitoring parameters
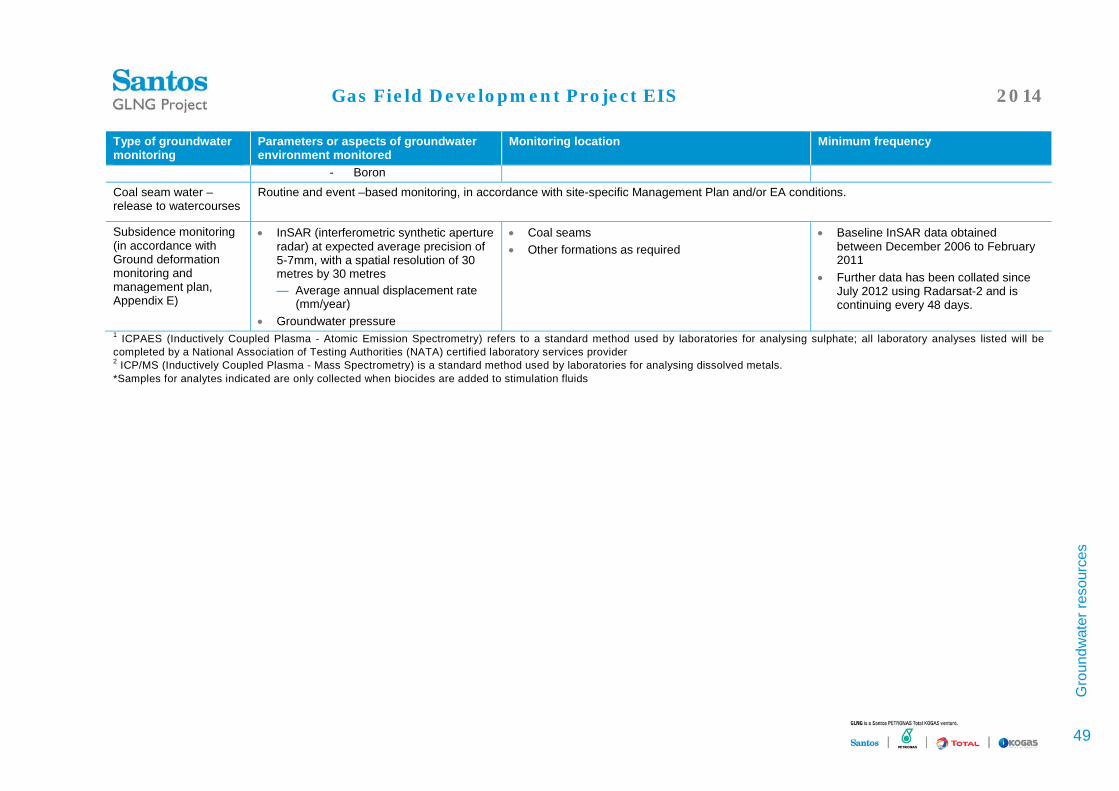
Gas Field Development Project EIS 2014
49
Gro
undw
ater
reso
urce
s
Type of groundwater monitoring
Parameters or aspects of groundwater environment monitored
Monitoring location Minimum frequency
- Boron Coal seam water – release to watercourses
Routine and event –based monitoring, in accordance with site-specific Management Plan and/or EA conditions.
Subsidence monitoring (in accordance with Ground deformation monitoring and management plan, Appendix E)
• InSAR (interferometric synthetic aperture radar) at expected average precision of 5-7mm, with a spatial resolution of 30 metres by 30 metres — Average annual displacement rate
(mm/year) • Groundwater pressure
• Coal seams • Other formations as required
• Baseline InSAR data obtained between December 2006 to February 2011
• Further data has been collated since July 2012 using Radarsat-2 and is continuing every 48 days.
1 ICPAES (Inductively Coupled Plasma - Atomic Emission Spectrometry) refers to a standard method used by laboratories for analysing sulphate; all laboratory analyses listed will be completed by a National Association of Testing Authorities (NATA) certified laboratory services provider 2 ICP/MS (Inductively Coupled Plasma - Mass Spectrometry) is a standard method used by laboratories for analysing dissolved metals. *Samples for analytes indicated are only collected when biocides are added to stimulation fluids
Gas Field Development Project EIS 2014
50
Gro
undw
ater
reso
urce
s
2.4.4 Exceedance response
2.4.4.1 Private bores and OGIA regional monitoring network
Groundwater level Specific trigger levels for groundwater levels in landholder bores potentially affected by extraction of natural gas from coal seams are outlined in the Water Act and the 2013 JIP. The Water Act triggers are:
• Five (5) metre drawdown for consolidated (confined) aquifers • Two (2) metre drawdown for unconsolidated (unconfined) aquifers
The JIP establishes an early warning system (EWS) that involves the use of groundwater level variations as a proxy for early warning of impact to the ecosystem supported by the spring. JIP triggers vary between individual springs and are presented in Appendix B. Different response priority levels have been defined for anticipating and responding to exceedance of a trigger level:
• Low level priority response providing an early warning of potential impact • Medium level priority response providing a warning that a trigger level exceedance is likely or
imminent • High level priority response when a trigger has been exceeded.
In the event that a trigger level is exceeded and the bore owner has noticed a reduction in a bore’s performance to the extent that it is causing some material impact on the bore performance, Santos GLNG will undertake a bore assessment to establish whether the bore is, or is likely to be, impacted (i.e. have an impaired capacity) by the extraction of groundwater associated with petroleum operations. A bore assessment may include the following response actions:
• Identify specific bores affected • Repeat measurement to confirm extent of drawdown and available water column • Establish whether the trigger level exceedance has resulted in impairment of the affected bore’s
function such that it is unfit for its intended purpose • Establish the primary and secondary contributing factors to the decrease in water levels (for
example, gas development; groundwater extraction from other developments, or sustained below average rainfall).
Where impacts to a bore occur and make good obligations apply, a petroleum tenure holder is required to:
• Undertake a bore assessment • Enter into a make good agreement with the owner of the bore • Comply with the make good agreement.
If asked to vary the make good agreement, negotiate a variation of the make good agreement
Groundwater quality Santos GLNG uses conservative water quality trigger levels, defined as a 10% change in physical or chemical parameter concentrations relative to baseline values, to provide an early warning of potential water quality impacts. The water quality trigger levels apply to bores and springs.
When a trigger level for water quality is reached, Santos GLNG undertakes the following response actions:
• Identify specific bores/springs affected
Gas Field Development Project EIS 2014
51
Gro
undw
ater
reso
urce
s
• Re-sample and re-analyse to confirm extent of change to water quality – include revised analytical suite if warranted
• Assess potential factors contributing to the change in water quality (for example, gas development; groundwater extraction from other developments)
• Evaluate potential site-specific environmental values at risk from changes to water quality • Develop a second trigger level on the basis of the assessment, beyond which the water quality
would be unfit for its intended purpose (likely to be a direct reference to published water quality guidelines, but may include derivation of site-specific guidelines for key parameters).
• Report to the regulator (as appropriate).
2.4.4.2 Springs The impact monitoring program for springs has been developed to meet both the Commonwealth and Queensland State requirements for the monitoring and management of springs.
The trigger level defined in the Water Act (Qld) with respect to water levels at springs potentially affected by extraction of natural gas from coal seams is a 0.2 m drawdown in groundwater level for the spring complex. Exceedance of this trigger level prompts further investigation to assess the potential for adverse impacts on EVs associated with the spring, and consider the need for mitigation actions. Similarly, the JIP is utilised to monitor and manage impacts to EPBC Act listed springs (refer to Appendix B).The process associated with these for EPBC-listed springs (namely monitoring and exceedance response procedures) is illustrated in Figure 2-5 below.
2.4.4.3 Subsidence Subsidence is indicated by a change in ground level, which can be attributed to groundwater drawdown associated with extraction activities. A change in ground level (a ‘ground motion’) is defined as 'stable' for deformation average annual deformation values contained between – 8 mm/year and + 8 mm/year. This definition is discussed in Appendix U2 of the GFD Project EIS, and further information on ground motion is detailed in Appendix E. The subsidence trigger for the GLNG Project (with non-gas production effects removed) is defined as an annual average ground motion of 16 mm/year for over 50% of data points (collected via the monitoring program outlined in Section 2.4.2) over a 1.5 km x 1.5 km region.
Should the subsidence trigger be exceeded, Santos GLNG will carry out an analysis of the cause of the ground motion. Spatial and/or temporal analysis of the deformation data will provide a reasonable assessment of the possible cause. If deemed necessary, site walkovers, aerial photography, ground-based geodetic surveys and other environmental monitoring data may be incorporated as part of the ongoing monitoring plan.
2.4.5 Emergency response In the event of an emergency that is associated with an immediate increased risk of causing adverse impact to the groundwater environment, Santos GLNG would comply with requirements outlined in the relevant EA. For example, the emergency response would be undertaken in accordance with the Upstream GLNG Contingency plan for emergency environmental incidents where relevant.

Gas Field Development Project EIS 2014
52
Gro
undw
ater
reso
urce
s
Figure 2-5 Monitoring and response plan for springs associated with an EPBC Act listing (from Appendix B (2013 JIP)
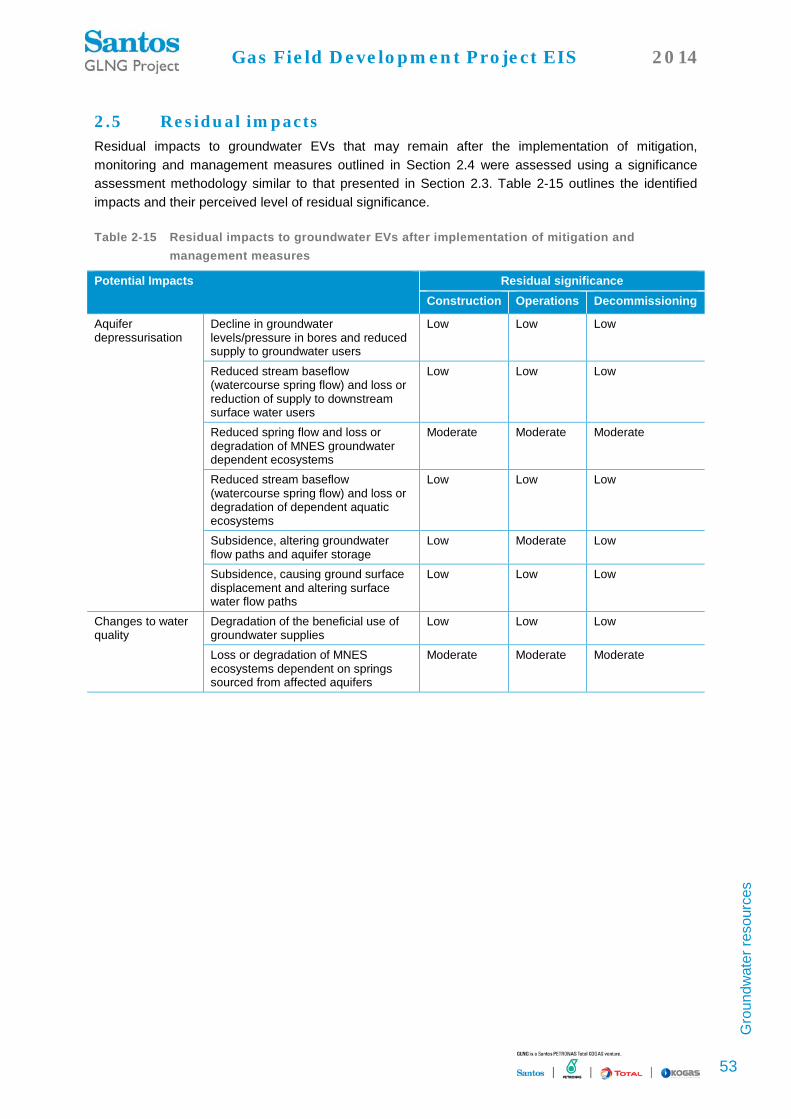
Gas Field Development Project EIS 2014
53
Gro
undw
ater
reso
urce
s
2.5 Residual impacts Residual impacts to groundwater EVs that may remain after the implementation of mitigation, monitoring and management measures outlined in Section 2.4 were assessed using a significance assessment methodology similar to that presented in Section 2.3. Table 2-15 outlines the identified impacts and their perceived level of residual significance.
Table 2-15 Residual impacts to groundwater EVs after implementation of mitigation and management measures
Potential Impacts Residual significance Construction Operations Decommissioning
Aquifer depressurisation
Decline in groundwater levels/pressure in bores and reduced supply to groundwater users
Low Low Low
Reduced stream baseflow (watercourse spring flow) and loss or reduction of supply to downstream surface water users
Low Low Low
Reduced spring flow and loss or degradation of MNES groundwater dependent ecosystems
Moderate Moderate Moderate
Reduced stream baseflow (watercourse spring flow) and loss or degradation of dependent aquatic ecosystems
Low Low Low
Subsidence, altering groundwater flow paths and aquifer storage
Low Moderate Low
Subsidence, causing ground surface displacement and altering surface water flow paths
Low Low Low
Changes to water quality
Degradation of the beneficial use of groundwater supplies
Low Low Low
Loss or degradation of MNES ecosystems dependent on springs sourced from affected aquifers
Moderate Moderate Moderate
Gas Field Development Project EIS 2014
54
Surfa
ce w
ater
reso
urce
s
3 Surface water resources
The GFD Project area extends across two major river basins, the upper Fitzroy and the Condamine-Balonne. The existing Fairview, Arcadia and Scotia gas fields lie within the southern portions of the Fitzroy Basin, where key watercourses include the Comet River (flowing south to north approximately 30 km west of the Arcadia gas field) and the Dawson River (flowing west to east through the Fairview gas field). The Roma gas field lies within the Condamine-Balonne Basin. The Condamine River flows from south-east of the GFD Project tenures, then becomes the Balonne River south of the Roma gas field. Key watercourses of the Condamine-Balonne Basin that flow through the GFD Project tenures include Yuleba Creek and Bungil Creek. The Condamine-Balonne Basin is a key contributor to the Murray-Darling Basin, as the Balonne River flows inland in a south-westerly direction to join the Darling River north of Bourke in New South Wales.
Watercourses of both the Fitzroy and Condamine-Balonne basins are predominately ephemeral, with stream flows typically only generated following significant rainfall and further characterised by rapid recession once rainfall has ceased. The upper Dawson River (downstream of Dawson‘s Bend near the Fairview gas field) features the only perennial stretch of watercourse within the GFD Project area. In line with seasonal rainfall patterns, flows in watercourses within the GFD Project area generally occur during the summer wet season months of December through to March.
Watercourses of the GFD Project area show a wide variety of geomorphic characters and flow regimes that vary from the steep, high energy, relatively stable headwater streams of the upper Comet and Upper Dawson River to the laterally mobile, low energy watercourses located on the broad alluvial plains of the Balonne River. Most watercourses within the GFD Project area show signs of anthropogenic impact from activities such as clearing for grazing and cropping, stock access and removal of riparian vegetation.
A detailed assessment of the surface water resources within the GFD Project area was undertaken as part of the EIS process; the findings are summarised here to provide context to the management measures that are outlined in this WRMP.
3.1 Environmental values EVs associated with the surface water resources within the GFD Project area are defined by Schedule 1 of the EPP Water (for Fitzroy Basin watercourses only) and a draft Healthy Waters Management Plan released by the Queensland Murray-Darling Committee in 2012 (for Condamine-Balonne watercourses only). Table 3-1 and Table 3-2 below indicate the EVs that are applicable to surface waters within the GFD Project area.
Water Quality Objectives (WQOs) and management options have been identified to protect these EVs from impacts that may potentially arise as a result of GFD Project activities; these will be specified in relevant EAs following approval. Comparison of surface water monitoring results collected as part of operational monitoring, known baseline environmental conditions and relevant WQOs is an essential component of water resource management for the GFD Project. It is conducive to the early identification of potential risk of adverse impacts arising from project activities, responsive implementation of management actions.
Gas Field Development Project EIS 2014
55
Surfa
ce w
ater
reso
urce
s
3.2 Sensitive receptors No nationally or internationally significant wetlands were identified within the GFD Project area. High Ecological Value (HEV) wetlands were identified as being either entirely or partially within the GFD Project area in the following locations:
• Tributaries of Humboldt Creek, Comet River • Robinson Creek and Palm Tree Creek, tributaries of the Upper Dawson River, downstream of
Taroom • Canal Creek, Horse Creek, and the Upper Dawson River (including Dawson’s Bend) • Bungil Creek and Dargal Creek, tributaries of the Upper Balonne River.
The management measures identified in this WRMP have been developed to manage the risk of potential adverse impacts on these sensitive receptors that may arise from GFD Project activities, as outlined in Sections 3.3 and 3.4 below.

Gas Field Development Project EIS 2014
56
Surfa
ce w
ater
reso
urce
s
Table 3-1 EVs identified for surface water resources within the GFD Project area (Fitzroy Basin; as defined in Schedule 1 of the EPP Water)
Environmental value Comet River Upper Dawson River Lower Dawson River
Mai
n ch
anne
l
Wes
tern
trib
utar
ies
East
ern
trib
utar
ies
Mai
n ch
anne
l
(b
elow
Hut
ton
Cre
ek)
Wes
tern
upl
and
trib
utar
ies
Sout
hern
trib
utar
ies
Nor
ther
n up
land
tr
ibut
arie
s
Cen
tral
trib
utar
ies
Nor
ther
n up
land
tr
ibut
arie
s
Mai
n ch
anne
l –
unre
gula
ted
reac
hes
Mai
n ch
anne
l – re
gula
ted
reac
hes
Sout
hern
upl
and
trib
utar
ies
East
ern
Trib
utar
ies
Wes
tern
trib
utar
ies
Aquatic ecosystems
Irrigation
Agriculture
Stock water
Aquaculture
Human consumer
Primary recreation
Secondary recreation
Visual recreation
Drinking water
Industrial use
Cultural and spiritual values
= EV identified for surface water resources within the GFD Project area. = EV not applicable for surface water resources within the GFD Project area

Gas Field Development Project EIS 2014
57
Surfa
ce w
ater
reso
urce
s
Table 3-2 EVs identified for surface water resources within the GFD Project area (Condamine-Balonne Basin; as defined by QMDC 2012, Figure 3, p12)
Environmental value Condamine River Balonne River Dogwood
Creek Lower Condamine River
Yuleba Creek Bungil and Murilla Creeks
Lower Maranoa Balonne River
Aquatic ecosystems High High High High High High Irrigating crops High High High High High High Agriculture (farm use) High High High High High High Stock watering High High High High High High Aquaculture Low Low Low Low Low Low Human consumption High High High High High High Primary recreation High High High High High High Secondary recreation Low High High High High High Visual appreciation High High High High High High Raw drinking water High High High High High High Industrial use Low Low Low Low Low Low Cultural and spiritual values High High High High High High Note: EVs for the Condamine-Balonne River Basin are listed in QMDC 2012 as either low or high priority. This distinction is not made for EVs within the Fitzroy Basin (Table 3-1).

Gas Field Development Project EIS 2014
58
Surfa
ce w
ater
reso
urce
s
3.3 Potential impacts Potential impacts to surface water resources that may occur as a result of GFD Project activities were assessed using a significance assessment methodology. A degree of sensitivity (low, moderate, or high) was assigned to the EVs identified for surface water resources (as outlined in Section 3.1), and the magnitude of potential impacts to EVs was also assessed on a scale of low, moderate or high. Together, these factors were then examined to determine the significance of potential impacts arising from GFD Project activities. Table 3-3 outlines the GFD Project activities that could potentially have an impact on surface water EVs at different phases of development.
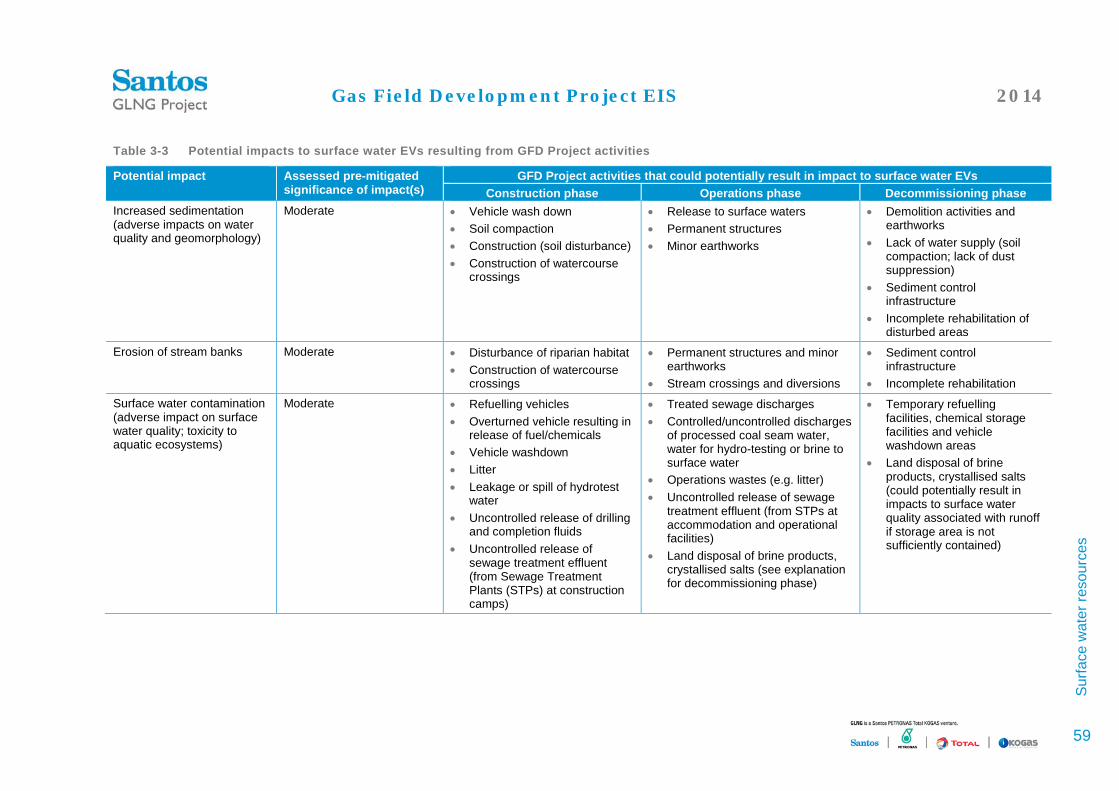
Gas Field Development Project EIS 2014
59
Surfa
ce w
ater
reso
urce
s
Table 3-3 Potential impacts to surface water EVs resulting from GFD Project activities
Potential impact Assessed pre-mitigated significance of impact(s)
GFD Project activities that could potentially result in impact to surface water EVs Construction phase Operations phase Decommissioning phase
Increased sedimentation (adverse impacts on water quality and geomorphology)
Moderate • Vehicle wash down • Soil compaction • Construction (soil disturbance) • Construction of watercourse
crossings
• Release to surface waters • Permanent structures • Minor earthworks
• Demolition activities and earthworks
• Lack of water supply (soil compaction; lack of dust suppression)
• Sediment control infrastructure
• Incomplete rehabilitation of disturbed areas
Erosion of stream banks Moderate • Disturbance of riparian habitat • Construction of watercourse
crossings
• Permanent structures and minor earthworks
• Stream crossings and diversions
• Sediment control infrastructure
• Incomplete rehabilitation Surface water contamination (adverse impact on surface water quality; toxicity to aquatic ecosystems)
Moderate • Refuelling vehicles • Overturned vehicle resulting in
release of fuel/chemicals • Vehicle washdown • Litter • Leakage or spill of hydrotest
water • Uncontrolled release of drilling
and completion fluids • Uncontrolled release of
sewage treatment effluent (from Sewage Treatment Plants (STPs) at construction camps)
• Treated sewage discharges • Controlled/uncontrolled discharges
of processed coal seam water, water for hydro-testing or brine to surface water
• Operations wastes (e.g. litter) • Uncontrolled release of sewage
treatment effluent (from STPs at accommodation and operational facilities)
• Land disposal of brine products, crystallised salts (see explanation for decommissioning phase)
• Temporary refuelling facilities, chemical storage facilities and vehicle washdown areas
• Land disposal of brine products, crystallised salts (could potentially result in impacts to surface water quality associated with runoff if storage area is not sufficiently contained)

Gas Field Development Project EIS 2014
60
Surfa
ce w
ater
reso
urce
s
Potential impact Assessed pre-mitigated significance of impact(s)
GFD Project activities that could potentially result in impact to surface water EVs Construction phase Operations phase Decommissioning phase
Altered surface water flow regime (risk to overland flow paths, infrastructure, riparian vegetation, terrestrial ecosystems, baseflow from aquifers, and environmental flow regime)
Moderate • Watercourse diversion (for example, re-direction of overland flow paths/gullies); construction of crossings
• Watercourse diversion (e.g. re-direction of overland flow paths, gullies)
• Failure of water storage facilities, embankments, pipelines, bunds
• Release to surface waters (both controlled and uncontrolled)
• Not applicable
Altered geomorphic character (e.g. increased lateral instability; significant alteration of geomorphic units)
Moderate • Watercourse diversion, construction of crossings (in-stream works)
• Watercourses crossings, diversions and permanent structures in channel
• Incomplete rehabilitation of disturbed areas
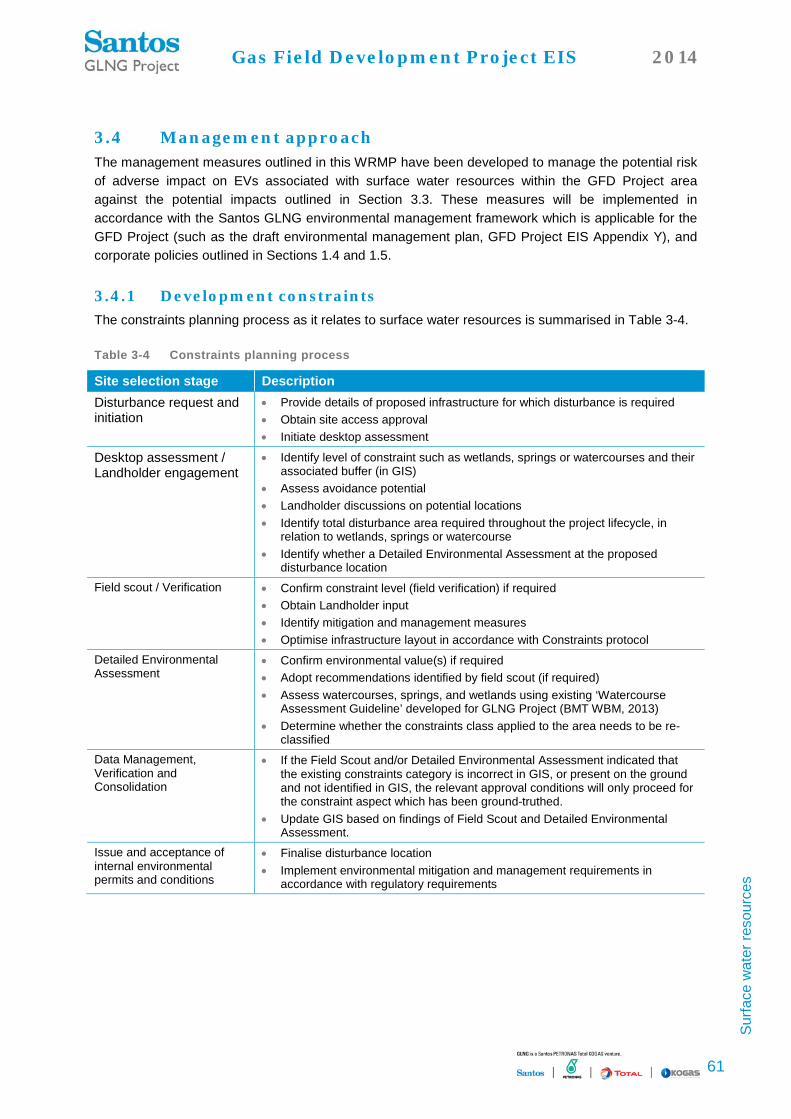
Gas Field Development Project EIS 2014
61
Surfa
ce w
ater
reso
urce
s
3.4 Management approach The management measures outlined in this WRMP have been developed to manage the potential risk of adverse impact on EVs associated with surface water resources within the GFD Project area against the potential impacts outlined in Section 3.3. These measures will be implemented in accordance with the Santos GLNG environmental management framework which is applicable for the GFD Project (such as the draft environmental management plan, GFD Project EIS Appendix Y), and corporate policies outlined in Sections 1.4 and 1.5.
3.4.1 Development constraints The constraints planning process as it relates to surface water resources is summarised in Table 3-4.
Table 3-4 Constraints planning process
Site selection stage Description Disturbance request and initiation
• Provide details of proposed infrastructure for which disturbance is required • Obtain site access approval • Initiate desktop assessment
Desktop assessment / Landholder engagement
• Identify level of constraint such as wetlands, springs or watercourses and their associated buffer (in GIS)
• Assess avoidance potential • Landholder discussions on potential locations • Identify total disturbance area required throughout the project lifecycle, in
relation to wetlands, springs or watercourse • Identify whether a Detailed Environmental Assessment at the proposed
disturbance location Field scout / Verification • Confirm constraint level (field verification) if required
• Obtain Landholder input • Identify mitigation and management measures • Optimise infrastructure layout in accordance with Constraints protocol
Detailed Environmental Assessment
• Confirm environmental value(s) if required • Adopt recommendations identified by field scout (if required) • Assess watercourses, springs, and wetlands using existing ‘Watercourse
Assessment Guideline’ developed for GLNG Project (BMT WBM, 2013) • Determine whether the constraints class applied to the area needs to be re-
classified Data Management, Verification and Consolidation
• If the Field Scout and/or Detailed Environmental Assessment indicated that the existing constraints category is incorrect in GIS, or present on the ground and not identified in GIS, the relevant approval conditions will only proceed for the constraint aspect which has been ground-truthed.
• Update GIS based on findings of Field Scout and Detailed Environmental Assessment.
Issue and acceptance of internal environmental permits and conditions
• Finalise disturbance location • Implement environmental mitigation and management requirements in
accordance with regulatory requirements

Gas Field Development Project EIS 2014
62
Surfa
ce w
ater
reso
urce
s
Figure 3-1 Framework for management and mitigation of potential impacts to surface water resources within the GFD Project area

Gas Field Development Project EIS 2014
63
Surfa
ce w
ater
reso
urce
s
3.4.2 Baseline assessment Baseline surface water conditions have been established across the Santos GLNG upstream project area over a period of more than 10 years; the earliest monitoring for surface waters within the GFD Project area began in 2003. Over 2,300 data points have been collated throughout the key sub-catchments of the GFD Project area, including:
• Sub-catchments of the Fitzroy River Basin:
— Comet River — Lower Dawson River — Upper Dawson River
• Sub-catchments of the Condamine-Balonne River Basin:
— Dogwood Creek — Upper Balonne River Tributaries
This extensive dataset has been developed via a combination of monitoring methods, including the installation of dedicated in-stream monitoring devices and grab sampling as part of project- and baseline assessment-based programs. The largest portion of the baseline surface water monitoring was instigated as part of the approval process for the GLNG Project (approved in 2010); this monitoring will be continued where relevant to the GFD Project, particularly in areas where ongoing analysis of surface water quality is required such as within portions of the Dawson River in accordance with EA conditions. Existing surface water monitoring locations within the GFD Project area are depicted in Figure 3-2.

Draft
!
!
!!!
!
!
!
!
!!
!
!
!
Capricorn Hwy
Burnett Hwy
AS01AS01
S12S12 S2bS2bS7S7S10S10
S13S13
S14aS14aS18DS18D
S4S4S5S5
S5aS5a
S9S9
TARTAR
THEOWTHEOW
S19DS19DES1ES1
ES7ES7 ES9ES9
I16I16
S11aS11aS15S15
S6S6S6aS6a
SC2SC2
RES10RES10
R014R014
RES13RES13
RES15RES15
RS14RS14INV111INV111
R019R019
R021R021
RS20RS20 RS24RS24
BLCS2BLCS2BLCS3BLCS3
R011R011
R025R025RS11RS11
RS12RS12
RS25RS25
RS23RS23
RES1RES1 R001R001R002R002
R012R012
RES4RES4
RES6RES6RS7RS7
RES17RES17
DAW01DAW01
ROB01ROB01 ROB02ROB02
SS2SS2 SS3SS3
SS4SS4SS5SS5
SS6SS6
422220A
422219A
422210A
130344A
130324A
130302A
130375A130313A
130502B
130506A
MuckadillaCree k
Cas t le Cree k
N o go aRi ve
r
Maran
oaRiv
er
Wo l eebe
eCree
k
North Bungaban Creek
S pringsureCreek
Cock atoo Creek
San dhu
rst Creek
Neab ul C
re ek
Don RiverLon
g Gully
M e r ivale
River
Maranoa River (east Branch)
Gerard Creek
Round
stone
Creek
Moolayembe rC
reek
Murilla Creek
Bungi lCre ek
Dogwo od C reek
Lo n esome C ree k
Mercu
rahCreek
Skeleton Creek
Charle y Creek
Juand ahCree k
Pump CreekRocky Creek
Vandyke C reek
Come
t Rive
r
C on a Creek
Mooni e Riv e r
Rawbelle River
Blackw ater C reek
Meteo rC reek
Bun gaban Cree k
Cogoon River
CarnarvonCreek
Bullaroo Creek
Cobble
g unCre
ek
Aurichen Creek
Co nsuelo
C reek
DeeRive
r
Daw son River
Tcha nningCreek
Co ndam ine Riv e r
Callide Creek
A ubur n
River
F reitag C reek
Womalill a Creek
Mine rva Cree k
Ho rseCre
ek
Fish Creek
Dargal Creek
B aff le C reek
Spring Creek
Balonne River
Brown
R iver
Pinnac
le Creek
Dulacca Creek
BurgagayC re ek
P lanet C
reek
Karib oe Creek
Wallum
billa
Creek
Bu n g eworgora iC ree k
R obins on Creek
Yalebone Creek
Tartulla Cre ek
Central Creek Blackboy Creek
Cen t re Creek
Wambo Cre ek
Bl yt h Cr eek
Pa lm Tr ee Creek
Hutton Cr eek
Jimmie Gully
Jo hnso
nCreek
Sardine Creek
Mim o sa Creek
ZamiaCr eekSan
dy C reek
A mbyCre
e k
Humbo ldt Creek
R uine dCastle Cre ek
Charle ys Cree k
Concili ation C reek
BellC reek
EurombahCreek
SixMil
e Cree
k
Banana C reek
Yuleba Creek
Baxter Gully
Injune C reek
Pearl Creek
Un dullaC reek
Wall am Creek
Panoram
a Creek
Kian gaCreek
Rocky
Gully
Cows Head Creek
Little Ta rt ul l a Creek
Surat
MilesYulebaWallumbilla
Roma
Mitchell
Wandoan
Injune
Taroom
MouraBauhiniaRolleston
Biloela
Springsure
150°30'
150°30'
150°
150°
149°30'
149°30'
149°
149°
148°30'
148°30'
148°
148°
-24°
-24°
-24°30
'
-24°30
'
-25°
-25°
-25°30
'
-25°30
'
-26°
-26°
-26°30
'
-26°30
'
-27°
-27°
/
GFD PROJECT EIS EXISTING MONITORING LOCATIONS WITHIN THE GFD PROJECT AREA
Whilst every care is taken by URS to ensure the accuracy of the digital data, URS makes no representation or warranties about its accuracy, reliability, completeness, suitability for any particular purpose and disclaims all responsibility and liability (including without limitation, liability in negligence) for any expenses,losses, damages (including indirect or consequential damage) and costs which may be incurred as a result of data being inaccurate in any way for any reason. Electronic files are provided for information only. The data in these files is not controlled or subject to automatic updates for users outside of URS.
Source: Client Supplied DataThis map may contain data sourced from: © Mapinfo Australia Pty Ltd and PSMA Australia Ltd., © Commonwealth of Australia (Geoscience Australia) 2012 , © The State of Queensland 2012, Bing Maps © Microsoft Corporation and its data suppliers.
This d
rawing
is sub
ject to
COPY
RIGHT
.BN
E
1:1,916,531Projection: GDA94
10 0 10 20 30 40Km
Possible area forsupporting infrastructure
") DNRM Gauge
Study Sub CatchmentsAmby CreekUpper Balonne TributariesDogwood CreekUpper Dawson RiverLower Dawson RiverComet River
FRC environmental monitoring (2009)URS monitoring (2009)
Historical Water Quality Sites!( Ephemeral stream!( Perennial stream#* Spring%, Surface water quality
! TownsRailwaysMajor roadsMajor drainage
File No:
WATER RESOURCES MANAGEMENT PLAN42627338-g-006.mxd Drawn: MH Approved: RS Date:
Figure:
A4
3-2Rev. A27-08-2014

Gas Field Development Project EIS 2014
65
Surfa
ce w
ater
reso
urce
s
3.4.3 Coal seam water management The GFD Project coal seam water management strategy (Appendix Z) will direct management of coal seam water in accordance with the relevant regulatory framework. The strategy is sufficiently flexible to accommodate changes in policy, technology and field conditions, based on a rigorous evaluation and decision-making framework as alternative technologies may be identified during the GFD Project design and implementation process.
The regulatory framework includes the Queensland Coal seam gas water management policy 2012 (EHP, 2013). The policy sets out the following management hierarchy under the Environmental Protection Act 1994 (Qld) for prioritising management and use of coal seam water:
• Priority 1 – coal seam water is used for a purpose that is beneficial to one or more of the following: the environment, existing or new water users, and existing or new water-dependent industries.
• Priority 2 – after feasible beneficial use options have been considered, treating and disposing coal seam water in a way that firstly avoids, and then minimises and mitigates, impacts on environmental values.
In addition, the ‘making good’ requirements of the Water Act 2000 (Qld) may require operators to consider the feasibility of using coal seam water to meet obligations for provision of water to mitigate impacts that may result from a coal seam operation on bores.
The GLNG Project already has an approved plan in place for existing operations. The strategy for the GFD Project will build upon the experience and understanding of the operations to date. The strategy will be sufficiently flexible to accommodate changes in policy, technology and field conditions, based on a rigorous evaluation and decision-making framework.
The water quality and volumes extracted from coal seams will vary depending on the well location and the production plan. The overall water production characteristics can be forecast with reasonable certainty to enable effective management of the water.
The quality of coal seam water determines the potential treatment requirements for its proposed use. Not all water extracted from coal seams requires treatment before use. Due to the lifecycle impacts (particularly energy) of some treatment processes it is preferable to minimise the amount of treatment wherever possible.
Treatment of coal seam water will be undertaken to provide water of appropriate quality for the proposed use. Where a change in water quality is needed to meet the required water quality of intended uses, this will primarily be achieved through one or a combination of the following approaches:
• Desalination using reverse osmosis to separate a portion the total dissolved solids and other constituents into a concentrated waste stream (brine) and produce a better quality permeate stream
• Amendment using chemical dosing to lower the sodium adsorption ratio and pH/residual alkalinity of coal seam water
• Temperature and ionic balance adjustment • Filtration removing suspended solids (lowering the turbidity), bio-toxic elements and nutrients that
can lead to algal blooms from the water • Sterilisation to remove bacteria • De-oxygenation • Blending of separate water streams of differing quality to achieve a target water quality.

Gas Field Development Project EIS 2014
66
Surfa
ce w
ater
reso
urce
s
The appropriateness of these methods will be evaluated as information is refined regarding the expected water quality, the intended uses and their water quality requirements according to relevant approvals.
Due to the geographic extent of gas production activities Santos GLNG will adopt a range of water management options to achieve outcomes in accordance with the regulatory framework.
The coal seam water management strategy for the GFD Project has adopted the policy’s management hierarchy whereby:
Priority 1: Beneficial use
Coal seam water should be used for a purpose that is beneficial to existing users including GFD Project requirements and to meet “make good” obligations, new water users, and / or existing or new water-dependant industries. Management solutions will be determined based on an evaluation framework that includes full lifecycle assessments of potential benefits and liabilities associated with each option or suite of options. The objective of the framework is to identify feasible options which maximise beneficial use and minimise environmental impacts.
Priority 2: Disposal
After feasible beneficial use options have been considered, coal seam water will be disposed of in a way that firstly avoids, and then minimises and mitigates, impacts on environmental values.
Options for managing water include utilising extracted water for make good arrangements, operational use, substitution of water allocation, depleted coal seam water injection, aquifer injection, providing water for landholder activities or other regional users, surface water release, and evaporation of water in accordance with EHP guidelines.
3.4.3.1 Brine management Where desalination (e.g. reverse osmosis) is required a waste stream (RO concentrate or brine) is generated that will require appropriate management and subsequent disposal in accordance with regulatory requirements.
The Queensland Coal Seam Gas Water Management Policy 2012 (EHP, 2013) sets out the following management hierarchy for prioritising management of brine (saline waste):
• Priority 1 – brine or salt residues are treated to create useable products wherever feasible. • Priority 2 – after assessing the feasibility of treating the brine or solid salt residues to create
useable and saleable products, disposing of the brine and salt residues in accordance with strict standards that protect the environment.
The options available for utilisation for the GFD Project can be divided into two categories; commercial salt recovery and brine or salt disposal.
Commercial Salt Recovery Commercial recovery of saleable salt product requires an assessment of a number of critical factors such as technical considerations, environmental impacts, market proximity and economic factors. Currently this option is not considered feasible for Santos GLNG due to the significant energy intensity, cost and low commercial volumes of salt. Commercial salt beneficial use options may become more economic where economies of scale can be employed.
Gas Field Development Project EIS 2014
67
Surfa
ce w
ater
reso
urce
s
Brine or Salt Disposal Brine may be disposed of through deep well injection into suitable geological formations This is already occurring in accordance with regulatory approvals within the GLNG Project.
The transfer of brine or solid salt to a licenced waste management facility will only occur after other options have been assessed and considered unfeasible.
Brine concentration options may be used to reduce the volume of brine requiring final management or to sufficiently concentrate brine to allow crystallisation of solid salt. Various technologies are available to be utilised, each with advantages and challenges to feasibility including thermal evaporation. These technologies have differing energy intensity, environmental footprint, technical complexity, operability and economics.
Additional management criteria specific to each beneficial use options and disposal are outlined within the relevant, site-specific EAs, BUAs and summarised in the Draft EM Plan (EIS Appendix Y).
3.4.4 Surface Water Monitoring The monitoring programs outlined within this WRMP are aligned with the Draft EM Plan (EIS Appendix Y). Monitoring for surface waters within the GFD Project area is carried out in accordance with relevant regulatory approvals, including:
• General BUA for authorised releases of coal seam water to land (such as for irrigation) • EAs for authorised release of coal seam water to surface water, including associated Receiving
Environment Monitoring Programs (REMPs).
The Dawson River Release Scheme (DRRS) is one of the approved mechanisms for release of treated coal seam water to the surface water environment within the GFD Project area, having received approval effective from 14 April 2014 (EA number EPPG00928713). Further schemes similar to the DRRS may be required in future. Assessment of further releases would require additional approvals and may involve:
a. Detailed baseline assessments for aquatic ecology; hydrology; surface water quality and geomorphology at upstream, downstream and potential impact locations
b. Water quality, hydraulic and hydrological modelling of potential release scenarios to determine the scenario with minimal risk of adverse impacts to the receiving environment
c. Selection of appropriate locations for release, where the risk of adverse impact would be minimal (according to the findings of baseline investigations)
d. Consideration of the Draft EM Plan (Appendix Y, GFD Project EIS) and associated coal seam water management strategy
e. Application for environmental approval from state government (EHP) f. Development of a REMP specific to the release scheme
3.4.4.1 Receiving environment monitoring program A Receiving Environment Monitoring Program (REMP) will be developed for the DRRS within the Fairview gas field, in accordance with EA conditions and the EHP guidance document EM1260: Receiving environment monitoring program guideline (EHP 2014). It will form a component of the coal seam water management strategy for the GFD Project. The overall purpose of the REMP is to ‘monitor, identify and describe any adverse impacts to surface water environmental values, quality and flows’ as a result of authorised releases of treated coal seam water to the Dawson River.

Gas Field Development Project EIS 2014
68
Surfa
ce w
ater
reso
urce
s
A summary of the contents and structure of the REMP for the DRRS, which is currently under development, is contained in Appendix G. The REMP is structured to address the requirements of the EA (EPPG00928713); specifically Conditions B33 to B36. It will summarise the existing condition of the receiving environment for releases from the DRRS and outline monitoring that will be undertaken by Santos GLNG to protect the identified EVs associated with the receiving environment. For example, key monitoring programs will include:
• Monitoring of aquatic ecosystems such as fish; turtle; frog; waterbird; aquatic flora; and macroinvertebrate communities
• Assessments of ecosystem health • Monitoring of surface water quality, including both routine and event-based sampling of the
receiving environment; background locations, and release point(s) • Hydrological monitoring • Monitoring of sediment quality in the immediate receiving environment • Visual assessment of geomorphology.
Monitoring methodologies implemented as part of the REMP will be consistent with those employed during the baseline assessments undertaken prior to receiving approval for the DRRS. The REMP also outlines reporting and data management requirements that will be undertaken to fulfil the EA requirements.
If it is identified that an additional REMP is required for the GFD Project, a specific assessment and approvals process will be conducted in consultation with the administering authority at that time.
3.4.4.2 Data management Management of surface water data is undertaken as per Section 2.4.2.1 above.
3.4.4.3 Location and frequency of monitoring Surface water monitoring locations, frequency and scope (for example, range of parameters tested and methodology used) may vary during different phases of the GFD Project; this may depend on the activities being undertaken and priorities for assessment. Specific details such as regular and event-based monitoring locations (including GPS coordinates) and parameters for analysis will be undertaken in accordance with the relevant regulatory criteria for the GFD Project. The typical level of monitoring is outlined in Table 3-5. Extension or adaption of existing monitoring programs may be applied to GFD Project areas if required.
3.4.5 Response framework The framework for responding to potential non-compliances observed from surface water monitoring results is based on EHSMS15 – Incident Investigation and Response (as detailed in Table 1-3, Section 1.4 above) and is implemented in accordance with regulatory approvals.

Gas Field Development Project EIS 2014
69
Surfa
ce w
ater
reso
urce
s
3.4.6 Exceedance response If there is an exceedance of regulatory criteria, Santos GLNG will respond and report in accordance with regulatory requirements. This may include:
• Confirming the origin of the exceedance to remove natural and seasonal variation and anthropogenic (non-gas industry) effects
• Altering the management of the release to the water course • In-stream or bank remediation work if associated with construction activities within the water
course.
Baseline data will be reviewed with regards to key representative parameters (relevant to MNES) to refine water quality objectives as necessary.
3.4.7 Emergency or unplanned discharge In the event that a temporary or short term release to the surface water environment is required in an emergency, Santos GLNG would seek relevant authorisations from EHP.
All regulated structures, including brine containment dams, manage risk of unplanned discharges through being designed in accordance with the Manual for Assessing Hazard Categories and Hydraulic Performance of Dams (EM635; EHP 2013).
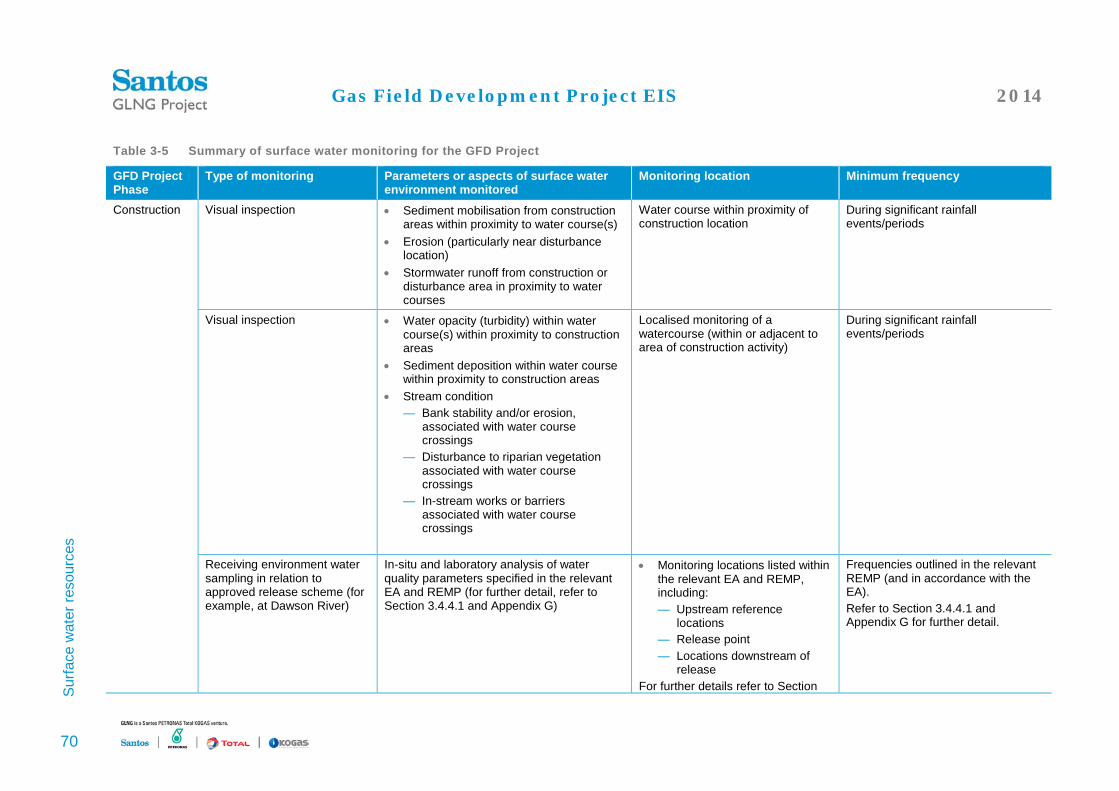
Gas Field Development Project EIS 2014
70
Surfa
ce w
ater
reso
urce
s
Table 3-5 Summary of surface water monitoring for the GFD Project
GFD Project Phase
Type of monitoring Parameters or aspects of surface water environment monitored
Monitoring location Minimum frequency
Construction Visual inspection • Sediment mobilisation from construction areas within proximity to water course(s)
• Erosion (particularly near disturbance location)
• Stormwater runoff from construction or disturbance area in proximity to water courses
Water course within proximity of construction location
During significant rainfall events/periods
Visual inspection • Water opacity (turbidity) within water course(s) within proximity to construction areas
• Sediment deposition within water course within proximity to construction areas
• Stream condition — Bank stability and/or erosion,
associated with water course crossings
— Disturbance to riparian vegetation associated with water course crossings
— In-stream works or barriers associated with water course crossings
Localised monitoring of a watercourse (within or adjacent to area of construction activity)
During significant rainfall events/periods
Receiving environment water sampling in relation to approved release scheme (for example, at Dawson River)
In-situ and laboratory analysis of water quality parameters specified in the relevant EA and REMP (for further detail, refer to Section 3.4.4.1 and Appendix G)
• Monitoring locations listed within the relevant EA and REMP, including: — Upstream reference
locations — Release point — Locations downstream of
release For further details refer to Section
Frequencies outlined in the relevant REMP (and in accordance with the EA). Refer to Section 3.4.4.1 and Appendix G for further detail.

Gas Field Development Project EIS 2014
71
Surfa
ce w
ater
reso
urce
s
GFD Project Phase
Type of monitoring Parameters or aspects of surface water environment monitored
Monitoring location Minimum frequency
3.4.4.1 (DRRS REMP) and Appendix G.
Operation In-situ water sampling • Water level and flow (calculated) • Electrical conductivity • Water temperature
• Perennial watercourses — Upstream reference
locations — Potential impact locations
(adjacent to operational area)
— Downstream locations
As described in the relevant EA and REMP
Monitoring for beneficial use of coal seam water (e.g. operational uses on –tenure, irrigation), as per general BUA. Note the monitoring program detailed here is as per the general BUA available from EHP online (2014). Details may be subject to other changes, which would be agreed in writing between Santos GLNG and EHP where required (as per Section 2 of the General BUA).
• Water quality parameters (as per Section 2 of General BUA (EHP 2014)): — Electrical conductivity — Sodium adsorption ratio — pH — Metals: Al, As, B, Cd, Cr, Co, Cu, Fe,
Li, Pb, Mn, Hg, Mo, Ni, Zn — Fluoride
At point of supply • Fortnightly for electrical conductivity, sodium adsorption ratio and pH
• Initially monthly for metals and fluoride, followed by six-monthly after three consecutive detects which are less than 50% of the short-term trigger values specified in Appendix 1 of EHP, 2014.
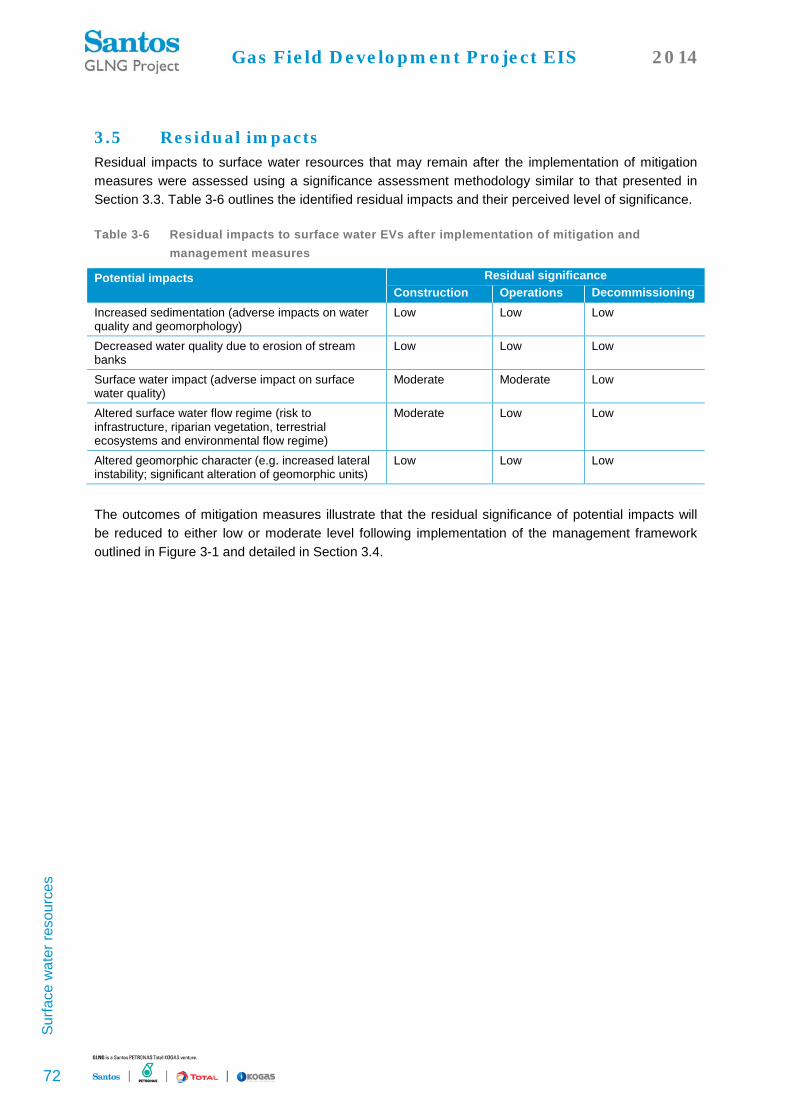
Gas Field Development Project EIS 2014
72
Surfa
ce w
ater
reso
urce
s
3.5 Residual impacts Residual impacts to surface water resources that may remain after the implementation of mitigation measures were assessed using a significance assessment methodology similar to that presented in Section 3.3. Table 3-6 outlines the identified residual impacts and their perceived level of significance.
Table 3-6 Residual impacts to surface water EVs after implementation of mitigation and management measures
Potential impacts Residual significance Construction Operations Decommissioning
Increased sedimentation (adverse impacts on water quality and geomorphology)
Low Low Low
Decreased water quality due to erosion of stream banks
Low Low Low
Surface water impact (adverse impact on surface water quality)
Moderate Moderate Low
Altered surface water flow regime (risk to infrastructure, riparian vegetation, terrestrial ecosystems and environmental flow regime)
Moderate Low Low
Altered geomorphic character (e.g. increased lateral instability; significant alteration of geomorphic units)
Low Low Low
The outcomes of mitigation measures illustrate that the residual significance of potential impacts will be reduced to either low or moderate level following implementation of the management framework outlined in Figure 3-1 and detailed in Section 3.4.

Gas Field Development Project EIS 2014
73
Perfo
rman
ce m
anag
emen
t
4 Performance management
This section details the approach that Santos GLNG uses to measure performance of the various management approaches applied for the protection of water resources throughout the GFD Project area. The information provided here is high-level and relevant across the whole GFD Project area; site-specific performance management approaches are incorporated in relevant BUAs or EAs following approval.
4.1 Reporting requirements Reporting requirements will vary across the GFD Project for protection of identified surface water and groundwater resources.
In general, Santos GLNG will report to government in compliance with:
• The terms of environmental approvals issued by DOTE and EHP, including requirements for:
— Duty to notify, and reporting for notifiable activities — Reporting for emergency environmental incidents — Annual reports for monitoring programs targeted at specific environmental receptors — Document management (for example, keeping project-related documents for a specific number
of years).
• The terms of beneficial use approvals issued by EHP • UWIR requirements for the Water Monitoring Strategy (OGIA 2012):
— WMS network implementation report every six months; the first report to be submitted to OGIA within two months of approval of the final UWIR
— Required groundwater monitoring data submitted to OGIA every six months — Results of completed groundwater baseline assessment reported to OGIA within 12 months of
the UWIR being approved.
• UWIR requirements for the Spring Impact Management Strategy:
— Evaluation of Mitigation Options Report prepared for each spring identified as being within GFD Project area in the most recent UWIR; provided to OGIA within nine months of UWIR approval by EHP. A project plan for the preparation of this report will also be provided to OGIA within two months of final UWIR approval.
• JIP EWS commitments which include simple reporting of data every year (data and plots of data against trigger as appropriate, trend analysis after collection of baseline) and a consolidated report every three years (Appendix B).
In addition to the regulatory reporting outlined above, Santos GLNG also releases publicly available monitoring data to uphold commitments to the community for openness and transparency. Groundwater and surface water monitoring data can be viewed by the public via the Santos Water Portal at http://www.santoswaterportal.com.au/.

Gas Field Development Project EIS 2014
74
Ref
eren
ces
5 References
BoM 2012 ‘National Atlas of Groundwater Dependent Ecosystems’, hosted by the Bureau of Meteorology, Australian Government, http://www.bom.gov.au/water/groundwater/gde/map.shtml
Condamine Alliance, 2012a. Draft Environmental Values for the Groundwaters of the Condamine Catchment, Queensland, March 2012.
Condamine Alliance, 2012b. Draft Environmental Values for the Surface Waters of the Condamine Catchment, Queensland, March 2012.
Department of Environment and Resource Management (DERM), 2011a. Comet River Sub-basin Environmental Values and Water Quality Objectives, Basin No. 130 (part), including all waters of the Comet River Sub-basin, September 2011.
Department of Environment and Resource Management (DERM), 2011b. Dawson River Sub-basin Environmental Values and Water Quality Objectives, Basin No. 130 (part), including all waters of the Dawson River Sub-basin, except the Callide Creek Catchment, September 2011.
DOTE 2012 Bilateral Agreement between the Australian Government and Queensland: An agreement between the Commonwealth and the State of Queensland under Section 45 of the Environment Protection and Biodiversity Conservation Act 1999 relating to environmental assessment, amended June 2012, Department of the Environment, Australian Government, 14pp.
EHP 2013a EM635: Manual for Assessing Consequence Categories and Hydraulic Performance of Structures, Version 4, November 2013, Queensland Department of Environment and Heritage, Brisbane, 28pp.
EHP 2013b Notice of General Beneficial Use Approval – Irrigation of associated water (including coal seam gas water), Department of Environment and Heritage Protection, Queensland Government, viewed online 30 April 2014, http://www.ehp.qld.gov.au/management/non-mining/documents/general-bua-irrigation-of-associated-water.pdf
EHP 2013c Notice of General Beneficial Use Approval – Associated water (including coal seam gas water), Department of Environment and Heritage Protection, Queensland Government, http://www.ehp.qld.gov.au/management/non-mining/documents/general-bua.pdf
EHP 2014 EM1260: receiving environment monitoring program guideline, for use with environmentally relevant activities under the Environmental Protection Act 1994, Department of Environment and Heritage Protection, Queensland Government, Brisbane, 27pp.
Fensham, RJ, Pennay, C, Drimmer, J 2012 Ecological and Botanical survey of springs in the Surat Cumulative Management Area, January 2012, Queensland Herbarium.
Golder Associates Pty Ltd (Golder) 2011a Baseline Assessment Report and Submission of Bore Inventory Data to DERM, March 2011.
Golder 2013 Baseline Assessment Plan, Santos Regional Bore Inventory Data, Rev 4, 27 March 2013.
IESC 2013 Information guidelines for proposals relating to the development of coal seam gas and large coal mines where there is a significant impact on water resources, Independent Expert Scientific Committee on Coal Seam Gas and Large Coal Mining Development, 12 February 2013, Canberra, 16pp.
Gas Field Development Project EIS 2014
75
Ref
eren
ces
OGIA 2012 Underground Water Impact Report for the Surat Cumulative Management Area, prepared by Coal Seam Gas Water, Queensland Water Commission (QWC, now the Office of Groundwater Impact Assessment), 18 July 2012, State of Queensland, 224pp.
Parsons Brinckerhoff 2014 GLNG Gas Field Development Project Groundwater Technical Report, prepared for Santos GLNG, 11 June 2014.
QMDC 2012 Healthy Waters Management Plan: Draft Environmental Values and Community Consultation Report, Queensland Murray-Darling Committee, 28pp.
Santos GLNG 2013 Santos GLNG Project Report, CSG Water Monitoring and Management Plan – Stage 2 Revision 2, October 2013
Santos GLNG 2014 2014 Program of Hydraulic Connectivity Studies to meet Requirements of the EPBC Act (1999)