
DZ Bank, Deutsche Börse th Sustainable Technologies
39
DZ Bank, Deutsche Börse 8 th Sustainable Technologies Conference Zurich, 02 June 2015 Dr. Jürgen Rebel Corporate Vice President Investor Relations
Transcript of DZ Bank, Deutsche Börse th Sustainable Technologies

DZ Bank, Deutsche Börse 8th Sustainable Technologies Conference Zurich, 02 June 2015 Dr. Jürgen Rebel Corporate Vice President Investor Relations

Table of Contents
Infineon at a Glance
Growth Drivers
Results and Outlook
Disclaimer:
This presentation contains forward-looking statements about the business, financial condition and earnings performance of the Infineon Group.
These statements are based on assumptions and projections resting upon currently available information and present estimates. They are subject to a multitude of uncertainties and risks. Actual business development may therefore differ materially from what has been expected.
Beyond disclosure requirements stipulated by law, Infineon does not undertake any obligation to update forward-looking statements.
Page 2 2015-06-02 Copyright © Infineon Technologies AG 2015. All rights reserved.

Leadership in System Understanding Will Foster Future Growth and Profitability
#1 and technology leader in Power
System leader in Automotive
Leader in Security Solutions
Competitive advantages
Revenue Growth:
~8%
Segment Result Margin:
~15%
Investment-to-Sales:
~13%
Average-cycle financial targets
Page 3 2015-06-02 Copyright © Infineon Technologies AG 2015. All rights reserved.

Automotive and Power are the Two Major Pillars of Infineon‘s Businesses
Revenue split by Segment** Power represents ~60% of revenue
ATV ~41%
CCS ~12%
IPC ~16%
PMM ~31%
ATV IPC PMM CCS
Power Non-Power
[EUR m]
598
241
464
182
** ̀ Other Operating Segments´(OOS) and `Corporate and Eliminations´(C&E) accounted for €-2m.
Q2 FY15 revenue*: EUR 1,483m
*Includes revenues from International Rectifier from 13 January to 31 March 2015.
Page 4 2015-06-02 Copyright © Infineon Technologies AG 2015. All rights reserved.
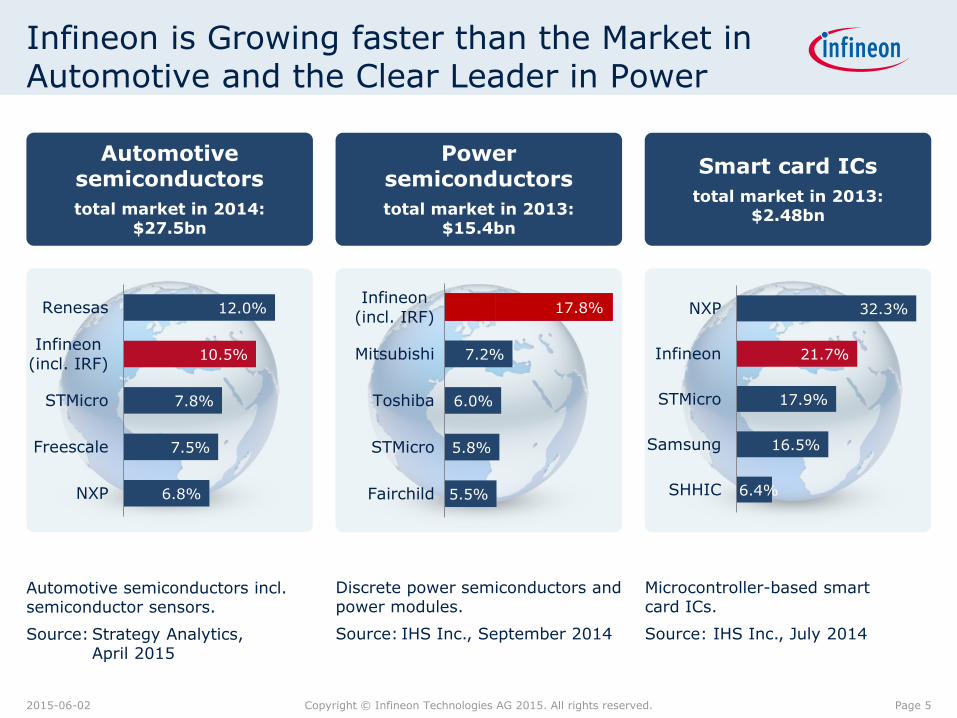
Infineon is Growing faster than the Market in Automotive and the Clear Leader in Power
Discrete power semiconductors and power modules.
Source: IHS Inc., September 2014
Microcontroller-based smart card ICs.
Source: IHS Inc., July 2014
Automotive semiconductors incl. semiconductor sensors.
Source: Strategy Analytics, April 2015
Automotive semiconductors
total market in 2014: $27.5bn
6.8%
7.5%
7.8%
10.5%
12.0%
NXP
Freescale
STMicro
Infineon
(incl. IRF)
Renesas
Power semiconductors
total market in 2013: $15.4bn
Smart card ICs
total market in 2013: $2.48bn
6.4%
16.5%
17.9%
21.7%
32.3%
SHHIC
Samsung
STMicro
Infineon
NXP
5.5%
5.8%
6.0%
7.2%
17.8%
Fairchild
STMicro
Toshiba
Mitsubishi
Infineon
(incl. IRF)
Page 5 2015-06-02 Copyright © Infineon Technologies AG 2015. All rights reserved.
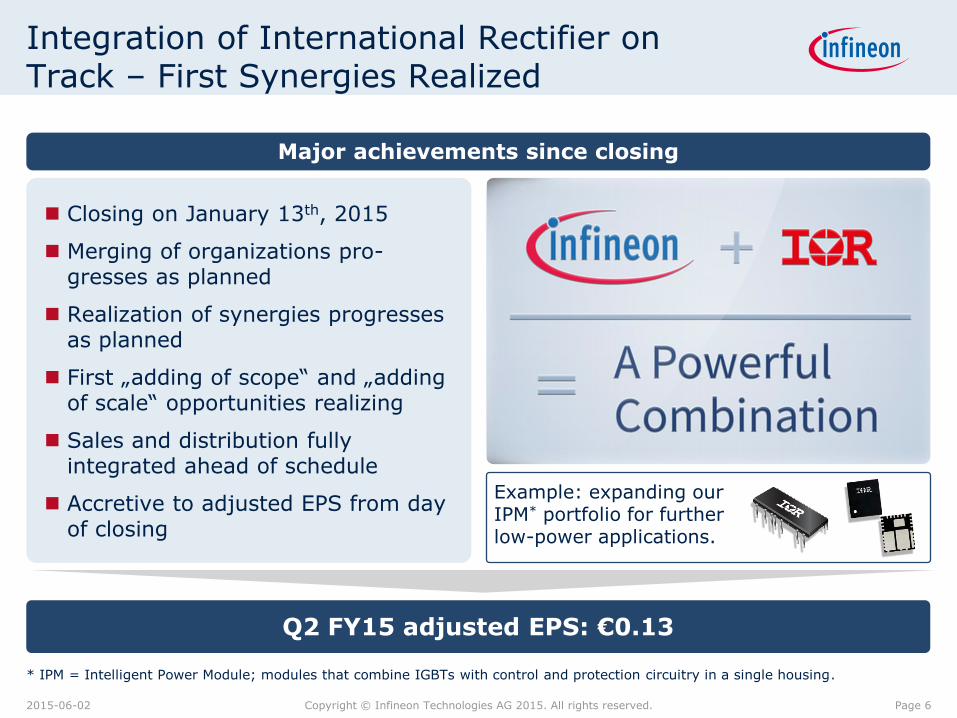
Integration of International Rectifier on Track – First Synergies Realized
Q2 FY15 adjusted EPS: €0.13
Example: expanding our IPM* portfolio for further low-power applications.
Closing on January 13th, 2015
Merging of organizations pro-gresses as planned
Realization of synergies progresses as planned
First „adding of scope“ and „adding of scale“ opportunities realizing
Sales and distribution fully integrated ahead of schedule
Accretive to adjusted EPS from day of closing
Major achievements since closing
* IPM = Intelligent Power Module; modules that combine IGBTs with control and protection circuitry in a single housing.
Page 6 2015-06-02 Copyright © Infineon Technologies AG 2015. All rights reserved.

Table of Contents
Infineon at a Glance
Growth Drivers
Results and Outlook
Page 7 2015-06-02 Copyright © Infineon Technologies AG 2015. All rights reserved.
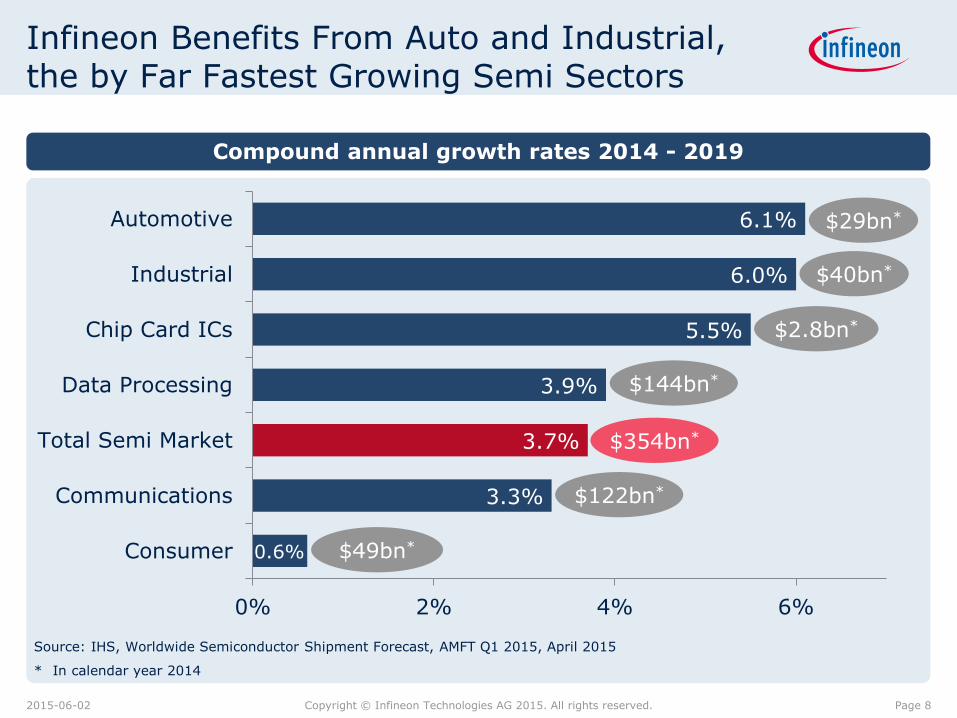
Infineon Benefits From Auto and Industrial, the by Far Fastest Growing Semi Sectors
0.6%
3.3%
3.7%
3.9%
5.5%
6.0%
6.1%
0% 2% 4% 6%
Consumer
Communications
Total Semi Market
Data Processing
Chip Card ICs
Industrial
Automotive
Source: IHS, Worldwide Semiconductor Shipment Forecast, AMFT Q1 2015, April 2015
* In calendar year 2014
Compound annual growth rates 2014 - 2019
$354bn*
$144bn*
$40bn*
$29bn*
$122bn*
$49bn*
$2.8bn*
Page 8 2015-06-02 Copyright © Infineon Technologies AG 2015. All rights reserved.

Automotive: IFX Holds Leading Positions in System-Crucial Product Categories as global #2
Source: Strategy Analytics, April 2015.
* “others” include: opto, small-signal discretes, logic ICs, non-power analog, memory, and other components.
Infineon covers
the entire
control loop
Power 27%
µC 24%
Sensors 15%
others* 34%
Infineon’s position 2014
Sensors (#2)
µC (#3)
Power (#1)
“Power” and “Sensors” are among the
fastest growing product categories with
11% growth y-y each.
Infineon increased market share in
“Power” by 3.5%-points resulting in
market share of 24.8%.
Infineon’s share in “Sensors” driven by
pressure and magnetic sensors.
24.8%
8.7%
11.5%
2014 automotive semiconductor market by product category ($27.5bn)
Page 9 2015-06-02 Copyright © Infineon Technologies AG 2015. All rights reserved.

Infineon Covers Critical Elements for (Semi-) Autonomous Driving
SENSE COMPUTE ACTUATE
Ultrasonic
Camera
Outside
Camera Inside
LIDAR
Engine
Transmission
Steering
Braking
POWERTRAIN DOMAIN
CONTROLLER
SAFETY DOMAIN
CONTROLLER
SENSOR FUSION
µC
GRAPHICS PROCESSOR
- - - - - - - - - - - - - - - - - - - - - - - - -
- - - - - - - - - - - - -
Radar
- - - - - - - - - - - -
Page 10 2015-06-02 Copyright © Infineon Technologies AG 2015. All rights reserved.
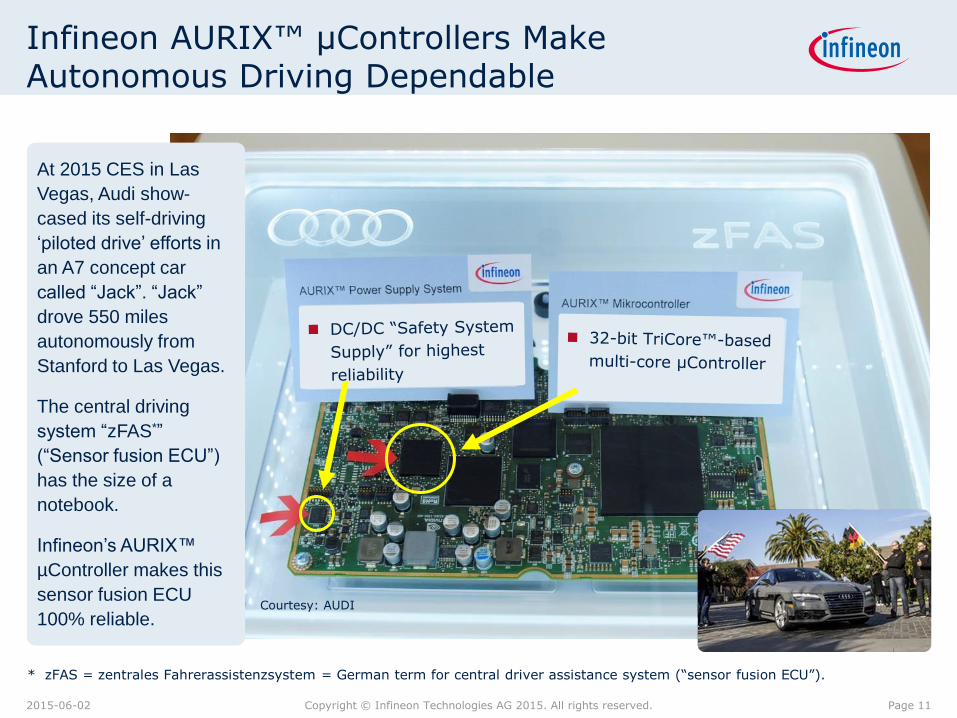
Infineon AURIX™ µControllers Make Autonomous Driving Dependable
* zFAS = zentrales Fahrerassistenzsystem = German term for central driver assistance system (“sensor fusion ECU”).
At 2015 CES in Las
Vegas, Audi show-
cased its self-driving
‘piloted drive’ efforts in
an A7 concept car
called “Jack”. “Jack”
drove 550 miles
autonomously from
Stanford to Las Vegas.
The central driving
system “zFAS*”
(“Sensor fusion ECU”)
has the size of a
notebook.
Infineon’s AURIX™
µController makes this
sensor fusion ECU
100% reliable. Courtesy: AUDI
Page 11 2015-06-02 Copyright © Infineon Technologies AG 2015. All rights reserved.

Wide Adoption of Premium Features, ADAS and CO2 Reduction Drive ATV‘s Growth
Vehicle production
Drivers for semiconductor content per car
CO2 reduction
* ADAS: Advanced Driver Assistance Systems
ADAS* Comfort, Premium
Courtesy: BMW Group
~4% growth per annum
highest growth in China
Europe and the US recovering
driven by legislation
realized in electric motors and pumps
adoption of EV/HEV
1st step: assisted driving
2nd step: semi-autonomous driving
3rd step: fully autonomous driving
premium cars are early adopters of high-end comfort and safety features
trickling down to mid-range
Courtesy: AUDI
Page 12 2015-06-02 Copyright © Infineon Technologies AG 2015. All rights reserved.
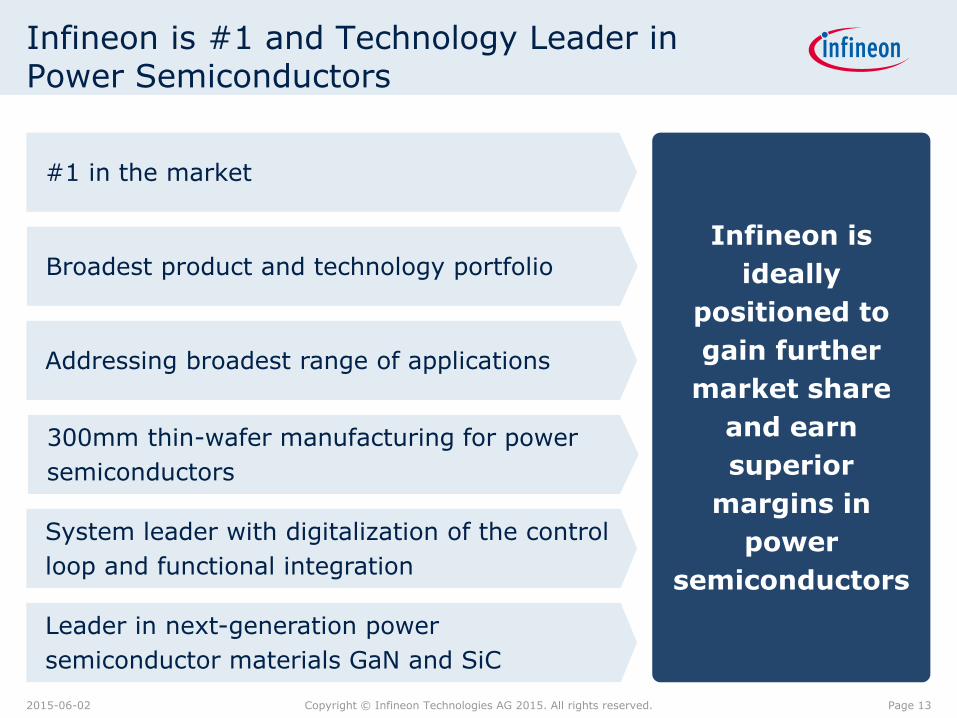
Infineon is
ideally
positioned to
gain further
market share
and earn
superior
margins in
power
semiconductors
Infineon is #1 and Technology Leader in Power Semiconductors
#1 in the market
Addressing broadest range of applications
300mm thin-wafer manufacturing for power
semiconductors
Broadest product and technology portfolio
Leader in next-generation power
semiconductor materials GaN and SiC
System leader with digitalization of the control
loop and functional integration
Page 13 2015-06-02 Copyright © Infineon Technologies AG 2015. All rights reserved.

World‘s First Automotive Power MOSFET From 300mm Thin-Wafer Manufactured
Infineon is the world’s first company to manufacture automotive-grade power MOSFETs on 300mm thin-wafers
Thereby, first step to load the 300mm fabs with automotive products done
Initial product: 40V OptiMOS™5
Thin-wafer technology is key basis for performance improvements:
brings energy losses to the minimum
enables very compact designs
Applications
power window
valve control
door control
sun roof
pumps
Features Package
Page 14 2015-06-02 Copyright © Infineon Technologies AG 2015. All rights reserved.

Consumption
As System Leader in Power Infineon Offers Solutions to a Wide Spectrum of Applications
Covering the entire power chain
Transmission
notebook adapter
aviation, space
Generation
Main IPC markets Main PMM power markets
industrial
CCAV
charging infra-
structure for
electro- mobility
motor drive appliances
eBikes
lighting
PC power supply
solar power
wind power
robotics consumer
induction heating
fans
trains
power tools pumps cloud
smartphone charger
HVDC
System competence for highest reliability and highest efficiency
Controllers Drivers MOSFET/IGBT Modules Stacks
Primarion, CHiL
.dp
Power ICs
µC: XMC™ family
MOSFET driver
IGBT driver
galvanic isolation
low-voltage MOSFETs
high-voltage MOSFETs
discrete IGBTs
low-power
mid-power
high-power
IGBT stacks
Page 15 2015-06-02 Copyright © Infineon Technologies AG 2015. All rights reserved.
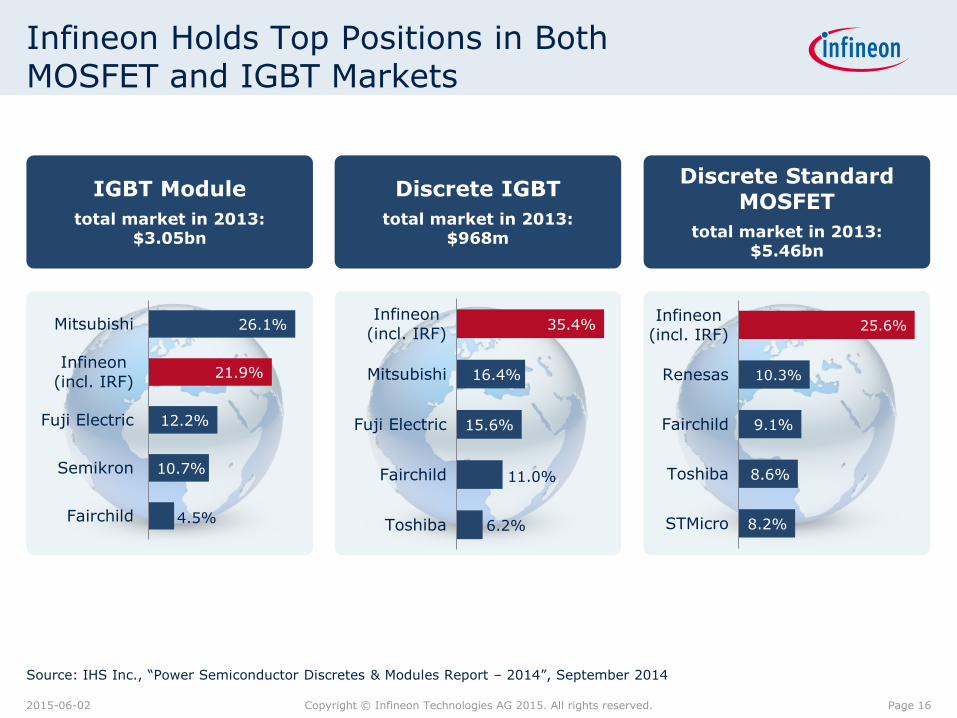
Infineon Holds Top Positions in Both MOSFET and IGBT Markets
Discrete Standard MOSFET
total market in 2013: $5.46bn
Discrete IGBT
total market in 2013: $968m
IGBT Module
total market in 2013: $3.05bn
4.5%
10.7%
12.2%
21.9%
26.1%
Fairchild
Semikron
Fuji Electric
Infineon
(incl. IRF)
Mitsubishi
6.2%
11.0%
15.6%
16.4%
35.4%
Toshiba
Fairchild
Fuji Electric
Mitsubishi
Infineon
(incl. IRF)
8.2%
8.6%
9.1%
10.3%
25.6%
STMicro
Toshiba
Fairchild
Renesas
Infineon
(incl. IRF)
Source: IHS Inc., “Power Semiconductor Discretes & Modules Report – 2014”, September 2014
Page 16 2015-06-02 Copyright © Infineon Technologies AG 2015. All rights reserved.

Infineon‘s Path to Expand its Market Share for MHA* and Light Industrial Applications
1st step: Increase of shareholding in the Korean joint venture
LS Power Semitech (LSPS) from 46% to 66%, thereby
benefitting from the close cooperation with Samsung and LG
who go for 100% VSD** motor control.
2nd step: Acquisition of International Rectifier.
Major product families for MHA*: IRAM and iMOTION.
3rd step: Fully consolidation of LSPS, thereby increasing
Infineon’s footprint in the growing market segment of IPMs***
for consumer appliances and light industrial applications.
Profitable growth achieved by very competitive manufacturing
cost position.
Strategic steps
Major market developments
Demand for higher efficiency increases VSD** penetration in home appliances.
In the US, a decent share of MHA* are overaged; no refurbishment since economic crisis.
In the US, new energy efficiency legislation for refrigerators and freezers drives VSD penetration for compressors and fans.
* MHA = Major Home Appliances. ** VSD = Variable Speed Drive.
CIPOS™-Mini
*** IPM = Intelligent Power Module; modules that combine IGBTs with control and protection circuitry in a single housing.
Page 17 2015-06-02 Copyright © Infineon Technologies AG 2015. All rights reserved.
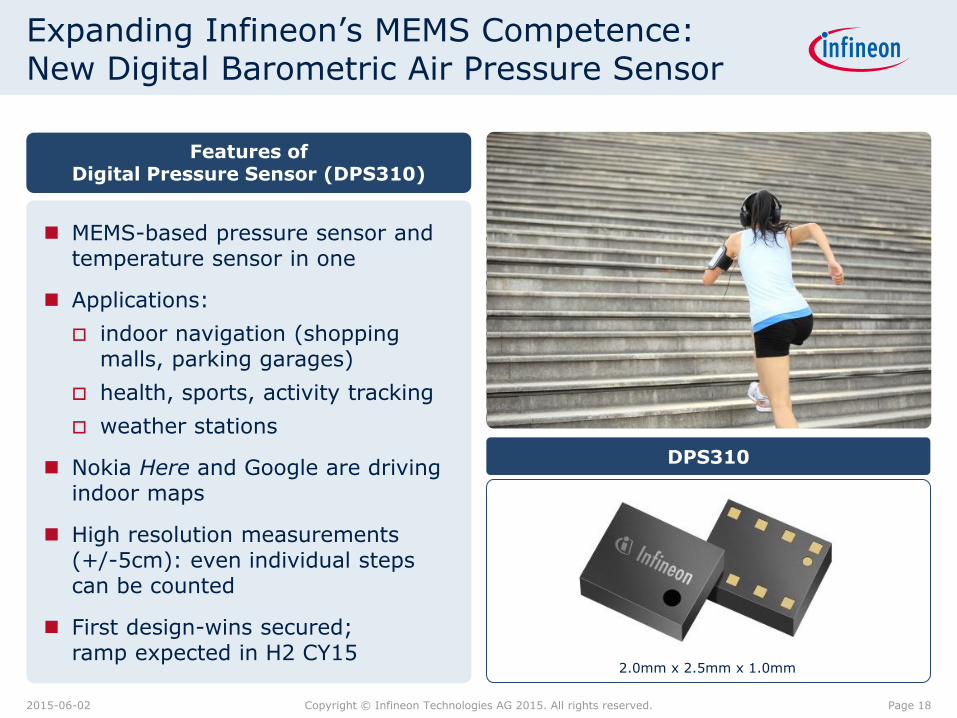
Expanding Infineon’s MEMS Competence: New Digital Barometric Air Pressure Sensor
MEMS-based pressure sensor and temperature sensor in one
Applications:
indoor navigation (shopping malls, parking garages)
health, sports, activity tracking
weather stations
Nokia Here and Google are driving indoor maps
High resolution measurements (+/-5cm): even individual steps can be counted
First design-wins secured; ramp expected in H2 CY15
Features of Digital Pressure Sensor (DPS310)
2.0mm x 2.5mm x 1.0mm
DPS310
Page 18 2015-06-02 Copyright © Infineon Technologies AG 2015. All rights reserved.

Efficiency and Digitalization are Main Market Drivers for Power Applications
Traction MHA Renewables AC/DC Drives DC/DC
Legislation
Growing share of renewable energies as part of the energy generation mix
Energy efficiency
Automation
productivity increase
Growing population in metropolitan areas
Fast and efficient mass trans-port system
Energy efficiency
Growing VSD penetration
Energy efficiency
charging time
Compact-ness (power density)
DPM
Energy efficiency
Compact-ness (power density)
DPM
IPC PMM
DPM = Digital Power Management. MHA = Major Home Appliances. VSD = Variable Speed Drive.
Page 19 2015-06-02 Copyright © Infineon Technologies AG 2015. All rights reserved.

CCS is Well Positioned to Grow Faster Than the Market as Leader in Security Solutions
IoT Security Government
Identification Payment
High-end Mobile Communications
Greater adoption of NFC technologies
Larger memory (1.5 Megabyte)
Multi-application cards
Transition to chip-based payment cards in China and the US
Growth of mobile payment
Adoption of elec-tronic govern-mental documents (national ID cards, passports, health cards, etc.)
Larger memory
Rise of smart homes, connected cars, automated industries etc.
Increasing need of IT security
Growth of M2M communication
Page 20 2015-06-02 Copyright © Infineon Technologies AG 2015. All rights reserved.
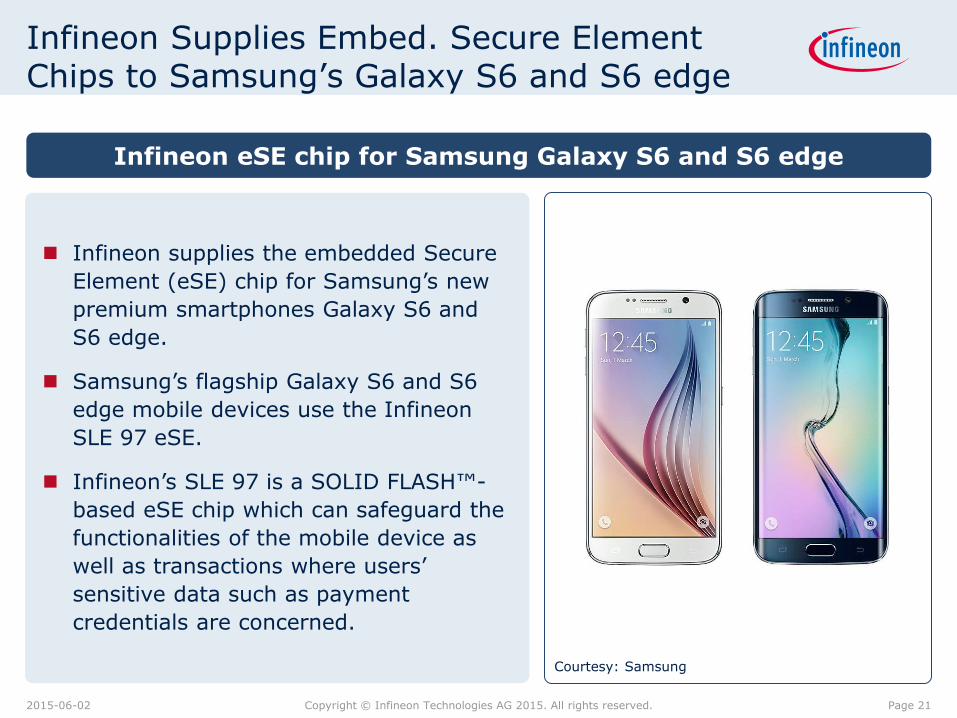
Infineon Supplies Embed. Secure Element Chips to Samsung’s Galaxy S6 and S6 edge
Infineon supplies the embedded Secure
Element (eSE) chip for Samsung’s new
premium smartphones Galaxy S6 and
S6 edge.
Samsung’s flagship Galaxy S6 and S6
edge mobile devices use the Infineon
SLE 97 eSE.
Infineon’s SLE 97 is a SOLID FLASH™-
based eSE chip which can safeguard the
functionalities of the mobile device as
well as transactions where users’
sensitive data such as payment
credentials are concerned.
Infineon eSE chip for Samsung Galaxy S6 and S6 edge
Courtesy: Samsung
Page 21 2015-06-02 Copyright © Infineon Technologies AG 2015. All rights reserved.
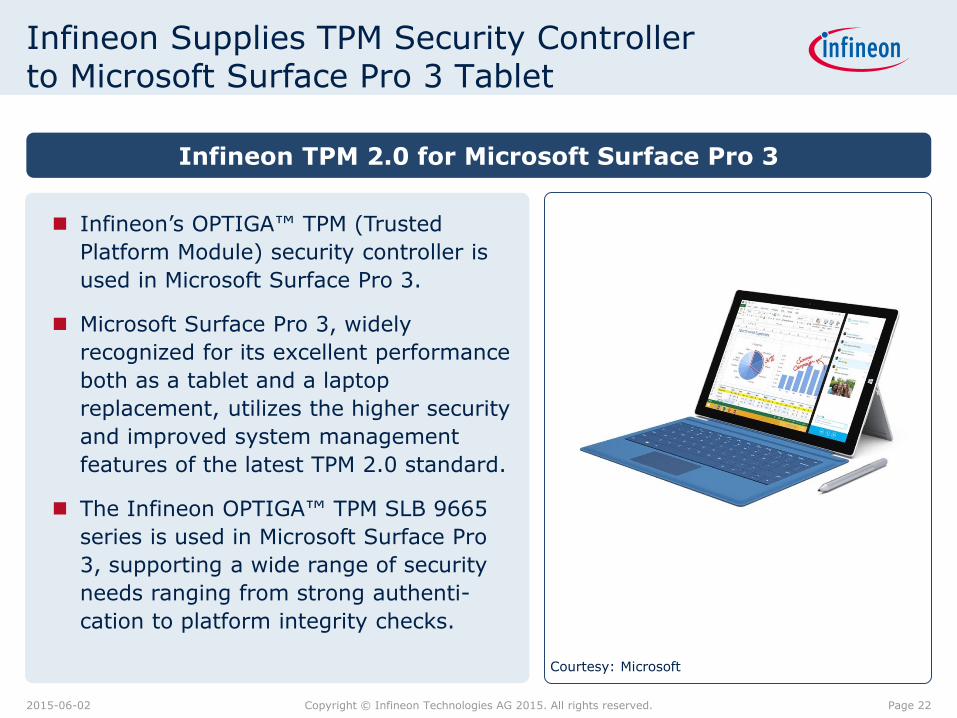
Infineon Supplies TPM Security Controller to Microsoft Surface Pro 3 Tablet
Infineon’s OPTIGA™ TPM (Trusted
Platform Module) security controller is
used in Microsoft Surface Pro 3.
Microsoft Surface Pro 3, widely
recognized for its excellent performance
both as a tablet and a laptop
replacement, utilizes the higher security
and improved system management
features of the latest TPM 2.0 standard.
The Infineon OPTIGA™ TPM SLB 9665
series is used in Microsoft Surface Pro
3, supporting a wide range of security
needs ranging from strong authenti-
cation to platform integrity checks.
Infineon TPM 2.0 for Microsoft Surface Pro 3
Courtesy: Microsoft
Page 22 2015-06-02 Copyright © Infineon Technologies AG 2015. All rights reserved.
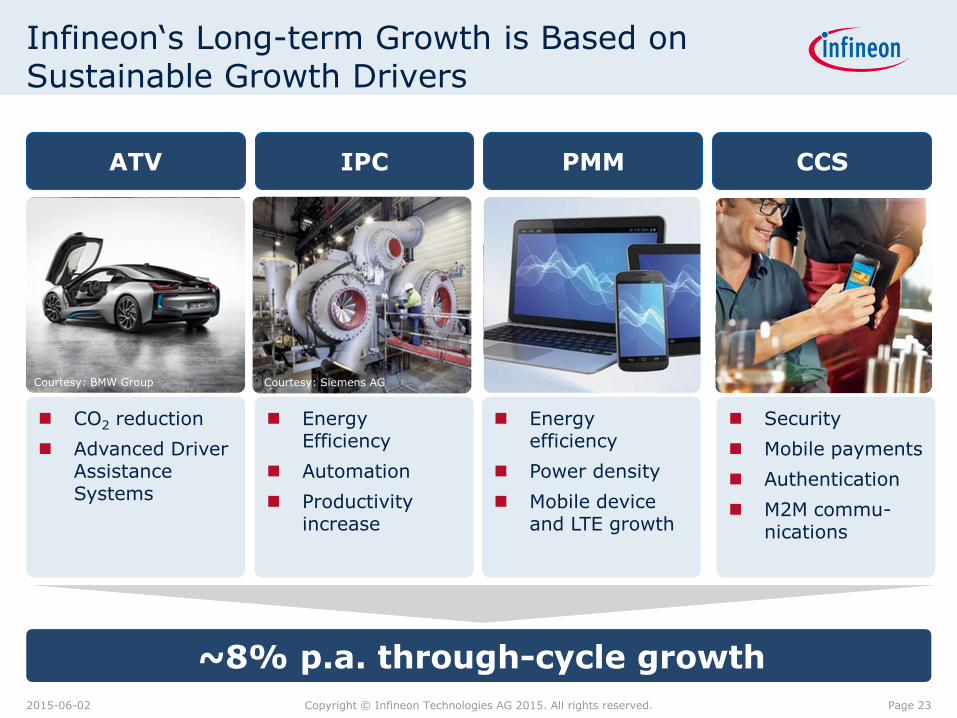
Infineon‘s Long-term Growth is Based on Sustainable Growth Drivers
~8% p.a. through-cycle growth
ATV IPC PMM CCS
Courtesy: BMW Group Courtesy: Siemens AG
CO2 reduction
Advanced Driver Assistance Systems
Energy Efficiency
Automation
Productivity increase
Energy efficiency
Power density
Mobile device and LTE growth
Security
Mobile payments
Authentication
M2M commu-nications
Page 23 2015-06-02 Copyright © Infineon Technologies AG 2015. All rights reserved.

Table of Contents
Infineon at a Glance
Growth Drivers
Results and Outlook
Page 24 2015-06-02 Copyright © Infineon Technologies AG 2015. All rights reserved.
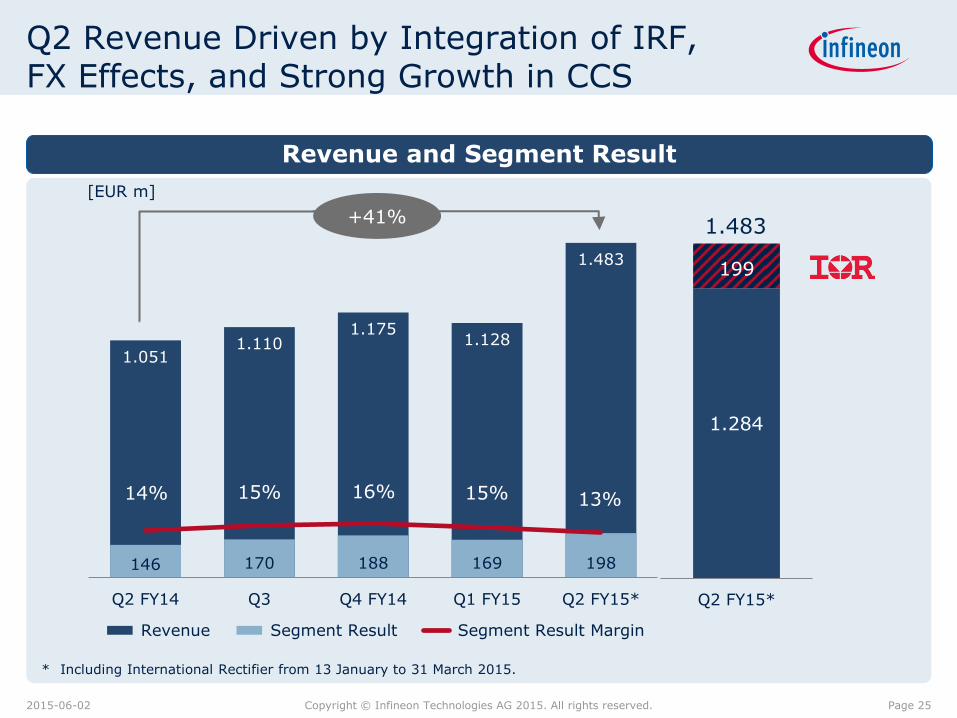
Q2 Revenue Driven by Integration of IRF, FX Effects, and Strong Growth in CCS
Revenue and Segment Result
[EUR m]
1.051 1.110
1.175 1.128
1.483
146 170 188 169 198
Q2 FY14 Q3 Q4 FY14 Q1 FY15 Q2 FY15*
Revenue Segment Result Segment Result Margin
13% 14% 15% 16% 15%
+41%
* Including International Rectifier from 13 January to 31 March 2015.
Q2 FY15*
199
1.284
1.483
Page 25 2015-06-02 Copyright © Infineon Technologies AG 2015. All rights reserved.

ATV, IPC and PMM Boosted by Int. Rectifier Businesses; CCS Growth Solely Organic
484 510 518 518
598
185 200
219 190
241 252 271
300 280
464
121 123 142 132
182
66 70 69 72 64 33 40 44 28 20 37 46 60 48 82 8 10 20 18 32
Q2
FY14
Q3 Q4 Q1
FY15
Q2* Q2
FY14
Q3 Q4 Q1
FY15
Q2* Q2
FY14
Q3 Q4 Q1
FY15
Q2* Q2
FY14
Q3 Q4 Q1
FY15
Q2
Revenue Segment Result Segment Result Margin
+30%
[EUR m]
+84%
11% 14% 14% 13% 14%
20% 15%
20% 18%
8% 7%
18%
17%
+24%
ATV IPC CCS PMM
[EUR m] [EUR m] [EUR m]
+50%
14%
20% 18% 15% 17%
8% 14%
* Including International Rectifier from 13 January to 31 March 2015.
Page 26 2015-06-02 Copyright © Infineon Technologies AG 2015. All rights reserved.
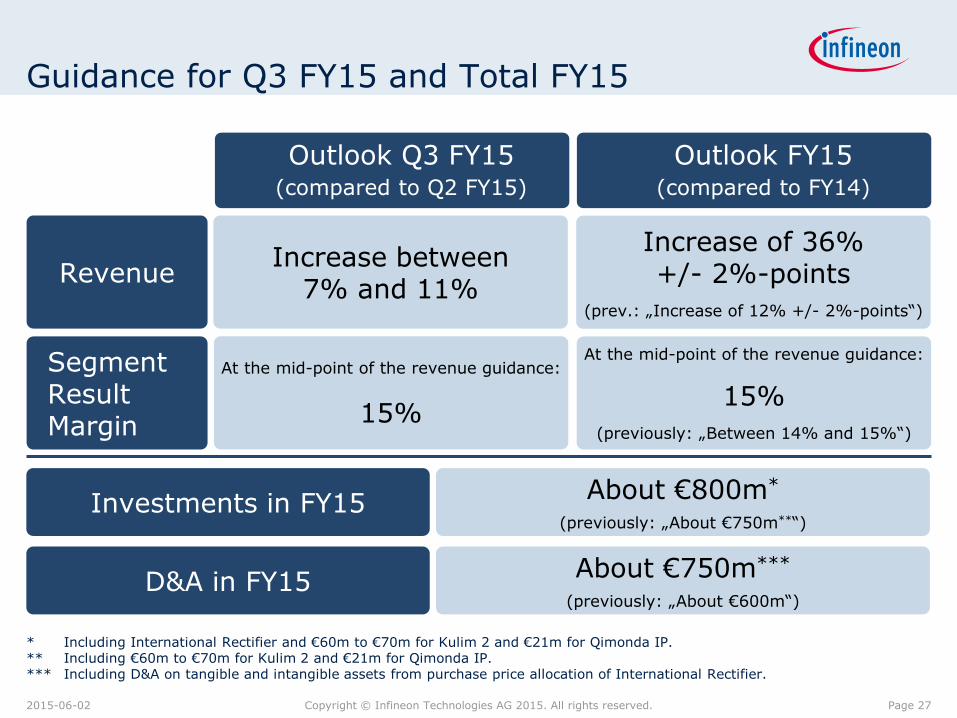
Guidance for Q3 FY15 and Total FY15
Segment Result Margin
Revenue
Outlook Q3 FY15 (compared to Q2 FY15)
At the mid-point of the revenue guidance:
15%
Increase between 7% and 11%
At the mid-point of the revenue guidance:
15%
(previously: „Between 14% and 15%“)
Increase of 36% +/- 2%-points
(prev.: „Increase of 12% +/- 2%-points“)
Investments in FY15 About €800m*
(previously: „About €750m**“)
D&A in FY15 About €750m***
(previously: „About €600m“)
Outlook FY15 (compared to FY14)
* Including International Rectifier and €60m to €70m for Kulim 2 and €21m for Qimonda IP. ** Including €60m to €70m for Kulim 2 and €21m for Qimonda IP. *** Including D&A on tangible and intangible assets from purchase price allocation of International Rectifier.
Page 27 2015-06-02 Copyright © Infineon Technologies AG 2015. All rights reserved.


SG&A Ratio Significantly Increased Due to Acquisition-Related Expenses
S and G&A** R&D***
[EUR m]
* Including International Rectifier from 13 January to 31 March 2015. ** Target range for SG&A: „Low teens percentage of sales“. *** Target range for R&D: „Low to mid teens percentage of sales“.
121 122
138 136
214
136 141 140 139
180
10%
11%
12%
13%
14%
15%
0
20
40
60
80
100
120
140
160
180
200
220
Q2
FY14
Q3 Q4 Q1
FY15
Q2* Q2
FY14
Q3 Q4 Q1
FY15
Q2*
General & Administration Selling R&D % of sales [rhs]
Page 29 2015-06-02 Copyright © Infineon Technologies AG 2015. All rights reserved.

Higher Business Volume Leads to an Increase in Working Capital
Working capital** Inventories
Trade receivables Trade payables
[EUR m]
* Including International Rectifier from 13 January to 31 March 2015. ** For definition please see page 35.
674 680 707 755
1013
0
20
40
60
80
100
0
200
400
600
800
1000
Q2 FY14 Q3 Q4 Q1 FY15 Q2*
Inventories DOI**
[EUR m]
529 553 581
486
739
0
20
40
60
80
100
0
200
400
600
800
Q2 FY14 Q3 Q4 Q1 FY15 Q2*
Trade receivables DSO**
[EUR m]
560 531 648
572
677
0
20
40
60
80
100
0
200
400
600
800
Q2 FY14 Q3 Q4 Q1 FY15 Q2*
Trade payables DPO**
[EUR m] [days]
-75 -16 -52
490
751
-100
100
300
500
700
Q2 FY14 Q3 Q4 Q1 FY15 Q2*
[days]
[days]
Page 30 2015-06-02 Copyright © Infineon Technologies AG 2015. All rights reserved.

FY15 Investments Ratio Including Int. Rectifier is Decreasing Towards 13%
Investments** D&A
[EUR m]
* Including International Rectifier from 13 January to 31 March 2015. ** For definition please see page 35. *** Including International Rectifier, €60m to €70m for Kulim 2, and €21m for Qimonda IP.
141 141
150 199
115
325
887 890
378
668
453
336
364 428
466 514 15.1%
11.9% 13.6% 12.8%
0%
10%
20%
30%
0
200
400
600
800
1000
FY09 FY10 FY11 FY12 FY13 FY14 FY15e* FY09 FY10 FY11 FY12 FY13 FY14 FY15e*
Q1 Q2 Q3 Fiscal Year Guidance 6Y-avg % of sales [rhs] % of FY15 revenue guidance [rhs]
~800***
~750
Page 31 2015-06-02 Copyright © Infineon Technologies AG 2015. All rights reserved.

Dividend of €0.18 Has Increased Capital Returns by €202m in February 2015
[EUR m]
173
62 35
26
20
38
109
130
129 129 202
FY11 FY12 FY13 FY14 FY15
convertible bond buyback share buyback (via put options) dividends
308
212
167
Total gross capital returns history
1,053
In November 2013, a
new €300m capital
returns program with a
maturity until Sep 2015
was started.
Per 31 Mar 2015, no put
options for buyback
outstanding.
After acquisition of
International Rectifier,
currently no intention to
issue new options or to
buyback shares.
164
202
Page 32 2015-06-02 Copyright © Infineon Technologies AG 2015. All rights reserved.

Net Cash Position Turned Negative After Acquisition of International Rectifier
2198
2263
2418
2107
1656
188 190 186
190
1832
2010
2073
2232
1917
-176
Q2
FY14
Q3 Q4 Q1
FY15
Q2
Gross Cash Debt Net Cash / Net Debt
Liquidity Development
[EUR m]
In Q2, gross cash and net cash affected by:
payment of purchase price for International Rectifier,
dividend payment to the amount of €202m,
positive operating cash flow of €135m, and
increase in debt by €1.642m.
Page 33 2015-06-02 Copyright © Infineon Technologies AG 2015. All rights reserved.

5% 7% 16% 27% 17% 21% 24% 24% 18% 7% 0%
10%
20%
30%
Q1 FY13 Q2 Q3 Q4 Q1 FY14 Q2 Q3 Q4 Q1 FY15 Q2*
Target: 'RoCE Above WACC' Over the Cycle
RoCE** history
[EUR m]
Capital Employed** history
WACC: low teens %
* Including International Rectifier from 13 January to 31 March 2015. ** For definition please see page 35.
FY13: 14%
FY14: 20%
2239 2274 2216 2159 2194 2232 2327 2452 2969
5202
0
2000
4000
6000
Q1 FY13 Q2 Q3 Q4 Q1 FY14 Q2 Q3 Q4 Q1 FY15 Q2*
Page 34 2015-06-02 Copyright © Infineon Technologies AG 2015. All rights reserved.
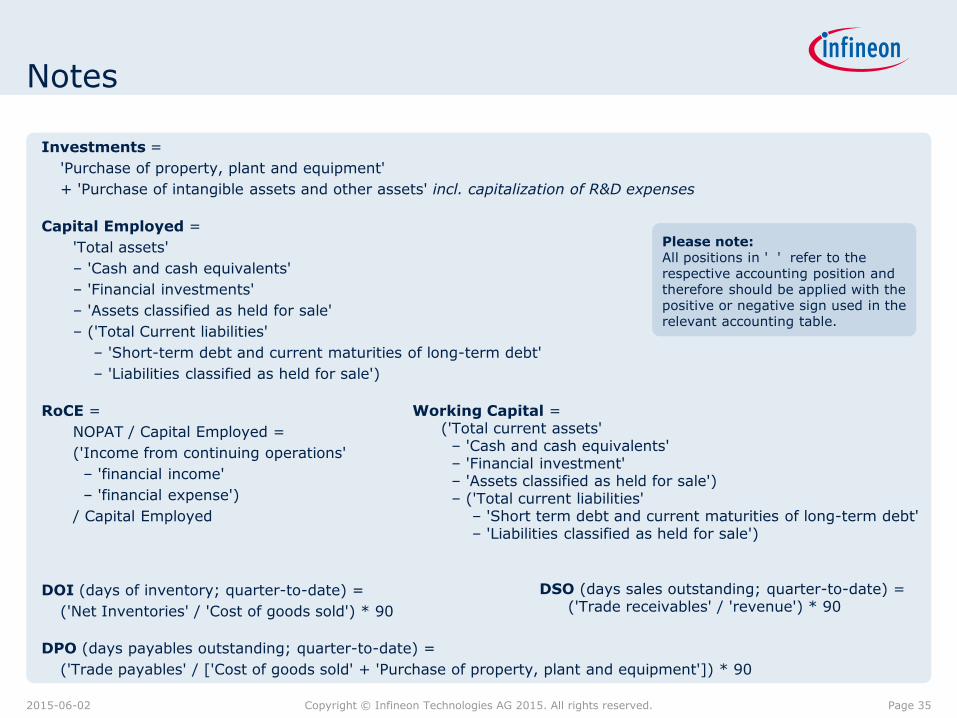
Notes
Investments =
'Purchase of property, plant and equipment'
+ 'Purchase of intangible assets and other assets' incl. capitalization of R&D expenses
Capital Employed =
'Total assets'
– 'Cash and cash equivalents'
– 'Financial investments'
– 'Assets classified as held for sale'
– ('Total Current liabilities'
– 'Short-term debt and current maturities of long-term debt'
– 'Liabilities classified as held for sale')
RoCE =
NOPAT / Capital Employed =
('Income from continuing operations'
– 'financial income'
– 'financial expense')
/ Capital Employed
DOI (days of inventory; quarter-to-date) =
('Net Inventories' / 'Cost of goods sold') * 90
DPO (days payables outstanding; quarter-to-date) =
('Trade payables' / ['Cost of goods sold' + 'Purchase of property, plant and equipment']) * 90
Working Capital = ('Total current assets' – 'Cash and cash equivalents' – 'Financial investment' – 'Assets classified as held for sale') – ('Total current liabilities' – 'Short term debt and current maturities of long-term debt' – 'Liabilities classified as held for sale')
Please note: All positions in ' ' refer to the respective accounting position and therefore should be applied with the positive or negative sign used in the relevant accounting table.
DSO (days sales outstanding; quarter-to-date) = ('Trade receivables' / 'revenue') * 90
Page 35 2015-06-02 Copyright © Infineon Technologies AG 2015. All rights reserved.
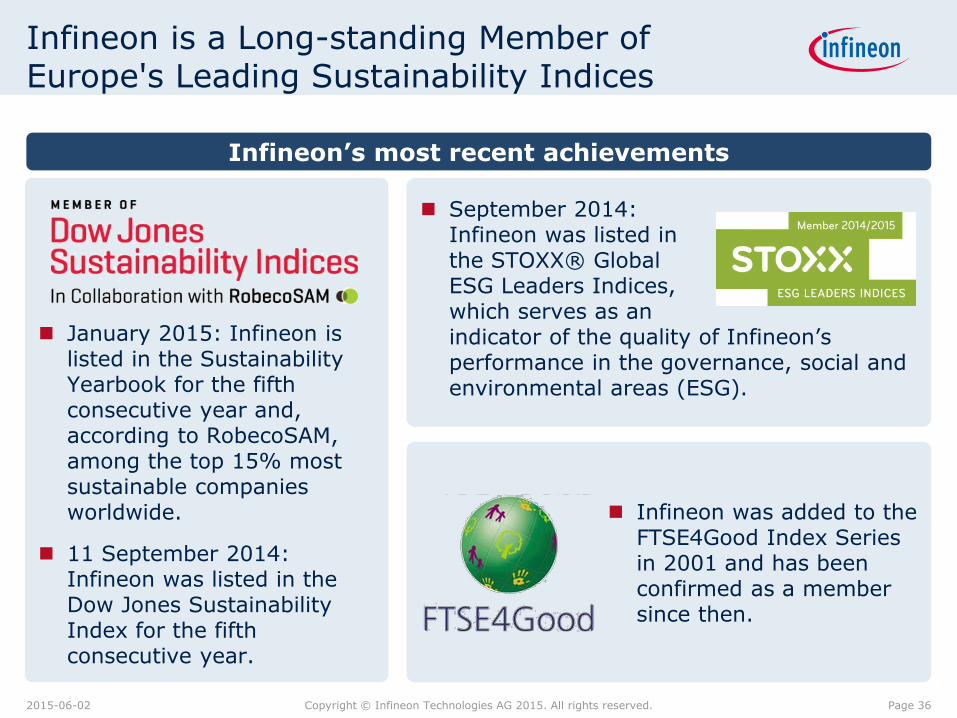
January 2015: Infineon is listed in the Sustainability Yearbook for the fifth consecutive year and, according to RobecoSAM, among the top 15% most sustainable companies worldwide.
11 September 2014: Infineon was listed in the Dow Jones Sustainability Index for the fifth consecutive year.
Infineon is a Long-standing Member of Europe's Leading Sustainability Indices
September 2014: Infineon was listed in the STOXX® Global ESG Leaders Indices, which serves as an indicator of the quality of Infineon’s performance in the governance, social and environmental areas (ESG).
Infineon’s most recent achievements
Infineon was added to the FTSE4Good Index Series in 2001 and has been confirmed as a member since then.
Page 36 2015-06-02 Copyright © Infineon Technologies AG 2015. All rights reserved.

Infineon‘s Revenue Development Outperformed Total Semiconductor Market
* Based on Infineon’s portfolio (excl. Other Operating Segments and Corporate & Eliminations) per end of 2014 fiscal year.
** Based on market development assumptions FY99’s revenue figures for some smaller product categories have been derived from the FY00’s revenue figures.
*** Scale indexed to the Infineon FY99 revenue.
Source: Infineon; WSTS (World Semiconductor Trade Statistics), November 2014.
CAGR(99-14): ~9%
CAGR(99-14): +4.4%
[EUR m]
1,2
00**
1,6
81
2,0
45
1,8
21
1,9
95
2,2
89
2,3
66
2,7
01
2,9
06
2,9
16
2,1
28
3,1
03
3,7
80
3,7
74
3,8
15
4,3
03
0
1500
3000
4500
1999 2002 2004 2006 2008 2010 2012 2014
Revenue Infineon* [lhs]
Semiconductor World Market (adjusted for the Infineon fiscal year ending Sep 30)
126,8
95***
241,5
61
Page 37 2015-06-02 Copyright © Infineon Technologies AG 2015. All rights reserved.
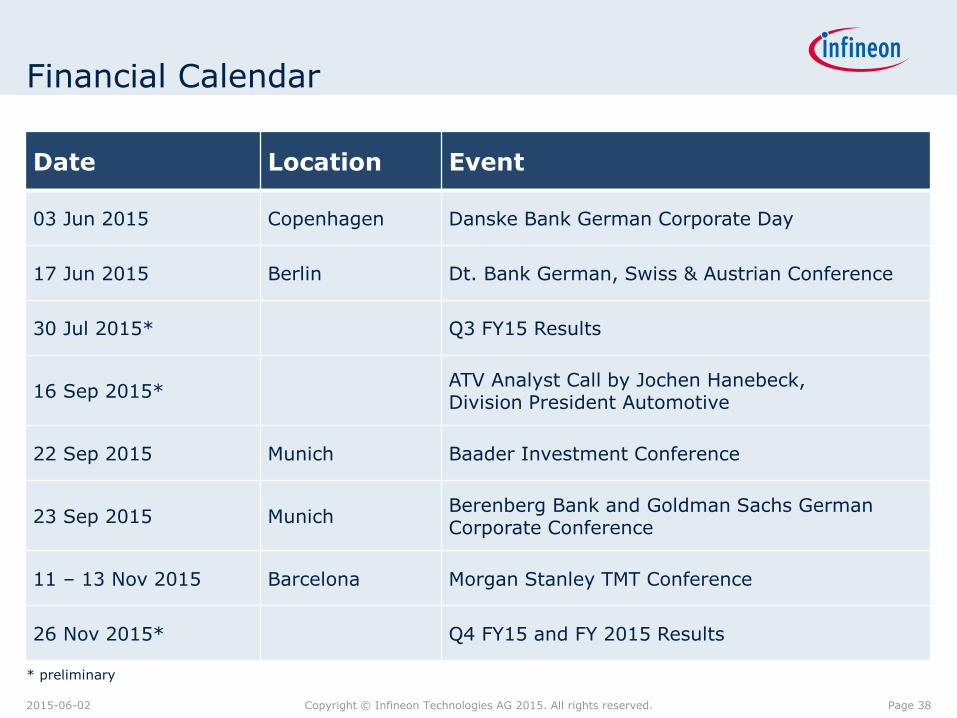
Financial Calendar
Date Location Event
03 Jun 2015 Copenhagen Danske Bank German Corporate Day
17 Jun 2015 Berlin Dt. Bank German, Swiss & Austrian Conference
30 Jul 2015* Q3 FY15 Results
16 Sep 2015* ATV Analyst Call by Jochen Hanebeck, Division President Automotive
22 Sep 2015 Munich Baader Investment Conference
23 Sep 2015 Munich Berenberg Bank and Goldman Sachs German Corporate Conference
11 – 13 Nov 2015 Barcelona Morgan Stanley TMT Conference
26 Nov 2015* Q4 FY15 and FY 2015 Results
* preliminary
Page 38 2015-06-02 Copyright © Infineon Technologies AG 2015. All rights reserved.
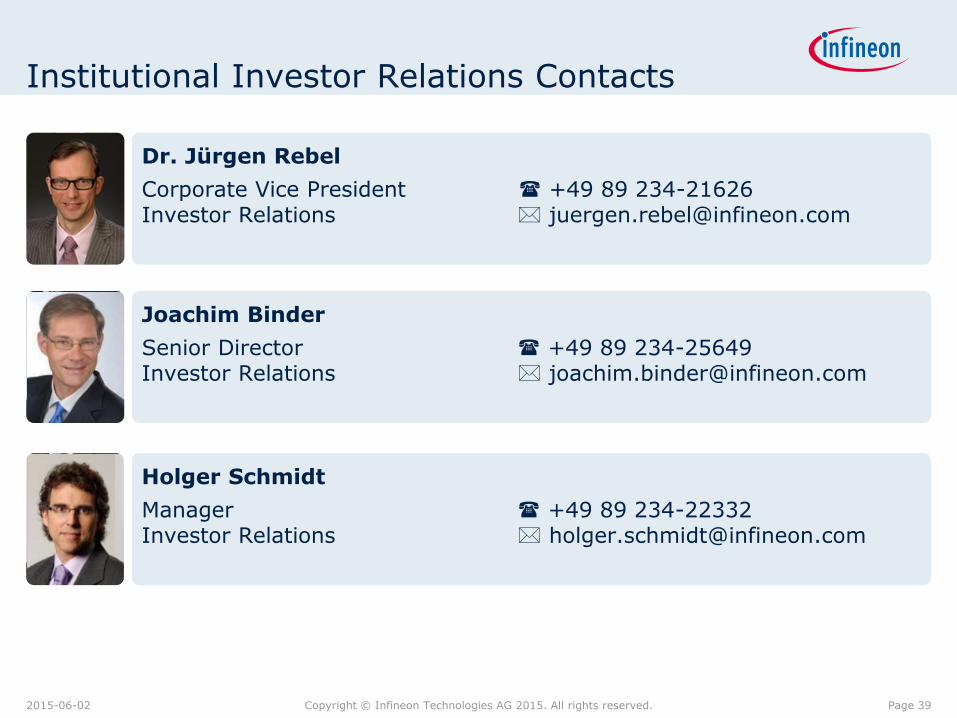
Institutional Investor Relations Contacts
Dr. Jürgen Rebel
Corporate Vice President +49 89 234-21626 Investor Relations [email protected]
Joachim Binder
Senior Director +49 89 234-25649 Investor Relations [email protected]
Holger Schmidt
Manager +49 89 234-22332 Investor Relations [email protected]
Page 39 2015-06-02 Copyright © Infineon Technologies AG 2015. All rights reserved.


