Dynamics, Chaos, and Prediction. Aristotle, 384 – 322 BC.
41
Dynamics, Chaos, and Prediction
-
date post
19-Dec-2015 -
Category
Documents
-
view
230 -
download
5
Transcript of Dynamics, Chaos, and Prediction. Aristotle, 384 – 322 BC.
Dynamics, Chaos, and Prediction

Aristotle, 384 – 322 BC

Nicolaus Copernicus, 1473 – 1543

Galileo Galilei, 1564 – 1642

Johannes Kepler, 1571 – 1630

Isaac Newton, 1643 – 1727

Pierre- Simon Laplace, 1749 – 1827

Henri Poincaré, 1854 – 1912

Werner Heisenberg, 1901 – 1976

• Dynamical Systems Theory: – The general study of how systems change over time
• Calculus• Differential equations• Discrete maps• Algebraic topology
• Vocabulary of change• The dynamics of a system: the manner in which
the system changes
• Dynamical systems theory gives us a vocabulary and set of tools for describing dynamics
• Chaos:– One particular type of dynamics of a system– Defined as “sensitive dependence on initial
conditions”– Poincaré: Many-body problem in the solar system
Henri Poincaré1854 – 1912
Isaac Newton1643 – 1727

“You've never heard of Chaos theory? Non-linear equations? Strange attractors?”
Dr. Ian Malcolm

“You've never heard of Chaos theory? Non-linear equations? Strange attractors?”
Dr. Ian Malcolm

• Dripping faucets
• Electrical circuits
• Solar system orbits
• Weather and climate (the “butterfly effect”)
• Brain activity (EEG)
• Heart activity (EKG)
• Computer networks
• Population growth and dynamics
• Financial data
Chaos in Nature

What is the difference between chaos and randomness?

What is the difference between chaos and randomness?
Notion of “deterministic chaos”

A simple example of deterministic chaos:
Exponential versus logistic models for population growth
€
nt +1 = 2nt
Exponential model: Each year each pair of parents mates, creates four offspring, and then parents die.

Linear Behavior
€
nt +1 = 2nt

Linear Behavior: The whole is the sum of the parts

Linear: No interaction among the offspring, except pair-wise mating.
Linear Behavior: The whole is the sum of the parts

Linear: No interaction among the offspring, except pair-wise mating. More realistic: Introduce limits to population growth.
Linear Behavior: The whole is the sum of the parts

Logistic model
• Notions of:– birth rate
– death rate
– maximum carrying capacity k (upper limit of the population that the habitat will support,
due to limited resources)

Logistic model• Notions of:
– birth rate
– death rate
– maximum carrying capacity k (upper limit of the population that the habitat will support due to
limited resources)€
nt +1 = birthrate × nt − deathrate× nt
= (b − d)nt
€
nt +1 = (b − d)nt
k − nt
k
⎛
⎝ ⎜
⎞
⎠ ⎟
= (b − d)knt − nt
2
k
⎛
⎝ ⎜
⎞
⎠ ⎟
interactions between offspring make this model nonlinear

€
nt +1 = (birthrate − deathrate)[knt − nt2]/k
Nonlinear Behavior

Nonlinear behavior of logistic model
birth rate 2, death rate 0.4, k=32 (keep the same on the two islands)

Nonlinear behavior of logistic model
birth rate 2, death rate 0.4, k=32 (keep the same on the two islands)
Nonlinear: The whole is different than the sum of the parts

aaa
€
x t +1 = R x t (1− x t )
Logistic map
Lord Robert May b. 1936
€
nt +1 = (birthrate − deathrate)[knt − nt2]/k
Let x t = nt /k
Let R = birthrate − deathrate
Then x t +1 = Rx t (1− x t )
Mitchell Feigenbaumb. 1944

LogisticMap.nlogo
1. R = 2
2. R = 2.5
3. R = 2.8
4. R = 3.1
5. R = 3.49
6. R = 3.56
7. R = 4, look at sensitive dependence on initial conditions
Notion of period doubling
Notion of “attractors”

Bifurcation Diagram

R1 ≈ 3.0: period 2
R2 ≈ 3.44949 period 4
R3 ≈ 3.54409 period 8
R4 ≈ 3.564407 period 16
R5 ≈ 3.568759 period 32
R∞ ≈ 3.569946 period ∞ (chaos)
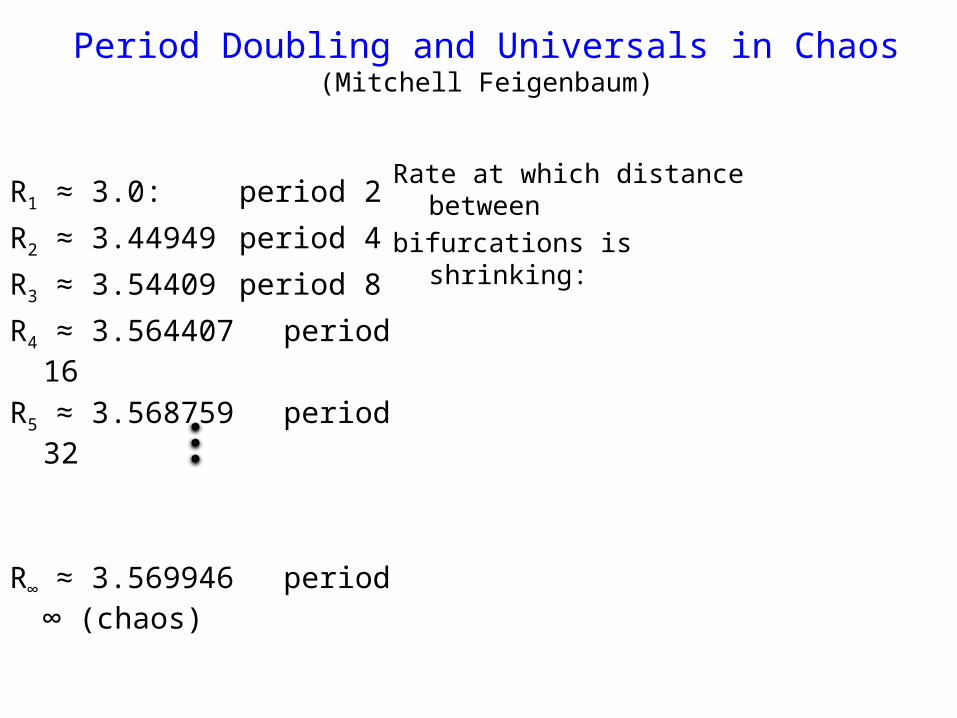
Period Doubling and Universals in Chaos(Mitchell Feigenbaum)

Period Doubling and Universals in Chaos(Mitchell Feigenbaum)
R1 ≈ 3.0: period 2
R2 ≈ 3.44949 period 4
R3 ≈ 3.54409 period 8
R4 ≈ 3.564407 period 16
R5 ≈ 3.568759 period 32
R∞ ≈ 3.569946 period ∞ (chaos)
A similar “period doubling route” to chaos is seen in any “one-humped (unimodal) map.
Period Doubling and Universals in Chaos(Mitchell Feigenbaum)
R1 ≈ 3.0: period 2
R2 ≈ 3.44949 period 4
R3 ≈ 3.54409 period 8
R4 ≈ 3.564407 period 16
R5 ≈ 3.568759 period 32
R∞ ≈ 3.569946 period ∞ (chaos)
Rate at which distance betweenbifurcations is shrinking:

Period Doubling and Universals in Chaos(Mitchell Feigenbaum)
R1 ≈ 3.0: period 2
R2 ≈ 3.44949 period 4
R3 ≈ 3.54409 period 8
R4 ≈ 3.564407 period 16
R5 ≈ 3.568759 period 32
R∞ ≈ 3.569946 period ∞ (chaos)
Rate at which distance betweenbifurcations is shrinking:
€
R2 − R1
R3 − R2
=3.44949 − 3.0
3.54409 − 3.44949= 4.75147992
R3 − R2
R4 − R3
=3.54409 − 3.44949
3.564407 − 3.54409= 4.65619924
R4 − R3
R5 − R4
=3.564407 − 3.54409
3.568759 − 3.564407= 4.66842831
M
limn → ∞
Rn +1 − Rn
Rn +2 − Rn +1
⎛
⎝ ⎜
⎞
⎠ ⎟≈ 4.6692016

Period Doubling and Universals in Chaos(Mitchell Feigenbaum)
R1 ≈ 3.0: period 2
R2 ≈ 3.44949 period 4
R3 ≈ 3.54409 period 8
R4 ≈ 3.564407 period 16
R5 ≈ 3.568759 period 32
R∞ ≈ 3.569946 period ∞ (chaos)
Rate at which distance betweenbifurcations is shrinking:
€
R2 − R1
R3 − R2
=3.44949 − 3.0
3.54409 − 3.44949= 4.75147992
R3 − R2
R4 − R3
=3.54409 − 3.44949
3.564407 − 3.54409= 4.65619924
R4 − R3
R5 − R4
=3.564407 − 3.54409
3.568759 − 3.564407= 4.66842831
M
limRn +1 − Rn
Rn +2 − Rn +1
⎛
⎝ ⎜
⎞
⎠ ⎟≈ 4.6692016
In other words, each new bifurcation appears about 4.6692016 times faster than the previous one.
This same rate of 4.6692016 occurs in any unimodalmap.

Significance of dynamics and chaos for complex systems

Significance of dynamics and chaos for complex systems
• Apparent random behavior from deterministic rules

Significance of dynamics and chaos for complex systems
• Apparent random behavior from deterministic rules
• Complexity from simple rules

Significance of dynamics and chaos for complex systems
• Apparent random behavior from deterministic rules
• Complexity from simple rules
• Vocabulary of complex behavior

Significance of dynamics and chaos for complex systems
• Apparent random behavior from deterministic rules
• Complexity from simple rules
• Vocabulary of complex behavior
• Limits to detailed prediction

Significance of dynamics and chaos for complex systems
• Apparent random behavior from deterministic rules
• Complexity from simple rules
• Vocabulary of complex behavior
• Limits to detailed prediction
• Universality