Dynamic resource allocation and network optimization in ...
120
HAL Id: tel-01898509 https://tel.archives-ouvertes.fr/tel-01898509 Submitted on 18 Oct 2018 HAL is a multi-disciplinary open access archive for the deposit and dissemination of sci- entific research documents, whether they are pub- lished or not. The documents may come from teaching and research institutions in France or abroad, or from public or private research centers. L’archive ouverte pluridisciplinaire HAL, est destinée au dépôt et à la diffusion de documents scientifiques de niveau recherche, publiés ou non, émanant des établissements d’enseignement et de recherche français ou étrangers, des laboratoires publics ou privés. Dynamic resource allocation and network optimization in the Cloud Radio Access Network Mohammed Yazid Lyazidi To cite this version: Mohammed Yazid Lyazidi. Dynamic resource allocation and network optimization in the Cloud Radio Access Network. Networking and Internet Architecture [cs.NI]. Université Pierre et Marie Curie - Paris VI, 2017. English. NNT : 2017PA066549. tel-01898509
Transcript of Dynamic resource allocation and network optimization in ...

HAL Id: tel-01898509https://tel.archives-ouvertes.fr/tel-01898509
Submitted on 18 Oct 2018
HAL is a multi-disciplinary open accessarchive for the deposit and dissemination of sci-entific research documents, whether they are pub-lished or not. The documents may come fromteaching and research institutions in France orabroad, or from public or private research centers.
L’archive ouverte pluridisciplinaire HAL, estdestinée au dépôt et à la diffusion de documentsscientifiques de niveau recherche, publiés ou non,émanant des établissements d’enseignement et derecherche français ou étrangers, des laboratoirespublics ou privés.
Dynamic resource allocation and network optimizationin the Cloud Radio Access Network
Mohammed Yazid Lyazidi
To cite this version:Mohammed Yazid Lyazidi. Dynamic resource allocation and network optimization in the Cloud RadioAccess Network. Networking and Internet Architecture [cs.NI]. Université Pierre et Marie Curie - ParisVI, 2017. English. NNT : 2017PA066549. tel-01898509

Doctor of PhilosophyUPMC Sorbonne Universites
Specialization
COMPUTER SCIENCE(Ecole Doctorale Informatique, Telecommunication et Electronique “EDITE de Paris”)
presented by
Mr. Mohammed Yazid Lyazidi
Submitted for the degree of
Doctor of Philosophy of UPMC Sorbonne Universites
Title:
Dynamic Resource Allocation and Network Optimization in the CloudRadio Access Network
Defense: 27th November 2017
Committee:
Mr Andre-luc Beylot Reviewer Professor, IRIT/ENSEEIHT – Toulouse - FranceMr Yacine Ghamri Doudane Reviewer Professor, University of La Rochelle – La Rochelle - France
Ms Ilhem Fajjari Examiner Research engineer, Orange Labs – Chatillon - FranceMs Anne Fladenmuller Examiner Associate Professor, University Pierre et Marie Curie – Paris - FranceMr Josep Mangues-Bafalluy Examiner Senior Researcher, CTTC– Barcelona - SpainMr Nadjib Ait Saadi Advisor Professor, ESIEE Paris – Noisy-le-Grand - FranceMr Rami Langar Supervisor Professor, University of Paris Est – Marne-la-Vallee - France


Acknowledgements
First and foremost I would like to express my sincere gratitude to my supervisor Pr. Rami Langarwho has given me the opportunity to do my thesis and to be involved in the FUI project ELASTICwhere I have learnt a lot.
A special thanks goes out to my advisor, Pr. Nadjib Ait Saadi, for his continuous support ofmy Ph.D study and related research, for his patience, motivation, and immense knowledge. Hisexcellent guidance helped me in all the time of research and writing of this thesis. I could not haveimagined having better advisor and mentor for my Ph.D study.
I would also like to thank all the jury members for reading my thesis, for offering their valuabletime and for their constructive feedbacks.
I am grateful to Dr. Josep Mangues and Dr. Lorenza Giupponi, who provided me an opportunityto join their team in CTTC as a visiting Ph.D student, and who gave me access to the laboratoryand research facilities. Without their precious support it would not have been possible to conductthis research.
My sincere thanks also goes to Pr. Paul Rubin from Michigan State University, for his collabo-ration, expertise and precious advices that helped me to learn more about the optimization researchfield.
I must acknowledge as well my friends and colleagues in the PHARE team who have been sosupportive and helpful along the way of doing my thesis and for all the great times that we haveshared in these three years.
And last but not least, I would like to thank my amazing family for their love, support, andconstant encouragement I have gotten over the years. In particular, I am highly indebted to mywonderful mother, my sister and my brother. Without their faith in me, this thesis would never havebeen achieved.
3

4

Abstract
Cloud Radio Access Network (C-RAN) is a future direction in wireless communications for deploy-ing cellular radio access subsystems in current 4G and next-generation 5G networks. In the C-RANarchitecture, BaseBand Units (BBUs) are located in a pool of virtual base stations, which are con-nected via a high-bandwidth low latency fronthaul network to Radio Remote Heads (RRHs). Incomparison to standalone clusters of distributed radio base stations, C-RAN architecture providessignificant benefits in terms of centralized resource pooling, network flexibility and cost savings.In this thesis, we address the problem of dynamic resource allocation and power minimization indownlink communications for C-RAN. Our research aims to allocate baseband resources to dy-namic flows of mobile users, while properly assigning RRHs to BBUs to accommodate the trafficand network demands. This is a non-linear NP-hard optimization problem, which encompassesmany constraints such as mobile users’ resources demands, interference management, BBU poolcapacity, transmission power limitations and fronthaul links capacity. To overcome the high com-plexity involved in this problem, we will present several approaches for resource allocation strate-gies and will tackle this issue in three stages. In the first stage, a meta-heuristic algorithm usingthe simulated annealing will be considered in providing sub-optimal solutions to the resource al-location problem in C-RAN with an unconstrained fronthaul capacity. The goal is to provide nearoptimal online solutions at a much reduced complexity and in minimum time compared to offlineoptimization schemes. In the second stage, we will integrate different mobile users profiles andquality-of-service requirements, while considering a capacity-limited fronthaul network betweenBBUs and RRHs. A joint resource allocation and admission control approach is thus presentedto handle this issue based on a two-stage algorithm and greedy fronthaul link selection scheme.Finally, in the third stage, we will consider a BBU-RRH assignment problem, while consideringjointly several important objectives such as resiliency, operational costs, processing power and con-straints on BBU processing and cost budgets. An algorithm based on the branch-and-price frame-work will be described to compute the optimal solution in minimum time period. Besides, ouranalysis will evaluate several policies and provide general guidelines that can be used by operatorsto decide the best optimization strategy according to their needs for their C-RAN infrastructure.Obtained results prove the efficiency of our proposed strategies in terms of throughput satisfactionrate, number of active RRHs, BBU pool processing power, resiliency, and virtualization cost.
Key Words
C-RAN, resource allocation, power minimization, admission control, quality-of-service, BBU-RRH assignment, BBU virtualization, optimization.
5

6

Table of contents
1 Introduction 111.1 C-RAN motivations . . . . . . . . . . . . . . . . . . . . . . . . . . . . . . . . . . 131.2 C-RAN architecture . . . . . . . . . . . . . . . . . . . . . . . . . . . . . . . . . . 151.3 C-RAN challenges . . . . . . . . . . . . . . . . . . . . . . . . . . . . . . . . . . 17
1.3.1 Fronthaul limitations . . . . . . . . . . . . . . . . . . . . . . . . . . . . . 171.3.2 Complexity management . . . . . . . . . . . . . . . . . . . . . . . . . . . 191.3.3 Resource management . . . . . . . . . . . . . . . . . . . . . . . . . . . . 201.3.4 BBU virtualization . . . . . . . . . . . . . . . . . . . . . . . . . . . . . . 21
1.4 Problem statement . . . . . . . . . . . . . . . . . . . . . . . . . . . . . . . . . . 211.5 Thesis contribution . . . . . . . . . . . . . . . . . . . . . . . . . . . . . . . . . . 22
1.5.1 A survey of C-RAN resource allocation and BBU-RRH assignment strategies 231.5.2 Proposed algorithms for dynamic resource allocation in LTE downlink for
C-RAN . . . . . . . . . . . . . . . . . . . . . . . . . . . . . . . . . . . . 231.5.3 Proposed algorithms for QoS-based admission control in C-RAN with func-
tional split . . . . . . . . . . . . . . . . . . . . . . . . . . . . . . . . . . 241.5.4 Proposed algorithms for cost-resilience BBU selection in C-RAN . . . . . 24
1.6 Thesis outline . . . . . . . . . . . . . . . . . . . . . . . . . . . . . . . . . . . . . 25
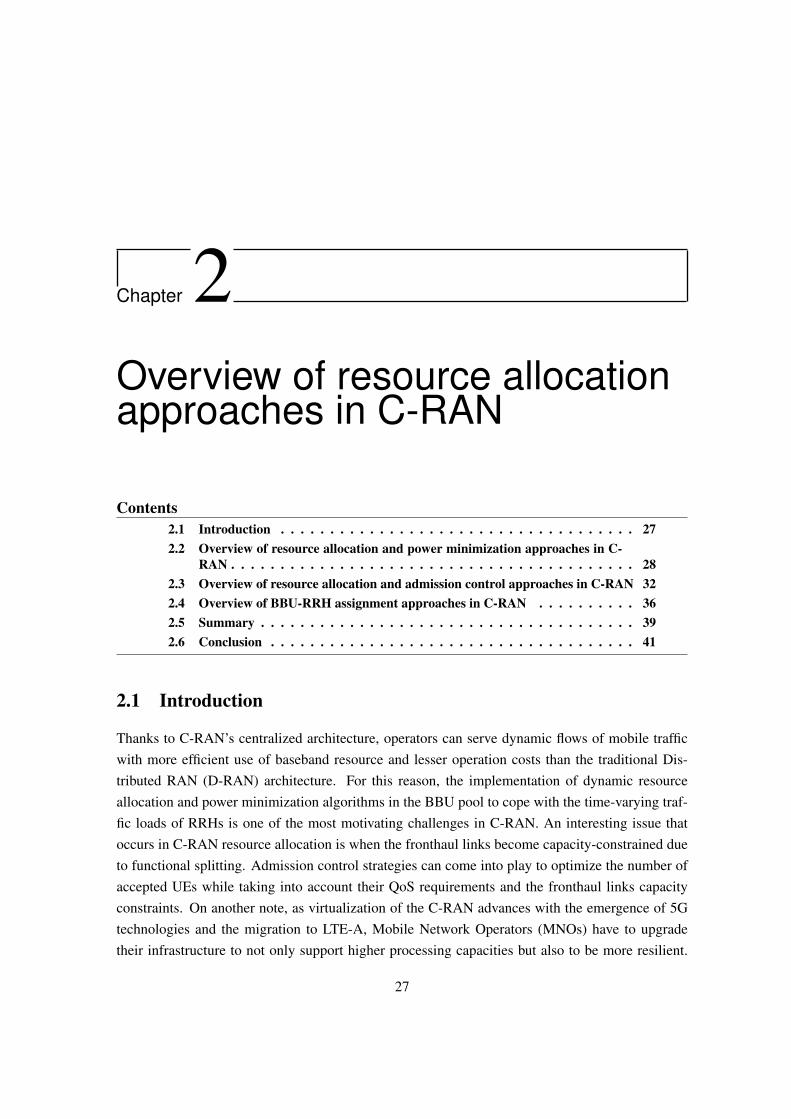
2 Overview of resource allocation approaches in C-RAN 272.1 Introduction . . . . . . . . . . . . . . . . . . . . . . . . . . . . . . . . . . . . . . 272.2 Overview of resource allocation and power minimization approaches in C-RAN . . 282.3 Overview of resource allocation and admission control approaches in C-RAN . . . 322.4 Overview of BBU-RRH assignment approaches in C-RAN . . . . . . . . . . . . . 362.5 Summary . . . . . . . . . . . . . . . . . . . . . . . . . . . . . . . . . . . . . . . 392.6 Conclusion . . . . . . . . . . . . . . . . . . . . . . . . . . . . . . . . . . . . . . 41
3 Dynamic resource allocation and power minimization in LTE DL for C-RAN 433.1 Introduction . . . . . . . . . . . . . . . . . . . . . . . . . . . . . . . . . . . . . . 433.2 System model . . . . . . . . . . . . . . . . . . . . . . . . . . . . . . . . . . . . . 44
3.2.1 Centralized resource allocation and power minimization problem formulation 443.2.2 Multiple knapsack problem formulation for BBU-RRH assignment . . . . 47
7

8 TABLE OF CONTENTS
3.3 Proposal: DRAC-SA Algorithm . . . . . . . . . . . . . . . . . . . . . . . . . . . 483.3.1 Algorithm overview . . . . . . . . . . . . . . . . . . . . . . . . . . . . . 48
3.3.1.1 Initial solution . . . . . . . . . . . . . . . . . . . . . . . . . . . 483.3.1.2 Neighborhood search structure . . . . . . . . . . . . . . . . . . 493.3.1.3 Equilibrium state . . . . . . . . . . . . . . . . . . . . . . . . . 493.3.1.4 Stopping condition . . . . . . . . . . . . . . . . . . . . . . . . . 50
3.3.2 MKP resolution . . . . . . . . . . . . . . . . . . . . . . . . . . . . . . . . 513.4 Performance evaluation . . . . . . . . . . . . . . . . . . . . . . . . . . . . . . . . 51
3.4.1 Simulation environment . . . . . . . . . . . . . . . . . . . . . . . . . . . 523.4.2 Performance metrics . . . . . . . . . . . . . . . . . . . . . . . . . . . . . 523.4.3 Simulation results . . . . . . . . . . . . . . . . . . . . . . . . . . . . . . 53
3.5 Conclusion . . . . . . . . . . . . . . . . . . . . . . . . . . . . . . . . . . . . . . 60
4 QoS-based resource allocation and admission control in C-RAN 634.1 Introduction . . . . . . . . . . . . . . . . . . . . . . . . . . . . . . . . . . . . . . 634.2 System Model . . . . . . . . . . . . . . . . . . . . . . . . . . . . . . . . . . . . . 64
4.2.1 Problem formulation . . . . . . . . . . . . . . . . . . . . . . . . . . . . . 644.2.2 MILP formulation . . . . . . . . . . . . . . . . . . . . . . . . . . . . . . 67
4.3 RAAC Proposal . . . . . . . . . . . . . . . . . . . . . . . . . . . . . . . . . . . . 674.3.1 RAAC algorithm . . . . . . . . . . . . . . . . . . . . . . . . . . . . . . . 674.3.2 Fast greedy heuristic for fronthaul admission control . . . . . . . . . . . . 70
4.4 Performance evaluation . . . . . . . . . . . . . . . . . . . . . . . . . . . . . . . . 714.4.1 Simulation environment . . . . . . . . . . . . . . . . . . . . . . . . . . . 714.4.2 Performance metrics . . . . . . . . . . . . . . . . . . . . . . . . . . . . . 724.4.3 Simulation results . . . . . . . . . . . . . . . . . . . . . . . . . . . . . . 73
4.5 Conclusion . . . . . . . . . . . . . . . . . . . . . . . . . . . . . . . . . . . . . . 81
5 An optimization scheme for cost-resilience BBU selection in C-RAN 835.1 Introduction . . . . . . . . . . . . . . . . . . . . . . . . . . . . . . . . . . . . . . 835.2 System model and problem formulation . . . . . . . . . . . . . . . . . . . . . . . 845.3 Proposed B&P algorithm for solving the CRBS problem . . . . . . . . . . . . . . 865.4 Performance Evaluation . . . . . . . . . . . . . . . . . . . . . . . . . . . . . . . . 89
5.4.1 Simulation environment . . . . . . . . . . . . . . . . . . . . . . . . . . . 905.4.2 Performance metrics . . . . . . . . . . . . . . . . . . . . . . . . . . . . . 925.4.3 Simulation results . . . . . . . . . . . . . . . . . . . . . . . . . . . . . . 93
5.5 Conclusion . . . . . . . . . . . . . . . . . . . . . . . . . . . . . . . . . . . . . . 99
6 Conclusions 1016.1 Summary of contributions . . . . . . . . . . . . . . . . . . . . . . . . . . . . . . 1016.2 Future work . . . . . . . . . . . . . . . . . . . . . . . . . . . . . . . . . . . . . . 103
6.2.1 Short-term perspectives . . . . . . . . . . . . . . . . . . . . . . . . . . . . 1036.2.2 Medium-term perspectives . . . . . . . . . . . . . . . . . . . . . . . . . . 1036.2.3 Long-term perspectives . . . . . . . . . . . . . . . . . . . . . . . . . . . . 104
6.3 Publications . . . . . . . . . . . . . . . . . . . . . . . . . . . . . . . . . . . . . . 104

TABLE OF CONTENTS 9
List of figures 107
List of tables 108
References 109


Chapter 1Introduction
Contents1.1 C-RAN motivations . . . . . . . . . . . . . . . . . . . . . . . . . . . . . . . . 131.2 C-RAN architecture . . . . . . . . . . . . . . . . . . . . . . . . . . . . . . . . 151.3 C-RAN challenges . . . . . . . . . . . . . . . . . . . . . . . . . . . . . . . . . 17
1.3.1 Fronthaul limitations . . . . . . . . . . . . . . . . . . . . . . . . . . . . 171.3.2 Complexity management . . . . . . . . . . . . . . . . . . . . . . . . . . 191.3.3 Resource management . . . . . . . . . . . . . . . . . . . . . . . . . . . 201.3.4 BBU virtualization . . . . . . . . . . . . . . . . . . . . . . . . . . . . . 21
1.4 Problem statement . . . . . . . . . . . . . . . . . . . . . . . . . . . . . . . . . 211.5 Thesis contribution . . . . . . . . . . . . . . . . . . . . . . . . . . . . . . . . 22
1.5.1 A survey of C-RAN resource allocation and BBU-RRH assignment strate-gies . . . . . . . . . . . . . . . . . . . . . . . . . . . . . . . . . . . . . 23
1.5.2 Proposed algorithms for dynamic resource allocation in LTE downlinkfor C-RAN . . . . . . . . . . . . . . . . . . . . . . . . . . . . . . . . . 23
1.5.3 Proposed algorithms for QoS-based admission control in C-RAN withfunctional split . . . . . . . . . . . . . . . . . . . . . . . . . . . . . . . 24
1.5.4 Proposed algorithms for cost-resilience BBU selection in C-RAN . . . . 241.6 Thesis outline . . . . . . . . . . . . . . . . . . . . . . . . . . . . . . . . . . . . 25
Mobile Network Operators (MNOs) are facing important growths in mobile data traffic on theirnetworks due to the ever-increasing popularity of smartphones, tablets and new connected smartdevices, which support a wide spectrum of resource-greedy applications and services. Recent re-ports [1] show that almost half a billion (429 million) mobile devices and connections were addedin 2016. In fact, global mobile devices grew to 8.0 billion in 2016, up from 7.6 billion in 2015.Smartphones were accounted for a large part of that growth, which will carry on its volume’s in-crease into the coming years due to the emergence of several new communication services including
11

12
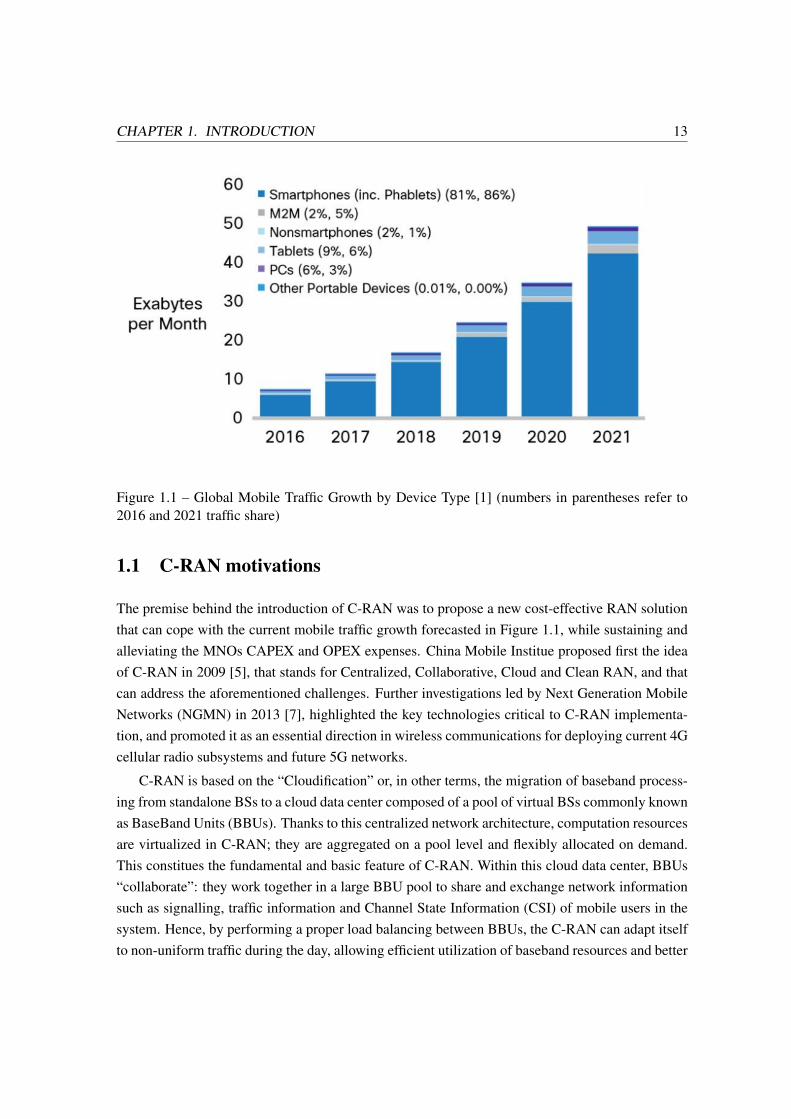
Machine-to-Machine (M2M), Device-to-Device (D2D) communications and the Internet of Things(IoT). Future previsions have already been established where the number of mobile devices con-nected to a network, including M2M terminals, is expected to grow to 11.6 billions by 2021 andwill exceed the world’s population at that time (7.8 billion) [1] [2]. Besides, global mobile datatraffic will reach 49.0 exabytes per month by 2021, realizing a compound annual growth rate of47% in just five years.
On the other hand, MNOs are facing important issues with their current cellular systems tohandle this traffic growth. In fact, macro cells are near their physical limitations and cause MNOsdifficult and expensive plans for maintaining and upgrading them. Whereas small cells pose severalchallenges regarding strategy deployment, interference management and operating complexity, re-sulting in Capital (CAPEX) and Operating Expenditure (OPEX) costs inflation [3]. What is more,with the arrival of new fifth generation (5G) technology in multi-network environment, system de-signs and upgrading will become far more challenging and complex [4]. All of these issues areputting high pressures on MNOs to conceive and adopt a new cost-effective Radio Access Network(RAN).
Cloud-Radio Access Network, commonly known as Cloud-RAN or C-RAN, has been intro-duced by [5] as a new cloud architecture that can address the challenges MNOs are faced with andmeet their requirements in terms of CAPEX and OPEX costs reduction. In the C-RAN philosophy,baseband processing is shifted away from the physical location of Base Station (BS) into a “virtualBS pool”. This approach is adopted from the cloud computing concept [6], where resources areshared in a centralized data-center and allocated on demand. In the C-RAN application, basebandresources can be employed more efficiently based on the whole network’s overall load instead ofthe maximum loads of individual BSs. Furthermore, this concept allows the processing power inthe BS pool to be adapted to the network’s instantaneous load.
In this thesis, we will exploit the flexibility of centralized C-RAN architecture regarding ef-ficient baseband resource pooling and power scalability to propose dynamic resource allocationalgorithms with the aim of minimizing the transmission and processing C-RAN power, and satis-fying the Quality-of-Service (QoS) required by end-users with different profiles.
In what follows, we first introduce the C-RAN concept and the motivations behind its intro-duction. Secondly, we will describe its architecture compared to the conventional BS one. Thirdly,we will outline the different challenges C-RAN is currently facing and that hinder its commer-cial deployment. Afterwards, we will present the problematics of our thesis in Section 1.4. Then,we summarize our different contributions in Section 1.5, followed by a presentation of the thesis’organization in Section 1.6.
CHAPTER 1. INTRODUCTION 13
Figure 1.1 – Global Mobile Traffic Growth by Device Type [1] (numbers in parentheses refer to2016 and 2021 traffic share)
1.1 C-RAN motivations
The premise behind the introduction of C-RAN was to propose a new cost-effective RAN solutionthat can cope with the current mobile traffic growth forecasted in Figure 1.1, while sustaining andalleviating the MNOs CAPEX and OPEX expenses. China Mobile Institue proposed first the ideaof C-RAN in 2009 [5], that stands for Centralized, Collaborative, Cloud and Clean RAN, and thatcan address the aforementioned challenges. Further investigations led by Next Generation MobileNetworks (NGMN) in 2013 [7], highlighted the key technologies critical to C-RAN implementa-tion, and promoted it as an essential direction in wireless communications for deploying current 4Gcellular radio subsystems and future 5G networks.
C-RAN is based on the “Cloudification” or, in other terms, the migration of baseband process-ing from standalone BSs to a cloud data center composed of a pool of virtual BSs commonly knownas BaseBand Units (BBUs). Thanks to this centralized network architecture, computation resourcesare virtualized in C-RAN; they are aggregated on a pool level and flexibly allocated on demand.This constitues the fundamental and basic feature of C-RAN. Within this cloud data center, BBUs“collaborate”: they work together in a large BBU pool to share and exchange network informationsuch as signalling, traffic information and Channel State Information (CSI) of mobile users in thesystem. Hence, by performing a proper load balancing between BBUs, the C-RAN can adapt itselfto non-uniform traffic during the day, allowing efficient utilization of baseband resources and better

14 1.1. C-RAN MOTIVATIONS
Figure 1.2 – MNOs motivations for C-RAN. Source: Monica Paolini, Senza Fili Consulting [9]
interference management across multiple cells [8].
By replacing “hard” wireless network equipments by “soft” BBUs, the C-RAN capabilities canbe dynamically adjusted based on the traffic load. This not only fosters efficient resource utiliza-tion, but also allows the C-RAN to handle more areas than standalone clusters of BSs and facilitatesservice deployment on the edge. In fact, exploiting C-RAN advantages of reconfigurability and ex-tensibility permits to move services or to directly deploy new ones on the RAN side with minimumreconfiguration and relieve the backhaul pressure. On another note, C-RAN appears as a successfulway of speeding up the network construction by lowering down difficulties of site selection andcivil work, since most equipments will be gathered in a central room. Site visits for maintenanceand upgrades will also be reduced since most monitoring tasks can be done by software, which willcontribute in more OPEX savings. What is striking, the CAPEX/OPEX cost savings brought by C-RAN constitutes the most alluring feature (Figure 1.2) that motivates MNOs for adopting C-RANin their infrastructures [9].
C-RAN is not only applicable for existing wireless infrastructures but is also one of the key so-lutions for enabling future 5G systems [10]. In fact, thanks to its centralization, flexibility andcloud-based implementation, C-RAN can help MNOs foster their networks migration to LTE-Advanced Pro and meet the advent of 5G by enabling several 5G technologies such as: LargeScale Antenna Systems (LSAS), ultra-dense Multiple-Input Multiple-Output (MIMO) networks,full-duplex systems, and so on [11]. Additionally, C-RAN can help improve the resiliency of thewireless networks, paving the way towards ultra-reliable communications systems.
To discuss the different use cases for C-RAN implementation and deployment solutions, anumber of C-RAN projects have been recently launched by NGMN and European Commission’sSeventh Framework Programme (EU 7 FP). In 2012 started the “Interworking and JOINt Designof an Open Access and Backhaul Network Architecture for Small Cells based on Cloud Networks
CHAPTER 1. INTRODUCTION 15
(IJOIN) project [12] that introduces the novel concept of RAN as a Service (RANaaS), whereRAN can be flexibly instantiated on demand from a centralized open IT platform based on a cloudinfrastructure. In 2013, the “Mobile Cloud Networking” (MCN) project [13] was launched to assessthe opportunities cloud computing can bring to mobile networks. In 2014, the “High capacitynetwork Architecture with Remote Radio Heads & Parasitic antenna arrays” (HARP) project [14]was initiated for building an RRH-based C-RAN architecture with electronically steerable passiveantenna radiators.
Initially steered by Japanese and South Korean MNOs, many Asian-Pacific operators have al-ready been tempted by the C-RAN benefits and have started planning the deployment of their futurenetworks. In fact, DoCoMO Japan and Korean SK Telecom both have announced early trials of5G C-RAN in 2019 and for the upcoming 2020 Olympic Games [15]. Besdies, C-RAN technologyhas gained momentum worldwide with many operators and vendors, including Verizon Communi-cations, AT&T, Vodafone, Orange, Intel, ZTE, Huawei and Nokia Bell Labs that are discussing thedifferent investments opportunities of C-RAN and helping building its ecosystem.
1.2 C-RAN architecture
Traditionally, MNOs operate using the Distributed-Radio Access Network (D-RAN) architectureillustrated in Figure 1.3, which consists of two components: a BBU and a Remote Radio Head(RRH) collocated at the same macro site (or eNodeB). The interconnection between BBU andRRH is done by fiber optic cable using the Common Protocol Radio Interface (CPRI) [16]. TheBBU is further connected to the Mobile Switching Center (MSC) via Carrier Ethernet backhaulwhere the traffic is processed.
In the C-RAN architecture illustrated in Figure 1.4, BBUs are relocated from individual cellsites to the centralized BBU hotel. The latter can be housed in a Central Office (CO) or a supermacro site, regrouping many BBUs composed of high-performance programmable processors andreal-time virtualization technology that perform baseband functions processing. Removing BBUsfrom cell sites means that operators can remove routers and other hardware too. This comes withreduced costs associated with space, heating, cooling, power and test access. What is more, thecentralized topology simplifies networks management, deployment and scaling.
BBUs connection to RRHs requires a high-bandwidth low latency transport service. Dark fiberand Wavelength Division Multiplexing (WDM) are the most common used fronthaul solutionssupporting CPRI to interconnect the many RRHs at each cell site to the central BBU at the BBUpool [17]. Transport reach, as limited by the strict Long Term Evolution (LTE) timing and latencyrequirements, is around 15 to 20 kilometers of dark fiber for the new centralized configuration [18].This is essentially an extension from less than 60 meters at a typical eNodeB tower.
Since multiple BBUs are colocated in C-RAN, their enhanced X2 (eX2) interface can cost-

16 1.2. C-RAN ARCHITECTURE
Figure 1.3 – Distributed RAN architecture
effectively interconnect resulting in improved performance of resource utilization. In fact, a cloudcontroller, located in the BBU pool, serves as a resource manager and performs load balancingbetween BBUs through eX2 to accommodate the traffic load of different RRHs [19]. Thanks to thiscentralized architecture, operators can deploy more RRHs in remote sites to increase their networkcoverage and allocate more baseband resources to RRHs in order to satisfy the traffic demand. Thisprovides operators better flexibility in network upgrading, performed adaptability to non-uniformtraffic and efficient utilization of baseband resources [20].
Furthermore, the S1 interface also comes from the BBUs to the router, providing aggregationand transport using the Carrier Ethernet backhaul connection to the MSC. A single intermediate orlarge-scale router can thus be used at the BBU pool instead of numerous small ones of individualcell sites as in D-RAN, further lowering equipment costs. Finally, the C-RAN topology positionsthe network for Software-Defined Networking (SDN) et Network Function virtualization (NFV)applications to enable dynamic resource allocation between BBUs. A server can ultimately replace

CHAPTER 1. INTRODUCTION 17
Figure 1.4 – Centralized RAN architecture
the purpose-built hardware and virtualize the BBU functionalities resulting in a virtual BBU. Thismeans greater flexibility, even higher performance and even lower cost.
1.3 C-RAN challenges
C-RAN is designed to not only solve the cost and deployment issues of operators, but also to im-prove the network spectral efficiency via collaborative radio or joint processing techniques. How-ever, while some C-RAN features are relatively easy to realize such as centralization, others requirelong-term planning and development. This section analyzes the major challenges for C-RAN.
1.3.1 Fronthaul limitations
In the C-RAN model, a transmission link with at least 10 Gbps and a maximum latency of 250 µs isnecessary to convey the baseband data from the BBU pool to the cell site, with respect to LTE stricttiming requirement [7]. As mentioned earlier, this also limits the maximum distance between BBUsand RRHs - up to 20 km, according to NGMN’s specifications. Consequently, fiber connectionsfrom the cell sites are required at almost locations. In densified heterogeneous networks, the need of

18 1.3. C-RAN CHALLENGES
(a) 4G, early 5G (b) path to 5G, current CPRI capacity (c) path to 5G, with CPRI expanded
Figure 1.5 – Backhaul and fronthaul requirements vs. cell-site capacity (Source: KDDI, Nokia,Viavi, Small Cell Forum 2016)
fiber-based links increases the CAPEX, especially for operators who do not own the fiber networksand limits the scope of C-RAN deployments.
BBUs can be kilometers away from RRHs, and fronthaul links have to serve multi-cell LTE sitesthat may use Carrier Aggregation (CA) or MIMO. For such complex network, CPRI can enablethe transition to C-RAN topologies in 4G (Figure 1.5 (a)), however it will encounter fundamentallimitations in 5G networks. In fact, as can be seen in Figure 1.5 (b), the fronthaul requirements willgrow with the increase of the cell-site capacity, where next-generation cell sites will have a capacityof 10-20 Gbps and will require over 300 Gbps for CPRI. Currently, CPRI is limited to only 24 Gbpscapacity, which does not make it a viable option for 5G. Expanding the CPRI capacity in the pathto 5G can meet the network’s requirements (Figure 1.5 (c)), however, since it heavily relies on fiberfronthaul links, its deployment will be overly expensive or unavailable.
Instead of relocating all baseband processing in a BBU pool, a functional split on the basebandprocessing chain can be defined to relax the most latency-sensitive functionalities in C-RAN [21][22]. Recently, C-RAN functional splits have been introduced and are under extensive analysis toaddress the challenge of optimizing fronthaul bit rate and flexibility [23]. Figure 1.6 presents differ-ent use-cases of C-RAN functional splits. For instance, the PHY-MAC (also known as User-Cell)split is based on separating user and cell specific functionalities, occasioning the traffic betweenBBUs and RRHs to be traffic dependent. On the other hand, for the PDCP-RLC split, the majorityof data processing will be distributed in the RRHs, and only a small portion will be done in theBBU pool. Such functional splits may help reduce the data bandwidth and latency requirementsbetween the central point and remote sites. However, they may increase the CAPEX and OPEXcosts since more equipment rooms will be needed to improve the system management.

CHAPTER 1. INTRODUCTION 19
Figure 1.6 – BBU and RRH functionalities and possible functional splits
Generally, the choice of which split to activate is a multi-dimensional tradeoff between con-flicting objectives [24], since it depends on the topology, the fronthaul network budget, the servicesMNOs want to support and their performance tradeoffs. Besides, choosing which functions to cen-tralize and which to distribute must give MNOs the opportunity to foster the use of their networkresources.
1.3.2 Complexity management
Collaborative Multipoint (CoMP) [25] and Enhanced Inter-Cell Interference Coordination (EICIC)[26] have been presented as efficient techniques for improving spectral efficiency and interferencemitigation in C-RAN [20]. However, interference mitigation in centralized networks usually comeswith the expense of higher complexity and system overhead due to the large number of RRHs andthe different types of backhaul links associated with each cell type [27]. In fact, a challenge forC-RAN consists of implementing CoMP algorithms in BBUs for handling numerous cells withhigh data rates, while respecting the tight LTE requirement of 1 ms processing inside the BBUpool [12], and 3 ms of BBU-RRH transmission. These strict timing requirements are imposedby 3GPP LTE’s Hybrid Automatic Retransmit reQuest (HARQ) protocol [7] [28]. To better clarifythese timing requirements, we make a comparison between D-RAN and C-RAN processing delays:
• In a D-RAN environment, the eNodeB completes User Equipment (UE) data processing:(Uplink (UL) CPRI processing, frame decoding, ACK/NACK creation, Downlink (DL) framecreation, DL CPRI processing) within 3 ms [18].
• In C-RAN, additional fronthaul delays (like transmission delay via optical fiber, fronthaulequipment processing) are caused while the data is delivered from the RRH to the central

20 1.3. C-RAN CHALLENGES
BBU pool. The sum of all these delays and baseband processing time at the BBU must beless than HARQ’s 3 ms.
In order to maintain the timing requirement constraint, the additional delay caused in the fronthaulnetwork must be compensated somehow, somewhere. Some vendors address the problem by expe-diting the BBU processing to finish the UE data processing and send the ACK/NACK in less than2.75 ms instead of 3 ms, thus allowing an additional delay of 250 µs in the fronthaul links [18].However, this imposes tighter C-RAN BBU time processing requirement than usual D-RAN to pro-cess mobile users data and monitor large-scale cellular networks. What is more, it severely impedesthe implementation of centralized algorithms for multi-cell coordination, which are known for theirhigher complexity and processing time [29]. Besides, recent initiatives [30] [31] [32] have revealedthat CoMP gains cannot be fully harnessed in C-RAN under practical constraints due to signallingand processing delays, signalling overhead, and limited backhaul capacities.
1.3.3 Resource management
Another challenge for C-RAN is the optimization of radio resources allocation for multiple cells. Infact, if the problem of Radio Resource Management (RRM) has already been immensely discussedin D-RAN for proposing diverse optimization schemes involving resource allocation (resourcescheduling [33], power control [34], interference mitigation [35] and admission control [36]) underprecise constraints, the C-RAN has other specific considerations; in particular, due to the fronthaullimitations and the computational complexity for finding solutions. Furthermore, the C-RAN RRMconcerns also hybrid cellular networks (macro BS and small cells), which require resource sharingalgorithms between the different cells’ RRHs to limit the interference and improve the quality ofindoor coverage [37].
Additionally, C-RAN is challenged by the design of resource allocation algorithms with respectto traffic demand, interference management and BBU pool capacity [38]. Such algorithms areneeded not only to improve the spectral efficiency of users served by specific RRHs, but also toallow efficient BBU-RRH mappings. In fact, by properly assigning RRHs to BBUs based on trafficload and BBU capacity, a single BBU can be assigned to manage multiple few-loaded RRHs insteadof one-one mapping. Hence, the BBU pool power consumption can be minimized with fewer BBUsbeing instantiated, and the OPEX costs can also be lessened.
Moreover, to optimize energy savings and meet the power limitations of an eco-friendly C-RAN, some RRHs need to be selected to be dynamically turned on/off based on the traffic evolution.By doing so, the total RRHs transmission power can be minimized as well as the number of activeBBUs by less overhead in the transport network. This is a major issue for RRM algorithms forallocating resources to users while accounting the limits of C-RAN’s power consumption, whichdoes not only springs from the RRHs transmission, but also from the associated fronthaul links andBBUs.

CHAPTER 1. INTRODUCTION 21
1.3.4 BBU virtualization
BBU virtualization technologies will be massively integrated in 5G [10]. Nevertheless, the actualimplementation of virtualization is more difficult, despite its conceptual simplicity. In fact, wirelesscommunication systems are distinct from Information Technology (IT) data centers, in that wirelesscommunications have extremely strict requirements for real-time processing and data transmission.Building a new BBU platform based on a virtualized technology different from IT data centers iscrucial for C-RAN. Some efforts have been done in the direction of building a new virtualized RANecosystem, such as the OpenAirInterface Software Alliance [39], which is an open source imple-mentation of fully real-time stack (eNodeB, UE and core network) on general purpose processors,combined with SDN and NFV tools to bring efficiency in C-RAN design. However, the actualimplementation in OpenAir is not always easy due to a tangled development platform.
Virtualization techniques implementation for group processing between BBUs is also an im-portant challenge as it can enable resource sharing between multiple BBU entities and UE dataexchange. Besides, the interface interconnecting all BBUs should support a reliable, high band-width and low latency switching network for UL and DL CSI exchange. In the same context, wecan cite other challenges for BBU virtualization in C-RAN, that reside in:
• Real-time data processing algorithms implementation,
• Dynamic BBU processing capacity allocation, to face the dynamic loads of cells,
• Group processing between multiple BBUs in central office to share radio resources incomingfrom multiple operators,
• Security issue: co-location of multiple BBUs from different cloud providers requires specialsecurity and resilience mechanisms.
Furthermore, the SDN and NFV technologies are considered as major candidates for C-RAN virtu-alization application and for dynamic allocation of resources between BBUs. A challenge consiststhen, of cost-effectively integrating these technologies in C-RAN.
1.4 Problem statement
In this thesis, we address the problematic of dynamic resource allocation and power minimizationin downlink for C-RAN, considering dynamic BBU-RRH assignment. This is motivated by theexistence of several constraints for designing a centralized resource allocation strategy such as:
• Mobile users traffic demands, profiles and QoS requirements,
• RRHs transmission power limitations,

22 1.5. THESIS CONTRIBUTION
• Interference handling,
• Fronthaul links capacity,
• BBU virtualization,
• Cost optimization.
What is striking, dynamic resource allocation algorithms are needed to cope with significantlyfluctuating and time-varying traffic loads at different RRHs [40]. A joint optimization algorithmcan help cater to the traffic demand of mobile users located in different cells and with differentbandwidth requests. Such approach should also dynamically select the optimal RRHs to be turnedon/off based on the fluctuating traffic, so as to minimize the total C-RAN transmission power.Incidentally, by setting the BBU-RRH connections and allocating resources to RRHs according tousers’ traffic profiles and volumes, the number of instantiated BBUs in the cloud can effectively bereduced, which will lead to more power and OPEX savings.
Furthermore, if we consider functional splits separating user and cell related functions insteadof CPRI, the fronthaul links become constrained in terms of the baseband traffic that can be con-veyed from the cloud to the RRHs. In fact, functional splits reduce the fronthaul links bandwidth tofew hundreds of Mbps instead of CPRI’s 10-20 Gbps. Consequently, the C-RAN capacity becomeslimited to satisfy all users demands and an admission control scheme is crucial to help maximize thenumber of satisfied UEs while taking into account their QoS requirements, interference handlingand fronthaul links capacity constraints.
The more RRHs are assigned to BBUs, the higher is the C-RAN multiplexing gain [20] [38]and the more cost savings are for operators. In this respect, the BBU-RRH assignment problemshould be further investigated while jointly considering several aspects such as BBU pool resiliency,operational costs, BBU processing power, and constraints on cost budget. In fact, the problemof BBU pool resiliency constitutes a major requirement for MNOs in order to guarantee limiteddisruptions in network availability during the day, while respecting the budget and traffic loadhandling requirements. What is more, considering that BBUs are provided from different CloudService Providers (CSPs), each with distinct failure probabilities and processing costs, a carefuldecision for BBUs selection must be made to meet the operators’ network and budget constraints.
1.5 Thesis contribution
In this section, we summarize the significant contributions of this thesis:

CHAPTER 1. INTRODUCTION 23
1.5.1 A survey of C-RAN resource allocation and BBU-RRH assignment strategies
We will provide an in-depth overview of the resource allocation and BBU-RRH assignment schemesfound in literature. The majority of proposed policies in the literature can be categorized into either:i) addressing exclusively the C-RAN power minimization problem with a limit on the total trans-mission power; ii) focusing on the resource allocation and admission control of mobile users withQoS requirements subject to fronthaul links capacity constraint; or iii) proposing solutions to theBBU-RRH mappings problem subject to traffic and BBU pool capacity. A taxonomy of this kind ofstrategies can be based on the main following criteria: i) static or ii) dynamic approaches, and alsobased on the iii) achieved UEs data rates and iv) computational complexity of the used algorithm.It is worth noting that a majority of related strategies are based on offline optimization approaches.In other words, they are based on network snapshots models and do not measure the UEs time ar-rivals in their propositions. We will highlight some existent C-RAN dynamic optimization schemesthat are applicable for online optimization thanks to their low complexity design. However suchapproaches usually find limitations for large-scale networks and are only applicable for low usersdata-rate and QoS requirements, which is impractical for future 5G networks.
1.5.2 Proposed algorithms for dynamic resource allocation in LTE downlink for C-RAN
We will present in this contribution two optimization models for i) the resource allocation andpower minimization problem, and ii) the BBU-RRH assignment problem in C-RAN, consideringconstraints on transmission power and Signal-to-Interference-plus-Noise-Ratio (SINR) for UEs.Specifically, we will investigate how to dynamically optimize the set of active RRHs and basebandresources to serve dynamic traffic flows of incoming UEs. Due to the problem’s combinatorialnature, the computational complexity is NP-hard if an exact optimal solution is to be obtained for alarge-scale system [41]. To handle this issue, we will propose a meta-heuristic algorithm, based onthe Simulated Annealing (SA) framework, for providing quick sub-optimal solutions to the first-stage problem at a much reduced complexity. The objective of the second stage of our contributionsconsists to properly assign RRHs to BBUs based on RRHs instantaneous loads and the BBUs ca-pacity. We formulate this BBU-RRH assignment problem as a Multiple Knapsack Problem (MKP),which can efficiently be solved by commercial solvers such as IBM CPLEX [42]. This contributionis the object of a conference publication in the International Conference on Communications (ICC2016) [43] and the forthcoming publication [44].

24 1.5. THESIS CONTRIBUTION
1.5.3 Proposed algorithms for QoS-based admission control in C-RAN with func-tional split
In this contribution, we will extend our study to a C-RAN with capacity-constrained fronthaullinks. We will propose a joint downlink Resource Allocation and Admission Control (RAAC)algorithm, considering two types of user profiles: Guaranteed-service users – also known as Goldusers, and Best Effort ones. The considered problem takes into consideration i) each type of mobileusers QoS requirements in terms of Physical Resource Blocks (PRBs) (i.e., bandwidth), ii) RRHstransmission power limitations, and iii) fronthaul links capacity constraints for a user-cell functionalsplit. The problem is formulated as a Mixed Integer Non-Linear Program (MINLP) with a non-linear logarithmic constraint, induced by the fronthaul data-rates. We will propose then a two-stageframework to solve the problem. Our design will be based on problem decomposition and solvingtwo inter-related problems using a fixed time branch-and-cut technique. A fast greedy algorithmwill also be proposed for addressing the fronthaul admission control task, This contribution isthe object of a conference publication in the Global communication conference (GLOBECOM2016) [45] and the forthcoming publication [46].
1.5.4 Proposed algorithms for cost-resilience BBU selection in C-RAN
In this final contribution, we will consider the case where a MNO has to select BBU equipmentsfrom several CSPs to run its virtualized BBU pool. We assume that each CSP’s BBU is charac-terized by a distinct failure probability [47] and a capacity cost, that can be equivalent to contentdelivery network prices [48] for the services required from CSPs. We will propose in this context, aframework addressing the problem of optimal BBUs selection from several CSPs. The instantiatedBBU pool should meet the MNO’s expectations in terms of reliability, cost efficiency, processingpower optimization and traffic load catering. We will formulate our selection problem, named Cost-Resilience BBU Selection (CRBS), as an ILP problem, designed with a weighted objective functionfocusing on three optimization goals: i) minimizing the BBU pool processing power, ii) maximiz-ing its resiliency and iii) increasing the RRHs traffic load handling, subject to the virtualization’scapacity and budget constraints. To solve the ILP CRBS problem, we will propose to employ theBranch-and-Price (B&P) algorithm [49], which is a combination of the Branch-and-Bound andColumn Generation methods for efficiently solving large-scale ILP problems. Simulation resultswill demonstrate the good performance of our approach to solve the BBU selection problem fordifferent scenarios. Additionally, our analysis will evaluate several BBU selection policies andwill provide general guidelines that can be used by MNOs to decide the best BBU optimizationstrategy according to their needs. Note that this contribution is the object of a conference publi-cation in IEEE 86th Vehicular Technology Conference (VTC-Fall 2017) [50] and the forthcomingpublication [51].

CHAPTER 1. INTRODUCTION 25
1.6 Thesis outline
This thesis is organized as follows. In Chapter 2, we will outline the related work dealing withresource allocation strategies in C-RAN and will classify them into different categories. In Chapter3, we will describe our Dynamic Resource Allocation in C-RAN based on Simulated Annealing(DRAC-SA). Afterwards, we will present our Resource Allocation and Admission Control (RAAC)scheme in Chapter 4. In Chapter 5, we will describe our Cost-Resilience BBU Selection (CRBS)framework and present our Branch-and-Price (B&P)-based approach. Finally, Chapter 6 will con-clude the thesis and will present our ongoing and future work in this research field.

26 1.6. THESIS OUTLINE
Chapter 2Overview of resource allocationapproaches in C-RAN
Contents2.1 Introduction . . . . . . . . . . . . . . . . . . . . . . . . . . . . . . . . . . . . 272.2 Overview of resource allocation and power minimization approaches in C-
RAN . . . . . . . . . . . . . . . . . . . . . . . . . . . . . . . . . . . . . . . . . 282.3 Overview of resource allocation and admission control approaches in C-RAN 322.4 Overview of BBU-RRH assignment approaches in C-RAN . . . . . . . . . . 362.5 Summary . . . . . . . . . . . . . . . . . . . . . . . . . . . . . . . . . . . . . . 392.6 Conclusion . . . . . . . . . . . . . . . . . . . . . . . . . . . . . . . . . . . . . 41
2.1 Introduction
Thanks to C-RAN’s centralized architecture, operators can serve dynamic flows of mobile trafficwith more efficient use of baseband resource and lesser operation costs than the traditional Dis-tributed RAN (D-RAN) architecture. For this reason, the implementation of dynamic resourceallocation and power minimization algorithms in the BBU pool to cope with the time-varying traf-fic loads of RRHs is one of the most motivating challenges in C-RAN. An interesting issue thatoccurs in C-RAN resource allocation is when the fronthaul links become capacity-constrained dueto functional splitting. Admission control strategies can come into play to optimize the number ofaccepted UEs while taking into account their QoS requirements and the fronthaul links capacityconstraints. On another note, as virtualization of the C-RAN advances with the emergence of 5Gtechnologies and the migration to LTE-A, Mobile Network Operators (MNOs) have to upgradetheir infrastructure to not only support higher processing capacities but also to be more resilient.
27

282.2. OVERVIEW OF RESOURCE ALLOCATION AND POWER MINIMIZATION
APPROACHES IN C-RAN
Still, a common question that arises when a MNO is faced with choosing virtualized BBUs for itscloud is: What is the best BBU selection strategy when not only resiliency, but also virtualizationcost and RRHs traffic handling all come into play?
In this Chapter, we will give an in-depth overview of the different C-RAN resource allocationoptimization strategies proposed in literature. The next section will present resource allocationapproaches with a focus on transmission power minimization strategies in downlink. Section 2.3will pin the problematic of admission control in C-RAN and its major related work. Afterwards,Section 2.4 will provide an overview of the BBU-RRH traffic-based assignment strategies with anemphasize on the cost and resilience dilemma in C-RAN. Finally, Section 2.5 will conclude thisChapter by summarizing all main strategies with defined metrics and performance characteristics.
2.2 Overview of resource allocation and power minimization approachesin C-RAN
The D-RAN sub-optimality
It is undeniable that the research community has known a profusion of works on resource alloca-tion in traditional D-RAN. However it is also commonly acknowledged that distributed solutionsremain sub-optimal due to their distributed nature. In fact, the sub-optimality of these resourceallocation algorithms comes from the absence of a global network information of the network’scells, which forces them to only rely on a local network information at each serving eNodeB orsmall-cell (femtocell or picocell) [6] [52]. Some proposals have tackled the issue through informa-tion sharing [53], small-cells self-organization [54] and cognitive approaches [55]. Nevertheless,in the novel C-RAN architecture, many tasks such as resource allocation, power minimization andadmission control, which were previously solved sub-optimally by distributed solutions, with onlylocal network information, can now benefit from the cost-effectiveness brought by the centralizedglobal perspective.
C-RAN resource allocation and power minimization proposals
There have been many active research efforts from the research community to design efficientresource allocation strategies in C-RAN system. Resource allocation algorithms are essentiallydesigned to exploit wireless channels variations by dynamically allocating the available basebandresources to mobile users so as they could run their mobile applications [56]. Besides, the problemis often coupled with power minimization issues, as operators do not target to only serve usersthe best way they can, but also to lessen the power consumption and antenna power radiation tocreate a green and eco-friendly network [57] [58]. A common problem that arises is when wetarget to minimize the total C-RAN power consumption subject to users resource requests and

CHAPTER 2. OVERVIEW OF RESOURCE ALLOCATION APPROACHES IN C-RAN 29
Algorithm 1: Successive RRH Selection Algorithm [59]
1: Initialize the set of inactive RRHs N (0) = ∅, the set of active RRHs A(0) = 1, ..., L andi = 0.
2: Solve the power minimization to optimality and obtain the optimal beamforming gains foreach RRH r.
a) If the problem is feasible, find the RRH r(i) with lowest achieved beamforming gain andupdate N (i+1) = N (i)
⋃r(i) and i = i+ 1, and then go to Step 2.
b) If it is infeasible, denote I = i and go to Step 3.
3: Obtain the minimum network power consumption P? = minP (0), P (1), ..., P (I−1).
SINR constraints. This issue has been deeply tackled in many recent C-RAN papers that we willhighlight.
• For instance, authors in [59] presented a Group Sparse-based Beamforming approach (GSB),that can minimize the C-RAN total power transmitted from the RRHs as well as the powerconsumed in the transport network. In fact, as RRHs are deployed in cell sites, they must beconnected to the BBU pool through fronthaul transport links. Consequently, the more RRHsare active, the more significant the power consumption in the transport network becomes. Theauthors formulated the problem as a joint RRH selection and transmit-plus-transport-networkpower minimization beamforming problem, with a SINR constraint at each user. They haveaddressed this problematic by sorting the L active RRHs in their system in an increasingorder of their beamforming gain (i.e., transmitting power), and then proposing a successiveRRH selection algorithm. The latter, which pseudo-code is detailed in Algorithm 1, is basedon successively switching off RRHs with minimum beamforming gain until the problembecomes infeasible to minimize the whole transmission power consumption. Besides, byswitching off a set of RRHs, their associated fronthaul links will turn into idle mode with alow static power, which will result in the minimization of the whole transport network powerconsumption.
• The GSB approach has been very successful as a benchmarking scheme and has found a lotof echo in oder works tackling C-RAN power minimization. A notable work in view of this,is [60]’s joint DL and UL power minimization through UE-RRH association and beamform-ing. The authors, building on the highly stringent UL requirements for supporting interac-tive user applications (e.g., network gaming, full high-definition video calling and real-timebroadcasting), considered jointly the power minimization of DL and UL transmissions inC-RAN. In fact, they proposed a joint DL and UL UE-RRH association and beamformingdesign to optimize the energy consumption tradeoffs between the active RRHs and UEs, sub-

302.2. OVERVIEW OF RESOURCE ALLOCATION AND POWER MINIMIZATION
APPROACHES IN C-RAN
ject to UEs DL and UL QoS requirements. Their proposal is based on transforming the twoDL and UL problems into two DL inter-related subproblems by leveraging on the celebratedDL-UL duality result [61]. Their proposal is based on the following:
– The DL power minimization problem was addressed through [59]’ GSB approach,where the DL UE-RRH association problem is solved by optimally assigning UEs tobe served by the minimal subset of active RRHs and finding the beamforming gains totransmit from the selected RRHs to all UEs.
– Regarding the UL problem, it was addressed by leveraging on the so-called UL-DL du-ality result [61], where a virtual DL transmission is established to simulate the originalUL problem. The UL optimization was then converted into an equivalent DL transmis-sion problem in C-RAN, solved using integer programming and GSB.
[60]’s work was the first attempt to unify the DL and UL UE-RRH association and beam-forming design problems. Their numerical results exhibited improvements in the networkenergy efficiency and power consumption tradeoffs between RRHs and UEs. However, theGSB algorithms used in [59] and [60] could not exhibit the number of BBUs required to man-age the entire system. In fact, the studies were carried out separately from the cloud, withouttaking into account the reconfigurations that can be performed at the BBU pool level, nor theonline optimization delays.
• What is more, beamforming schemes may find limitations for computing-resource sharing, ashighlighted by the authors of [62]. The latter paper introduced a novel dynamic radio cooper-ation strategy for C-RAN to maximize the downlink weighted sum-rate system utility, whichoutperforms beamforming schemes used in [59] and [60]. In fact, due to the combinatorialnature of the resource allocation problems in C-RAN and the non-convexity of the coopera-tive beamforming design, the underlying optimization problems are generally NP-hard, andextremely difficult to solve for a large-scale network. The authors in [62] proposed a transfor-mation approach of the original beamforming problem into a Mixed-Integer Second-OrderCone Program (MI-SOCP) with no computing-resource constraint on the accumulated datarate R(u,w) of all users u in the system with beamforming gain w. They then presenteda fast iterative algorithm, detailed in Algorithm 2, for finding suboptimal solutions to theoriginal problem.
• Other attempts towards centralized resource allocation have been previously made. For in-stance, Wang et al. proposed a graph-based approach for dynamic frequency reuse in C-RAN [63]. The authors presented a load-based graph coloring method to allocate spectrumresource to each RRH dynamically depending on traffic demands as well as reducing theinter-cell interference. Their simulation results demonstrated good achieved throughputs for

CHAPTER 2. OVERVIEW OF RESOURCE ALLOCATION APPROACHES IN C-RAN 31
Algorithm 2: Cooperative Resource Sharing (CRS) design [62]
1: Solve the relaxed SOCP problem to find the optimal beamformers weights w.2: Verify the dropped maximum computing-resource constraint.
– If the dropped constraint is verified, return the optimal solution w∗ = w.
– Otherwise: Drop users’ rates using a greedy algorithm.
∗ Repeat: Update Rate of UE u R(u, w) = R(u, w)− τ , where τ is a smalldecreasing step.
∗ Go to the next UE when R(u, w) = 0.
∗ Until: the maximum data rate computing-resource threshold is achieved.
∗ Return w∗ = w.
both cell-center and cell-edge UEs. Furthermore, in [64], authors proposed to minimize thewhole energy cost in C-RAN while of optimizing the end-to-end performance of MobileCloud Computing (MCC) UEs. By adopting a decision-theoretic approach, they formulatedthe response latency experienced by A MCC UE as a constraint to solve the problem with re-spect to C-RAN timing requirement. Their proposal yielded to generally good performancesin cloud energy savings for a small-scale network.
• In [36], authors presented the QoS-based resource allocation framework, which is a cen-tralized approach for resource and power allocation in femtocells networks. In their pro-posal, cooperation between neighboring RRHs is exploited to improve resource allocationand throughput satisfaction via power minimization. Within each cluster of RRHs, a jointresource and power allocation is centralized at a cluster-head that periodically optimizes thethroughput satisfaction. Later in [34], the authors presented a novel approach based on coop-erative game theory to address the problem of interference mitigation. In their proposal,cooperation between neighbouring RRHs is exploited based on interference maps detec-tion. Solutions from coalitional game theory, such as Nucleolus and the Shapley value, wereadopted to solve the problem to optimality. However, in the latter, dynamic resource alloca-tion considering online optimization delay was not taken into account, and the algorithm’scomputational time was fairly high.

322.3. OVERVIEW OF RESOURCE ALLOCATION AND ADMISSION CONTROL
APPROACHES IN C-RAN
2.3 Overview of resource allocation and admission control approachesin C-RAN
In the centralized C-RAN deployment presented in the survey [17], BBUs are housed in a cen-tralized macro-cell room owned by the operator and interconnected to RRHs at the cell sites viadark point-to-point fiber. The protocol used over the fiber to meet the stringent latency and jitterrequirements of LTE HARQ is usually CPRI [16] or OBSAI [65]. This poses several challengesregarding the fronthaul deployment of C-RAN solution, as highlighted by [11] and [20] since itmay increase the global CAPEX expenses for expanding a fiber-access and high-capacity fronthaullinks from the BBU pool to the cell site. A solution would be based on defining a tradeoff betweenthe required centralized processing of the BBU pool and the fronthaul capacity [38], by splitting thefunctionality of the BBU at different layers. The partially-centralized C-RAN introduced by [22]has presented a family of flexible functional splits where parts of the BBU’s PHY and MAC layersare distributed at the RRH end.
For instance, functional splits, such as the UE-Cell and PDCP-RLC examples in Section 1.3.1of the previous Chapter, can help relax the stringent latency requirement of C-RAN fronthaul in-frastructure [21]. They can enable traffic dependent bandwidth adaption to the actual traffic servedin the cell, unlike the CPRI protocol, which is constant bit rate. However, the fronthaul network islimited in terms of bandwidth it can actually convey for the required latency. What is striking, thestudy of fronthaul-constrained C-RANs is steadily coupled with admission control problems, dueto the induced fronthaul links capacity limit to support all UEs data throughputs. Therefore, the de-sign of C-RAN wireless communications schemes should account for the fronthaul links capacityconstraints.
• In view of this, Abdelnasser et al. [66] proposed a joint multi-channel allocation and admis-sion control optimization framework for a two-tier cellular C-RAN under fronthaul limita-tions. In their work, the authors considered the DL of a cellular two-tier network composedby a single macrocell overlaying a number of RRHs, as illustrated in Figure 2.1. The resourceallocation problems for each tier of the macrocell and RRHs are formulated as optimizationproblems described in the following:
1. Macrocell tier: Being conscient of the C-RAN RRHs presence, the macrocell maxi-mizes the sum of interference levels that it can tolerate from the lower tier, subject tomacrocell maximum power and QoS constraints of the Macrocell UEs (MUEs), whichare the users served by it.
2. C-RAN RRHs tier: The RRHs try to maximize the number of its supported users,called Small cell UEs (SUEs), while minimizing the total DL transmission power sub-ject to RRHs power budget, SUEs’ QoS requirements, interference thresholds for MUEs,

CHAPTER 2. OVERVIEW OF RESOURCE ALLOCATION APPROACHES IN C-RAN 33
Figure 2.1 – Two-tier network with small cells deployed in a C-RAN architecture within the cover-age area of a macrocell [66].
and fronthaul constraints.
Both tiers problems are shown to be MINLPs and NP-hard. To address the issue, the authorsfirst present a matrix reformulation of the original macrocell tier problem and propose todrop the induced rank-one constraint that hinders the convexity of the reformulation. Theresulting problem is a Semi-Definite Program (SDP), which is efficiently solved by interiorpoint method [67]. They then present, for the second C-RAN tier, a low complexity algorithmbased on allocating the remaining resources to SUEs that have high channel gains and thatwill cause low interference to MUEs first. The pseudo-code of the Sub-Channel Allocationand Admission Control (SCAAC) algorithm is detailed in Algorithm 3.
The authors further improved their proposition in [68] by working on the relaxation of theSDP problem and presenting a successive convex approximation algorithm. Even thoughtheir proposals in [66] and [68] both provided low complexity solutions for the addressedproblems in DL transmission, their experimental results revealed their algorithms’ limitationto only low QoS threshold regime and users data-rate requirements. In fact, the percentageof total admitted users showcased in [66] is less than 50% for a maximum QoS threshold of11 dB and resource request of 3 sub-channels. This is quite underwhelming for current LTEcellular systems, where the QoS requirements are expectedly higher (not to speak of future5G data rates). A similar observation can be made in [68], where the target user data-rate
342.3. OVERVIEW OF RESOURCE ALLOCATION AND ADMISSION CONTROL
APPROACHES IN C-RAN
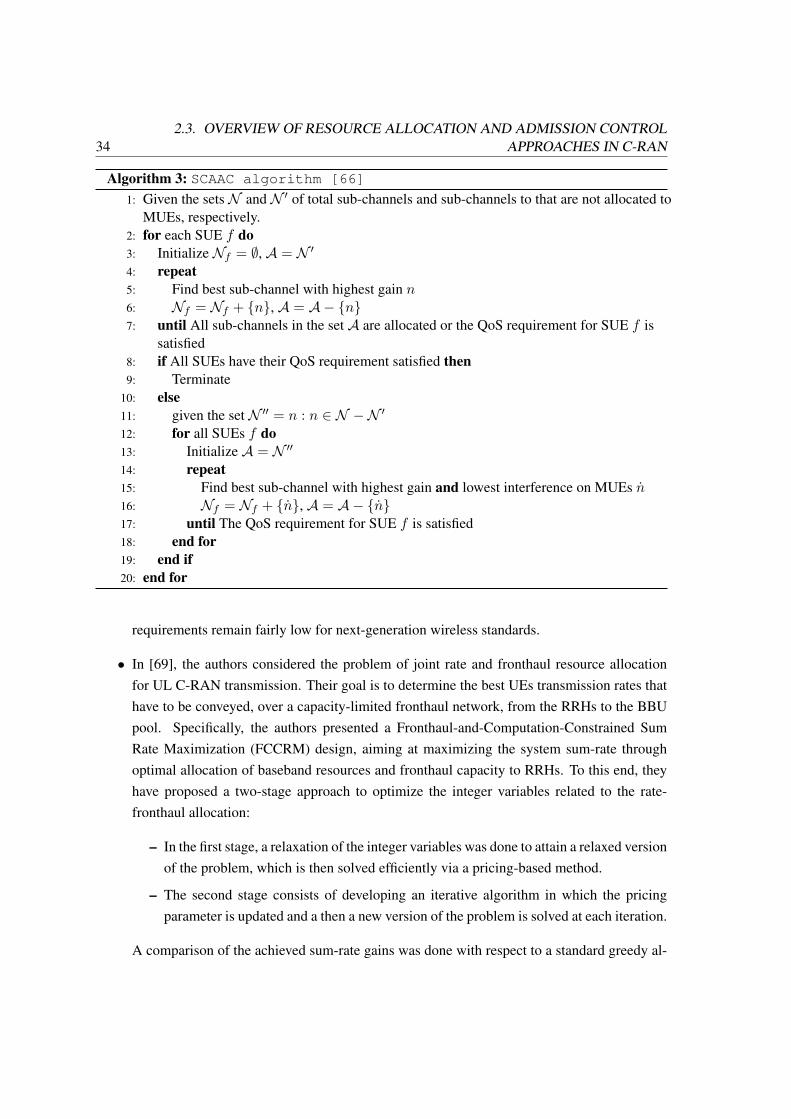
Algorithm 3: SCAAC algorithm [66]
1: Given the sets N and N ′ of total sub-channels and sub-channels to that are not allocated toMUEs, respectively.
2: for each SUE f do3: Initialize Nf = ∅, A = N ′4: repeat5: Find best sub-channel with highest gain n6: Nf = Nf + n, A = A− n7: until All sub-channels in the set A are allocated or the QoS requirement for SUE f is
satisfied8: if All SUEs have their QoS requirement satisfied then9: Terminate
10: else11: given the set N ′′ = n : n ∈ N −N ′12: for all SUEs f do13: Initialize A = N ′′14: repeat15: Find best sub-channel with highest gain and lowest interference on MUEs n16: Nf = Nf + n, A = A− n17: until The QoS requirement for SUE f is satisfied18: end for19: end if20: end for
requirements remain fairly low for next-generation wireless standards.
• In [69], the authors considered the problem of joint rate and fronthaul resource allocationfor UL C-RAN transmission. Their goal is to determine the best UEs transmission rates thathave to be conveyed, over a capacity-limited fronthaul network, from the RRHs to the BBUpool. Specifically, the authors presented a Fronthaul-and-Computation-Constrained SumRate Maximization (FCCRM) design, aiming at maximizing the system sum-rate throughoptimal allocation of baseband resources and fronthaul capacity to RRHs. To this end, theyhave proposed a two-stage approach to optimize the integer variables related to the rate-fronthaul allocation:
– In the first stage, a relaxation of the integer variables was done to attain a relaxed versionof the problem, which is then solved efficiently via a pricing-based method.
– The second stage consists of developing an iterative algorithm in which the pricingparameter is updated and a then a new version of the problem is solved at each iteration.
A comparison of the achieved sum-rate gains was done with respect to a standard greedy al-

CHAPTER 2. OVERVIEW OF RESOURCE ALLOCATION APPROACHES IN C-RAN 35
Algorithm 4: Fast Greedy Algorithm (FGA) [70]
1: Initialization: Set removal set S = ∅2: Solve the admission control problem for all UEs without the fronthaul constraint.3: If it is infeasible to maintain all SINR constraints, remove the UE having the weakest channel
gain to its nearest RRH, update S, and go back to step 2.4: Otherwise, if all SINR constraints are verified, then
a) Calculate δ for all RRHs.
b) Drop the weakest links from the RRH to its active UEs that achieves the smallest δ.
c) Solve the problem with the current allocation of RRHs for active UEs
d) If the new solution can maintain SINR constraints for all active UEs then terminate.
e) Otherwise, remove the UE requiring the highest transmission power, update set S, and goback to step 2.
gorithm. However, the performance gains for the achieved data rates were not really sizable:only 9% of marginal gap is between FCCRM and the greedy approach.
• On the other hand, authors in [70] considered the DL C-RAN admission control by proposinga DL coordinated beamforming scheme for fronthaul-constrained network. Their propositionaims at minimizing the total transmission power subject to user QoS and maximum RRHpower constraints. They introduced a convex relaxation of the admission control problem intoa SDP that is solved iteratively until convergence. Moreover, since solving SDP problemsgenerally takes a fair amount of time, they presented a Fast Greedy Algorithm (FGA), whichis based on calculating the relative contribution δ of a channel link between a RRH and UE tothe SINR of this UE, and then gradually removing users from the system until all constraintscan be satisfied. The pseudo-code of the FGA scheme is detailed in Algorithm 4.
• FGA schemes have been commonly used in literature to address the problem of admissioncontrol in C-RAN with fronthaul constraint, due to the computation effort required to findquick solutions for these types of problem. This approach has not only been used in [70], butalso in works such as [71] and [72] who presented similar approaches for C-RAN admissioncontrol and total DL power minimization over a capacity-limited fronthaul network. Recentlyin [73], authors addressed the sum-rate maximization problem in C-RAN, with joint QoS andfronthaul constraints. Under 5G data-rate practical assumptions and by ignoring some con-straints, they proposed a fast algorithm based on Quasi-Geometric-Programming (QGP) thatcan solve the problem with low complexity compared to conventional convex optimizationsolvers. However, their solution can hardly be applied in resource allocation problems, where

36 2.4. OVERVIEW OF BBU-RRH ASSIGNMENT APPROACHES IN C-RAN
the number of variables is fairly high, and thus increase the computation time. Besides, workssuch as [66], [59], [68] and [70] are based on snapshots models of wireless cellular networksand do not measure the network’s traffic time arrivals. Their physical layer designs mustinclude stochastic and time-varying constraints to consider the fluctuating traffic variation ofmobile users and to be applicable in a real-time context.
2.4 Overview of BBU-RRH assignment approaches in C-RAN
In the detailed survey presented by [20], the authors stressed out C-RAN’s agility benefits foroperators compared to Distributed RAN BSs. What is striking, while more BSs are needed inD-RAN to increase mobile traffic coverage and handling, some of them are under-utilized duringcertain hours in the day that correspond to low traffic load (day time for residential areas and nighttime for office ones), resulting in ineffective use of baseband resources.
• C-RAN can address this issue, as motivated by the authors in [38], by maximizing the so-called Statistical Multiplexing Gain (SMG), that is the ratio of sum of single BBU capacityto the capacity required in the BBU pool. In [38]’s C-RAN scenario with 200 RRHs - 100covering office areas and 100 residential ones, - the authors presented the BBUs savings thatcan be achieved through SMG maximization compared to D-RAN. In fact, by dynamicallysetting the BBU-RRH connections and allocating resources to RRHs according to users’traffic profiles and volumes, cost reduction and energy savings can be realized due to thereduction in the number of BBUs and effective utilization of the baseband resources. Thisis highlighted in Figure 2.2, where only 71 BBUs are needed to handle both types of areas’RRHs during the day; saving up in total 129 BBUs than the D-RAN setup.
• There have been other approaches tackling the BBU-RRH assignment problem in respect totraffic demand:
– Based on the traffic analysis of Tokyo’s metropolitan area, the authors in [74] proposeda new “Colony” RAN design that can dynamically change the BBUs-RRHs connectionswith respect to traffic demand. Their proposal showed that, by setting up dynamic BBU-RRH mappings, the number of BBUs can be lessened by maximum 75% compared tothe traditional RAN architecture. This, nevertheless, remains a rough estimation by theauthors themselves.
– In [75], the same authors as in [74] further enhanced their proposal by introducing twoBBU-RRH switching schemes for C-RAN: Semi-Static (SS) and Adaptive. The SS al-gorithm, which pseudo-code is described in Algorithm 5, determines the combinationsof BBUs and RRHs to accommodate peak hour traffic load for all RRHs within a large

CHAPTER 2. OVERVIEW OF RESOURCE ALLOCATION APPROACHES IN C-RAN 37
Figure 2.2 – Number of BBUs allocated during a day, for 100 office and 100 residential RRHs inC-RAN compared to D-RAN. Source: Checko et .al [38].
time interval. In contrast, their adaptive scheme maps RRHs to BBUs based on the SSalgorithm as well as neighboring RRHs loads and BBUs resource usage limits withina short time interval (one hour). The authors demonstrated that under a traffic distri-bution in an office area, the number of BBUs can be reduced by 26% and 47% for thesemi-static and adaptive schemes, respectively.
Although solutions for resource BBU-RRH assignment procedures in C-RAN have receivedsome notable attention, the number of contributions for this problematic remains nonetheless verylimited. Besides, it is unequivocal that very few research works have addressed the problem ofcost-resilience BBU selection in C-RAN, or more generally the problem of resiliency in C-RAN(not to speak of the cost of instantiating the BBU pool). Some related work have adumbrated theseissues by far, for instance:
• In [76], the authors studied the problem of cloud resilient BBU-RRH assignment with virtu-alized BBU placement in metropolitan infrastructures. To solve the problem, they presentedthree approaches for resilient assignments:
– one-to-one BBU-RRH protection;
– one-to-one BBU-RRH protection and virtualized BBU protection;
– partial BBU-RRH protection.

38 2.4. OVERVIEW OF BBU-RRH ASSIGNMENT APPROACHES IN C-RAN
Algorithm 5: Semi-Static (SS) BBU-RRH switching algorithm [75]
1: Initialization:
• i: ith RRH (1 ≤ i ≤ I)
• j: jth BBU (1 ≤ j ≤ J)
• R(i)/R(j): Used resources in RRH i or assigned resources to BBU j
• j = 0
2: for each RRH i do3: if no BBU is assigned to RRH i then4: Insert RRH i in queue.5: while queue is not empty do6: Search RRH t that used resources is the most in the queue.7: if R(j) +R(t) ≤ UpperLimit of the queue then8: RRH t is assigned to BBU j.9: Update resources of BBU j: R(j)← R(j) +R(t).
10: Insert neighboring RRHs to RRH t that have not been inserted yet in the queue.11: end if12: end while13: Remove RRH t from queue.14: end if15: j ← j + 116: end for
They formulated all three propositions through ILP formalisation and compared them withnon-resilient BBU-RRH mapping. The results showed that the one-to-one BBU-RRH andvirtualized BBU protection scheme provides the highest resiliency for processing and net-work failures, followed by the low-cost partial BBU-RRH protection approach.
• Meanwhile, authors in [77] presented a BBU virtualization scheme that aims at minimizingthe total BBU pool power consumption subject to processing capacity constraint and with alinear computational complexity order. They tackled the problem via a simulated annealing-based heuristic to find near-optimal results in minimum time. However, the resiliency andprocessing cost aspects were not considered, and, if taken into account, the simulated anneal-ing heuristic may find limitations for such scenario.
• In [78], Bouet et al. proposed a novel scheme for virtualized BBUs placement in a cloudinfrastructure to meet the operational cost constraints such as licence fees and/or power con-sumption. In fact, the placement of virtualized BBUs in cloud hotels realizes a tradeoffbetween possibly conflicting goals and a careful optimization design is needed. To address

CHAPTER 2. OVERVIEW OF RESOURCE ALLOCATION APPROACHES IN C-RAN 39
the issue, the authors proposed first to cast the problem as a multi-commodity flow ILP prob-lem. They then devised a centrality-based greedy heuristic that proved to run in polynomialtime, and assessed its validity by comparing its performance gains in terms of processingtime and cost with respect to the ILP optimal solution.
• In [79], authors proposed a similar scheme to model the problem of BBUs placement in COsas an ILP optimization problem, subject to traffic demand and a Multi-Stage WDM-PassiveOptical Network (PON) backhauling, which architecture is described in [80]. Their goal isto decide what are the best COs to place within BBUs, with respect to the routing latenciesand baseband assignment of traffic demands, so as the number of COs can be minimized.The authors mentioned a random multi-stage tree topologies generation algorithm to solvethe underlying ILP problem, however, the algorithm’s details were skipped in their paper.Besides, both [78] and [79] proposals consist only of early work studies, which have notfully exploited the flexibility of centralized C-RAN architecture regarding efficient basebandresource pooling and its ability to benefit from cost-efficient optimization.
2.5 Summary
Table 2.1 presents a comprehensive survey of the aforementioned C-RAN resource allocation al-gorithms found in literature. A taxonomy of these strategies in terms of: i) objective functions ii)constraints, iii) used algorithm, iv) application, iv) achieved UE throughput and v) computationalcomplexity are highlighted.

40 2.5. SUMMARY
Table 2.1 – Comparison of C-RAN resource allocation strategies
Ref. Objective Constraints Solution Application Achieved UEs Computationaldata rates complexity
[59] [60] Total DL power - Max power GSB Static Low Highminimization - SINR
[62] DL Sum rate - Max power CRS Dynamic High Lowmaximization - Computing res.
[63] Spectrum - Traffic demand Graph- Dynamic High -allocation - SINR coloring
[64] Total DL power - MCC UE Decision Static Low -minimization response latency theoritic
[36] [34] Total DL power - Max power Game Static High -minimization - SINR theory
[66] [68] - Admission Control - Fronthaul -SDP Static Low High- Maximizing RRHs - UE QoS -SCAAC Static Low Low
interf. levels - Max Power[69] UL Sum rate - Fronthaul FCCRM Static Low Low
maximization - BBU capacity[70] [71] - Admission Control Fronthaul - SDP Static Low High
[72] -Total DL power - UE QoS - FGA Static Low Lowminimization - Max Power
[73] DL Sum rate - Max power QGP Static High Lowmaximization - Fronthaul
[38] BBU-RRH - BBU capacity SMG Dynamic - -assignment
[74] BBU-RRH - BBU capacity Colony- Dynamic - -assignment RAN
[75] BBU-RRH - BBU capacity - SS Dynamic - -assignment - Adaptive
[76] Resilient BBU- - links protection Simplex Dynamic - LowRRH mapping & survivability algorithm
[77] -BBU processing - Single BBU Simulated Dynamic - Linearpower minimization capacity annealing
-BBU-RRH - BBU poolassignment total capacity
[79] Virtualized BBUs - Traffic demand - Static - -hoteling - backhaul latency
[78] Virtualized BBUs - processing cost Greedy Static - Polynomialhoteling - Max power heuristic

CHAPTER 2. OVERVIEW OF RESOURCE ALLOCATION APPROACHES IN C-RAN 41
2.6 Conclusion
This Chapter provided an overview of C-RAN resource allocation strategies in literature. First,we described the C-RAN transmission power minimization schemes. Next, we outlined the re-source allocation and admission control approaches for fronthaul-constrained C-RANs. Then, wepresented the different existing solutions for BBU-RRH mappings. Afterwards, we summarizedall the discussed related C-RAN strategies, while outlining the main metrics for evaluating the per-formance of the proposed solutions in terms of algorithm application, achieved UEs data rates andcomputational complexity.
Considering all the above criteria clearly makes the problem of dynamic resource allocationin C-RAN atypical and challenging. Unfortunately, a majority of the surveyed works consist ofoffline optimization algorithms. In fact, no dynamic resource allocation strategy has been pro-posed including stochastic and time-varying constraints to consider the fluctuating traffic variationof UEs and their high resource demands, inherent to 4G/5G networks. Consequently, to the best ofour knowledge, our study is the first attempt to present a centralized approach combining dynamicresource allocation, transmission power minimization and BBU-RRH assignment into one frame-work, which does not only support 5G higher rates, but is also dynamic, has low-complexity and isapplicable for large-scale networks optimization.

42 2.6. CONCLUSION

Chapter 3Dynamic resource allocationand power minimization in LTEDL for C-RAN
Contents3.1 Introduction . . . . . . . . . . . . . . . . . . . . . . . . . . . . . . . . . . . . 433.2 System model . . . . . . . . . . . . . . . . . . . . . . . . . . . . . . . . . . . . 44
3.2.1 Centralized resource allocation and power minimization problem formu-lation . . . . . . . . . . . . . . . . . . . . . . . . . . . . . . . . . . . . 44
3.2.2 Multiple knapsack problem formulation for BBU-RRH assignment . . . 47
3.3 Proposal: DRAC-SA Algorithm . . . . . . . . . . . . . . . . . . . . . . . . . 483.3.1 Algorithm overview . . . . . . . . . . . . . . . . . . . . . . . . . . . . 48
3.3.2 MKP resolution . . . . . . . . . . . . . . . . . . . . . . . . . . . . . . . 51
3.4 Performance evaluation . . . . . . . . . . . . . . . . . . . . . . . . . . . . . . 513.4.1 Simulation environment . . . . . . . . . . . . . . . . . . . . . . . . . . 52
3.4.2 Performance metrics . . . . . . . . . . . . . . . . . . . . . . . . . . . . 52
3.4.3 Simulation results . . . . . . . . . . . . . . . . . . . . . . . . . . . . . 53
3.5 Conclusion . . . . . . . . . . . . . . . . . . . . . . . . . . . . . . . . . . . . . 60
3.1 Introduction
In this Chapter, we present a novel two-stage framework to address the issues of dynamic resourceallocation, transmission power minimization and BBU-RRH assignment in DL C-RAN. Specifi-cally, we investigate how to dynamically optimize the set of active RRHs and allocated resources to
43

44 3.2. SYSTEM MODEL
serve dynamic traffic flows of incoming UEs with varying resource demands. To do so, we proposein the first stage a Dynamic Resource Allocation in C-RAN algorithm based on Simulated An-nealing (DRAC-SA), that aims at dynamically associating the best spectrum set of frequency/timeresources to incoming UEs, with proper UE-RRH attachment. Based on the results of this firststage, the second one consists in computing the optimal number of BBUs required to manage thesystem, and appropriately assigning them to RRHs in order to handle the whole traffic load. Wemodel this second problem using a Multiple Knapsack Problem (MKP) formulation, that can effi-ciently be solved using commercial standard solvers such as IBM CPLEX [42].
To gauge the effectiveness of our proposal, we compare our resource allocation design withtwo main existing strategies in centralized resource allocation and power control: QP-FCRA [36]and GSB [59] schemes. We also include comparisons to a greedy approach, as well as to theoptimal solution returned from an offline optimization run. Additionally, we compare our second-stage solutions in terms of BBU-RRH attachment to the Semi-Static (SS) and Adaptive schemesproposed in [75].
The remainder of this Chapter is organized as follows. In section 3.2, we present the mathe-matical characterization of our two-stage system model. In section 3.3, we describe the DRAC-SAalgorithm used to solve the resource allocation problem. Numerical results are presented in sec-tion 3.4 to illustrate the performance of DRAC-SA. Finally, section 3.5 concludes this Chapter.
3.2 System model
We describe in this section our two “Centralized-Resource Allocation & Power Minimization” (C-RAPM) and MKP optimization models. We consider a C-RAN system composed by a number ofS RRHs within the set S = i|1 6 i 6 S. The BBU pool jointly assigns to each RRH in S anumber of K Physical Resource Blocks (PRBs) from the set K = k|1 ≤ k ≤ K. We assumethat the fronthaul network has sufficient links capacity.
3.2.1 Centralized resource allocation and power minimization problem formulation
In our first optimization model, we considerN (N ≥ 1) number of User Equipments (UEs) enteringthe system at a given epoch and connecting to a certain RRH i from S. Each UE u ∈ 1, .., Nrequests from its serving RRH a number of PRBs Nu to run its applications [81]. We suppose thateach RRH i handles one cell in a delimited area, and that a UE u can only be served by the RRHcovering the area it is positioned within. We consider a static transmission power from RRH i toUE u on each allocated PRB k. We suppose that the transmission power is quantized into L ≥ 2
discrete power levels: pmin = p1 < p2 < ... < pL = pmax, where pmin is the minimum powerthat can be transmitted to a UE u and pmax is the maximum transmitted power for each RRH. Anincrease in the number of power levels L pushes the discrete domain to be closer to a continuous

CHAPTER 3. DYNAMIC RESOURCE ALLOCATION AND POWER MINIMIZATION INLTE DL FOR C-RAN 45
one, but undoubtedly increases the problem’s computational complexity [33]. Each resolution canlead to different transmission powers. We define our UE-RRH attachment, PRB allocation andtransmit power variables:
xui =
1, if UE u is attached to RRH i,0, otherwise.
(3.2.1)
yuik =
1, if PRB k is allocated to UE u on RRH i,0, otherwise.
(3.2.2)
puik =
p ∈ p1, ..., pL, if yuik = 1,0, otherwise.
(3.2.3)
The SINR achieved by UE u, attached to RRH i and on a given PRB k can be formulated as:
γuik =puikg
uik∑
j 6=i∑
v 6=u pvjkg
ujk + σ2
(3.2.4)
where guik is the path gain between RRH i and UE u, and σ2 is the noise power. The SINR isexpressed per PRB, as both channel/fading and interference vary over PRBs due to multipath,frequency selectivity and domain scheduling [34]. Our objective is to find the optimal resourceallocation strategy (i.e., to find the serving RRHs and PRBs allocation in downlink), to serve in abest effort way the existing UEs, while minimizing the total RRHs transmitted power and attainingthe UEs requested SINRs level at each used PRB. Our C-RAPM optimization problem can bewritten as follows:
minimizexu,yu,pu
N∑u=1
∑i∈S
∑k∈K
(εpuikPmax
− (1− ε)xui y
uik
K) (3.2.5)
subject to∑i∈S
∑k∈K
xui yuik 6 Nu, ∀u (3.2.6)
N∑u=1
∑k∈K
puik 6 pmax, i ∈ S (3.2.7)
γuik > yuikΓuk , i ∈ S, k ∈ K,∀u (3.2.8)
puik > yuikpmin, i ∈ S, k ∈ K,∀u (3.2.9)N∑u=1
yuik 6 1, i ∈ S, k ∈ K (3.2.10)
yuik 6 xui , i ∈ S, k ∈ K, ∀u (3.2.11)
xui , yuik ∈ 0, 1, i ∈ S, k ∈ K, ∀u (3.2.12)
We outline in the objective function (3.2.5) that we target to minimize the total transmissionpower while maximizing all possible UEs-PRBs assignments. The objective function is standard-ized so as to return values in the same order of magnitude. ε is a constant optimization weight

46 3.2. SYSTEM MODEL
between 0 and 1. Constraint (3.2.6) stresses out the fact that the total allocated resources for eachUE cannot exceed its requested demand Nu. Conditions (3.2.7) and (3.2.9) are the power con-straints on RRH and UE, respectively. Condition (3.2.8) ensures that the received SINR is equalto the required one Γuk when the PRB k is in use (i.e., yuik = 1) [36]. Constraint (3.2.10) ensuresthat two UEs attached to the same RRH cannot use the same PRB, (3.2.11) imposes all yuik = 0 ifxui = 0 (i.e., the RRH i is not transmitting any PRBs), and finally (3.2.12) refers that yuik and xuiare binary variables.
It is worth noting that the optimization problem (3.2.5 − 3.2.12) is an Integer Non-LinearProgram (INLP), which is NP-hard due to the quadratic objective function and the non-convexSINR constraint (3.2.8) [41]. To simplify the resolution of this problem, we reformulate it as anILP thanks to the well-known big-M method [82]. In fact, we can replace the product of the twobinary variables yuik and xui by a new binary variable zuik and add the new following constraints:
zuik 6 xui , (3.2.13)
zuik 6 yuik, (3.2.14)
zuik > xui + yuik − 1. (3.2.15)
regarding the SINR constraint (3.2.8), we find it convenient to reformulate it as follows:
(1 +1
Γuk)puikg
uik > yuikΥ
uk + yuikσ
2 (3.2.16)
where Υuk is equal to
∑j
∑v p
vjkg
ujk. The non-convex product between binary variable yuik and
continuous variable Υuk can also be linearized using the big-M modeling, as long as Υu
k has explicitlower and upper bounds. From the variable definition in (3.2.3) and the constraint (3.2.9), we caneasily deduce Lwr and Uppr, the lower and upper bounds of Υu
k , respectively. Thus, the productyuikΥ
uk can be replaced by a new continuous variable wuik and the corresponding constraints can be
rewritten as:
yuikLwr 6 wuik 6 yuikUppr (3.2.17)
(1− yuik)Lwr 6 Υuk − wuik 6 (1− yuik)Uppr (3.2.18)
Hence, the ILP formulation of our C-RAPM problem can be expressed as follows:
minimizexu,yu,pu
N∑u=1
∑i∈S
∑k∈K
αpuikPmax
− (1− α)zuikK
(3.2.19)
subject to∑i∈S
∑k∈K
zuik 6 Nu, ∀u (3.2.20)
(3.2.7), (3.2.9− 3.2.15), (3.2.17− 3.2.18) (3.2.21)
(1 +1
Γuk)puikg
uik > wuik + yuikσ
2 (3.2.22)

CHAPTER 3. DYNAMIC RESOURCE ALLOCATION AND POWER MINIMIZATION INLTE DL FOR C-RAN 47
3.2.2 Multiple knapsack problem formulation for BBU-RRH assignment
In a Distributed RAN system, one BBU is entirely assigned to a single RRH to handle the totaltraffic load. Thanks to C-RAN’s centralization, the resources of one BBU can be shared betweendifferent connected RRHs that have few traffic load [38]. For instance, if a remote site is coveredby 4 RRHs and each has 25% of traffic load, one BBU is enough to manage all four RRHs. In ourstudy, we can compute the optimal number of needed BBUs NBBU to manage the S loaded RRHsas follows:
NBBU = dSum of all RRHs traffic chargesK
e (3.2.23)
where d.e is the ceiling function and K is the number of PRBs. The total charge of active RRHscorresponds to the total number of assigned PRBs from transmitting RRHs to all users, that arereturned after solving the C-RAPM problem. Our goal in this second stage is to properly assignRRHs to the NBBU BBUs using a MKP formulation [83], where the objects and the knapsacksare represented by the RRHs and the BBUs, respectively. We introduce a new binary variable rij ,which is equal to one if RRH i is attached to BBU j and zero otherwise. After solving the firstproblem, we can compute the weight of RRH i ci as follows:
ci =∑k∈K
y?ik/K (3.2.24)
where y? is the returned solution from the C-RAPM problem. The value of ci represents the per-centage of traffic load RRH i handles. We suppose that each BBU j can handle 100% of a fullyloaded RRH (i.e., all K PRBs are used). Our BBU-RRH MKP problem can be formulated asfollows:
maximizer
NBBU∑j=1
S∑i=1
rij (3.2.25)
subject toS∑i=1
cirij 6 1, j ∈ 1, ..., NBBU, (3.2.26)
NBBU∑j=1
rij 6 1, i ∈ 1, ..., S, (3.2.27)
rij ∈ 0, 1, i ∈ 1, ..., S, j ∈ 1, ..., NBBU (3.2.28)
where constraint (3.2.27) denotes that one RRH cannot be managed by more than one BBU. Thisformulated problem is a linear program, which can be efficiently solved by commercial standardsolvers such as IBM’s ILOG CPLEX.

48 3.3. PROPOSAL: DRAC-SA ALGORITHM
3.3 Proposal: DRAC-SA Algorithm
We have previously attempted to address the C-RAPM problem formalized in (3.2.19)− (3.2.22),by proposing an optimal DRAC approach based on the branch-and-cut algorithm in [43]. However,due to the combinatorial complexity of the problem, finding optimal solutions for a large-scalenetwork may take a fair amount of time and will not be suitable for online optimization.
In this section, we will present our Dynamic Resource Allocation in C-RAN based on SimulatedAnnealing (DRAC-SA) algorithm with defined neighborhood search program to find near-optimalsolutions to the C-RAPM in minimum time.
3.3.1 Algorithm overview
The Simulated Annealing (SA) algorithm [84] is a powerful stochastic algorithm used to solvemany combinatorial optimization problems in a fixed amount of time. It has already been appliedin several works in LTE wireless networks context, such as for downlink multiuser scheduling [85]and for joint transmitter and receiver optimization in multiuser MIMO-OFDM environment [86].The framework is based on exploring the different states of the cooling process of a solid from aninitial hot temperature to a fixed frozen one. Each state of the process corresponds to a solution ofthe optimization problem. The global optimal solution is found when the maximum temperatureis sufficiently high and the cooling is done sufficiently low to explore many system states. Froma given state, a subsequent one can be generated by performing a small perturbation mechanism.This corresponds to generating neighbors of the initial solution via some particular neighborhoodstructures. The acceptance rule of a new solution (or new state) to the initial one is defined by theMetropolis rule [87], which imposes a probabilistic decision based on the varying temperature andthe energy of both states. The energy refers to the cost function of the optimization problem. If thegenerated state has lesser energy, it is accepted as the current state. Otherwise, it is accepted witha probability given by: exp(−∆E
T ), where ∆E is the energy difference of the two states and T isthe time varying temperature. It is worth noting that at high temperature exp(−∆E
T ) is close to 1,therefore the majority of moves can be accepted. Whereas at low temperature, exp(−∆E
T ) is closeto 0, which severely limits the search process to only solutions that decrease the energy.
3.3.1.1 Initial solution
We first start by employing a greedy search method to generate the initial solution of the C-RAPMproblem. It is based on performing linear relaxation of the integer variables and limiting the localsearch at the first nodes containing feasible integer solutions. What is more, the local search canbe further lessened by focusing our resolution on a smaller optimization space, generated by the“core” variable zuik. In fact, variables xui and yuik can be derived from the big-M reformulationconstraints (3.2.13), (3.2.14), (3.2.15), and puik comes as a “sub-core” optimization variable, which

CHAPTER 3. DYNAMIC RESOURCE ALLOCATION AND POWER MINIMIZATION INLTE DL FOR C-RAN 49
can be deduced from (3.2.7) and (3.2.9). We denote E0 the cost function (or energy) of this initialsolution and Tmax the maximum annealing temperature. We also define TSRu, the throughputsatisfaction rate of UE u, which represents the ratio of the number of its allocated PRBs on itsinitial demand Nu.
3.3.1.2 Neighborhood search structure
Here, we define our specific neighborhood search program to generate the states. We initiate theneighborhood generation by selecting a uniformly random UE u from the outputs of the initialsolution and by computing its TSRu. We define xu, yu and pu, the solution neighbors of xu, yu
and pu for UE u, as follows:
• Step 1: UE u changes its RRH attachment following a discrete Bernoulli distribution withparameter (1− TSRu). A new RRH attachment vector xu is generated from this probabilityand by selecting the available RRHs to whom u can be linked to based on its geographicalposition.
• Step 2: We keep the existing PRB allocation in the new RRH xui to other UEs untouched.For the available PRBs (yuik = 0), we select the eligible ones that can be allocated to UE u
based on the SINR constraint γuik ≥ Γuk , while determining for each one the minimal powerthat satisfies that constraint.
• Step 3: For the eligible PRBs that satisfy γuik ≥ Γuk , they are allocated to UE u following aBernoulli distribution with parameter TSRu×
γuikSNRmax
, where SNRmax = pmaxguik/σ
2 rep-resents the maximum Signal-to-Noise Ratio (SNR) achieved on UE u. This helps allocatingPRBs to UE u, with respect to other users existing allocation and possible interference. Afterthis, we set all allocated PRBs power levels to a unique one, corresponding to the highestlevel of the allocated PRBs (i.e., the maximum of all minimal powers that satisfy the SINRconstraint or each PRB).
3.3.1.3 Equilibrium state
After generating the new solution neighbors, a new cost function En is calculated. We increase theneighborhood search structure to other UEs if and only if the current solution does not improve theobjective function and satisfies the following equation:
exp(−En − E0
Tn) ≥ δ (3.3.29)
where δ is a random number in [0, 1], which refers to the random value of the equation to increasethe neighborhood states in the SA meta-heuristic to see whether exp(−∆E
T ) in equation (31) is close

50 3.3. PROPOSAL: DRAC-SA ALGORITHM
Figure 3.1 – DRAC-SA Flow Chart.
to 0 or 1, and thus accept increasing the neighborhood tree. Additionally, in each iteration n we usethe following cooling equation to decrease the temperature:
Tn ←Tn
ln(n)(3.3.30)
3.3.1.4 Stopping condition
Figure 3.1 illustrates our DRAC-SA algorithm flow-chart. The algorithm converges as soon as themaximum number of iteration nmax is elapsed, which corresponds to the maximum CPU time.Therefore, its value should be scalable based on the processing machine so as to not exceed thedelays of mobile users resources requests during their stay time in the system.

CHAPTER 3. DYNAMIC RESOURCE ALLOCATION AND POWER MINIMIZATION INLTE DL FOR C-RAN 51
3.3.2 MKP resolution
Once the C-RAPM problem is solved and the resources are allocated to UEs, the next step consistsin calculating the number of required BBUsNBBU to handle the total traffic load (3.2.23). Since theMKP problem (3.2.25)-(3.2.28) is a linear program, we used CPLEX to compute its solution. Thelatter was able to find optimal results with very low computation time nMKP very small comparedto nmax (nMKP nmax). Hence, by summing the two computation times, solutions for theC-RAPM and BBU-RRH associations can be dynamically found while respecting mobile usersrequests delays.
3.4 Performance evaluation
Table 3.1 – Simulation Parameters
Parameters ValuesNumber of RRHs 100
Bandwidth 20 MHzTotal number of PRBs 100
Power levels L 6p1(pmin)/p2/p3/p4/p5/p6(pmax) 0.1/1/5/10/15/20 mW
Constant α 0.5Path loss model 148.1 + 37.6log10(d), d in Km
Shadowing standard deviation 5 dBFading model Normal distribution N (0, I)Thermal noise −174 dBm/Hz
Transmit antenna power gain 8 dBiPoisson Parameter λ ∈ [1, 10] (default 5)
Departure rate µ = 0.1UE’s PRB demand Uniform distribution U(1, 25)BBU capacity W 1 (100%)
Initial hot temperature Tmax = 1000Max. number of iterations 1000
In this section, we evaluate the performance of our proposed DRAC-SA algorithm and comparethe benefits of our solution with respect to state-of-the-art schemes: QP-FCRA [36] and Itera-tive GSB [59] algorithms for solving the C-RAPM problem. We also include comparisons to thegreedy approach, which consists of the generated initial solutions of the DRAC-SA algorithm. Fur-thermore, we also compare to the optimal solution returned from previous DRAC approach in [43].The latter was run in offline mode due to its high computation time for the chosen system parame-

52 3.4. PERFORMANCE EVALUATION
ters. On another hand, we also compare the Semi-Static and Adaptive switching algorithms in [75]to the returned solutions of our MKP regarding the BBU-RRH assignment problem.
3.4.1 Simulation environment
For our experimental environment, we simulated a wireless LTE environment consisting of 100RRHs deployed in a 450 m × 450 m square grid. Each RRH has a coverage radius of 35 m andthe distance between two nearest RRHs is 50 m. We considered the following channel model [43]:hui = 10−L(dui )/20
√φui s
ui gui , where L(dui ) is the path-loss at distance dui between RRH i and UE
u, φui is the antenna gain, sui is the shadowing coefficient, and gui is the fading coefficient. Wegenerate a fixed poisson arrival rate of mobile users of λ = 5 arrivals per time, and vary at eachsimulation run the users’ stay time and service demand following an exponential and uniform laws,respectively. Note that UEs’ positions are randomly generated at each run and remain fixed duringtheir whole stay time in the network. The service demand of each user is expressed in terms ofnumber of PRBs from a downlink LTE frame of 100 PRBs and follows a uniform distribution from1 to 25 PRBs. We run 30 simulations for each scenario of SINR threshold Γ: 10 and 25 dB, toreach a confidence level of 97%. Table 3.1 reports the simulation parameters.
3.4.2 Performance metrics
In the next sections, we present the simulation results derived from our approach in terms of thefollowing performance metrics:
• Throughput Satisfaction Rate (TSR): As defined earlier, it denotes the satisfaction degree of aUE with respect to the initial demand Nu. For a UE u attached to RRH i, it can be expressedas follows:
TSRiu =∑k∈K
yuik/Nu (3.4.31)
• Spectrum Spatial Reuse (SSR): Denotes the average portion of RRHs using the same PRBand can be expressed as follows:
SSR =1
S ×K
N∑u=1
∑i∈S
∑k∈K
yuik (3.4.32)
• Transmitted power per RRH: We compute the discrete transmission power allocated to UEson each PRB. This latter parameter is computed to help emphasize the number of activeRRHs transmitting on each power level, the porting of inactive RRHs, and the total systemtransmission power.

CHAPTER 3. DYNAMIC RESOURCE ALLOCATION AND POWER MINIMIZATION INLTE DL FOR C-RAN 53
0
0.2
0.4
0.6
0.8
1
0 0.2 0.4 0.6 0.8 1
CD
F -
Pe
rce
nta
ge
of
UE
s
TSR
DRAC-SADRAC
GreedyGSB
QP-FCRA
0
0.2
0.4
0.6
0.8
1
0 0.2 0.4 0.6 0.8 1
CD
F -
Pe
rce
nta
ge
of
UE
s
TSR
DRAC-SADRAC
GreedyGSB
QP-FCRA
(a) SINR = 10 dB (b) SINR = 25 dB
Figure 3.2 – Throughput Cumulative Density Function
• Number of BBUs (NBBU ) calculated through (3.2.23), and the corresponding number ofassigned RRHs.
3.4.3 Simulation results
a) Throughput Satisfaction Rate (TSR)
Figure 3.2 shows the Cumulative Distributed Function (CDF) of the TSR. The CDFs of DRAC,GSB and QP-FCRA correspond to CDFs generated from offline resolutions, where we left thealgorithms methods running until the end results. We emphasize the fact that they are not applicablein real-time context due to their high computational time, and we only added them for the sake ofcomparison. We can observe, by comparing the CDF of the offline methods and the online Greedyand DRAC-SA’s ones, that for the latter, more than 50% of UEs have their TSR greater than 80%
and 70% in SINR threshold equal to 10dB and 25dB, respectively. The TSR is lessened to 60%
and 48% for QP-FCRA and GSB, respectively - as shown in Figure 3.2(a) - at low SINR threshold,and to 47% and 35%, respectively, in Figure 3.2(b), when the SINR threshold is high. Hence, ourproposed DRAC-SA approach outperforms both QP-FCRA and GSB schemes, and approaches aswell the highest throughput satisfaction rate given by DRAC, when the latter reaches the end of theresolution. However, we notice that the greedy online approach achieves better satisfaction rate athigh SINR regime than the offline GSB scheme. In fact, the latter emphasizes on turning off asmany as RRHs as possible to achieve maximum power savings, whereas the greedy approach turnsa large number of RRHs on to find quick solutions for the C-RAPM problem.

54 3.4. PERFORMANCE EVALUATION
10
100
1000
10000
100000
1e+06
10 100
CP
U t
ime (
ms)
Network density
DRACDRAC-SA
GreedyMKP resolution
Figure 3.3 – CPU time vs number of UEs
Table 3.2 – Mean Spectrum Spatial Reuse
SINR DRAC-SA DRAC Greedy QP-FCRA GSB10 dB 4.29 ± 0.12 4.55 2.45 ± 0.5 4.05 2.2525 dB 4.23 ± 0.15 4.55 2.45 ± 0.5 4.10 2.01
b) CPU time vs network density
As can be seen in Figure 3.3, the complexity evolution of DRAC-SA is polynomial in terms ofnetwork density, and is visibly lower than that of DRAC. The time computation results indicatethat the proposed DRAC-SA can solve the C-RAPM problem in less than 120 ms for a networkwith 100 mobile users. Besides, it can return solutions in a few milliseconds when the numberof active users is low (less than 20 mobile users). Overall, DRAC-SA achieves significantly highCPU time savings than DRAC, where the latter returns the optimum solutions after at least 1000 sfor the highest dense network (150 users). This makes the DRAC approach unpractical for onlineoptimization as it severely impacts the rate of served users and the global TSR, which will bedescribed later on.

CHAPTER 3. DYNAMIC RESOURCE ALLOCATION AND POWER MINIMIZATION INLTE DL FOR C-RAN 55
0
0.1
0.2
0.3
0.4
0.5
0.6
0.7
0 10 20 30 40 50 60 70 80 90 100
Sp
ectr
um
Sp
atia
l R
eu
se
Identifier Tile
DRAC-SADRAC
Greedy
Figure 3.4 – SSR per PRB for SINR = 25 dB
c) Spectrum Spatial Reuse (SSR)
Table 3.2 reports the SSR of all aforementioned approaches. The more a PRB is reused, the better isthe performance. Table 3.2 clearly shows that our proposal DRAC-SA fosters more PRBs reuse, bya factor of 1.06 and 1.91 compared to QP-FCRA and GSB approaches, respectively, at low SINRthreshold. When the SINR threshold is high, the reuse factor is enhanced by 1.03 and 2.13, respec-tively. We also notice that the gap between DRAC-SA’s SSR and DRAC’s is only of 5.71%, whichexhibits the good performance of our algorithm. We further extend the analysis by investigatinghow each PRB is reused in the network compared to the greedy and the optimal solutions. Figure3.4 shows that DRAC-SA improves the reuse factor up to 32% for PRBs that are less re-used withthe greedy method. In fact, DRAC-SA achieves globally 43.36% better performance in PRB reusethan the greedy approach. The confidence intervals also indicate that the DRAC-SA reuse factorcan reach the optimal for most PRBs.
d) Normalized throughput vs UEs demand
In order to illustrate how the allocated resources are affected by UEs’ demand volume, Figure 3.5presents the normalized throughput evolution as a function of UEs demands Nu, for both SINRregimes. Globally, QP-FCRA and GSB show a roughly constant behavior for SINR = 10 dB inFigure 3.5(a), with an emphasis on low PRB and high PRB demand, respectively, which may implythat their resource allocation is done independently of UEs’ PRBs demand. On the other hand,

56 3.4. PERFORMANCE EVALUATION
(a) SINR = 10 dB (b) SINR = 25 dB
Figure 3.5 – Throughput distribution as a function of user demands
DRAC-SA favors resource allocation of UEs with the highest demand Nu in order to increase theirtotal satisfaction rate. This is more clearly shown in the high SINR regime (Figure 3.5(b)), whereDRAC-SA favors high demands significantly more than DRAC and the other schemes. This maybe interpreted as unfair to users with low PRB demands. However, from a network managementperspective, it is a positive behavior as DRAC-SA can dismiss resource allocation to low userdemands that would cause interference to high-demanding users with greedy resource applications,and eventually increase their total transmitted power.
e) Transmitted Power per RRH
Figure 3.6 illustrates the percentage of RRHs transmitting on each transmission power. We remarkthat at low SINR regime (see Figure 3.6(a)), the majority of RRHs are transmitting on the lowestpower levels: pmin = 0.1mW and p2 = 1mW , whereas for most RRHs the greedy method favorsthe highest power level pmax = 20 mW , which results in a high total transmission power. What ismore, DRAC-SA focuses mostly on the second power level p1 = 1mW . At high SINR regime (seeFigure 3.6(b)), most approaches emphasize on higher transmission powers such as p4 = 15 mW
and pmax = 20 mW . By scattering the transmission powers on the lowest levels, our approachcan achieve less energy consumption compared to the greedy resolution method and QP-FCRA, asshown in Figure 3.7, which presents the total C-RAN transmitted power. We can remark that theGSB scheme realizes minimum power consumption, after DRAC, by switching off RRHs basedon their successive RRH selection algorithm. However, this is negatively reflected on the TSR ofmobile users, as seen in Figure 3.2, since they are less satisfied by their allocated PRBs. In fact,

CHAPTER 3. DYNAMIC RESOURCE ALLOCATION AND POWER MINIMIZATION INLTE DL FOR C-RAN 57
(a) SINR = 10 dB (b) SINR = 25 dB
Figure 3.6 – Percentage of RRHs vs transmission power levels
while the iterative GSB method fosters more RRHs switching off, it results in less transmissionpower consumption in the system, but severely impacts the throughput satisfaction for mobile usersdue to the dynamic scaling between power puik and PRB allocation yuik variables. The QP-FCRAapproach, on the other hand, supposes all RRHs are turned on, which leads to a higher powerconsumption but to a good TSR. As observed in Figure 3.2 and Figure 3.7, our proposed DRAC-SA scheme performs a good tradeoff between satisfaction rate and overall power consumption forboth SINR threshold levels.
f) Number of BBUs and on RRHs
Figure 3.8 illustrates the number of BBUs needed per time as well as the needed number of onRRHs to manage the traffic load at each instant, when the SINR threshold is equal to 25 dB. Theone-one mapping in conventional RAN imposes as many BBUs as deployed RRHs to handle theradio site coverage and the fluctuating traffic load. This imposes heavy investments from operatorsto manage their network and increase their total BBU equipment costs. As shown in the curve, thenumber of BBUs calculated from the output of DRAC-SA can achieve up to 86% and 92% BBUssavings compared to a RRH-based RAN scenario and a traditional D-RAN one.
For the BBU-RRH assignment problem, we solve the MKP in (26) using CPLEX, which wasable to find optimal results with very low computation time (at average 3 ms at each instant). Table3.3 presents the average number of BBUs and on RRHs as well as the minimum and maximumnumber of handled active RRHs per BBU. Clearly, DRAC-SA realizes more BBUs savings tohandle the same volume of traffic load with reduced number of RRHs. This not only improves thenetwork capacity, since many RRHs can be handled by the same BBU, but also helps maximizing

58 3.4. PERFORMANCE EVALUATION
Figure 3.7 – Total RRHs transmitted power
0
20
40
60
80
100
0 200 400 600 800 1000
Nu
mb
er
of
un
its
Time (s)
Number of BBUs with DRAC-SANumber of on RRHs with DRAC-SA
BBUs/RRHs in conventional RAN
Figure 3.8 – Number of needed BBUs and on RRHs per time
the efficiency of BBUs within the virtual pool.

CHAPTER 3. DYNAMIC RESOURCE ALLOCATION AND POWER MINIMIZATION INLTE DL FOR C-RAN 59
Table 3.3 – Number of BBUs and RRHs
Scheme Mean NBBU Mean on RRHs Max RRHs/BBUMKP 7.97 ± 0.06 55.4 ± 2.2 39
Semi-static 15.1 59.7 27Adaptive 13.5 62.4 28
g) Global TSR vs arrival rates
We vary next the arrival rates of mobile users in the system, where λ takes values in [1, 10]. Figure3.9 illustrates the evolution of the global TSR in both SINR regimes for each of DRAC-SA, DRACand the greedy approaches. As λ increases, more users penetrate the system, which leads to lesstime intervals between each user arrival. As stated before, a large proportion of new arrived usersare discarded by DRAC, since it is still solving the C-RAPM problem of the previous existingusers. What is more, starting from λ = 4, the global TSR returned by DRAC is severely impactedand results in more than 70% of UEs not served by the system. This is depicted in Figure 3.10,which illustrates the evolution of rejected users’ rate with different arrival rates. DRAC-SA, onthe other hand, clearly outperforms DRAC thanks to its reduced complexity and possible onlineoptimization, which provides a very global TSR at high arrival rate (74% and 61% for low and highSINR threshold, respectively) as well as a low rate of rejected UEs (14% and 19% for low and highSINR threshold, respectively).
h) Number of BBUs vs arrival rates
In the following, we present the variation of the number of BBUs as a function of the networkdensity for each arrival rate. Figure 3.11 presents the evolution of BBUs and the number of onRRHs in the system with the variation of the poisson arrival rate λ for SINR threshold equal to 25dB. The plot illustrates the evolution for the DRAC-SA and Greedy methods as well as the numberof BBUs required in case of the conventional RAN. The latter represents the number of on RRHs,which imposes the same number of BBUs due to the one-one mapping in D-RAN deployment. Aswe can observe, the number of instantiated BBUs for the DRAC-SA solutions achieves importantsavings in BBUs compared to the conventional scenario. On another hand, we can remark thatfor the highest arrival rate, λ = 10, the number of on BBUs is at its maximum capacity for theconventional case, whereas DRAC-SA and the greedy methods are still at 55% and 40% of thetotal system’s capacity, respectively. Therefore, it is up to the operator to manage his C-RANdeployment: wether is increasing the number of RRHs to satisfy maximum users, or turning themoff to achieve energy efficiency is the better choice.

60 3.5. CONCLUSION
0
0.1
0.2
0.3
0.4
0.5
0.6
0.7
0.8
0.9
1
1 2 3 4 5 6 7 8 9 10
Glo
bal T
SR
Arrival rate λ
DRAC-SA (10 dB)DRAC-SA (25 dB)
DRAC (10 dB)DRAC (25 dB)
Greedy (10 dB)Greedy (25 dB)
Figure 3.9 – Global TSR vs arrival rate
0
0.1
0.2
0.3
0.4
0.5
0.6
0.7
0.8
0.9
1
1 2 3 4 5 6 7 8 9 10
Rate
of
reje
cte
d U
Es
Arrival rate λ
DRAC-SA (10 dB)DRAC-SA (25 dB)
DRAC (10 dB)DRAC (25 dB)
Greedy (10 dB)Greedy (25 dB)
Figure 3.10 – Rejected users rate vs arrival rate
3.5 Conclusion
In this Chapter, we have presented a novel approach based on simulated annealing to address theproblem of dynamic resource allocation and power minimization in C-RAN for a dynamic flow

CHAPTER 3. DYNAMIC RESOURCE ALLOCATION AND POWER MINIMIZATION INLTE DL FOR C-RAN 61
0
10
20
30
40
50
60
70
80
90
100
1 2 3 4 5 6 7 8 9 10
Avera
ge n
um
ber
of
BB
Us
Arrival rate λ
DRAC-SAGreedy
Conventional RAN
Figure 3.11 – Number of BBUs vs arrival rate
of mobile UEs. Specifically, our newly improved DRAC-SA framework can quickly find the bestPRB allocation and transmission power strategy to cater to traffic demand, while satisfying indi-vidual SINR constraints and maximum power limitations. Besides, our approach can dynamicallydetermine the optimal number of RRHs to be turned on and the number of needed BBUs to han-dle the whole traffic load. Through our extensive event-based simulations, we have demonstratedthat our method finds several good balances regarding, firstly, throughput satisfaction rate and totaltransmitted power and, secondly, resolution time and global user satisfaction. In fact, DRAC-SAachieves 43.36% better performance in PRB distribution than a greedy approach, and only 5.71%
of difference is between the global optimum offline approach and DRAC-SA in terms of throughputsatisfaction. Besides, the number of BBUs calculated from DRAC-SA can help increase the BBUssavings to 85.6% compared to D-RAN scenarios.
In the next Chapter, we will build on the work carried out in this first stage by integrating twouser profiles in our problem: Gold and Best Effort, and considering a capacity-limited fronthaulnetwork between BBUs and RRHs. We will present a joint resource allocation and admissioncontrol scheme that can maximize the number of accepted users in the system subject to multi-userQoS requirements, transmission power and fronthaul links capacity constraints.

62 3.5. CONCLUSION

Chapter 4QoS-based resource allocationand admission control in C-RAN
Contents4.1 Introduction . . . . . . . . . . . . . . . . . . . . . . . . . . . . . . . . . . . . 63
4.2 System Model . . . . . . . . . . . . . . . . . . . . . . . . . . . . . . . . . . . 64
4.2.1 Problem formulation . . . . . . . . . . . . . . . . . . . . . . . . . . . . 64
4.2.2 MILP formulation . . . . . . . . . . . . . . . . . . . . . . . . . . . . . 67
4.3 RAAC Proposal . . . . . . . . . . . . . . . . . . . . . . . . . . . . . . . . . . 67
4.3.1 RAAC algorithm . . . . . . . . . . . . . . . . . . . . . . . . . . . . . . 67
4.3.2 Fast greedy heuristic for fronthaul admission control . . . . . . . . . . . 70
4.4 Performance evaluation . . . . . . . . . . . . . . . . . . . . . . . . . . . . . . 71
4.4.1 Simulation environment . . . . . . . . . . . . . . . . . . . . . . . . . . 71
4.4.2 Performance metrics . . . . . . . . . . . . . . . . . . . . . . . . . . . . 72
4.4.3 Simulation results . . . . . . . . . . . . . . . . . . . . . . . . . . . . . 73
4.5 Conclusion . . . . . . . . . . . . . . . . . . . . . . . . . . . . . . . . . . . . . 81
4.1 Introduction
In this Chapter, we address the problem of DL resource allocation and admission control for afronthaul-constrained C-RAN. Specifically, we consider the Resource Allocation and AdmissionControl (RAAC) of two sets of mobile users profiles: Gold (Guaranteed-service) and Best Effort.We define our optimization problem subject to constraints on mobile users resource demands, max-imum transmission power and fronthaul links capacity. By dropping the non-linear logarithmic
63

64 4.2. SYSTEM MODEL
constraint induced by the data-rate constraint on the fronthaul links, we propose a two-stage frame-work to efficiently solve the problem. We have previously attempted to solve this problem in [45]with Best effort mobile users, however the power minimization aspect was not taken into account.In this Chapter, we enhance the problem solutions by including the transmission power minimiza-tion in our design, without further increasing complexity. Numerical results from event-basedsimulation demonstrate the superior performance of our RAAC proposal in terms of computationtime, number of accepted users and total transmission power, when compared with state-of-the-artmethods used for the admission control task in C-RAN.
This Chapter is organized as follows: Section 4.2 presents the physical layer assumptions andthe mathematical formulation of our system model. In section 4.3, we describe our framework andproposed algorithms to solve the optimization problem. Performance evaluation of our proposedalgorithms is discussed in section 4.4, followed by section 4.5 that concludes the Chapter.
4.2 System Model
In this section, we firstly discuss the physical layer assumptions and constraints of our considereddownlink OFDMA fronthaul-constrained C-RAN system model. Then, we formally describe theproblem under consideration and present two formulations of it.
4.2.1 Problem formulation
A C-RAN architecture similar to Figure 4.1 with UE-cell split is deployed in an area consisting ofS RRHs. Each RRH i, from the set S = i|1 ≤ i ≤ S, is responsible for the radio coverage ofone hexagonal-sized cell. We denote by K the number of available baseband resources, known asPRBs, assigned by the BBU pool to all S RRHs. The cloud jointly assigns to all RRHs the samepool of resources, which means that each RRH in the system has the same capacity in terms ofPRBs that can be delivered to its attached UEs. We suppose that each RRH i handles one cell ina delimited area, and that a UE u can only be served by one RRH that covers the area the UE ispositioned within. We denote by U the set of UEs in the whole system and U i the set of UEs in thecoverage area of RRH i. We have |U| =
∑Si=1 |U i|, where |U i| is the cardinality of the set U i.
All UEs are categorized into two different sets of user profiles: Gold users, denoted by the setUG, and Best Effort user, denoted by the set UBE . Each UE u ∈ U (i.e., UG ∪ UBE) requests fromits serving RRH a number of resources nGu or nBEu , for a Gold or Best-effort user, respectively. Asa rule of thumb, Gold users must be served exactly the same number of requested PRBs, nGu , inorder to run their mobile applications. Meanwhile, Best-effort users are served the best the systemcan regarding the other transmission constraints imposed on the C-RAN. We assume that each userdevice, be it Gold or Best Effort, can only be connected and served by at most one RRH based onits geographical position. Let yuk be the binary decision variable, which is equal to 1 if PRB k is

CHAPTER 4. QOS-BASED RESOURCE ALLOCATION AND ADMISSION CONTROL INC-RAN 65
Figure 4.1 – Considered C-RAN Architecture
allocated to UE u ∈ U , or 0 otherwise. We define another new binary variable zu, which is equalto 1 if Gold user u is accepted, (i.e., it received all of the requested PRBs
∑Kk=1 y
uk = nGu ), or
0 otherwise. The transmitted power regarding the resource allocation, independently of the user’sprofile, is defined as follows:
puk =
p ∈ [pmin, p
imax], if yuk = 1,
0, otherwise.(4.2.1)
where pmin is the minimum power that UE u can receive, and pimax is the maximum power allowedto be transmitted from a RRH i. We define the received Signal-to-Interference-plus-Noise Ratio(SINR) for UE u on PRB k as follows:
γuk =pukg
uk∑
u′ 6=upu
′k g
uk + σ2
(4.2.2)
where guk is the path gain coefficient of UE u and PRB k, and σ2 is the noise power.
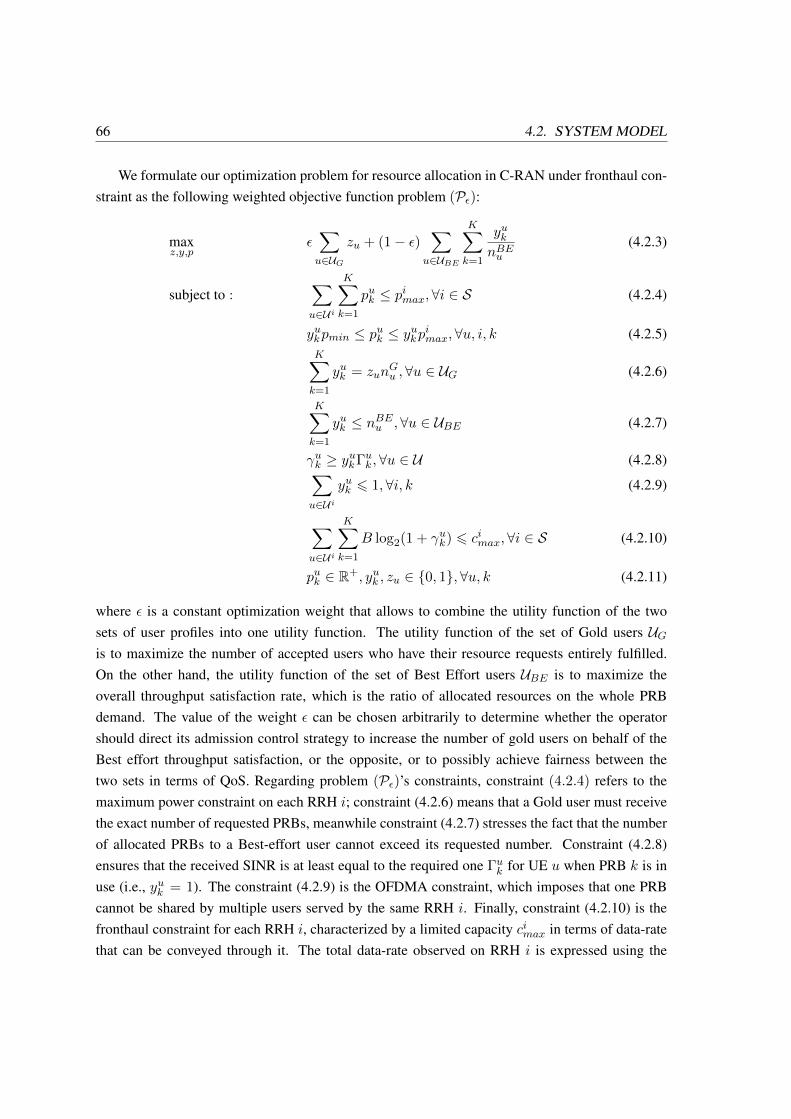
66 4.2. SYSTEM MODEL
We formulate our optimization problem for resource allocation in C-RAN under fronthaul con-straint as the following weighted objective function problem (Pε):
maxz,y,p
ε∑u∈UG
zu + (1− ε)∑
u∈UBE
K∑k=1
yuknBEu
(4.2.3)
subject to :∑u∈U i
K∑k=1
puk ≤ pimax,∀i ∈ S (4.2.4)
yukpmin ≤ puk ≤ yukpimax, ∀u, i, k (4.2.5)K∑k=1
yuk = zunGu ,∀u ∈ UG (4.2.6)
K∑k=1
yuk ≤ nBEu ,∀u ∈ UBE (4.2.7)
γuk ≥ yukΓuk ,∀u ∈ U (4.2.8)∑u∈U i
yuk 6 1,∀i, k (4.2.9)
∑u∈U i
K∑k=1
B log2(1 + γuk) 6 cimax,∀i ∈ S (4.2.10)
puk ∈ R+, yuk , zu ∈ 0, 1,∀u, k (4.2.11)
where ε is a constant optimization weight that allows to combine the utility function of the twosets of user profiles into one utility function. The utility function of the set of Gold users UGis to maximize the number of accepted users who have their resource requests entirely fulfilled.On the other hand, the utility function of the set of Best Effort users UBE is to maximize theoverall throughput satisfaction rate, which is the ratio of allocated resources on the whole PRBdemand. The value of the weight ε can be chosen arbitrarily to determine whether the operatorshould direct its admission control strategy to increase the number of gold users on behalf of theBest effort throughput satisfaction, or the opposite, or to possibly achieve fairness between thetwo sets in terms of QoS. Regarding problem (Pε)’s constraints, constraint (4.2.4) refers to themaximum power constraint on each RRH i; constraint (4.2.6) means that a Gold user must receivethe exact number of requested PRBs, meanwhile constraint (4.2.7) stresses the fact that the numberof allocated PRBs to a Best-effort user cannot exceed its requested number. Constraint (4.2.8)ensures that the received SINR is at least equal to the required one Γuk for UE u when PRB k is inuse (i.e., yuk = 1). The constraint (4.2.9) is the OFDMA constraint, which imposes that one PRBcannot be shared by multiple users served by the same RRH i. Finally, constraint (4.2.10) is thefronthaul constraint for each RRH i, characterized by a limited capacity cimax in terms of data-ratethat can be conveyed through it. The total data-rate observed on RRH i is expressed using the

CHAPTER 4. QOS-BASED RESOURCE ALLOCATION AND ADMISSION CONTROL INC-RAN 67
Shanon formula:∑
u∈U i
∑Kk=1B log2(1 + γuk), where B is the downlink channel bandwidth. On
another note, with the total accumulated traffic load observed at each RRH, we can also estimatehere the number of needed BBUs in the BBU pool to manage the whole C-RAN traffic, using thesame formula in (3.2.23).
4.2.2 MILP formulation
For simplification purpose, it will be helpful to rewrite the SINR constraint (4.2.8) as follows:
(1 +1
Γuk)pukg
uk ≥ yuk (
∑v∈U
pvkguk + σ2), ∀u ∈ U (4.2.12)
Since variable p is explicitly bounded, the product between binary and continuous variablesin (4.2.12) can be linearized using the big-M modelling, as performed in the previous Chapter.With this reworking, everything in problem (Pε) is linear, except the fronthaul constraint (4.2.10).Besides, problem (Pε) is a MINLP, whose solution is intractable due to its combinatorial nature.What is more, problem (Pε) is NP-hard [41]. We propose next, to drop constraint (4.2.10), whichwill be taken into account later in the fronthaul admission control algorithm, and to formulate thefollowing MILP problem (Pε′):
maxz,y,p
ε∑u∈UG
zu + (1− ε)∑
u∈UBE
K∑k=1
yuknBEu
(4.2.13)
subject to : (4.2.4)− (4.2.7), (4.2.9), (4.2.11), (4.2.12) (4.2.14)
We detail in the next section, the proposed methodology to solve our MILP problem.
4.3 RAAC Proposal
In this section, we present our two-stage framework to solve problem (Pε′). We present in subsec-tion 4.3.1 the first stage of our Resource Allocation and Admission Control (RAAC) proposal. Thelatter is based on two combined algorithms to solve the MILP problem (Pε′) while minimizing thetransmission power. Afterwards, we detail in subsection 4.3.2 the second stage of our proposal,where a fast greedy heuristic is used to solve the fronthaul admission control problem.
4.3.1 RAAC algorithm
To find solutions to the MILP problem formalized in (Pε′), we design an algorithm based on theBranch-and-Cut (B&C) framework to solve the relaxed MILP, which includes the objective func-tion (4.2.14) and the constraints (4.2.4)-(4.2.7), (4.2.9),(4.2.11),(4.2.12). The proposed modifiedB&C method, whose pseudo-code is presented in Algorithm 6, is considered as a powerful algo-rithm that merges the advantages of both the Gomory Cutting Planes and the Branch-and-Bound

68 4.3. RAAC PROPOSAL
Algorithm 6: Modified B&C algorithm
1: Inputs: RRHs S, PRBs K, channel gain g, power Pmax, pmin, SINR threshold Γ, noise σ2,PRB demands nBE , nBE , ε.
2: Outputs: incumbent (y∗,p∗, z∗).3: I. Initialization:4: Denote the initial problem P0 and the set of active problem nodes to be L = P0.5: Let the initial value set of variables y∗ = ∅, p∗ = ∅ and the initial lower bound LB = −∞.
Set f∗ = −∞ the initial value of objective function.6: II. Iteration: do7: while Number of iterations ≤ Imax do8: Select and delete a problem P l from L.9: Solve P lR, relaxed version of P l, where y takes continuous values between 0 and 1.
10: if P lR is infeasible, go back to step 3. else denote the optimal solution ylR and plR withobjective function value f .
11: if f ≤ f∗ go back to step 3.12: if ylR is integer, set f∗ ← f and y∗ ← y. Go back to step 3.13: If desired, search for cutting planes from previous dropped constraints that are violated by
ylR; if any are found, add them to the relaxation and return to step 3.14: Branch to partition the problem into new problems with restricted feasible regions. Add
these problem to L and go back to step 3.15: Go to the next iteration.16: end while
schemes into one design [88]. This leads to an algorithm that is not only more reliable, but alsomuch faster than the conventional Branch-and-Bound alone. As detailed, in Algorithm 6, the B&Calgorithm is based on a linear relaxation of the integer variables y into continuous ones, whileadding Cutting Planes to enhance the problem’s relaxation. This is essential to come closer to ap-proximate integer solutions and speed up the convergence time. We also add an upper bound limitImax for the algorithm’s maximum number of iterations. In fact, according to [89], UEs connectedto a RRH wait in maximum 10 s to receive their requested resources before disconnecting. If noresource transmission has been fulfilled within this time window, the BBU, and consequently theRRH handling the user, will release the connection and disconnect from the user. Therefore, thenumber of iterations Imax should be scalable based on the processing machine so as to not exceedthe 10 s waiting period [89].
If found, we call the best solution (i.e., (y∗,p∗, z∗)), returned by the B&C algorithm, theincumbent. This solution is however not optimal with respect to the minimization of the total C-RAN transmission power. In order to improve the solution and without adding further complexityto the problem, we propose to attempt to solve, after each resolution of the MILP problem (Pε′),the following Linear Program (LP) problem:

CHAPTER 4. QOS-BASED RESOURCE ALLOCATION AND ADMISSION CONTROL INC-RAN 69
Algorithm 7: RAAC algorithm
1: Inputs: RRHs S, PRBs K, channel gain g, power pmax, pmin, SINR threshold Γ, noise σ2,PRB demands nBE , nBE , ε, tolerance δ.
2: Outputs: near optimal solution (y∗,p′, z∗).
3: Initialization:4: Set L← 0 and construct MILP (Pε′);5: repeat6: solve MILP problem (Pε′) with B&C (see Alg. 6);7: if MILP is infeasible then8: output: ”Problem is infeasible” and quit;9: end if
10: let (y∗,p∗, z∗) be the optimal solution to the MILP and U the associated upper bound;11: solve the LP problem (15) using ILOG CPLEX to find the best p for given y∗;12: if LP is feasible then13: let p
′be the optimal LP solution;
14: L′
the associated lower bound;15: end if16: if L′ ≥ L then17: L← L
′;
18: save new incumbent (y∗,p′, z∗);
19: end if20: until L ≥ 0 and (U − L)/L ≤ δ;
minp
∑u∈U
∑k∈Ku
puk (4.3.15)
subject to :∑u∈U i
∑k∈Ku
puk ≤ pimax,∀i ∈ S (4.3.16)
(1 +1
Γuk)pukg
uk ≥
∑v∈U
pvkguk + σ2,∀u,∀k ∈ Ku (4.3.17)
puk ∈ R+ (4.3.18)
whereKu = k ∈ K|yuk = 1 is the set of PRBs that have been allocated to UE u in the initial MILPsolution. Since it is a LP problem with finite number of variables, it can be solved very rapidly usingmodern LP solvers such as ILOG CPLEX. Solving this LP problem, given the resource allocationsolution y∗ of the MILP, helps to ensure that the power minimization is also achieved, while re-specting the SINR requirements of all users. Furthermore, we define in our RAAC algorithm atolerance parameter δ as the acceptable gap between U and L, respectively the upper and lowerbounds of the objective function of problem (Pε′). The overall RAAC algorithm for solving bothproblem (Pε′) and the power minimization problem is summarized in Algorithm 7. Besides, as

70 4.3. RAAC PROPOSAL
Algorithm 8: FFAC1: Inputs: S, data-rates c, RRHs fronthaul constraint cmax2: Outputs: number of admitted Gold and Best Effort users; fronthaul links supported data-rate
of each RRH.3: for each RRH i ∈ S do4: sort in an increasing order elements of cG and cBE , achieved data-rates of Gold and Best
Effort users, respectively;5: l← 0; u← 1; v ← 1;6: while l ≤ cimax and u < |cG|+ 1 do7: if l + cG(u) ≤ cimax then8: l← l + cG(u);9: u← u+ 1;
10: if u = |cG|+ 1 or l + cG(u) > cimax then11: while l ≤ cimax and v < |cBE |+ 1 do12: if l + cBE(v) ≤ cimax then13: l← l + cBE(v);14: v ← v + 1;15: else16: break;17: end if18: end while19: end if20: end if21: end while22: end for23: Return u− 1 number of admitted Gold and v − 1 number of admitted Best effort users.
will be detailed next section in the simulation results, it turns out to be an exact algorithm, which iscapable of solving realistic size instances of the MILP problem to proven optimality in reasonabletime for different network sizes.
4.3.2 Fast greedy heuristic for fronthaul admission control
The following phase of our proposal is to find a feasible solution to the initial problem (Pε),including the dropped fronthaul constraint (4.2.10). Towards this end, we propose a Fast greedyheuristic for Fronthaul Admission Control (FFAC) of each RRH, based on the achieved data-rateof the accepted UEs. The FFAC heuristic’s pseudo-code is described in Algorithm 8. It is basedon taking the returned values of (y∗,p
′) from Algorithm 7 to compute the achieved data-rate cu of
UE u over its allocated set of baseband resources Ku = k ∈ K|yuk = 1 and received SINR γuk .

CHAPTER 4. QOS-BASED RESOURCE ALLOCATION AND ADMISSION CONTROL INC-RAN 71
The achieved data-rate can be expressed by the Shanon formula as follows:
cu =∑k∈Ku
B log2(1 + γuk), u ∈ U (4.3.19)
The algorithm starts by sorting separately the data-rates of Gold (cG) and Best effort users (cBE).The algorithm works similarly to a greedy knapsack algorithm [90] where it admits, firstly, as manyGold users as possible until it reaches the fronthaul capacity cimax of RRH i on the uth ordered usercG(u). If the capacity is still not achieved, the algorithm moves to accept, in an increasing orderof data-rate cBE , the remaining Best Effort users linked to the same RRH. We remarked that,with a realistic network size and a relatively loose fronthaul constraint, instance of the problemcan be solved in a fraction of a second, which is 10 times lesser than the maximum computationperiod [89]. Complexity analysis will be presented with more details in the next section.
4.4 Performance evaluation
In this section, we evaluate the performance of our proposed RAAC and FFAC algorithms, andcompare the benefits of our solution with respect to the Semi-Definite Positive Relaxation basedAlgorithm (SDPRA) and Fast Greedy Algorithm (FGA), which have been presented in [70] foradmission control in C-RAN. We also compare our approach with the optimal solution returned byCPLEX, when the software is used to solve the MILP problem (Pε′).
4.4.1 Simulation environment
Table 4.1 reports the simulation parameters that have been used for our event-base simulations. Wesimulate a wireless LTE C-RAN environment similar to Figure 4.1, consisting of 19 hexagonal-sized RRHs. Each RRH has the same radius Rradius and the distance between two nearest RRHsis 2d, where Rradius = 2d/
√3, for all RRHs in S. We simulated two poissonian flows of mobile
users; λG and λBE the arrival rates of Gold and Best Effort users, respectively. We vary at eachsimulation instance, the users stay time and service demand following an exponential and uniformlaws, respectively. Note that UEs positions are randomly generated at each simulation instance,and remain fixed during their whole stay time in the network. We suppose that the required SINRthreshold for all UEs is the same, denoted by γth.
For each simulation instance, we run our algorithms at each user arrival until either the problemis solved, or the gap between U and L, measured by a percentage of L is below δ, or the problemwas proved to be infeasible, or we exceeded the maximum limit of number of iterations Imax. Theresults are obtained over 30 simulation instances for each scenario of SINR threshold γth andCmax,with a confidence interval of 95%. Repeated simulations helped us to fix the maximum number ofiterations Imax to 500 for Algorithm 6, which allowed us to find close to optimal solutions whilerespecting the maximum time budget.

72 4.4. PERFORMANCE EVALUATION
Table 4.1 – Simulation Parameters
Parameters ValuesNumber of hexagonal cells R = 19
Arrival rates of Gold UEs λG 1 arrivals per secondArrival rates of Best Effort UEs λBE 2 arrivals per second
Departure rate (for both profiles) Exponential distribution µ = 0.1
Time window 3000 secondsBandwidth B = 5 MHz
Total number of PRBs K = 24
Gold UE PRB demand Uniform distribution in [1, 15]
Best Effort UE PRB demand Uniform distribution in [1, 10]
Path loss between RRH i and UE u 43.8 + 36.8log10(di,u)
Carrier frequency 2.5 GHzThermal noise −174 dBm/Hz
pimax 10 W , ∀i ∈ Spmin 1 mW
Distance d 250 mWeight constant ε 0.5
Tolerance parameter δ 0.1%
4.4.2 Performance metrics
In what follows, we present the corresponding numerical results in terms of:
• Convergence time t to solve problem (Pε′).
• Number of accepted Gold UEs NaGUE : This metric denotes the percentage of Gold usersadmitted in the network during the resolution period. Recall that, All Gold users will havetheir resource demand 100% satisfied.
• Throughput Satisfaction Rate of Best Effort UEs TSRBE (note that the TSRGUE of GoldUEs is equal to 1): This metric is similar to the one seen previously in Chapter 3 and repre-sents the ratio of allocated PRBs to Best Effort users on their requests.
• Total transmission power in the C-RAN Tpower: It represents the sum of all RRHs transmis-sion powers.
Tpower =∑u∈U
∑k∈Ku
puk (4.4.20)
• Number of BBUsNBBU in the cloud: Calculated through the formula in (3.2.23) in previousChapter.

CHAPTER 4. QOS-BASED RESOURCE ALLOCATION AND ADMISSION CONTROL INC-RAN 73
10
100
1000
10000
10 100
CP
U t
ime (
ms)
Network density
RAACCPLEXSDRPA
FGAFFAC
Figure 4.2 – CPU time vs. network density
Table 4.2 – Average CPU time comparison
RAAC CPLEX t2/t1Average computation time t1 = 37.9 ms t2 = 1703.5 ms 44.9
4.4.3 Simulation results
a) Convergence time
First of all, we find it is interesting to start presenting the convergence time of the different studiedschemes as well as IBM’s ILOG CPLEX. Considering our event-based simulation, we start theproblem resolution each time a new user enters the network. Each algorithm is thus executed tosolve the problem while considering all the existing users at that time instant a new UE enters thesystem. In Figure 4.2, the evolution of convergence time as a function of the network density isdepicted in a logarithmic scale for all approaches. The overall results indicate that the proposedRAAC method (along with the FFAC, which has very small computation time) can solve the re-source allocation and admission control problem much faster than any other scheme. In fact, forthe highest network density of 150 UEs, it can return the problem’s solutions in less than 100 ms.Besides, our approach achieves 44.9 more CPU time savings compared to CPLEX, as presented in

74 4.4. PERFORMANCE EVALUATION
30
40
50
60
70
80
90
100
5 10 15 20 25
Perc
en
tag
e o
f ad
mit
ted
Go
ld U
Es (
%)
Target QoS γ in dB
RAAC w/ perfect FH capacityRAAC + FFAC
SDPRAFGA
Figure 4.3 – Percentage of admitted UEs versus target QoS with fixed fronthaul capacity Cmax =500 Mbps.
Table 4.2. Besides, IBM’s ILOG CPLEX appears to be unpractical for being used, since it takessignificantly high time to return the optimum solution (up to 1.6× 10⁴ ms for the highest networkdensity), which severely impacts the rate of served users and the global TSR as will be describedlater on.
b) Number of admitted Gold users
Figure 4.3 shows the evolution of the percentage of NaGUE versus the QoS target for the threestudied schemes, when the fronthaul capacity is fixed at Cmax = 500 Mbps for each RRH. For thesake of comparison, we also add the curve for the perfect fronthaul links capacity scenario (i.e.,Cmax =∞). As we can observe, the number of admitted Gold UEs decreases with the increase ofthe target QoS level. Our proposed RAAC scheme with fixed fronthaul capacity results in increasednumber of supported users; up to 44% and 36.4% more admitted UEs compared to the SDPRAand FGA schemes, respectively. The gap of NaGUE between RAAC’s fixed and perfect fronthaullinks capacity is at maximum 23.4%. We can remark that [70]’s FGA results surprisingly in moreaccepted UEs than the superior SDPRA scheme. This is due to the latter’s higher convergencetime, as highlighted in Figure 4.2, which resulted in discarded users during the problem resolution.We vary next the fronthaul capacity Cmax (which can be equivalent to different functional splits),

CHAPTER 4. QOS-BASED RESOURCE ALLOCATION AND ADMISSION CONTROL INC-RAN 75
0
10
20
30
40
50
60
70
80
90
100
5 10 15 20 25
Perc
en
tag
e o
f ad
mit
ted
UE
s (
%)
Target QoS γ in dB
RAAC - Cmax = 100 MbpsRAAC - Cmax = 1 Gbps
SDPRA - Cmax = 100 MbpsSDPRA - Cmax = 1 GbpsFGA - Cmax = 100 Mbps
FGA - Cmax = 1 Gbps
Figure 4.4 – Percentage of admitted UEs versus target QoS.
and study its impact on the percentage of accepted UEs. Figure 4.4 illustrates the percentage ofNaGUE versus γth for low (Cmax = 100 Mbps) and high (Cmax = 1 Gbps) fronthaul capacities.We remark that the number of supported UEs increases when the fronthaul network allows moredata-rate to be conveyed from the BBU cloud to the RRHs. As a result, this enables the C-RAN toallocate more PRBs to mobile users and fully satisfy their QoS requirement. Moreover, we noticethat RAAC outperforms both SDPRA and FGA, as it achieves relatively, when Cmax = 100 Mbps,the same results as the Cmax = 1 Gbps SDPRA and FGA outputs. Besides, we can remark thatRAAC accepts approximately the same number of users for Cmax = 1 Gbps as the perfect capacityscenario. This assesses the scalability of our proposal regarding increasing network traffic andfronthaul capacity.
c) Throughput satisfaction rate of Best Effort users
Figure 4.5 shows the Cumulative Distributed Function (CDF) of the average TSRBE , which is theratio of the average number of allocated PRBs to the total initial demands of Best Effort UEs. Inthis case, we fixed the fronthaul capacity at Cmax = 500 Mbps and considered one QoS thresholdγth = 15 dB for all Best effort users. We can observe by comparing the CDF of the three methods,that RAAC yields more UEs satisfaction compared to SDPRA and FGA. In fact, we can observethat more than 50% of UEs have their TSR greater than 55% with RAAC combined with FFAC.

76 4.4. PERFORMANCE EVALUATION
0
0.2
0.4
0.6
0.8
1
0 0.2 0.4 0.6 0.8 1
CD
F -
Perc
en
tag
e o
f U
Es
TSR
RAAC + FFACRAAC
FGASDPRA
Figure 4.5 – Throughput Cumulative Density Function for Best Effort UEs.
This throughput is lessened to 46% and 34% with FGA and SDPRA, respectively. It is no surpriseto see again FGA outperforming SDPRA due the difference in their computation time. On anothernote, we can remark that the TSR returned by RAAC alone (corresponding to perfect fronthaullinks capacity) is greater than any other scheme. In fact, there is a gap of 27% between the twofronthaul capacity scenarios, since some users have been discarded due to the admission controlmechanism, which fosters on Gold users admission.
d) Sensibility analysis of TSR
In Figure 4.6, we study the evolution of TSRBE while variating the optimization weight ε. Thevalue of ε allows us to combine the utility function of the two sets of user profiles into one utilityfunction instead of two. As can be seen, setting ε to 1 forces the average TSRBE to zero, sincethe problem has focused on only maximizing the number of accepted Gold users NaGUE , and vice-versa. A decrease of ε will lessen the average NaGUE to the profit of TSRBE . However, as can beobserved, the latter can hardly reach 100% even for the highest fronthaul capacity (i.e., Cmax = 1
Gbps) due to power and interference limitations. A tradeoff between TSRBE and NaGUE can bemet by setting ε in the set [0.4; 0.5].
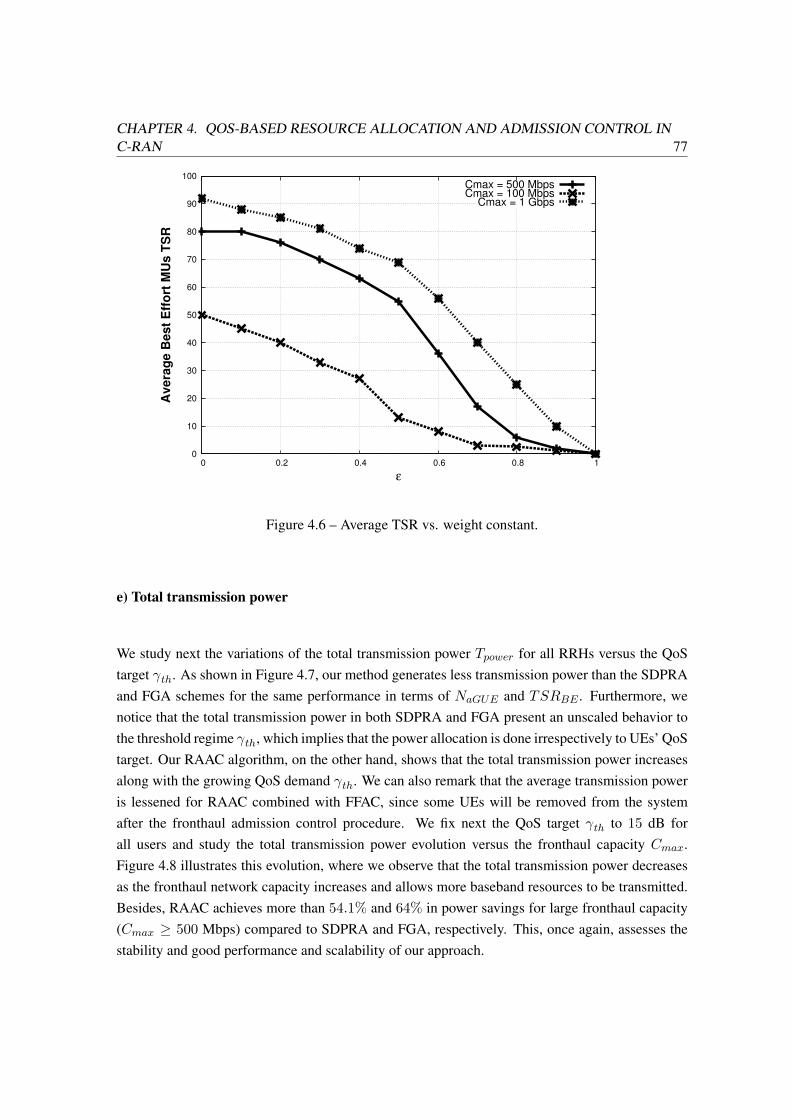
CHAPTER 4. QOS-BASED RESOURCE ALLOCATION AND ADMISSION CONTROL INC-RAN 77
0
10
20
30
40
50
60
70
80
90
100
0 0.2 0.4 0.6 0.8 1
Avera
ge B
est
Eff
ort
MU
s T
SR
ε
Cmax = 500 MbpsCmax = 100 Mbps
Cmax = 1 Gbps
Figure 4.6 – Average TSR vs. weight constant.
e) Total transmission power
We study next the variations of the total transmission power Tpower for all RRHs versus the QoStarget γth. As shown in Figure 4.7, our method generates less transmission power than the SDPRAand FGA schemes for the same performance in terms of NaGUE and TSRBE . Furthermore, wenotice that the total transmission power in both SDPRA and FGA present an unscaled behavior tothe threshold regime γth, which implies that the power allocation is done irrespectively to UEs’ QoStarget. Our RAAC algorithm, on the other hand, shows that the total transmission power increasesalong with the growing QoS demand γth. We can also remark that the average transmission poweris lessened for RAAC combined with FFAC, since some UEs will be removed from the systemafter the fronthaul admission control procedure. We fix next the QoS target γth to 15 dB forall users and study the total transmission power evolution versus the fronthaul capacity Cmax.Figure 4.8 illustrates this evolution, where we observe that the total transmission power decreasesas the fronthaul network capacity increases and allows more baseband resources to be transmitted.Besides, RAAC achieves more than 54.1% and 64% in power savings for large fronthaul capacity(Cmax ≥ 500 Mbps) compared to SDPRA and FGA, respectively. This, once again, assesses thestability and good performance and scalability of our approach.

78 4.4. PERFORMANCE EVALUATION
0
20
40
60
80
100
120
140
160
180
200
5 10 15 20 25
To
tal T
ran
sm
issio
n P
ow
er
in W
Target QoS γ in dB
RAAC + FFACRAAC
SDPRAFGA
Figure 4.7 – Total transmission power versus target QoS with fixed fronthaul capacity Cmax = 500Mbps.
f) BBUs average utilization
Figure 4.9 illustrates the number of BBUs needed per time unit as well as the needed number ofon RRHs to manage the traffic load at each UE’s arrival, when the SINR threshold is equal to 15dB and the fronthaul links capacity to Cmax = 500 Mbps for all RRHs. We can remark that thenumber of RRHs is set dynamically at each instant to serve the overall traffic load. What is more,only a small number of BBU (lesser than one) is needed to handle it. For further investigation,we present in Figure 4.10 the variation of number of needed BBUs for (RAAC+FFAC) and D-RAN scenario versus the QoS target, for fixed fronthaul capacity Cmax = 500 Mbps. Providedthe fronthaul links have sufficient capacity, one BBU can handle the traffic load of different RRHs,while meeting the existing users’ data rate requirements. We see in Figure 4.10 that, at maximum,only 80% of a full BBU usage is needed to handle the traffic load of all RRHs. After the fronthaullimit is reached for γth = 12 dB, the percentage of BBU usage is lessened since more users willbe rejected from the system because of their high QoS demand and/or their interference to otherUEs. NBBU stabilizes then to 58%-60% of a single BBU usage, which represents 76% savingscompared to D-RAN scenario.

CHAPTER 4. QOS-BASED RESOURCE ALLOCATION AND ADMISSION CONTROL INC-RAN 79
20
40
60
80
100
120
140
160
180
200
100 200 300 400 500 600 700 800 900 1000
To
tal T
ran
sm
issio
n P
ow
er
in W
Fronthaul Capacity (Mbps)
RAAC + FFACRAAC
SDPRAFGA
Figure 4.8 – Total transmission power versus fronthaul capacity Cmax
0
2
4
6
8
10
12
14
16
0 500 1000 1500 2000 2500 3000
Nu
mb
er
of
un
its
Time (s)
Number of BBUsNumber of on RRHs
Figure 4.9 – Number of BBUs vs. time

80 4.4. PERFORMANCE EVALUATION
0.2
0.3
0.4
0.5
0.6
0.7
0.8
0.9
1
5 10 15 20 25
BB
U u
sag
e
Target QoS γ in dB
RAAC + FFACTraditional RAN
Figure 4.10 – Number of BBUs versus target QoS for Cmax = 500 Mbps.
0.2
0.4
0.6
0.8
1
1.2
1.4
100 200 300 400 500 600 700 800 900 1000
BB
U u
sag
e
Fronthaul Capacity (Mbps)
RAAC + FFACSDPRA
FGARAAC
Figure 4.11 – Number of BBUs versus fronthaul capacity Cmax.
CHAPTER 4. QOS-BASED RESOURCE ALLOCATION AND ADMISSION CONTROL INC-RAN 81
g) BBUs usage versus fronthaul capacity
We present next the evolution of NBBU when the fronthaul capacity Cmax varies for a fixed QoStarget γth = 15 dB. Figure 4.11 depicts this evolution for RAAC+FFAC, RAAC alone and thetwo state-of-the-art schemes. We can remark that RAAC+FFAC realizes the minimum number ofinstantiated BBUs usage in the cloud compared the other schemes. When the fronthaul capacitylimit grows, it is shown that RAAC+FFAC, SDPRA and FFAC all converge to approximately thesame value of 75% of BBU usage. On another hand, if we consider an unconstrained fronthaulnetwork (i.e., CPRI), the RAAC scheme alone can exhibit the optimal percentage of needed BBUusage in the cloud, up to 1 and 25% of a second BBU, that can accept all mobile users and guaranteetheir QoS.
4.5 Conclusion
This Chapter has presented a novel framework for jointly addressing the resource allocation, ad-mission control and power minimization problems in C-RAN, considering multi-users QoS require-ments, power and fronthaul network limitations constraints. We presented a dynamic algorithm tosolve the problem in real-time. Numerical results have confirmed the superior performances of ourproposed RAAC approach, which increases users’ admission by 44% and 36%, and saves 54% and64% more C-RAN transmission power compared to the SDPRA and FGA schemes, respectively.We also highlighted the benefits of our proposal regarding the number of BBUs’ reduction in thecloud, when compared to the previous approaches and the Distributed RAN scenario.
In the next Chapter, we will investigate the BBU selection problem from different CSPs whilejointly considering several important challenges such as BBU processing power to handle time-varying traffic loads, BBU pool resiliency, processing and cost budgets.

82 4.5. CONCLUSION

Chapter 5An optimization scheme forcost-resilience BBU selection inC-RAN
Contents5.1 Introduction . . . . . . . . . . . . . . . . . . . . . . . . . . . . . . . . . . . . 83
5.2 System model and problem formulation . . . . . . . . . . . . . . . . . . . . . 84
5.3 Proposed B&P algorithm for solving the CRBS problem . . . . . . . . . . . . 86
5.4 Performance Evaluation . . . . . . . . . . . . . . . . . . . . . . . . . . . . . . 89
5.4.1 Simulation environment . . . . . . . . . . . . . . . . . . . . . . . . . . 90
5.4.2 Performance metrics . . . . . . . . . . . . . . . . . . . . . . . . . . . . 92
5.4.3 Simulation results . . . . . . . . . . . . . . . . . . . . . . . . . . . . . 93
5.5 Conclusion . . . . . . . . . . . . . . . . . . . . . . . . . . . . . . . . . . . . . 99
5.1 Introduction
In this Chapter, we consider a C-RAN architecture where the Mobile Network Operator (MNO)has to select BBU equipments to instantiate from different Cloud Service providers (CSPs) in orderto run its virtualized baseband pool. We assume that each CSP’s BBU is characterized by a failureprobability [47] and a capacity cost, that can be equivalent to content delivery network prices [48]for the services required from CSPs. We propose in this context, a novel framework addressing theproblem of optimal BBUs selection from several CSPs. The instantiated BBU pool should meetthe MNO’s expectations in terms of reliability, cost efficiency, processing power optimization and
83

84 5.2. SYSTEM MODEL AND PROBLEM FORMULATION
traffic load catering. To the best of our knowledge, this work is the first attempt to present anoptimization design for C-RAN BBU selection based on resiliency and virtualization price.
We formulate our selection problem, named Cost-Resilience BBU Selection (CRBS), as an ILPproblem, designed with a weighted objective function focusing on three optimization goals: i) min-imizing the BBU pool processing power, ii) maximizing its resiliency and iii) increasing the RRHstraffic load handling, subject to the virtualization’s capacity and budget constraints. Additionally,we consider that each RRH is characterized by its hourly traffic, depending on the type of area itcovers (e.g., business or residential area). It is worth noting that the third optimization goal fo-cuses on maximizing the overall percentage of traffic that can be handled from the lowest trafficload RRHs at a given hour, subject to ensuring the management of the high-load ones. In fact, weconsider that the traffic from the highest traffic load RRHs will not only generate a highest averagetraffic volume, but also highest peaks. Therefore, since there are more RRHs distributed throughoutthe radio site, such RRHs will be closer to the end user, and thus, will be able to cater best to theuser’s capacity demand. We assume that an overlaying macro cell will handle the remaining trafficfrom lowest traffic load RRHs if the BBU pool’s capacity is reached at that specific hour.
To solve the ILP CRBS problem, we propose to employ the Branch-and-Price (B&P) algo-rithm [49], which is a combination of the Branch-and-Bound and Column Generation methods forefficiently solving large-scale ILP problems. Our analysis evaluates several BBU selection policiesand provides general guidelines that can be used by operators to decide the best optimization strat-egy according to their needs: BBU processing power minimization, resiliency, traffic handling orall. Simulation results demonstrate the good performance of the B&P algorithm to solve the BBUselection problem for different scenarios, while also emphasizing the advantages of a particular onethat can realize more than 48% in virtualization cost savings.
The remainder of this Chapter is organized as follows: section 5.2 presents the mathematicalformulation of our system model. In section 5.3, we present our B&P algorithm design to solve theCRBS problem. Performance evaluation of our proposal is discussed in section 5.4, followed bysection 5.5, which concludes the Chapter.
5.2 System model and problem formulation
We consider a two-tier C-RAN architecture with a cell-layout composed of a macrocell, overlayinga number of S RRHs [68]. We denote by N the number of BBU candidates that the MNO isinclined to instantiate in its BBU pool B = j|1 ≤ j ≤ N to handle the traffic load of all SRRHs. The number N of needed BBUs can be deduced from the overall existent traffic load on allRRHs and the downlink capacity of the operator, as has been highlighted in previous chapters. EachCSP’s BBU candidate j is characterized by its per Mbps pricing mj and its failure probability pj .We denote by rji the binary variable, which is equal to 1 if BBU j handles RRH i, and 0 otherwise.

CHAPTER 5. AN OPTIMIZATION SCHEME FOR COST-RESILIENCE BBU SELECTION INC-RAN 85
Without loss of generality, we assume that each BBU is limited by a fixed capacity C in terms oftraffic it can handle [77]. We define the average utilization bj of a BBU j as follows:
bj =S∑i=1
rjilj/C (5.2.1)
where li is the current traffic in RRH i. The BBU-RRH dependent traffic is realized by a func-tional split separating user and cell related functions [21]. Besides, we consider that the basebandprocessing power consumption in a single BBU is linear with its average utilization thanks to theUE-Cell split. Thus, the processing power Pj consumed at BBU j can be expressed as:
Pj = P0 + ∆Pmaxbj (5.2.2)
In particular, P0 represents the power in the BBU when the latter is in idle mode, and Pmax when infull usage mode. ∆ is a constant between 0 and 1, which represents the slope of the equivalent linearpower model. On the other hand, we suppose that the failure probability of the BBU pool p(B) isequal to 1 if B = ∅, and
∏j pj , otherwise. In order to optimize this term as one of the MNO’s
intended goals for enhancing the cloud’s resiliency, we transform the product of probabilities intolinear summation by defining the following function Ij , which is equal to the negative value of thelogarithmic function on the failure probability of BBU j, i.e. Ij = −log(pj). Consequently, wecan write:
IB = −log(p(B)) = −∑j
log(pj) =∑j
Ij (5.2.3)
Furthermore, we consider two sets of RRHs in the deployed architecture denoted as SH and SL,which represent the sets of RRHs with high (maximum) traffic load and low (minimum) traffic load,respectively. We formulate in the following our mathematical CRBS optimization problem (P),

86 5.3. PROPOSED B&P ALGORITHM FOR SOLVING THE CRBS PROBLEM
expressed as a generic weighted optimization problem with three homogenised objective terms:
minimizer
α
N∑j=1
xjP0 + ∆.PmaxbjPmax
− βN∑j=1
xjIj
max(I)(P) (5.2.4)
− γ∑N
j=1
∑i∈SL rjili∑
i∈SL li
subject to :S∑i=1
rjili ≤ C,∀j (5.2.5)
N∑j=1
rji ≤ 1,∀i (5.2.6)
N∑j=1
mj
S∑i=1
rjili ≤M (5.2.7)
N∑j=1
∑i∈SH
rjili =∑i∈SH
li (5.2.8)
rji ∈ 0, 1,∀j, i (5.2.9)
The proposed objective function consists to minimize the total BBU pool processing power, whilemaximizing the resiliency (or minimizing the failure probability) of the pool as well as the trafficload that can be handled from the low-traffic RRHs by the instantiated BBUs. max(I) representsthe maximum value of I1, ..., IN. We define α, β and γ as constant weights between 0 and1, and whose total sum is equal to 1 (i.e., α + β + γ = 1). We consider that these constantsare set in advance by the MNO in order to fix the optimization strategy depending on its mostprevailing focuses. We define a binary indicator xj , which represents the statue of BBU j, (xj = 0,if∑S
i=1 rji = 0, i.e., BBU j is inactive, and 1 otherwise). (5.2.5) is the total BBU resource usagelimitation constraint, and constraint (5.2.6) implies that a RRH cannot be shared by more than oneBBU. Meanwhile, constraint (5.2.7) denotes that the capacity costs of all instantiated BBUs shouldbe less than or equal to the MNO’s virtualization budget M . Also, constraint (5.2.8) ensures thatthe traffic of high-load RRHs is 100% handled and, finally, (5.2.9) indicates that variable rji isbinary.
5.3 Proposed B&P algorithm for solving the CRBS problem
The CRBS problem formalized in (P) is ILP and, contrarily to Linear Programs (LPs), cannotbe solved directly using convex optimization techniques. Besides, problem (P) is NP-hard [77]and can only be solved by exhaustively figuring out all NS possible combinations of the BBU-RRH assignment variable, which is impracticable for large-scale networks. To find solutions to our

CHAPTER 5. AN OPTIMIZATION SCHEME FOR COST-RESILIENCE BBU SELECTION INC-RAN 87
problem, we propose to make use of the B&P framework, which combines the branch-and-boundand column generation approaches to compute the optimal solution of ILP problems [49].
The algorithm is based on solving by column generation the linear relaxation in each node of abranch-and-bound tree. In the B&P algorithm, a sets of columns are left out of the LP relaxation inorder to handle the problem more efficiently by decreasing the computational difficulty. Columnsare then “priced” and added back to the LP relaxation as needed. To decide which column willbe added, a sub-problem called the “pricing problem” is created to identify which columns shouldenter the basis so as to increase the objective function (in case of maximization problem). If suchcolumns are found, the LP is then re-optimized. We detail next, the steps of designing each of theMaster and Pricing problems for our B&P algorithm.
The first step consists in reformulating the original problem by applying the well-known Dantzig-Wolfe’s reformulation [49], that sub-divides the problem into a Master (MP) and a Pricing Prob-lem (PP). However, before applying the problem reformulation, we found that it is convenient totransform problem (P) by considering two binary variables v and w instead of single variable r,which represent low and high-traffic load RRHs assignment variables to BBUs, respectively. Thenew CRBS problem (P ′) can be expressed as follows:
maximizev,w
N∑j=1
Φjxj + Ψ
N∑j=1
∑i∈SH
wjilHi (P ′)
+ ΩN∑j=1
∑i∈SL
vjilLi
subject to :∑i∈SH
wjilHi +
∑i∈SL
vjilLi ≤ C,∀j (5.3.10)
N∑j=1
vji ≤ 1,∀i ∈ SL (5.3.11)
N∑j=1
wji ≤ 1,∀i ∈ SH (5.3.12)
N∑j=1
mj(∑i∈SH
wjilHi +
∑i∈SL
vjilLi ) ≤M (5.3.13)
N∑j=1
∑i∈SH
wjilHi =
∑i∈SH
lHj (5.3.14)
vji, wji ∈ 0, 1,∀j, i (5.3.15)
where: Φj = βIj/max(I) − αP0/Pmax; Ψ = −α∆/C; Ω = γ/∑
i∈SL lLi − α∆/C. We
denote by lLi and lHi the traffic in low and high-traffic load RRH i, respectively. Also, xj = 0, if

88 5.3. PROPOSED B&P ALGORITHM FOR SOLVING THE CRBS PROBLEM
∑i∈SH wji +
∑i∈SL vji = 0, and 1 otherwise. We apply next Dantzig-Wolfe’s reformulation. Let
KLj = vj1, vj2, ..., v
jkj and KHj = wj1, w
j2, ..., w
ikj be the sets of possible feasible assignments of
low and high-traffic load RRHs to BBU j, respectively. In this case, vjk = vj1k, vj2k, ..., v
jSk and
wjk = wj1k, wj2k, ..., w
jSk constitute a feasible solution to problem (P ′). Let tjk = (tjk, t
jk) be a
new variable, which is equal to (1, 1) if feasible solution (vjk, wjk) is selected, and (0, 0) otherwise.
We express in the following the Master Problem:
maximizet
N∑j=1
kj∑k=1
(Φjxj + Ψ∑i∈SH
(wjiklHj )tjk (MP)
+ Ω∑i∈SL
(vjiklLi )tjk)
subject to :N∑j=1
kj∑k=1
vjik tjk ≤ 1,∀i ∈ SL (5.3.16)
N∑j=1
kj∑k=1
wjik tjk ≤ 1, ∀i ∈ SH (5.3.17)
kj∑k=1
tjk ≤ 1,
kj∑k=1
tjk ≤ 1,∀j (5.3.18)
N∑j=1
mj
kj∑k=1
(∑i∈SH
wjik tjklHi +
∑i∈SL
vjik tjklLi ) ≤M (5.3.19)
N∑j=1
kj∑k=1
∑i∈SH
wjik tjklHi =
∑i∈SH
lHi (5.3.20)
tjk, tjk ∈ 0, 1, ∀j, k (5.3.21)
In the Master Problem (MP), tjk represents a feasible assignment of RRHs to BBU j. Note that(MP) cannot be solved directly due to its exponential number of columns, this is why we consideronly a subset of columns that constitutes the Restricted Master Problem (RMP), where the valuesof the variables that do not appear are padded to zero. The observation is, for large-scale ILPs, mostcolumns will have their associated variables equal to zero in any optimal solution anyway. Let t? bethe corresponding dual solution of the RMP. The next step consists in adding a number of columnswith positive reduced cost that are found by solving the two following sub-problems:
maximize1≤j≤N
uj − t?j (5.3.22)
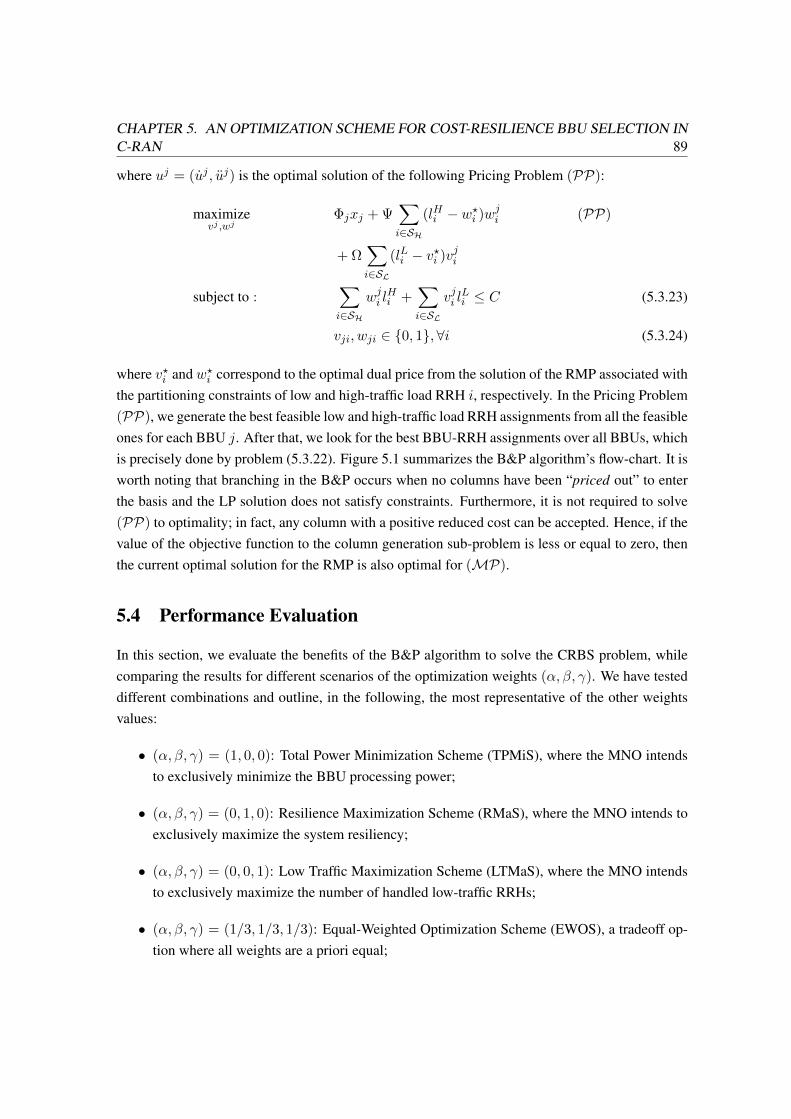
CHAPTER 5. AN OPTIMIZATION SCHEME FOR COST-RESILIENCE BBU SELECTION INC-RAN 89
where uj = (uj , uj) is the optimal solution of the following Pricing Problem (PP):
maximizevj ,wj
Φjxj + Ψ∑i∈SH
(lHi − w?i )wji (PP)
+ Ω∑i∈SL
(lLi − v?i )vji
subject to :∑i∈SH
wji lHi +
∑i∈SL
vji lLi ≤ C (5.3.23)
vji, wji ∈ 0, 1,∀i (5.3.24)
where v?i and w?i correspond to the optimal dual price from the solution of the RMP associated withthe partitioning constraints of low and high-traffic load RRH i, respectively. In the Pricing Problem(PP), we generate the best feasible low and high-traffic load RRH assignments from all the feasibleones for each BBU j. After that, we look for the best BBU-RRH assignments over all BBUs, whichis precisely done by problem (5.3.22). Figure 5.1 summarizes the B&P algorithm’s flow-chart. It isworth noting that branching in the B&P occurs when no columns have been “priced out” to enterthe basis and the LP solution does not satisfy constraints. Furthermore, it is not required to solve(PP) to optimality; in fact, any column with a positive reduced cost can be accepted. Hence, if thevalue of the objective function to the column generation sub-problem is less or equal to zero, thenthe current optimal solution for the RMP is also optimal for (MP).
5.4 Performance Evaluation
In this section, we evaluate the benefits of the B&P algorithm to solve the CRBS problem, whilecomparing the results for different scenarios of the optimization weights (α, β, γ). We have testeddifferent combinations and outline, in the following, the most representative of the other weightsvalues:
• (α, β, γ) = (1, 0, 0): Total Power Minimization Scheme (TPMiS), where the MNO intendsto exclusively minimize the BBU processing power;
• (α, β, γ) = (0, 1, 0): Resilience Maximization Scheme (RMaS), where the MNO intends toexclusively maximize the system resiliency;
• (α, β, γ) = (0, 0, 1): Low Traffic Maximization Scheme (LTMaS), where the MNO intendsto exclusively maximize the number of handled low-traffic RRHs;
• (α, β, γ) = (1/3, 1/3, 1/3): Equal-Weighted Optimization Scheme (EWOS), a tradeoff op-tion where all weights are a priori equal;

90 5.4. PERFORMANCE EVALUATION
Figure 5.1 – B&P algorithm Flow Chart
• (α, β, γ) = (0.4, 0.2, 0.4): 424-Scheme, which was chosen in consideration that reliabilitymay be twice less important for a MNO than to serve the whole traffic and minimize the totalC-RAN BBU power (numerical results will latter exhibit the benefits of this latter’s weightschoice).
5.4.1 Simulation environment
In all our simulation scenarios, we consider four CSPs, with their corresponding failure probabili-ties, I-function values and price per Mbps that are detailed in Table 5.1 (data of existent commercialcontent delivery network that can be closely equivalent to CSPs can be found in [48]). The rest of

CHAPTER 5. AN OPTIMIZATION SCHEME FOR COST-RESILIENCE BBU SELECTION INC-RAN 91
Table 5.1 – CSP inputs from [47] [48]
CSP-i Failure probab. pi Ij pricing mj
CSP-1 0.01 2 0.8$/Mbps
CSP-2 0.05 1.30103 0.9$/Mbps
CSP-3 0.1 1 1$/Mbps
CSP-4 0.01 2 1.1$/Mbps
5 10 15 200
5
10
15
20
Time (h)
Tra
ffic
lo
ad
(M
bp
s)
Business area
Residential area
Figure 5.2 – Daily traffic load observed on business and residential area RRHs during a workday [5]
the default simulation parameters are described in Table 5.2. We consider a total of S = 19 RRHs,with 15 business and 4 residential RRHs, differentiated by an hourly traffic load given by [5] and il-lustrated in Figure 5.2. The observation is the number of RRHs that can be within the low traffic setSL or the highest one SH varies depending on the hour. We use the solver IBM ILOG CPLEX [42]to solve both the LP relaxation of the RMP and the Pricing Problem.
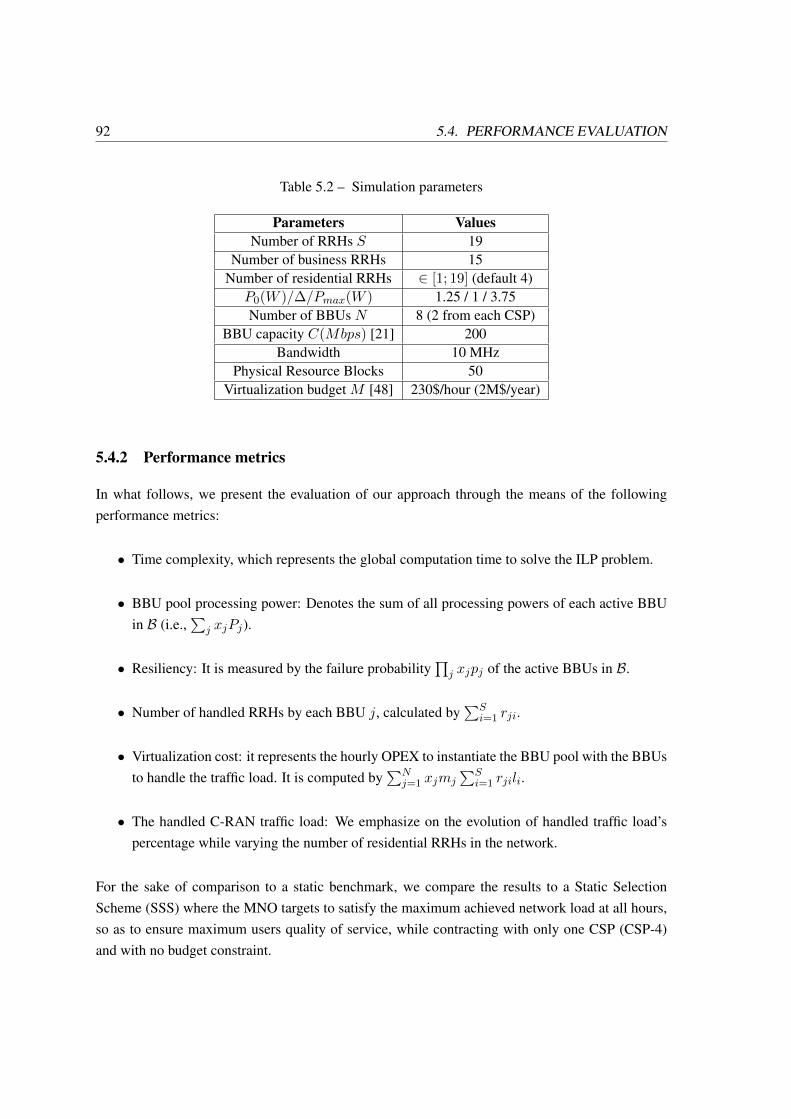
92 5.4. PERFORMANCE EVALUATION
Table 5.2 – Simulation parameters
Parameters ValuesNumber of RRHs S 19
Number of business RRHs 15Number of residential RRHs ∈ [1; 19] (default 4)
P0(W )/∆/Pmax(W ) 1.25 / 1 / 3.75Number of BBUs N 8 (2 from each CSP)
BBU capacity C(Mbps) [21] 200Bandwidth 10 MHz
Physical Resource Blocks 50Virtualization budget M [48] 230$/hour (2M$/year)
5.4.2 Performance metrics
In what follows, we present the evaluation of our approach through the means of the followingperformance metrics:
• Time complexity, which represents the global computation time to solve the ILP problem.
• BBU pool processing power: Denotes the sum of all processing powers of each active BBUin B (i.e.,
∑j xjPj).
• Resiliency: It is measured by the failure probability∏j xjpj of the active BBUs in B.
• Number of handled RRHs by each BBU j, calculated by∑S
i=1 rji.
• Virtualization cost: it represents the hourly OPEX to instantiate the BBU pool with the BBUsto handle the traffic load. It is computed by
∑Nj=1 xjmj
∑Si=1 rjili.
• The handled C-RAN traffic load: We emphasize on the evolution of handled traffic load’spercentage while varying the number of residential RRHs in the network.
For the sake of comparison to a static benchmark, we compare the results to a Static SelectionScheme (SSS) where the MNO targets to satisfy the maximum achieved network load at all hours,so as to ensure maximum users quality of service, while contracting with only one CSP (CSP-4)and with no budget constraint.

CHAPTER 5. AN OPTIMIZATION SCHEME FOR COST-RESILIENCE BBU SELECTION INC-RAN 93
Table 5.3 – Time complexity analysis
B&P Exhaustive Search# (BBU,RRH) # nodes CPU # nodes CPU
(8,19) 7 5.9 14 59.3(10,35) 7 6.4 72 174.1(12,50) 8 7.6 145 849.3(15,75) 8 8.2 509 2668.9(18,100) 7 10.6 836 7055.9(35,200) 15 62.9 NA NA
5.4.3 Simulation results
a) Time complexity analysis
Before comparing the performances of the different weights scenarios, we find it interesting to startstudying the time complexity of our developed B&P algorithm to solve the CRBS problem, withrespect to the exhaustive search method. The optimal solution in the latter is obtained by searchingall possible NS BBU-RRH assignment combinations. Table 5.3 shows the time complexity ofthe B&P and exhaustive search methods for different network sizes of BBUs and RRHs. We canremark that the average overall computation time of the B&P algorithm is less than 6 ms for thedefault network size, and less than 10 ms for a 100-RRHs based network. On another note, we canclearly see that the computation complexity of the exhaustive method is very big as the network sizeincreases. Besides, it finds limitations for a large network consisting of 200 RRHs and 35 BBUs,whereas the B&P returned the optimal solution in less than 63 ms. Therefore, we can assess thescalability of our approach to efficiently solve large-scale versions of the CRBS problem. In whatfollows, we consider the default system parameters of Table 5.2 and the study the evaluation of allfive weights scenarios.
b) BBU pool processing power
We compare in Figure 5.3 the hourly BBU pool processing power returned from the six approaches.We can remark an adaptive behaviour to the fluctuating traffic load for all weights scenarios schemes,with TPMiS having the minimum power consumption. In fact, the latter instantiates the least num-ber of BBUs compared to the others, which lessens the total BBU pool processing power. LTMaScomes second in power minimization, since it has to handle more traffic coming from low trafficload RRHs. Besides, we can remark that 424-S consumes less processing power than LTMaS atcertain peak traffic hours, such as at h = 12 : 00, h = 14 : 00 and h = 15 : 00. On the other hand,RMaS has the second highest power consumption, since it tends to maximize the number of in-
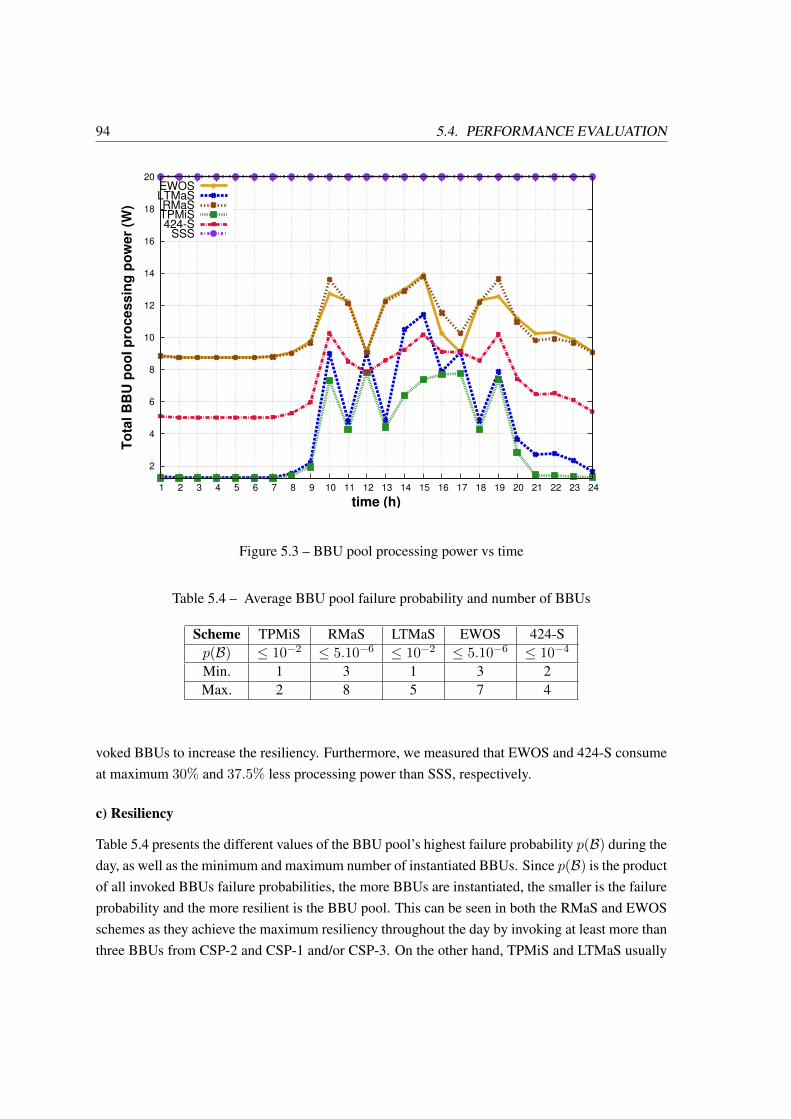
94 5.4. PERFORMANCE EVALUATION
2
4
6
8
10
12
14
16
18
20
1 2 3 4 5 6 7 8 9 10 11 12 13 14 15 16 17 18 19 20 21 22 23 24
To
tal
BB
U p
oo
l p
roc
es
sin
g p
ow
er
(W)
time (h)
EWOSLTMaSRMaSTPMiS424-S
SSS
Figure 5.3 – BBU pool processing power vs time
Table 5.4 – Average BBU pool failure probability and number of BBUs
Scheme TPMiS RMaS LTMaS EWOS 424-Sp(B) ≤ 10−2 ≤ 5.10−6 ≤ 10−2 ≤ 5.10−6 ≤ 10−4
Min. 1 3 1 3 2Max. 2 8 5 7 4
voked BBUs to increase the resiliency. Furthermore, we measured that EWOS and 424-S consumeat maximum 30% and 37.5% less processing power than SSS, respectively.
c) Resiliency
Table 5.4 presents the different values of the BBU pool’s highest failure probability p(B) during theday, as well as the minimum and maximum number of instantiated BBUs. Since p(B) is the productof all invoked BBUs failure probabilities, the more BBUs are instantiated, the smaller is the failureprobability and the more resilient is the BBU pool. This can be seen in both the RMaS and EWOSschemes as they achieve the maximum resiliency throughout the day by invoking at least more thanthree BBUs from CSP-2 and CSP-1 and/or CSP-3. On the other hand, TPMiS and LTMaS usually

CHAPTER 5. AN OPTIMIZATION SCHEME FOR COST-RESILIENCE BBU SELECTION INC-RAN 95
4
6
8
10
12
14
16
18
20
1 2 3 4 5 6 7 8 9 10 11 12 13 14 15 16 17 18 19 20 21 22 23 24
Nu
mb
er
of
ha
nd
led
RR
Hs
time (h)
EWOSLTMaSRMaSTPMiS424-S
SSS
Figure 5.4 – Number of active RRHs vs time
start with few number of BBUs, then instantiate as many as possible to accommodate to peak trafficat high-traffic load hours, and the extra coming from low traffic load RRHs for LTMaS. Regarding424-S, it invokes fewer number of BBUs than EWOS but, as will be seen next, can handle moreRRH traffic.
d) Number of handled RRHs
The evolution of the number of active RRHs is depicted in Figure 5.4, where it is shown thatEWOS, 424-S and LTMaS maximize the total number of handled RRHs. As for TPMiS and RMaS,they cater exclusively to the load of high-traffic cells, since they tend to minimize and maximize,respectively, the number of BBUs (γ = 0). However, we remark that at peak traffic hours such as ath = 12 : 00, h = 16 : 00, h = 17 : 00, and h = 19 : 00, not all RRHs could be handled by EWOS,424-S and LTMaS, unlike SSS, due to restricted BBU capacity and budget (as will be detailled inthe next figure). Meaning that, all (or a major part) of the traffic from residential areas during officehours will be handled by the macro base station. We can also note how 424-S performs better thanEWOS at h = 16 : 00 and h = 19 : 00 as it handles more RRHs traffic.

96 5.4. PERFORMANCE EVALUATION
0
50
100
150
200
250
300
350
400
450
1 2 3 4 5 6 7 8 9 10 11 12 13 14 15 16 17 18 19 20 21 22 23 24
Vir
tua
liza
tio
n c
os
t ($
)
time (h)
EWOSLTMaSRMaSTPMiS424-S
SSS
Figure 5.5 – Virtualization cost vs time
Table 5.5 – MNO annual OPEX and cost savings
Scheme TPMiS RMaS LTMaS EWOS 424-STotal cost (K$) 907 943 1,048 991 1,042Annual savings 54.65% 52.85% 47.6% 50.45% 47.9%
Savings to SSS 80.85% 80.09% 77.87% 79.08% 78%
e) Virtualization cost
The study of the virtualization cost is presented in Figure 5.5. We can remark that at peak traffichours, the MNO’s budget limitation B of 230$ per hour is reached for most schemes, with TPMiSrealizing minimum cost from h = 20 : 00 to h = 09 : 00. This can be explained as TPMiSserves less cells during those times compared to schemes like LTMaS and 424-S. The latter onthe other hand achieves the lowest virtualization cost at peak traffic hours from h = 10 : 00 toh = 13 : 00 and from h = 17 : 00 to h = 19 : 00. In Table V, we detail the annual expenditureand cost savings to both the annual budget and SSS for all five schemes. We can remark that allmethods achieve great reductions compared to SSS, from 77% up to almost 81% of cost savings.

CHAPTER 5. AN OPTIMIZATION SCHEME FOR COST-RESILIENCE BBU SELECTION INC-RAN 97
1 4 7 10 13 160
0.1
0.2
0.3
0.4
0.5
0.6
0.7
0.8
0.9
1
Number of residential RRHs
Perc
en
tag
e o
f h
an
dle
d t
raff
ic
Percen. of LT RRHs (by Resi.) Percen. of LT RRHs (by Busi.) EWOS LTMaS RMaS TPMiS 424−S
Figure 5.6 – Average percentage of handled low traffic RRH vs number of residential cells
LTMaS on the other hand, realizes the least cost reduction with 47.6% of savings of the total annualbudget, since it handles more cells and thus uses more budget to cater to their traffic. Consequently,to allow more traffic handling, the MNO should either boost its budget limit to reach the SSSbenchmark; or extend its contractual budget with more CSPs; or increase the BBU capacity C,with the repercussion of decreasing its total cost savings. A special mention goes to the 424-Sapproach, which achieves almost 48% of annual savings and 78% to the static approach.
f) Percentage of handled low traffic load
In Figure 5.6, we study the evolution of the average percentage of handled low-traffic RRHs, whilevarying the number of residential RRHs in the network. The average is taken from the 24 values ofthe day. With the increase of the number of residential RRHs, the load of the business ones becomeless important in the network and then switches to become the set SL. This allows the BBU pool tohandle 100% of all the RRHs load by EWOS, LTMaS and 424-S. Besides, since RMaS tends onlyto maximize the number of BBUs while satisfying constraint (C4), it consequently increases thecapacity of the BBU pool to handle extra traffic from the residential cells, but still not achieving100%. We can note the absence of TPMiS since γ = 0. On the other hand, it is shown in Figure 5.7that the number of instantiated BBUs generally increases with the increase of residential cells. For

98 5.4. PERFORMANCE EVALUATION
1 4 7 10 13 160
1
2
3
4
5
6
7
8
Number of residential RRHs
Av
era
ge
nu
mb
er
of
BB
Us
EWOS
LTMaS
RMaS
TPMiS
424−S
Figure 5.7 – Average number of instantiated BBUs vs number of residential cells
TPMiS and LTMaS however, the number of BBUs decreases at a certain point due the residentialcells outnumbering the business ones, which causes less total generated traffic, less processingpower and, consequently, less BBUs. We can also remark how 424-S invokes 50% less BBUs thanEWOS for handling the same amount of traffic.
g) Most used CSPs
In Figure 5.8, we present the percentage share of the four commercial CSPs from Table I thathave been used for each scheme. As we can observe, RMaS and EWOS have the same share ofCSPs, with an equal distribution between CSP-1, 2 and 4 of 29%. BBUs from CSP-3 however, arethe least solicited ones for these two schemes; this can be explained due to having a higher failureprobability (p3 = 0.1) than the other suppliers. Meanwhile, we can remark that TPMiS and LTMaSboth solicit CSP-4 as a main provider with a share of 71% and 49%, respectively. Although theyare the ones that instantiate the minimum number of BBUs, TPMiS and LTMaS mainly contractwith CSP-4, which is the most expensive supplier, to reach the budget constraint B. On the otherhand, 424-S contracts with only two CSPs (1 and 4) with an equal share of 50%. Surprisingly,despite having lesser resiliency weight (β = 0.2), 424-S uses the CSPs that provide the lowestfailure probability (p1 = p4 = 0.01). These results can give an insight to MNOs in order to help

CHAPTER 5. AN OPTIMIZATION SCHEME FOR COST-RESILIENCE BBU SELECTION INC-RAN 99
(a) TPMiS (b) RMaS (c) LTMaS
(d) EWOS (e) 424-S
Figure 5.8 – Most used CSPs for each scheme
them better direct their CSPs budget and find the ones that suit them the most.
Final remarks
From our analysis of all the performance metrics, we can deduce that forgoing a part of resiliencyweight for selecting BBUs in favor of the processing power and traffic handling can yield the bestresults. This was assessed in the 424-S case which outperformed the tradeoff scheme EWOS inpractically all aspects. In fact, 424-S proved to be a good strategy choice for MNOs to satisfy 100%
of traffic with the minimum number of BBUs, provided they can tolerate its failure probability of10−4 (which is faultless) and meet the total expenditure of the scheme. Besides, we have seen that424-S realizes 48% savings of the annual budget M , and 78% when compared to a static approach.
5.5 Conclusion
In this Chapter, we have evaluated several BBU selection policies and provided general guidelinesfor MNOs to decide the best optimization strategy according to their needs: BBU processing powerminimization, resiliency, traffic handling or all. More precisely, the presented EWOS and 424-Sapproaches have shown their ability to adapt to most traffic load scenarios and answer MNOs’major constraints. Especially, the 424-S may be the best option if a MNO targets to instantiate 50%
less BBUs, and realize 37.5% of BBU power savings and 48% of OPEX economy.

100 5.5. CONCLUSION

Chapter 6Conclusions
Contents6.1 Summary of contributions . . . . . . . . . . . . . . . . . . . . . . . . . . . . 1016.2 Future work . . . . . . . . . . . . . . . . . . . . . . . . . . . . . . . . . . . . 103
6.2.1 Short-term perspectives . . . . . . . . . . . . . . . . . . . . . . . . . . . 103
6.2.2 Medium-term perspectives . . . . . . . . . . . . . . . . . . . . . . . . . 103
6.2.3 Long-term perspectives . . . . . . . . . . . . . . . . . . . . . . . . . . . 104
6.3 Publications . . . . . . . . . . . . . . . . . . . . . . . . . . . . . . . . . . . . 104
In this Chapter, we conclude the thesis and present some perspectives of the future work to becarried out. In section 6.1, we summarize our proposals outlined in this thesis. Then, in section 6.2,we discuss the future research directions that we are planning to consider as extension to our works,from short and long term views. Finally, section 6.3 gives an overview of the list of publicationsthat have been achieved during this thesis.
6.1 Summary of contributions
In this thesis, we have addressed the problematic of real-time resource allocation and power mini-mization in DL communications for C-RAN. Our research has mainly focused on how to dynami-cally allocate baseband resources to time-varying flows of mobile users, while properly assigningUEs to RRHs and RRHs to BBUs in order to accommodate the traffic demands. We have stud-ied the cases where the fronthaul capacity is both constrained and unconstrained, and when theMNO’s BBU pool processing budget is limited to handle all traffic loads. The exposed optimizationproblems are non-linear and NP-hard, encompassing many constraints on mobile users’ resourcesdemands, QoS requirements, interference management, BBU pool capacity, transmission power
101

102 6.1. SUMMARY OF CONTRIBUTIONS
limitations, fronthaul links capacity and resiliency. To cope with the problem intractability, wehave presented three algorithms for real-time resource allocation in C-RAN, while making use ofdifferent theoretical approaches. Hereafter, we will summarize our main contributions.
The first contribution provided a detailed overview of C-RAN resource allocation strategiesin literature. First, we described the C-RAN transmission power minimization schemes. Next,we outlined the resource allocation and admission control approaches for fronthaul-constrained C-RANs. Then, we presented the different existing solutions for BBU-RRH mappings. Afterwards,we summarized all the discussed related C-RAN strategies, while exposing different metrics forevaluating the performance of the proposed solutions: i) algorithm application, ii) achieved UEsdata rates and iii) computational complexity.
In the second contribution, we have jointly studied the problems of resource allocation andpower minimization in C-RAN subject to transmission power and SINR constraints, as well as theunderlying BBU-RRH assignment problem. Our two-stage framework can determine at each UE’sarrival the best: i) PRBs allocation to efficiently satisfy UEs resource requests, ii) the number ofRRHs to turned on and iii) the number of needed BBUs to handle the whole traffic load. Throughextensive event-based simulations, we outlined the performance gains achieved by our DRAC-SAmethod in terms of transmit power minimization, TSR for mobile users and BBU savings comparedto state-of-the-art schemes. We hence believe that our approach represents a promising solution forcentralized resource allocation in future C-RAN deployments.
In the third contribution, our focus was on addressing jointly the resource allocation and admis-sion control tasks in a fronhaul-constrained C-RAN, considering mobile users QoS requirements,interference and fronthaul network limitation constraints. We presented a three-level algorithmdesign to solve the resource allocation problem and the admission control task. Numerical re-sults have confirmed the performance of our proposed RAAC approach, which increases users’admission and saves more C-RAN transmission power compared to related strategies. We alsohighlighted the benefits of our proposal regarding the number of BBUs’ reduction in the cloud.We believe that our proposal can be readily used by operators for network dimensioning and forleveraging the C-RAN’s benefits for dynamic multi-user resource allocation.
In the final contribution, we have provided a novel C-RAN BBU selection framework with dif-ferent optimization schemes to help operators choose, from a variety of CSPs, the best BBUs toinstantiate in their virtual pool. We have presented a powerful algorithm based on the Branch-and-Price scheme to optimally solve the problem in minimum time for different network sizes. Thedifferent introduced schemes in part of this framework have shown adaptiveness and flexibility toMNOs strategies, based on their prevailing requirements in terms of processing power minimiza-tion, resiliency, virtualization budget and adjustment to cells traffic profiles. More precisely, thepresented EWOS and 424-S approaches have shown their ability to adapt to most traffic load sce-narios and answer MNOs’ major strategies and constraints. Especially, the 424-S may be the best

CHAPTER 6. CONCLUSIONS 103
option if a MNO targets to instantiate 50% less BBUs, and realize 37.5% of BBU power savingsand 48% of virtualization expenditure economy.
6.2 Future work
Hereafter, we expose the future work related to our thesis. In fact, we categorize the work perspec-tives into three groups: i) short-term, ii) medium-term and iii) long-term views.
6.2.1 Short-term perspectives
As a short-term planned work, we aim to consolidate our proposals by considering the problemof BBUs placement in centralized virtual pools, subject to MNOs functional splittings. In fact, asdifferent functional splits can yield to different BBU-RRH distances, latencies and fronthaul linksrates [21], they impose on the downside a cost/availability versus performance tradeoff, becausethe split limits the ability of the RAN to manage interference. MNOs with specific RAN splittingsmust then decide the best placement strategies of BBUs in their geographical-fixed BBU hotels,that can meet the fronthaul and latency requirements of their RAN splittings while handling RRHstraffic loads. A work in this direction would be to find the minimum number of BBUs to instantiatein each BBU hotel so as to maximize the RRHs traffic loads catering, for both central and edgetraffic, subject to cell site fronthaul distance and latency constraints.
6.2.2 Medium-term perspectives
In this thesis, all performance evaluations have been performed through simulations. However, de-spite the quality of obtained results depicting the efficiency of our algorithms, testbed experimentsare required to validate these algorithms and to evaluate their performance in real LTE environment.C-RAN can benefit from Software-Defined Radio (SDR) implementations [37], that deport mostsignal processing functions on software packages for emulating PHY/MAC functions without theneed of using dedicated hardware [91] [92]. Currently, we have started building a SDR testbed [93]based on OpenAirInterface package softwares [39] and Ettus Research’s Universal Software RadioPlatform (USRP) devices [94]. The goal is to emulate a real-time LTE resource scheduler by lever-aging the openness brought by SDR platforms using General Purpose Platforms (GPP) PC. Thedrawback however of using GPP is the latency requirement that can lead to occasional loss of base-band processing packets. Hence, as future medium-term works, we envisage to build a SDR-basedC-RAN that can implement and validate our propositions with proper timing requirements, whilealso working on other algorithms for emulating LTE UL resource allocation, centralized handovermanagement and BBUs collaborative radio processing.

104 6.3. PUBLICATIONS
6.2.3 Long-term perspectives
One vision of 5G is to create a cell-less environnement, where a user is not only connected to a sin-gle cell, but to a cloud of cells. In this regard, C-RAN is sure to be a cornerstone of 5G deploymentsto address its performance needs and optimize deployment costs. However, the centralized modelmay not be the best solution due to the current fronthaul design not meeting the delay requirementin retransmission, thereby lowering application data throughput. Meanwhile, the decentralized ap-proach, using site-by-site computing, may have some merit in 5G to enable reality-time, IoT andSmart Vehicles [95] applications that will come with ultra-high capacity and incredibly low latencyrequirements. Therefore, as long-term perspective work, we aim to study the balance betweenthe centralized and distributed architectures in 5G, with respect to resource allocation. In fact,our proposed resource allocation algorithms do not cover uplink scenarios, whose traffics may beexceeding the downlink ones in 5G. A more generalized uplink-downlink algorithm for resourceallocation, with multiple BBU pools, and possibly other services present in the network, will be anexciting future research topic for 5G C-RAN.
Moreover, as we have studied BBU virtualization and baseband resource allocation, methodsfor allocating other resource elements, like fronthaul or cell site equipments, will be of great impor-tance in 5G too. What is striking, the topic of network sharing is connected with hybrid fronthauland backhaul optimization. Future mobile networks will most likely consist of standalone 5G de-ployments as well as LTE/LTE-A C-RANs. Joint capacity and control plane optimization for bothfronthaul networks will enable more efficient usage of resources, thereby lowering network deploy-ment and operation costs.
6.3 Publications
This section summarizes the publications that have resulted from the work undertaken in this thesis.
• Journals
– M. Y. Lyazidi, L. Giupponi, J. Mangues, N. Aitsaadi and R. Langar, “An OptimizationScheme for Cost-Resilience BBU Selection in Cloud-Radio Access Network”, submit-ted in IEEE Transactions on Wireless Communications 2017.
– M. Y. Lyazidi, N. Aitsaadi, R. Langar, P. Rubin, and R. Boutaba, “Dynamic ResourceAllocation and Admission Control in Downlink Cloud Radio Access Network withFixed Fronthaul Capacity”, submitted in IEEE Transactions on Mobile Computing2017.
– M. Y. Lyazidi, N. Aitsaadi, and R. Langar, “A Dynamic Resource Allocation Frame-work in LTE Downlink for Cloud-Radio Access Network”, submitted in IEEE Trans-actions on Vehicular Technology 2017.

CHAPTER 6. CONCLUSIONS 105
• Conferences
– M. Y. Lyazidi, L. Giupponi, J. Mangues, N. Aitsaadi and R. Langar, “A Novel Opti-mization Framework for C-RAN BBU Selection based on Resiliency and Price”, IEEEVehicular Technology Conference (VTC-Fall’17), Toronto, Canada, September 2017.
– M. Y. Lyazidi, N. Aitsaadi, and R. Langar, “Resource Allocation and Admission Con-trol in OFDMA-based Cloud-RAN”, IEEE Global Communication Conference (GLOBE-COM’16), Washington D.C., U.S., December 2016.
– M. Y. Lyazidi, N. Aitsaadi, and R. Langar, “Dynamic Resource Allocation in Cloud-RAN with Real-Time BBU/RRH Assignment”, IEEE International Conference on Com-munications (ICC’16), Kuala Lumpur, May 2016.

106 6.3. PUBLICATIONS

List of figures
1.1 Global Mobile Traffic Growth by Device Type [1] (numbers in parentheses refer to2016 and 2021 traffic share) . . . . . . . . . . . . . . . . . . . . . . . . . . . . . 13
1.2 MNOs motivations for C-RAN. Source: Monica Paolini, Senza Fili Consulting [9] 14
1.3 Distributed RAN architecture . . . . . . . . . . . . . . . . . . . . . . . . . . . . . 16
1.4 Centralized RAN architecture . . . . . . . . . . . . . . . . . . . . . . . . . . . . . 17
1.5 Backhaul and fronthaul requirements vs. cell-site capacity (Source: KDDI, Nokia,Viavi, Small Cell Forum 2016) . . . . . . . . . . . . . . . . . . . . . . . . . . . . 18
1.6 BBU and RRH functionalities and possible functional splits . . . . . . . . . . . . . 19
2.1 Two-tier network with small cells deployed in a C-RAN architecture within thecoverage area of a macrocell [66]. . . . . . . . . . . . . . . . . . . . . . . . . . . 33
2.2 Number of BBUs allocated during a day, for 100 office and 100 residential RRHsin C-RAN compared to D-RAN. Source: Checko et .al [38]. . . . . . . . . . . . . 37
3.1 DRAC-SA Flow Chart . . . . . . . . . . . . . . . . . . . . . . . . . . . . . . . . 50
3.2 Throughput Cumulative Density Function . . . . . . . . . . . . . . . . . . . . . . 53
3.3 CPU time vs number of UEs . . . . . . . . . . . . . . . . . . . . . . . . . . . . . 54
3.4 SSR per PRB for SINR = 25 dB . . . . . . . . . . . . . . . . . . . . . . . . . . . 55
3.5 Throughput distribution as a function of user demands . . . . . . . . . . . . . . . 56
3.6 Percentage of RRHs vs transmission power levels . . . . . . . . . . . . . . . . . . 57
3.7 Total RRHs transmitted power . . . . . . . . . . . . . . . . . . . . . . . . . . . . 58
3.8 Number of needed BBUs and on RRHs per time . . . . . . . . . . . . . . . . . . . 58
3.9 Global TSR vs arrival rate . . . . . . . . . . . . . . . . . . . . . . . . . . . . . . 60
3.10 Rejected users rate vs arrival rate . . . . . . . . . . . . . . . . . . . . . . . . . . . 60
3.11 Number of BBUs vs arrival rate . . . . . . . . . . . . . . . . . . . . . . . . . . . 61
4.1 Considered C-RAN Architecture . . . . . . . . . . . . . . . . . . . . . . . . . . . 65
107

108 List of figures
4.2 CPU time vs. network density . . . . . . . . . . . . . . . . . . . . . . . . . . . . 734.3 Percentage of admitted UEs versus target QoS with fixed fronthaul capacityCmax =
500 Mbps. . . . . . . . . . . . . . . . . . . . . . . . . . . . . . . . . . . . . . . . 744.4 Percentage of admitted UEs versus target QoS. . . . . . . . . . . . . . . . . . . . 754.5 Throughput Cumulative Density Function for Best Effort UEs. . . . . . . . . . . . 764.6 Average TSR vs. weight constant. . . . . . . . . . . . . . . . . . . . . . . . . . . 774.7 Total transmission power versus target QoS with fixed fronthaul capacity Cmax =
500 Mbps. . . . . . . . . . . . . . . . . . . . . . . . . . . . . . . . . . . . . . . . 784.8 Total transmission power versus fronthaul capacity Cmax . . . . . . . . . . . . . . 794.9 Number of BBUs vs. time . . . . . . . . . . . . . . . . . . . . . . . . . . . . . . 794.10 Number of BBUs versus target QoS for Cmax = 500 Mbps. . . . . . . . . . . . . . 804.11 Number of BBUs versus fronthaul capacity Cmax. . . . . . . . . . . . . . . . . . . 80
5.1 B&P algorithm Flow Chart . . . . . . . . . . . . . . . . . . . . . . . . . . . . . . 905.2 Daily traffic load observed on business and residential area RRHs during a workday
[5] . . . . . . . . . . . . . . . . . . . . . . . . . . . . . . . . . . . . . . . . . . . 915.3 BBU pool processing power vs time . . . . . . . . . . . . . . . . . . . . . . . . . 945.4 Number of active RRHs vs time . . . . . . . . . . . . . . . . . . . . . . . . . . . 955.5 Virtualization cost vs time . . . . . . . . . . . . . . . . . . . . . . . . . . . . . . 965.6 Average percentage of handled low traffic RRH vs number of residential cells . . . 975.7 Average number of instantiated BBUs vs number of residential cells . . . . . . . . 985.8 Most used CSPs for each scheme . . . . . . . . . . . . . . . . . . . . . . . . . . . 99

List of tables
2.1 Comparison of C-RAN resource allocation strategies . . . . . . . . . . . . . . . . 40
3.1 Simulation Parameters . . . . . . . . . . . . . . . . . . . . . . . . . . . . . . . . 513.2 Mean Spectrum Spatial Reuse . . . . . . . . . . . . . . . . . . . . . . . . . . . . 543.3 Number of BBUs and RRHs . . . . . . . . . . . . . . . . . . . . . . . . . . . . . 59
4.1 Simulation Parameters . . . . . . . . . . . . . . . . . . . . . . . . . . . . . . . . 724.2 Average CPU time comparison . . . . . . . . . . . . . . . . . . . . . . . . . . . . 73
5.1 CSP inputs from [47] [48] . . . . . . . . . . . . . . . . . . . . . . . . . . . . . . 915.2 Simulation parameters . . . . . . . . . . . . . . . . . . . . . . . . . . . . . . . . 925.3 Time complexity analysis . . . . . . . . . . . . . . . . . . . . . . . . . . . . . . . 935.4 Average BBU pool failure probability and number of BBUs . . . . . . . . . . . . . 945.5 MNO annual OPEX and cost savings . . . . . . . . . . . . . . . . . . . . . . . . . 96
109

110 References

References
[1] Cisco, “Cisco visual networking index: Global mobile data traffic forecast 2015-2020,white paper, available online at: http://www.cisco.com/c/en/us/solutions/collateral/service-provider/visual-networking-index-vni/mobile-white-paper-c11-520862.pdf,” 2016.
[2] Ericsson, “Vestberg Foresees Industry Shift, press release, http://www .erics-son.com/news/1384303,” 2010.
[3] MarketingCharts, “Mobile network operators face cost crunch, available online:http://www.marketingcharts.com/wp/direct/mobile-network-operators-face-cost-crunch-17700/,” 2011.
[4] C.-L. I, C. Rowell, S. Han, Z. Xu, G. Li, and Z. Pan, “Toward Green and Soft: a 5G perspec-tive,” IEEE Communications Magazine, vol. 52, no. 2, pp. 66–73, 2014.
[5] C-RAN, The Road Towards Green RAN, China Mobile Research Institute, White Paper ,Ver-sion 3.0, 2013.
[6] A. Fischer, J. F. Botero, M. T. Beck, H. de Meer, and X. Hesselbach, “Virtual network em-bedding: A survey,” IEEE Communications Surveys Tutorials, vol. 15, no. 4, pp. 1888–1906,2013.
[7] N. Alliance, “Further study on critical C-RAN technologies, available online at:https://www.ngmn.org/publications/all-downloads/article/project-ran-evolution-further-study-on-critical-c-ran-technologies.html,” 2015.
[8] T. Taleb, M. Corici, C. Parada, A. Jamakovic, S. Ruffino, G. Karagiannis, and T. Magedanz,“EASE: EPC as a service to ease mobile core network,” IEEE Network Magazine, Vol. 29,No. 2, pp.78 - 88, 2015.
[9] S. F. M. Paolini, “Benefits of C-RAN and adoption trends,” Senza Fili Consulting onlinewebinar on C-RAN, 2015.
111

112 References
[10] Nokia, “Multi-layer and cloud-ready radio evolution towards 5G, 2016, white paper, avail-able online at: https://gsacom.com/paper/multi-layer-cloud-ready-radio-evolution-towards-5g,” 2016.
[11] P. Rost, C. J. Bernardos, A. D. Domenico, M. D. Girolamo, M. Lalam, A. Maeder, D. Sabella,and D. W¸bben, “Cloud technologies for flexible 5G radio access networks,” IEEE Communi-cations Magazine, vol. 52, no. 5, pp. 68–76, 2014.
[12] IJOIN, “Interworking and JOINt Design of an Open Access and Backhaul Network Architec-ture for Small Cells based on Cloud networks, website: http://www.ict-ijoin.eu,” 2012.
[13] MCN, “Mobile Cloud Networking (MCN) project. [online]. available: https://www.mobile-cloud-networking.eu/,” 2013.
[14] HARP, “FP7 project High capacity network Architecture with Remote radio heads and Para-sitic antenna arrays (HARP). [online]. available: http://www.fp7-harp.eu/,” 2014.
[15] NTT-DoCoMo, “Special articles on 5G technologies toward 2020 deployment,” TechnicalJournal, Vol. 17, No. 4, 2016.
[16] CPRI, “Common public radio interface (CPRI): Interface specification, version 6.1. online athttp://www.cpri.info,” 2014.
[17] C.-L. I, J. Huang, R. Duan, C. Cui, J. X. JIiang, and L. Li, “Recent Progress on C-RANCentralization and Cloudification,” Special section on recent advances in Cloud Radio AccessNetworks, 2014.
[18] N. J. Gomesa, P. Chancloub, P. Turnbullc, A. Mageec, and V. Jungnickeld, “Fronthaul evolu-tion: From CPRI to ethernet,” Optical Fiber Technology - Next Generation Access Networks,vol. 26, Part A, pp. 50 – 58, 2015.
[19] B. Haberland, F. Derakhshan, H. Grob-Lipski, R. Klotsche, W. Rehm, P. Schefczik, andM. Soellner, “Radio Base Stations in the Cloud,” Bell Labs Technical Journal 18(1), 129152c© Alcatel-Lucent., 2013.
[20] A. Checko, H. Christiansen, Y. Yan, L. Scolari, G. Kardaras, M. S. Berger, and L. Dittmann,“Cloud RAN for Mobile Networks - a Technology Overview,” IEEE Communications Surveysand Tutorials, 2013.
[21] A. Checko, A. P. Avramova, M. S. Berger, and H. L. Christiansen, “Evaluating C-RAN fron-thaul functional splits in terms of network level energy and cost savings,” Journal of Commu-nications and Networks, vol. 18, no. 2, pp. 162–172, 2016.

References 113
[22] R. Agrawal, A. Bedekar, T. Kolding, and V. Ram, “Cloud RAN challenges and solutions,”International ICIN Conference - Innovations in Clouds Internet and Networks, 2016.
[23] “Small cell virtualization functional splits and use cases,” technical report, Small Cell Forum,2015.
[24] R. Agrawal, A. Bedekar, S. Kalyanasundaram, T. Kolding, H. Kroener, and V. Ram, “Archi-tecture principles for cloud-ran,” in IEEE Vehicular Technology Conference (VTC-Spring),2016.
[25] 3GPP, “TR 36.819 study on coordinated multi-point operation for LTE,” available atwww.3gpp.org, 2011.
[26] ——, “RP-111454: Status report to TSG; enhanced ICIC for non-CA based deployments ofheterogeneous networks for LTE - performance part,” TSG RAN meeting n.54, 2011.
[27] C. Liu, K. Sundaresan, M. Jiang, S. Rangarajan, and G.-K. Chang, “The Case for Re-configurable Backhaul in Cloud-RAN based Small Cell Networks,” IEEE INFOCOM, 2013.
[28] G. T. 36.211, “Physical channels and modulation, 3GPP,” www.3gpp.org, 2008.
[29] Q. Wang, D. Jiang, J. Jin, G. Liu, Z. Yan, and D. Yang, “Application of BBU+RRU basedcomp system to lte-advanced,” in IEEE International Conference on Communications (ICC)Workshops, 2009.
[30] EASY-C, “Enablers for ambient services and systems part c - wide area coverage, [online].available: http://www.easy-c.com.”
[31] ARTIST4G, “Artist4g project website, [online]. available: www.ict-artist4g.eu.”
[32] FUTON, “Fibre optic networks for distributed, extendible heterogeneous radio architecturesand service provisioning [online]. available: http://www.ict-futon.eu.”
[33] H.-C. Jang and Y.-J. Lee, “QoS-constrained resource allocation scheduling for LTE network,”in International Symposium on Wireless and Pervasive Computing (ISWPC), 2013.
[34] R. Langar, S. Secci, R. Boutaba, and G. Pujolle, “An operations research game approachfor resource and power allocation in cooperative femtocell networks,” IEEE Transactions onMobile Computing, vol. 14, no. 4, pp. 675–687, 2015.
[35] Y. Yu, E. Dutkiewicz, X. Huang, and M. Mueck, “Downlink Resource Allocation for NextGeneration Wireless Networks with Inter-Cell Interference,” IEEE transactions on WirelessCommunications, Vol. 12, No. 4, 2013.

114 References
[36] A. Hatoum, R. Langar, N. Aitsaadi, R. Boutaba, and G. Pujolle, “Qos-based power controland resource allocation in ofdma femtocell networks,” in IEEE Global Communications Con-ference (GLOBECOM), 2012.
[37] R. J. Y. Dayene Beyene and K. Ruttik, “Cloud-RAN Architecture for Indoor DAS,” Specialsection on recent advances in Cloud Radio Access Networks, 2014.
[38] A. Checko, H. Holm, and H. Christiansen, “Optimizing small cell deployment by the use ofC-RANs,” European Wireless Conference, 2014.
[39] “Openairinterface software alliance, EURECOM, China Mobile, Orange, BUPT,IITH, OPNFV – Openairinterface an upstream project for OPNFV. online athttp://www.openairinterface.org/,” 2016.
[40] S. H. Park, O. Simeone, O. Sahin, and S. Shamai, “Robust and efficient distributed compres-sion for cloud radio access networks,” IEEE Transactions on Vehicular Technology, vol. 62,no. 2, pp. 692–703, 2013.
[41] Y. Shi, Y. T. Hou, S. Kompella, and H. D. Sherali, “Maximizing capacity in multihop cognitiveradio networks under the SINR model,” IEEE Transactions on Mobile Computing, vol. 10,no. 7, pp. 954–967, 2011.
[42] “IBM ILOG CPLEX Optimizer Version l v12.6. available: http://www-01.ibm.com/software/commerce/optimization/cplex-optimizer/.”
[43] M. Y. Lyazidi, N. Aitsaadi, and R. Langar, “Resource Allocation in Cloud-RAN with Real-Time RRH-BBU Assignment,” IEEE International Conference on Communications (ICC),2016.
[44] ——, “A dynamic resource allocation framework in LTE downlink for cloud-radio accessnetwork,” submitted to IEEE Transactions on Vehicular Technology, 2017.
[45] ——, “Resource allocation and admission control in OFDMA-based Cloud-RAN,” IEEEGlobal Communications Conference (GLOBECOM), 2016.
[46] M. Y. Lyazidi, N. Aitsaadi, R. Langar, P. Rubin, and R. Boutaba, “Dynamic resource allo-cation and admission control in downlink cloud radio access network with fixed fronthaulcapacity,” submitted to IEEE Transactions on Mobile Computing, 2017.
[47] “100% availability for cloud and data center applications. [online]. available:http://www.cedexis.com/.”

References 115
[48] D. Rayburn, “Current state of the CDN market: DIY, pricing trends, competitive dynamics,may 2016, available online at: www.cdnpricing.com,” 2016.
[49] C. Barnhart, E. L. Johnson, G. L. Nemhauser, M. W. Savelsbergh, and P. H. Vance, “Branch-and-price: Column generation for solving huge integer programs,” Operations research,vol. 46, no. 3, pp. 316–329, 1998.
[50] M. Y. Lyazidi, L. Giupponi, J. Mangues-Bafalluy, N. Aitsaadi, and R. Langar, “A novel op-timization framework for C-RAN BBU selection based on resiliency and price,” in IEEEVehicular Technology Conference (VTC 2017-Fall), 2017.
[51] ——, “An optimization scheme for cost-resilience BBU selection in cloud-radio access net-work,” submitted to IEEE Transactions on Wireless Communications, 2017.
[52] V. Chandrasekhar, J. G. Andrews, and A. Gatherer, “Femtocell networks: a survey,” IEEECommunications magazine, vol. 46, no. 9, 2008.
[53] C. Nam, C. Joo, S. G. Yoon, and S. Bahk, “Resource allocation in full-duplex ofdma networks:Approaches for full and limited csis,” Journal of Communications and Networks, vol. 18,no. 6, pp. 913–925, 2016.
[54] D. Lopez-Perez, A. Ladanyi, A. Juttner, H. Rivano, and J. Zhang, “Optimization method forthe joint allocation of modulation schemes, coding rates, resource blocks and power in self-organizing lte networks,” in IEEE INFOCOM Proceedings, 2011.
[55] J. Xiao, R. Q. Hu, Y. Qian, L. Gong, and B. Wang, “Expanding lte network spectrum withcognitive radios: From concept to implementation,” IEEE Wireless Communications, Vol. 20,No.2, pp.12 - 19, 2013.
[56] K. Fazel and S. Kaiser, “Multi-carrier and spread spectrum systems,” Wiley, 2008.
[57] S. K. Gond and A. Sai Prasad, “Green antenna and radio over fiber technology for a cellularwireless,” International journal of Engineering and Innovative Technology (IJEIT), ISSN, pp.2277–3754, 2012.
[58] C. Rowell, S. Han, Z. Xu, and I. C. Lin, “Green RF technologies for 5G networks,” in IEEEInternational Wireless Symposium (IWS), 2014.
[59] Y. Shi, J. Zhang, and K. Letaief, “Group sparse beamforming for green cloud-RAN,” IEEETransactions on Wireless Communications, vol. 13, no. 5, pp. 2809–2823, 2014.
[60] S. Luo, R. Zhang, and T. J. Lim, “Downlink and uplink energy minimization through userassociation and beamforming in C-RAN,” IEEE Transactions on Wireless Communications,vol. 14, no. 1, pp. 494–508, 2015.
116 References
[61] M. Schubert and H. Boche, “Iterative multiuser uplink and downlink beamforming under sinrconstraints,” IEEE Transactions on Signal Processing, vol. 53, no. 7, pp. 2324–2334, 2005.
[62] T. X. Tran and D. Pompili, “Dynamic radio cooperation for downlink cloud-rans with com-puting resource sharing,” in IEEE International Conference onMobile Ad Hoc and SensorSystems (MASS), 2015.
[63] K. Wang, M. Zhao, and W. Zhou, “Graph-based dynamic frequency reuse in cloud-ran,” inIEEE Wireless Communications and Networking Conference (WCNC), 2014.
[64] K. Wang, K. Yang, and C. Magurawalage, “Joint energy minimization and resource allocationin c-ran with mobile cloud,” IEEE Transactions on Cloud Computing, 2016.
[65] OBSAI, “Reference point 3 specification, version 4.2. online at http://www.obsai.com.”
[66] A. Abdelnasser and E. Hossain, “Two-tier ofdma cellular cloud-ran: Joint resource allocationand admission control,” in IEEE Global Communications Conference (GLOBECOM), 2015.
[67] S. Boyd and L. Vandenberghe, Convex optimization. Cambridge university press, 2004.
[68] A. Abdelnasser and E. Hossain, “Resource allocation for an OFDMA cloud-RAN of smallcells underlaying a macrocell,” IEEE Transactions on Mobile Computing, vol. 15, no. 11, pp.2837–2850, 2016.
[69] V. N. Ha and L. B. Le, “Resource allocation for uplink OFDMA C-RANs with limited compu-tation and fronthaul capacity,” in IEEE International Conference on Communications (ICC),2016.
[70] V. Nguyen and L. B. Le, “Joint Coordinated Beamforming and Admission Control for Fron-thaul Constrained Cloud-RAN,” IEEE Global Communications Conference (GLOBECOM),2014.
[71] V. N. Ha, L. B. Le, and N. D. Dao, “Cooperative transmission in cloud RAN consideringfronthaul capacity and cloud processing constraints,” in IEEE Wireless Communications andNetworking Conference (WCNC), 2014.
[72] ——, “Energy-efficient coordinated transmission for cloud-RANs: Algorithm design andtrade-off,” in Annual Conference on Information Sciences and Systems (CISS), 2014.
[73] J. Zhao, T. Q. S. Quek, and Z. Lei, “Fast algorithm for utility maximization in C-RAN withjoint QoS and fronthaul rate constraints,” in IEEE International Conference on Communica-tions (ICC), 2016.

References 117
[74] S. Namba, T. Matsunaka, T. Warabino, S. Kaneko, and Y. Kishi, “Colony-RAN Architecturefor Future Cellular Network,” Future Network Mobile Summit (FutureNetw), 2012.
[75] S. K. S. Namba, T. Warabino, “BBU-RRH Switching Schemes for Centralized Ran,” Interna-tional ICST Conference on Communications and Networking in China (CHINACOM), 2012.
[76] C. Colman-Meixner, G. B. Figueiredo, M. Fiorani, M. Tornatore, and B. Mukherjee, “Re-silient cloud network mapping with virtualized BBU placement for Cloud RAN,” IEEE In-ternational Conference on Advanced Networks and Telecommunications Systems ANTS, 2016.
[77] M. Qian, W. Hardjawana, J. Shi, and B. Vucetic, “Baseband processing units virtualizationfor cloud radio access networks,” IEEE Wireless Communications Letters, vol. 4, no. 2, pp.189–192, 2015.
[78] M. Bouet, J. Leguay, and V. Conan, “Cost-based placement of vdpi functions in nfv infras-tructures,” in IEEE Conference on Network Softwarization (NetSoft), 2015.
[79] N. Carapellese, M. Tornatore, and A. Pattavina, “Placement of base-band units (bbus) overfixed/mobile converged multi-stage wdm-pons,” in International Conference on Optical Net-working Design and Modeling (ONDM), 2013.
[80] A. Checko, G. Kardaras, C. Lanzani, D. Temple, C. Mathiasen, L. Pedersen, and B. Klaps,OTN Transport of Baseband Radio Serial Protocols in C-RAN Architecture for Mobile Net-work Applications. Altera, 2014.
[81] F. Z. Kaddour, E. Vivier, M. Pischella, L. Mroueh, and P. Martins, “Power control in oppor-tunistic and efficient resource block allocation algorithms for green lte uplink networks,” inOnline Conference on Green Communications (OnlineGreenComm), 2013.
[82] J. Lee and S. Leyffer, “Mixed integer nonlinear programming,” Springer Science & BusinessMedia, vol. 154, 2011.
[83] D. Pisinger, “An exact algorithm for large multiple knapsack problems,” European Journal ofOperational Research, vol. 114, no. 3, pp. 528 – 541, 1999.
[84] N. Metropolis, A. W. Rosenbluth, M. N. Rosenbluth, A. H. Teller, and E. Teller, “Equationof state calculations by fast computing machines,” The journal of chemical physics, vol. 21,no. 6, pp. 1087–1092, 1953.
[85] M. E. Aydin, R. Kwan, J. Wu, and J. Zhang, “Multiuser scheduling on the LTE downlink withsimulated annealing,” in IEEE Vehicular Technology Conference (VTC-Spring), 2011.

118 References
[86] A. P. Iserte, A. I. Perez-Neira, and M. A. L. Hernandez, “Joint transceiver optimization inwireless multiuser MIMO-OFDM channels based on simulated annealing,” in European Sig-nal Processing Conference, 2002.
[87] P. J. Van Laarhoven and E. H. Aarts, “Simulated annealing,” Springer, pp. 7–15, 1987.
[88] J. E. Mitchell, “Branch-and-cut algorithms for combinatorial optimization problems,” Hand-book of applied optimization, pp. 65–77, 2002.
[89] N. S. Networks, “LTE smartphones measurements,” 2011. [Online]. Available: http://networks.nokia.com/system/files/document/lte measurements final.pdf
[90] A. R. Kan, L. Stougie, and C. Vercellis, “A class of generalized greedy algorithms for themulti-knapsack problem,” Discrete applied mathematics, vol. 42, no. 2-3, pp. 279–290, 1993.
[91] “OpenLTE, an open source implementation of the 3GPP LTE specifications. online at:http://openlte.sourceforge.net.”
[92] “srsLTE, an open source 3GPP LTE library. online at https://github.com/srslte/srslte.”
[93] “SDR LAB, a software defined radio lab. Online at: https://sdr-lab.lip6.fr.”
[94] “Ettus research, a National Instrument company. URL: https://www.ettus.com.”
[95] T. N. Pham, M. F. Tsai, D. B. Nguyen, C. R. Dow, and D. J. Deng, “A cloud-based smart-parking system based on internet-of-things technologies,” IEEE Access, vol. 3, pp. 1581–1591, 2015.

References 119