Dynamic Levels Igarashi Motors India Ltd · Igarashi Motors: Offering Customized ... as a means of...
15
Transcript of Dynamic Levels Igarashi Motors India Ltd · Igarashi Motors: Offering Customized ... as a means of...
Page 2 Source: Company, www.dynamiclevels.com
Igarashi Motors: Offering Customized Engineered Solutions
Company Overview and Stock price ……………………………………….……3
Company back ground and Product Overview ………………………………4
Industry Outlook………………………………………………………………………..5
Company Financial….……………….…………….……………………….….…..…8
Balance Sheet…………………………………………..………….………….….……..9
Cash Flow……………..………………………………..…………….…………………10
Key Financial Ratios………………………………………………………………….10
Peer Comparison………….…………………………………………….……..….…..11
Shareholding Pattern…………………………………………..……………....…...13
Investment Rationale………………………………………...………….......…....14
Disclaimer……………………………………………………………………………..…15
Page 3 Source: Company, www.dynamiclevels.com
Company’s Overview and Stock Price Igarashi Motors specializes in the design and manufacture of small, permanent magnet DC motors and
gear motors. For over half a century, Igarashi Motors has been dedicated to providing quality product and service
to their customers. Since their establishment in 1952, they have grown to include a large variety of
DC motors
Armatures High voltage motors
Gear motors to supply a complete range of products to best meet their customers’ needs.
Motors are designed for a wide range of commercial and
industrial applications, including power tools, home appliances, automotive, and business equipment products.
EXCHANGE SYMBOL IGARASHI
Current Price * (Rs.) 686.45
Face Value (Rs.) 10
52 Week High (Rs.) 773.70 (05-Aug-15)
52 Week Low (Rs.) 375.00 (01-Mar-16)
Life Time high (Rs.) 773.70 (05-Aug-15)
Life Time low (Rs.) 6.60 (13-May-97)
Avg Daily Movement 26.76
Average Volume 44801
1 Month Return (%) 6.80
P/E Ratio (x) 32.86
Book Value 102.78
Market Cap 2093.01 (Cr)
% of Promoter pledged 0
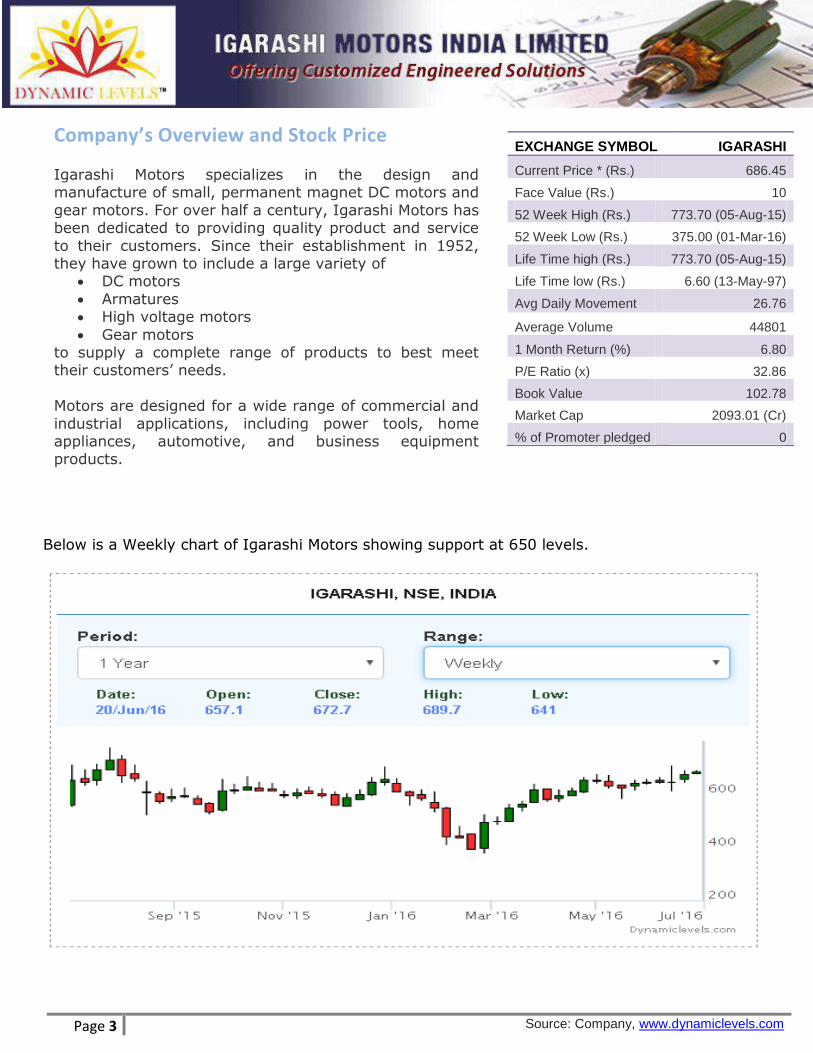
Below is a Weekly chart of Igarashi Motors showing support at 650 levels.
Page 4 Source: Company, www.dynamiclevels.com
Company’s Background Igarashi Motors Ltd started in the year 1946 by Eiji Igarashi who established a private company in Kawasaki for the production and sales of D.C. motors for more
than fifty years. In India the company was established in the year 1993 in a joint venture with Crompton Greave
for development, production and sales of DC motors with accessory, and assembly service like end cap/ case/ armature.
Global Network Igarashi Motors has developed an international presence
as a means of providing quality product to companies throughout the world. With sales offices, manufacturing
facilities and distribution centers worldwide. • China: Heng Gang Yat Yue Industrial. • China: Heng Gang Igarashi Electrical Wor.
• U.S.A : Igarashi Motor Sales, LLC • Germany : Igarashi Motoren
• India : CG lgarashi Motors Ltd • China: Zhubai Igarashi Electric Wor. • Japan : Hanamaki Nippa Industrial Ltd
• Japan: Igarashi Electric Wor. Ltd • Hong Kong: Yat Yue Industrial Ltd
• Hong Kong: Igarashi Electric Wor. Ltd.
Product overview
Small Brushed DC Motors and Gear motors
Igarashi offers a wide variety of motors in different sizes
and shapes. One can select their small and high
performance motor from flat type, round type or geared
motors.
The company is willing to develop or modify motors
according to customer’s specific requirements.
Motors produced by Igarashi are designed in accordance
with ISO 9002 regulations to ensure quality products
with optimal functionality. Before, during, and after
production, their motors are subject to intense quality
controls and testing methods to ensure reliability. Design
FMEA and Process FMEA are extensively used to secure
efficiency and dependability.
Gear motors
Igarashi provides a wide range of
high-performance gear motors to
meet standard and custom
requirements to the OEM market.
Before, during, and after
production, their motors are subject
to intense quality controls and
testing methods to ensure
reliability. The catalog products
listed below will guide you to
specifications and information on
gear motors. Once an inquiry is
placed, each motor will be
engineered to meet your specific
requirements. Click on a category
below to examine general
specifications and engineering
information on any of their
products.
Contract Assembly
Custom designs and value added
components often lead to complete sub-assemblies and assemblies. Igarashi work with their network of
suppliers to further facilitate the incorporation of their motor into
their product by creating a complete assembly that can readily be adapted to production
requirements.
Page 5 Source: Company, www.dynamiclevels.com
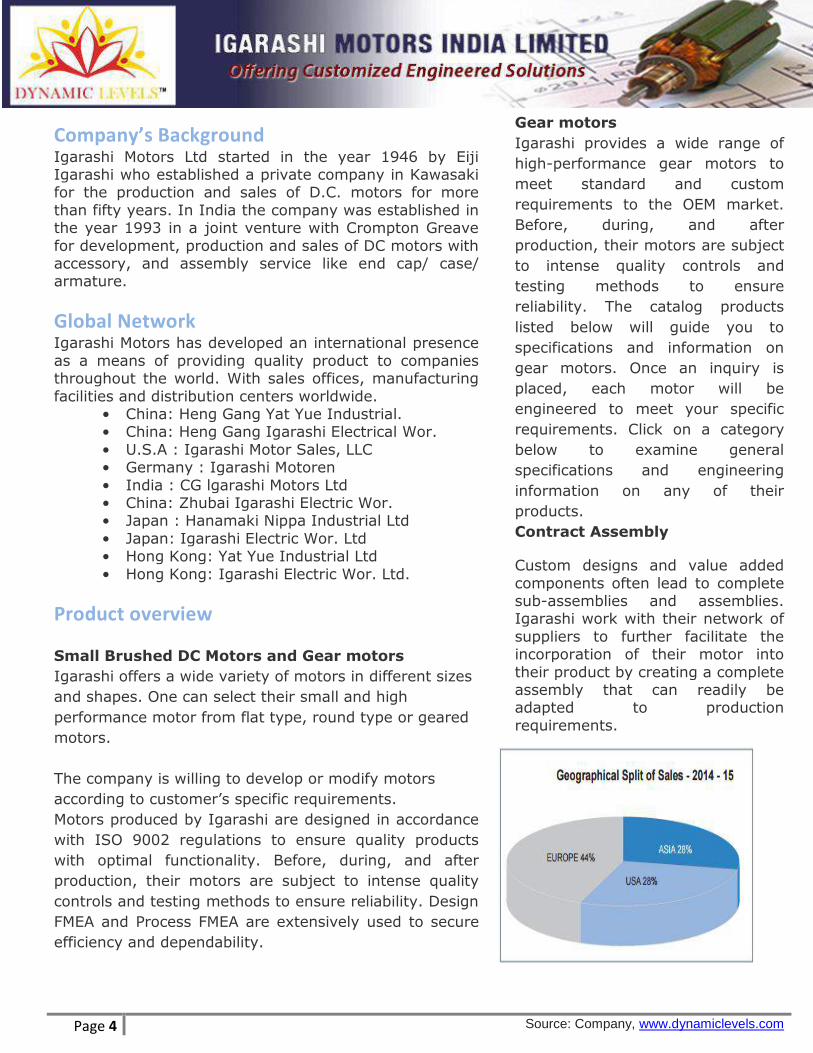
Industry Outlook GLOBAL AUTOMOTIVE INDUSTRY Strategic discussions with Igarashi’s Key Global
Customers who are large players in the Global Automotive Industry highlight the following salient
points: a) The vehicle volume from the current 75 Million (In
2015) vehicles per annum is expected to cross 110 Million by 2022.
b) The share of automotive production in Asia was 33% in 2000 which went upto 50% in 2012 and is likely to be
upwards of 55% by 2020. Vehicle sales in Europe are expected to remain stagnant between 15 to 18 Million
annually and the main growth is expected in Asia pacific and to an extent, in Americas.
c) The fixed investments in automotive capacity in Asia pacific is estimated to be 60% of the total global
investment d) Out of the 110 Million vehicles estimated for 2022,
approximately 90% is expected to be pure ICE vehicles (‘Internal Combustion Engine’) while the balance 10%
will be a combination of electric vehicles and hybrid electrical vehicles.
Intensely analyzing the macro trends and the drivers for performance of vehicles, it still remains clear that fuel
efficiency, emission control, safety, and comfort are the four prioritized performance features in any vehicle platform development initiative. ELECTRIC MOTORS
Actuators to manifest the aforementioned performance drivers in vehicles continue to remain a priority and
discussions with Key customers indicate that the average number of electric motors per global vehicle will move up from 20 ~25 Electric motors per car to 35~40 Electric
Motors per car in the next three to four years.
Power train space continues to remain important for introduction of electric & electronic version of actuators
in the areas of engine, exhaust, and
turbocharger. Thermal management space is also gaining momentum.
Dynamics in development of electric motors for these actuators continue
to remain Electric motor performance parameters,
specifically related to New Technologies resulting in lower weight, smaller volume, lesser
current consumption and favorable overall cost. Due to stringency of
fuel efficiency and emission norms, electric motors for aforementioned actuators is likely to go up steadily
over the next years from the present level of 1~ 2 motors
average per global vehicle to 3 ~ 4 motors average per global vehicle.
The key applications, in this space continue to be Electronic Throttle
Control valves in engines including air control valves, Exhaust gas
recirculation valves, Waste gate actuators and Bypass valves in Turbo chargers & fluid control
valves for thermal management applications. The market for these
motors is estimated to grow at more than twice the rate of the vehicle growth.
Page 6 Source: Company, www.dynamiclevels.com
Over all Industry Outlook
The Indian auto-components industry has experienced
healthy growth over the last few years. Some of the
factors attributable to this include: a buoyant end-user
market, improved consumer sentiment and return of
adequate liquidity in the financial system.
The auto-components industry accounts for almost seven
per cent of India’s Gross Domestic Product (GDP) and
employs as many as 19 million people, both directly and
indirectly. A stable government framework, increased
purchasing power, large domestic market, and an ever
increasing development in infrastructure have made
India a favourable destination for investment.
Market Size
The Indian auto-components industry can be broadly
classified into the organised and unorganised sectors.
The organised sector caters to the Original Equipment
Manufacturers (OEMs) and consists of high-value
precision instruments while the unorganised sector
comprises low-valued products and caters mostly to the
aftermarket category.
Over the last decade, the automotive components
industry has scaled three times to US$ 40 billion in 2015
while exports have grown even faster to US$ 11 billion.
This has been driven by strong growth in the domestic
market and increasing globalisation (including exports)
of several Indian suppliers.
According to the Automotive Component Manufacturers
Association of India (ACMA), the Indian auto-components
industry is expected to register a turnover of US$ 100
billion by 2020 backed by strong exports ranging
between US$ 80- US$ 100 billion by 2026, from the
current US$ 11.2 billion.
Government Initiatives
The Government of India’s Automotive Mission Plan
(AMP) 2006–2016 has come a long way in ensuring
growth for the sector. It is expected that this sector's
contribution to the GDP will reach US$ 145 billion in
2016 due to the government’s special focus on exports of
small cars, multi-utility vehicles (MUVs), two and three-
wheelers and auto components. Separately, the
deregulation of FDI in this sector has also helped foreign
companies to make large investments in India.
Page 7 Source: Company, www.dynamiclevels.com
Investments
The cumulative Foreign Direct Investment (FDI) inflows
into the Indian automobile industry during the period
April 2000 – December 2015 were recorded at US$
14.32 billion, as per data by the Department of Industrial
Policy and Promotion (DIPP).
Some of the major investments made into the Indian
auto components sector are as follows:
Auto components maker Bharat Forge Ltd (BFL),
the flagship company of the US$ 3 billion Kalyani
Group, has formalised agreement with Rolls-Royce
Plc which will supply BFL with critical and high
integrity forged and machined components
Canada’s Magna International Incorporated has
started production at two facilities in Gujarat’s
Sanand, which will supply auto parts to Ford Motor
Co in India
Everstone Capital, a Singapore-based private
equity (PE) firm, has purchased 51 per cent in
Indian auto components maker SJS Enterprises for
an estimated Rs 350 crore (US$ 51.35 million).
ArcelorMittal signed a joint venture agreement
with Steel Authority of India Ltd (SAIL) to
establish an automotive steel manufacturing
facility in India.
German auto components maker Bosch Ltd
opened its new factory at Bidadi, near Bengaluru,
which is its fifth manufacturing plant in Karnataka.
The company has also signed a memorandum of
understanding (MoU) with Indian Institute of
Science (IISc), Bengaluru with a view to
strengthen Bosch’s research and development in
areas including mobility and healthcare thereby
driving innovation for India-centric requirements.
French tyre manufacturer Michelin announced
plans to produce 16,000 tonnes of truck and bus
tyres from its Indian facility this year, a 45 per
cent rise from last year.
Amtek Auto Ltd acquired
Germany-based Scholz
Edelstahl GmbH through its
100 per cent Singapore-
based subsidiary Amtek
Precision Engineering Pte Ltd.
MRF Ltd plans to invest Rs
4,500 crore (US$ 660.231
million) in its two factories in
Tamil Nadu as part of its
expansion plan.
German luxury car maker
Bayerische Motoren Werke
AG’s ( BMW ’s) announced it
will start sourcing parts from
at least seven India-based
auto parts makers in
response to promote ‘Make in
India’.
Hero MotoCorp is investing
Rs 5,000 crore (US$ 733.59
million) in five manufacturing
facilities across India,
Colombia and Bangladesh, to
increase its annual production
capacity to 12 million units
by 2020.
Page 8 Source: Company, www.dynamiclevels.com
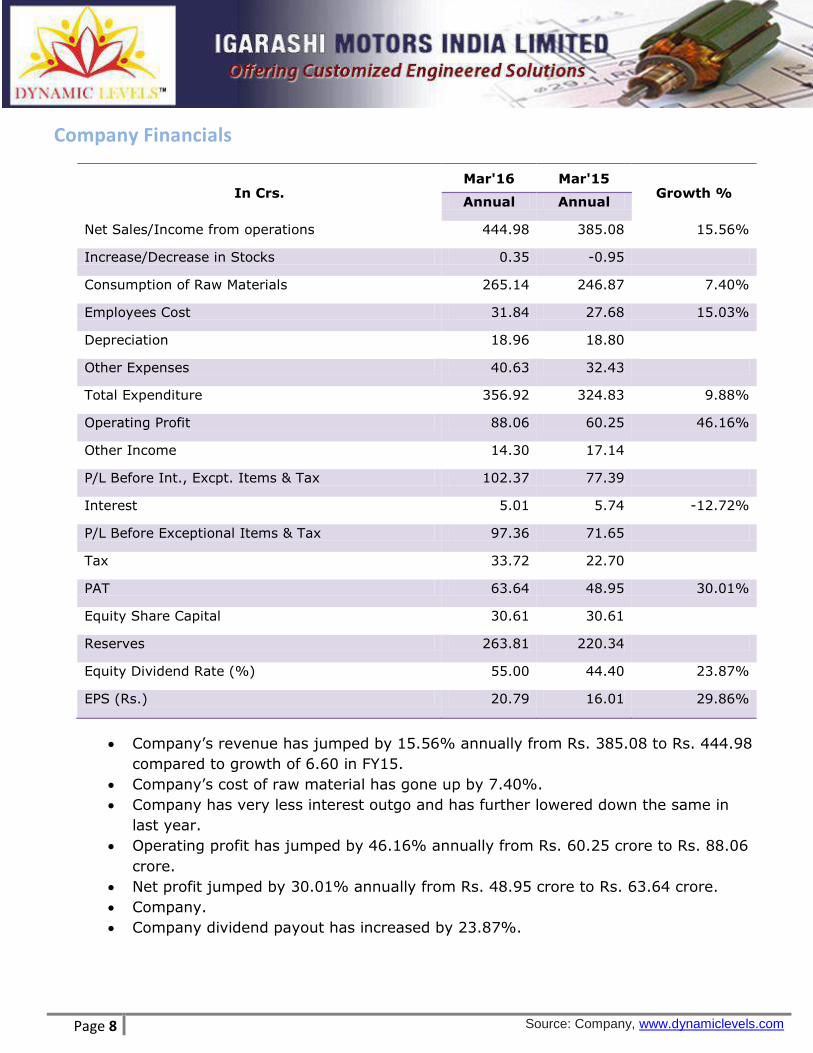
Company Financials
In Crs. Mar'16 Mar'15
Growth % Annual Annual
Net Sales/Income from operations 444.98 385.08 15.56%
Increase/Decrease in Stocks 0.35 -0.95
Consumption of Raw Materials 265.14 246.87 7.40%
Employees Cost 31.84 27.68 15.03%
Depreciation 18.96 18.80
Other Expenses 40.63 32.43
Total Expenditure 356.92 324.83 9.88%
Operating Profit 88.06 60.25 46.16%
Other Income 14.30 17.14
P/L Before Int., Excpt. Items & Tax 102.37 77.39
Interest 5.01 5.74 -12.72%
P/L Before Exceptional Items & Tax 97.36 71.65
Tax 33.72 22.70
PAT 63.64 48.95 30.01%
Equity Share Capital 30.61 30.61
Reserves 263.81 220.34
Equity Dividend Rate (%) 55.00 44.40 23.87%
EPS (Rs.) 20.79 16.01 29.86%
Company’s revenue has jumped by 15.56% annually from Rs. 385.08 to Rs. 444.98
compared to growth of 6.60 in FY15.
Company’s cost of raw material has gone up by 7.40%.
Company has very less interest outgo and has further lowered down the same in
last year.
Operating profit has jumped by 46.16% annually from Rs. 60.25 crore to Rs. 88.06
crore.
Net profit jumped by 30.01% annually from Rs. 48.95 crore to Rs. 63.64 crore.
Company.
Company dividend payout has increased by 23.87%.
Page 9 Source: Company, www.dynamiclevels.com
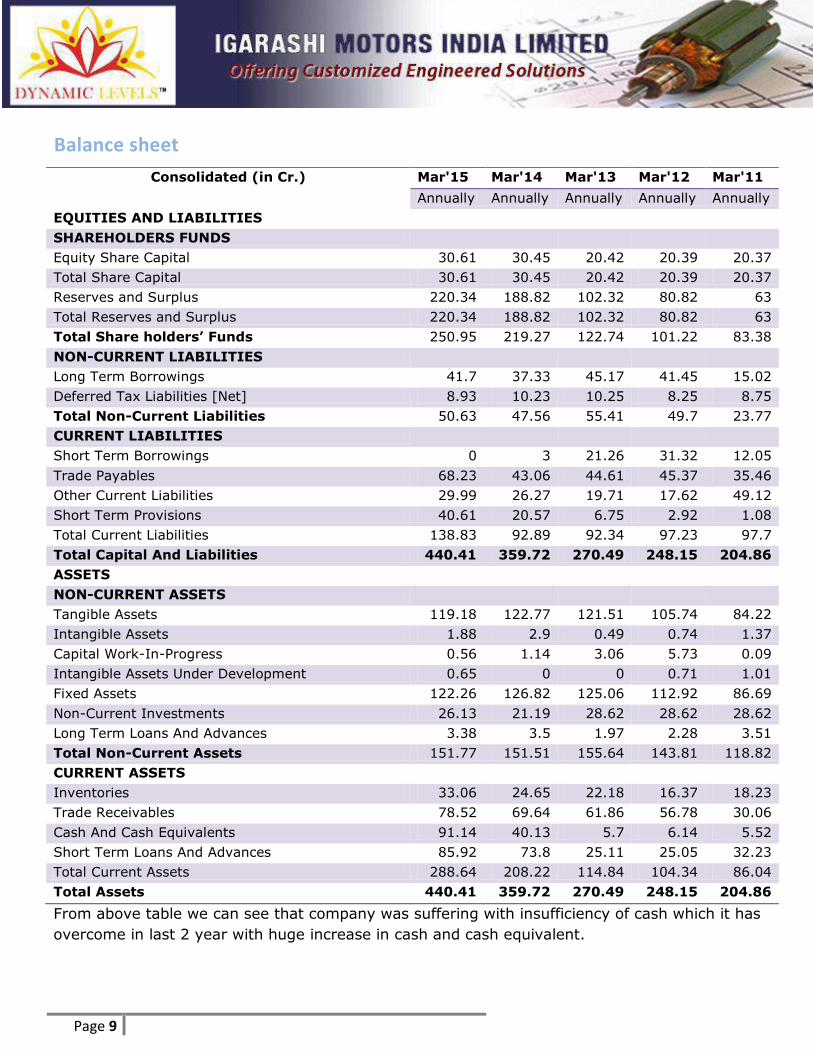
Balance sheet
Consolidated (in Cr.) Mar'15 Mar'14 Mar'13 Mar'12 Mar'11
Annually Annually Annually Annually Annually
EQUITIES AND LIABILITIES
SHAREHOLDERS FUNDS
Equity Share Capital 30.61 30.45 20.42 20.39 20.37
Total Share Capital 30.61 30.45 20.42 20.39 20.37
Reserves and Surplus 220.34 188.82 102.32 80.82 63
Total Reserves and Surplus 220.34 188.82 102.32 80.82 63
Total Share holders’ Funds 250.95 219.27 122.74 101.22 83.38
NON-CURRENT LIABILITIES
Long Term Borrowings 41.7 37.33 45.17 41.45 15.02
Deferred Tax Liabilities [Net] 8.93 10.23 10.25 8.25 8.75
Total Non-Current Liabilities 50.63 47.56 55.41 49.7 23.77
CURRENT LIABILITIES
Short Term Borrowings 0 3 21.26 31.32 12.05
Trade Payables 68.23 43.06 44.61 45.37 35.46
Other Current Liabilities 29.99 26.27 19.71 17.62 49.12
Short Term Provisions 40.61 20.57 6.75 2.92 1.08
Total Current Liabilities 138.83 92.89 92.34 97.23 97.7
Total Capital And Liabilities 440.41 359.72 270.49 248.15 204.86
ASSETS
NON-CURRENT ASSETS
Tangible Assets 119.18 122.77 121.51 105.74 84.22
Intangible Assets 1.88 2.9 0.49 0.74 1.37
Capital Work-In-Progress 0.56 1.14 3.06 5.73 0.09
Intangible Assets Under Development 0.65 0 0 0.71 1.01
Fixed Assets 122.26 126.82 125.06 112.92 86.69
Non-Current Investments 26.13 21.19 28.62 28.62 28.62
Long Term Loans And Advances 3.38 3.5 1.97 2.28 3.51
Total Non-Current Assets 151.77 151.51 155.64 143.81 118.82
CURRENT ASSETS
Inventories 33.06 24.65 22.18 16.37 18.23
Trade Receivables 78.52 69.64 61.86 56.78 30.06
Cash And Cash Equivalents 91.14 40.13 5.7 6.14 5.52
Short Term Loans And Advances 85.92 73.8 25.11 25.05 32.23
Total Current Assets 288.64 208.22 114.84 104.34 86.04
Total Assets 440.41 359.72 270.49 248.15 204.86
From above table we can see that company was suffering with insufficiency of cash which it has
overcome in last 2 year with huge increase in cash and cash equivalent.
Page 10 Source: Company, www.dynamiclevels.com
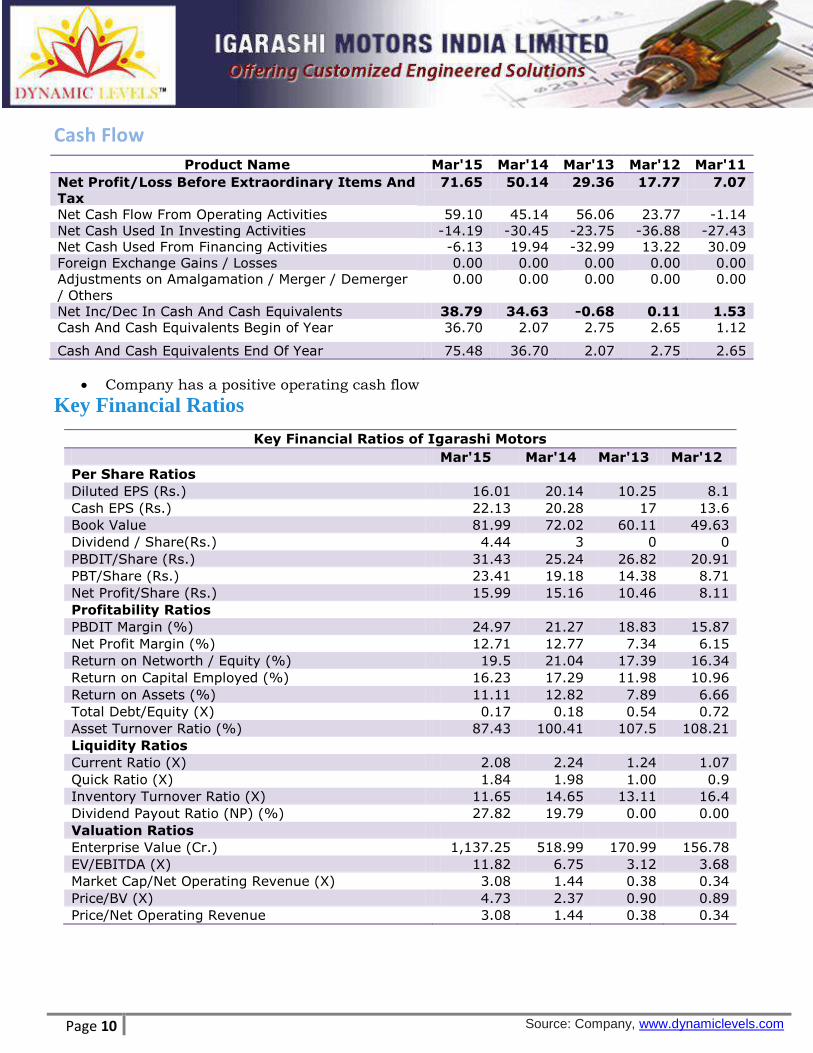
Cash Flow
Key Financial Ratios
Product Name Mar'15 Mar'14 Mar'13 Mar'12 Mar'11 Net Profit/Loss Before Extraordinary Items And
Tax
71.65 50.14 29.36 17.77 7.07
Net Cash Flow From Operating Activities 59.10 45.14 56.06 23.77 -1.14
Net Cash Used In Investing Activities -14.19 -30.45 -23.75 -36.88 -27.43
Net Cash Used From Financing Activities -6.13 19.94 -32.99 13.22 30.09
Foreign Exchange Gains / Losses 0.00 0.00 0.00 0.00 0.00
Adjustments on Amalgamation / Merger / Demerger
/ Others
0.00 0.00 0.00 0.00 0.00
Net Inc/Dec In Cash And Cash Equivalents 38.79 34.63 -0.68 0.11 1.53
Cash And Cash Equivalents Begin of Year 36.70 2.07 2.75 2.65 1.12
Cash And Cash Equivalents End Of Year 75.48 36.70 2.07 2.75 2.65
Company has a positive operating cash flow
Company has not made any big capital investment in Mar’15
Key Financial Ratios of Igarashi Motors
Mar'15 Mar'14 Mar'13 Mar'12 Per Share Ratios
Diluted EPS (Rs.) 16.01 20.14 10.25 8.1
Cash EPS (Rs.) 22.13 20.28 17 13.6
Book Value 81.99 72.02 60.11 49.63
Dividend / Share(Rs.) 4.44 3 0 0
PBDIT/Share (Rs.) 31.43 25.24 26.82 20.91
PBT/Share (Rs.) 23.41 19.18 14.38 8.71
Net Profit/Share (Rs.) 15.99 15.16 10.46 8.11
Profitability Ratios
PBDIT Margin (%) 24.97 21.27 18.83 15.87
Net Profit Margin (%) 12.71 12.77 7.34 6.15
Return on Networth / Equity (%) 19.5 21.04 17.39 16.34
Return on Capital Employed (%) 16.23 17.29 11.98 10.96
Return on Assets (%) 11.11 12.82 7.89 6.66
Total Debt/Equity (X) 0.17 0.18 0.54 0.72
Asset Turnover Ratio (%) 87.43 100.41 107.5 108.21
Liquidity Ratios
Current Ratio (X) 2.08 2.24 1.24 1.07
Quick Ratio (X) 1.84 1.98 1.00 0.9
Inventory Turnover Ratio (X) 11.65 14.65 13.11 16.4
Dividend Payout Ratio (NP) (%) 27.82 19.79 0.00 0.00
Valuation Ratios
Enterprise Value (Cr.) 1,137.25 518.99 170.99 156.78
EV/EBITDA (X) 11.82 6.75 3.12 3.68
Market Cap/Net Operating Revenue (X) 3.08 1.44 0.38 0.34
Price/BV (X) 4.73 2.37 0.90 0.89
Price/Net Operating Revenue 3.08 1.44 0.38 0.34
Page 11 Source: Company, www.dynamiclevels.com
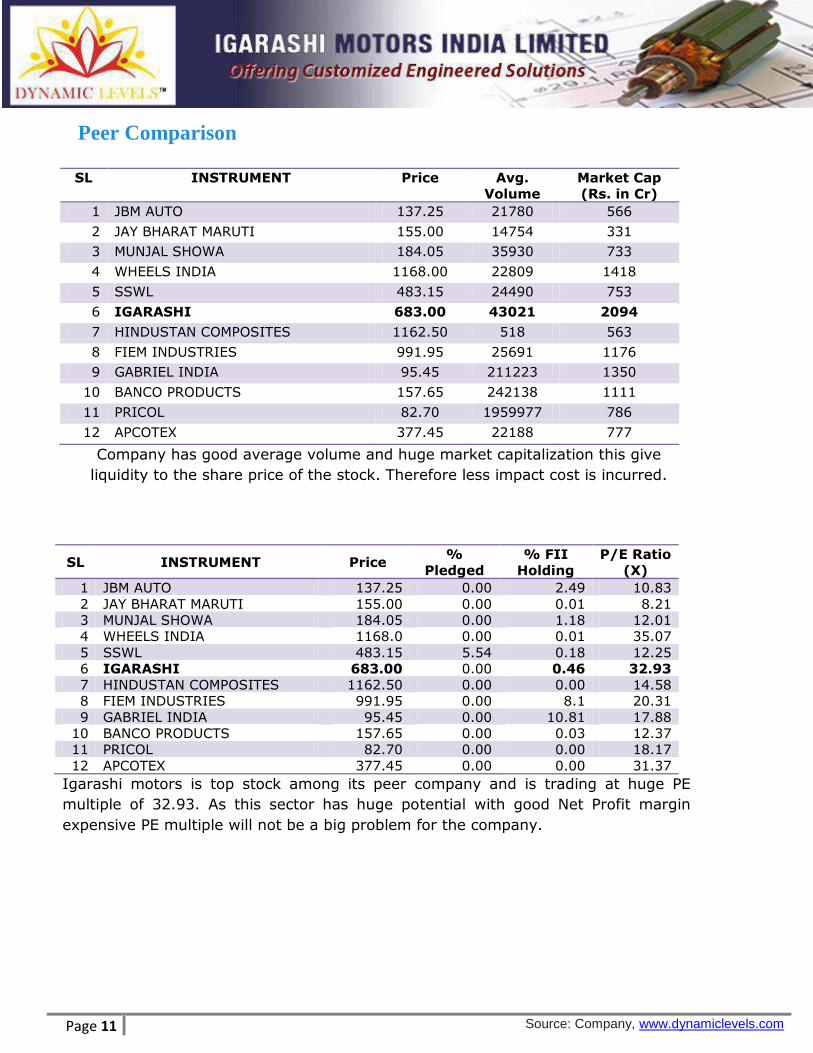
Peer Comparison
SL INSTRUMENT Price Avg.
Volume
Market Cap
(Rs. in Cr)
1 JBM AUTO 137.25 21780 566
2 JAY BHARAT MARUTI 155.00 14754 331
3 MUNJAL SHOWA 184.05 35930 733
4 WHEELS INDIA 1168.00 22809 1418
5 SSWL 483.15 24490 753
6 IGARASHI 683.00 43021 2094
7 HINDUSTAN COMPOSITES 1162.50 518 563
8 FIEM INDUSTRIES 991.95 25691 1176
9 GABRIEL INDIA 95.45 211223 1350
10 BANCO PRODUCTS 157.65 242138 1111
11 PRICOL 82.70 1959977 786
12 APCOTEX 377.45 22188 777
Company has good average volume and huge market capitalization this give
liquidity to the share price of the stock. Therefore less impact cost is incurred.
SL INSTRUMENT Price %
Pledged
% FII
Holding
P/E Ratio
(X)
1 JBM AUTO 137.25 0.00 2.49 10.83
2 JAY BHARAT MARUTI 155.00 0.00 0.01 8.21
3 MUNJAL SHOWA 184.05 0.00 1.18 12.01
4 WHEELS INDIA 1168.0 0.00 0.01 35.07
5 SSWL 483.15 5.54 0.18 12.25
6 IGARASHI 683.00 0.00 0.46 32.93
7 HINDUSTAN COMPOSITES 1162.50 0.00 0.00 14.58
8 FIEM INDUSTRIES 991.95 0.00 8.1 20.31
9 GABRIEL INDIA 95.45 0.00 10.81 17.88
10 BANCO PRODUCTS 157.65 0.00 0.03 12.37
11 PRICOL 82.70 0.00 0.00 18.17
12 APCOTEX 377.45 0.00 0.00 31.37
Igarashi motors is top stock among its peer company and is trading at huge PE
multiple of 32.93. As this sector has huge potential with good Net Profit margin
expensive PE multiple will not be a big problem for the company.
Page 12 Source: Company, www.dynamiclevels.com
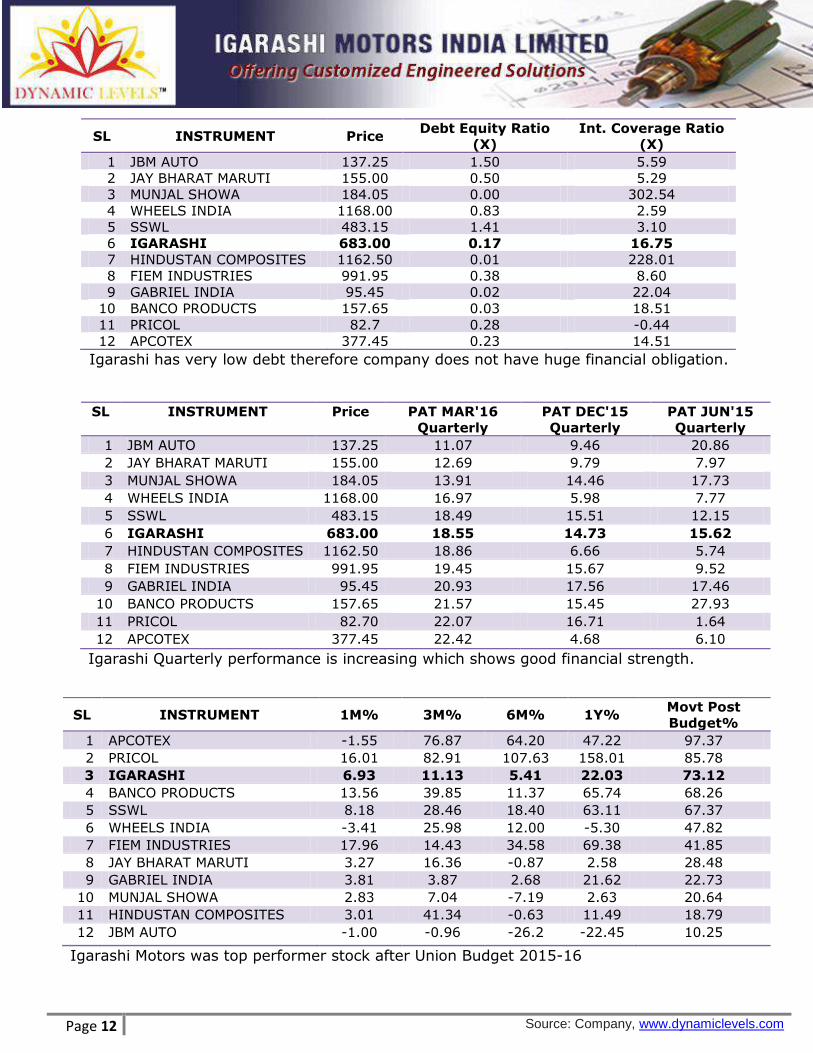
SL INSTRUMENT Price PAT MAR'16
Quarterly
PAT DEC'15
Quarterly
PAT JUN'15
Quarterly
1 JBM AUTO 137.25 11.07 9.46 20.86
2 JAY BHARAT MARUTI 155.00 12.69 9.79 7.97
3 MUNJAL SHOWA 184.05 13.91 14.46 17.73
4 WHEELS INDIA 1168.00 16.97 5.98 7.77
5 SSWL 483.15 18.49 15.51 12.15
6 IGARASHI 683.00 18.55 14.73 15.62
7 HINDUSTAN COMPOSITES 1162.50 18.86 6.66 5.74
8 FIEM INDUSTRIES 991.95 19.45 15.67 9.52
9 GABRIEL INDIA 95.45 20.93 17.56 17.46
10 BANCO PRODUCTS 157.65 21.57 15.45 27.93
11 PRICOL 82.70 22.07 16.71 1.64
12 APCOTEX 377.45 22.42 4.68 6.10
Igarashi Quarterly performance is increasing which shows good financial strength.
SL INSTRUMENT Price Debt Equity Ratio
(X)
Int. Coverage Ratio
(X)
1 JBM AUTO 137.25 1.50 5.59
2 JAY BHARAT MARUTI 155.00 0.50 5.29
3 MUNJAL SHOWA 184.05 0.00 302.54
4 WHEELS INDIA 1168.00 0.83 2.59
5 SSWL 483.15 1.41 3.10
6 IGARASHI 683.00 0.17 16.75
7 HINDUSTAN COMPOSITES 1162.50 0.01 228.01
8 FIEM INDUSTRIES 991.95 0.38 8.60
9 GABRIEL INDIA 95.45 0.02 22.04
10 BANCO PRODUCTS 157.65 0.03 18.51
11 PRICOL 82.7 0.28 -0.44
12 APCOTEX 377.45 0.23 14.51
Igarashi has very low debt therefore company does not have huge financial obligation.
SL INSTRUMENT 1M% 3M% 6M% 1Y% Movt Post
Budget%
1 APCOTEX -1.55 76.87 64.20 47.22 97.37
2 PRICOL 16.01 82.91 107.63 158.01 85.78
3 IGARASHI 6.93 11.13 5.41 22.03 73.12
4 BANCO PRODUCTS 13.56 39.85 11.37 65.74 68.26
5 SSWL 8.18 28.46 18.40 63.11 67.37
6 WHEELS INDIA -3.41 25.98 12.00 -5.30 47.82
7 FIEM INDUSTRIES 17.96 14.43 34.58 69.38 41.85
8 JAY BHARAT MARUTI 3.27 16.36 -0.87 2.58 28.48
9 GABRIEL INDIA 3.81 3.87 2.68 21.62 22.73
10 MUNJAL SHOWA 2.83 7.04 -7.19 2.63 20.64
11 HINDUSTAN COMPOSITES 3.01 41.34 -0.63 11.49 18.79
12 JBM AUTO -1.00 -0.96 -26.2 -22.45 10.25
Igarashi Motors was top performer stock after Union Budget 2015-16
Page 13 Source: Company, www.dynamiclevels.com
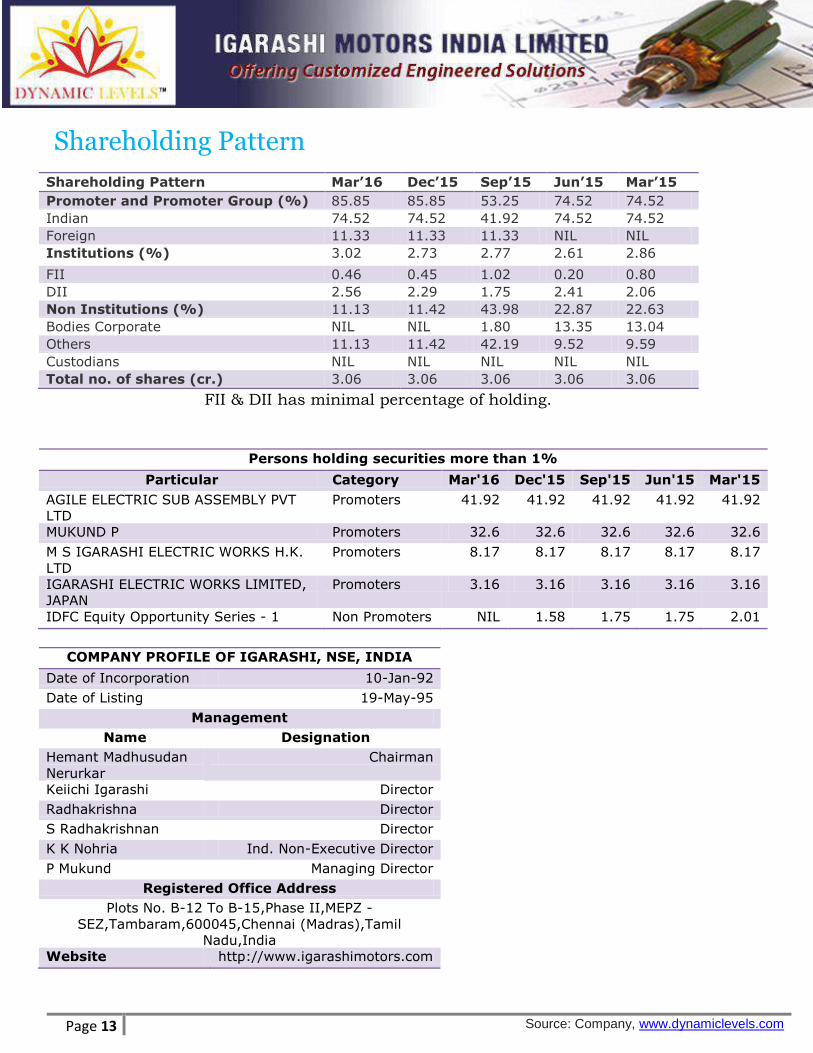
Shareholding Pattern
Shareholding Pattern Mar’16 Dec’15 Sep’15 Jun’15 Mar’15
Promoter and Promoter Group (%) 85.85 85.85 53.25 74.52 74.52
Indian 74.52 74.52 41.92 74.52 74.52
Foreign 11.33 11.33 11.33 NIL NIL
Institutions (%) 3.02 2.73 2.77 2.61 2.86
FII 0.46 0.45 1.02 0.20 0.80
DII 2.56 2.29 1.75 2.41 2.06
Non Institutions (%) 11.13 11.42 43.98 22.87 22.63
Bodies Corporate NIL NIL 1.80 13.35 13.04
Others 11.13 11.42 42.19 9.52 9.59
Custodians NIL NIL NIL NIL NIL
Total no. of shares (cr.) 3.06 3.06 3.06 3.06 3.06
FII & DII has minimal percentage of holding.
COMPANY PROFILE OF IGARASHI, NSE, INDIA
Date of Incorporation 10-Jan-92
Date of Listing 19-May-95
Management
Name Designation
Hemant Madhusudan
Nerurkar
Chairman
Keiichi Igarashi Director
Radhakrishna Director
S Radhakrishnan Director
K K Nohria Ind. Non-Executive Director
P Mukund Managing Director
Registered Office Address
Plots No. B-12 To B-15,Phase II,MEPZ -
SEZ,Tambaram,600045,Chennai (Madras),Tamil
Nadu,India
Website http://www.igarashimotors.com
Persons holding securities more than 1%
Particular Category Mar'16 Dec'15 Sep'15 Jun'15 Mar'15
AGILE ELECTRIC SUB ASSEMBLY PVT
LTD
Promoters 41.92 41.92 41.92 41.92 41.92
MUKUND P Promoters 32.6 32.6 32.6 32.6 32.6
M S IGARASHI ELECTRIC WORKS H.K.
LTD
Promoters 8.17 8.17 8.17 8.17 8.17
IGARASHI ELECTRIC WORKS LIMITED,
JAPAN
Promoters 3.16 3.16 3.16 3.16 3.16
IDFC Equity Opportunity Series - 1 Non Promoters NIL 1.58 1.75 1.75 2.01
Page 14 Source: Company, www.dynamiclevels.com
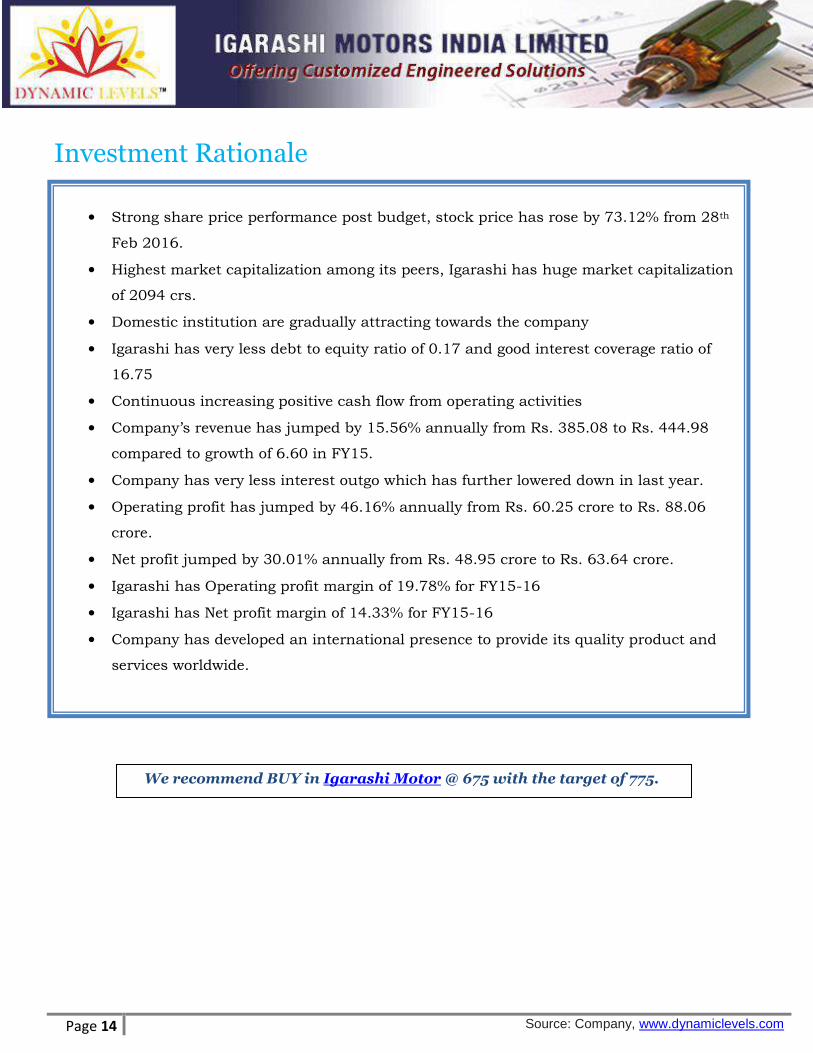
Investment Rationale
• Strong share price performance post budget, stock price has rose by 73.12% from 28th
Feb 2016.
• Highest market capitalization among its peers, Igarashi has huge market capitalization
of 2094 crs.
• Domestic institution are gradually attracting towards the company
• Igarashi has very less debt to equity ratio of 0.17 and good interest coverage ratio of
16.75
• Continuous increasing positive cash flow from operating activities
• Company’s revenue has jumped by 15.56% annually from Rs. 385.08 to Rs. 444.98
compared to growth of 6.60 in FY15.
• Company has very less interest outgo which has further lowered down in last year.
• Operating profit has jumped by 46.16% annually from Rs. 60.25 crore to Rs. 88.06
crore.
• Net profit jumped by 30.01% annually from Rs. 48.95 crore to Rs. 63.64 crore.
• Igarashi has Operating profit margin of 19.78% for FY15-16
• Igarashi has Net profit margin of 14.33% for FY15-16
• Company has developed an international presence to provide its quality product and
services worldwide.
We recommend BUY in Igarashi Motor @ 675 with the target of 775.
Page 15 Source: Company, www.dynamiclevels.com
Disclaimer: Research Disclaimer and Disclosure inter-alia as required under Securities and Exchange Board of India (Research Analysts) Regulations, 2014. Dynamic Equities Pvt. Ltd. is a member of National Stock Exchange of India Ltd. (NSEIL), Bombay Stock Exchange Ltd (BSE), Multi Stock Exchange of India Ltd (MCX-SX) and also a depository participant with National Securities Depository Ltd (NSDL) and Central Depository Services Ltd.(CDSL). Dynamic is engaged in the business of Stock Broking, Depository Services, Investment Advisory Services and Portfolio Management Services. Dynamic Equities Pvt. Ltd. is holding company of Dynamic Commodities Pvt. Ltd. , a member of Multi Commodities Exchange (MCX) & National Commodity & Derivatives Exchange Ltd.(NCDEX). We hereby declare that our activities were neither suspended nor we have defaulted with any stock exchange authority with whom we are registered. SEBI, Exchanges and Depositories have conducted the routine inspection and based on their observations have issued advise letters or levied minor penalty on for certain operational deviations. Answers to the Best of the knowledge and belief of Dynamic/ its Associates/ Research Analyst who prepared this report
DYANMIC/its Associates/ Research Analyst/ his Relative have any financial interest in the subject company? No
DYANMIC/its Associates/ Research Analyst/ his Relative have actual/beneficial ownership of one per cent or more securities of the subject company? No
DYANMIC/its Associates/ Research Analyst/ his Relative have any other material conflict of interest at the time of publication of the research report or at the time of public appearance? No
DYANMIC/its Associates/ Research Analyst/ his Relative have received any compensation from the subject company in the past twelve months? No
DYANMIC/its Associates/ Research Analyst/ his Relative have managed or co-managed public offering of securities for the subject company in the past twelve months? No
DYANMIC/its Associates/ Research Analyst/ his Relative have received any compensation for investment banking or merchant banking or brokerage services from the subject company in the past twelve months? No
DYANMIC/its Associates/ Research Analyst/ his Relative have received any compensation for products or services other than investment banking or merchant banking or brokerage services from the subject company in the past twelve months? No
DYANMIC/its Associates/ Research Analyst/ his Relative have received any compensation or other benefits from the Subject Company or third party in connection with the research report? No
DYANMIC/its Associates/ Research Analyst/ his Relative have served as an officer, director or employee of the subject company? No
DYANMIC/its Associates/ Research Analyst/ his Relative have been engaged in market making activity for the subject company? No
General Disclaimer: - This Research Report (hereinafter called “Report”) is meant solely for use by the recipient and is not for circulation. This Report does not constitute a personal recommendation or take into account the particular investment objectives, financial situations, or needs of individual clients. The recommendations, if any, made herein are expression of views and/or opinions and should not be deemed or construed to be neither advice for the purpose of purchase or sale of any security, derivatives or any other security through Dynamic nor any solicitation or offering of any investment /trading opportunity on behalf of the issuer(s) of the respective security (ies) referred to herein. These information / opinions / views are not meant to serve as a professional investment guide for the readers. No action is solicited based upon the information provided herein. Recipients of this Report should rely on information/data arising out of their own investigations. Readers are advised to seek independent professional advice and arrive at an informed trading/investment decision before executing any trades or making any investments. This Report has been prepared on the basis of publicly available information, internally developed data and other sources believed by Dynamic to be reliable. Dynamic or its directors, employees, affiliates or representatives do not assume any responsibility for, or warrant the accuracy, completeness, adequacy and reliability of such information / opinions / views. While due care has been taken to ensure that the disclosures and opinions given are fair and reasonable, none of the directors, employees, affiliates or representatives of Dynamic shall be liable for any direct, indirect, special, incidental, consequential, punitive or exemplary damages, including loss profits arising in any way whatsoever from the information / opinions / views contained in this Report. The price and value of the investments referred to in this Report and the income from them may go down as well as up, and investors may realize losses on any investments. Past performance is not a guide for future performance. Dynamic levels do not provide tax advice to its clients, and all investors are strongly advised to consult with their tax advisers regarding taxation aspects of any potential investment. Opinions expressed are our current opinions as of the date appearing on this Research only. We do not undertake to advise you as to any change of our views expressed in this Report. User should keep this risk in mind and not hold dynamic levels, its employees and associates responsible for any losses, damages of any type whatsoever. Dynamic and its associates or employees may; (a) from time to time, have long or short positions in, and buy or sell the investments in/ security of company (ies) mentioned herein and it may not be construed as potential conflict of interest with respect to any recommendation and related information and opinions. Without limiting any of the foregoing, in no event shall Dynamic and its associates or employees or any third party involved in, or related to computing or compiling the information have any liability for any damages of any kind. We and our affiliates/associates, officers, directors, and employees, Research Analyst(including relatives) worldwide may: (a) from time to time, have long or short positions in, and buy or sell the securities thereof, of company (ies) mentioned herein or (b) be engaged in any other transaction involving such securities and earn brokerage or other compensation or act as a market maker in the financial instruments of the subject company/company (ies) discussed herein or act as advisor to such company (ies) or have other potential/material conflict of interest with respect to any recommendation and related information and opinions at the time of publication of Research Report. Dynamic may have proprietary long/short position in the above mentioned scrip(s) and therefore may be considered as interested. The views provided herein are general in nature and does not consider risk appetite or investment objective of particular investor; readers are requested to take independent professional advice before investing. This should not be construed as invitation or solicitation to do business with Dynamic. Dynamic Equities Pvt. Ltd. are also engaged in Proprietary Trading apart from Client Business.
https://www.dynamiclevels.com/en/disclaimer