Dual infection with HIV and malaria fuels the spread of …openaccess.sgul.ac.uk/109254/1/Manuscript...
73
Association between diabetes mellitus and active tuberculosis: a systematic review and meta-analysis Rami H. Al-Rifai, 1,2,3,* Fiona Pearson, 4 Julia A. Critchley, 4 and Laith J. Abu‐Raddad 1,2,5 1 Infectious Disease Epidemiology Group, Weill Cornell Medical College–Qatar, Cornell University, Qatar Foundation–Education City, Doha, Qatar 2 Department of Healthcare Policy and Research, Weill Cornell Medical College, Cornell University, New York, USA 3 Institute of Public Health, College of Medicine and Health Sciences, United Arab Emirates University, Al-Ain, United Arab Emirates 4 Population Health Research Institute, St George’s, University of London, London, UK 5 College of Public Health, Hamad bin Khalifa University, Qatar Foundation, Education City, Doha, Qatar Word count: Abstract: 293 words, Text: 4,784 words Number of tables: 3 1 1 2 3 4 5 6 7 8 9 10 11 12 13 14 15 16 17 18 19 20
Transcript of Dual infection with HIV and malaria fuels the spread of …openaccess.sgul.ac.uk/109254/1/Manuscript...

Association between diabetes mellitus and active
tuberculosis: a systematic review and meta-analysis
Rami H. Al-Rifai,1,2,3,* Fiona Pearson,4 Julia A. Critchley,4 and Laith J. Abu‐Raddad1,2,5
1 Infectious Disease Epidemiology Group, Weill Cornell Medical College–Qatar, Cornell
University, Qatar Foundation–Education City, Doha, Qatar
2 Department of Healthcare Policy and Research, Weill Cornell Medical College, Cornell
University, New York, USA
3 Institute of Public Health, College of Medicine and Health Sciences, United Arab Emirates
University, Al-Ain, United Arab Emirates
4 Population Health Research Institute, St George’s, University of London, London, UK
5 College of Public Health, Hamad bin Khalifa University, Qatar Foundation, Education City,
Doha, Qatar
Word count: Abstract: 293 words, Text: 4,784 words
Number of tables: 3
Number of figures: 2
Number of boxes: 0
Short title: Association between diabetes mellitus and active tuberculosis.
*Corresponding author:
Correspondence to: Rami H. Al-Rifai, Institute of Public Health, College of Medicine and Health
Sciences, United Arab Emirates University, Al-Ain, United Arab Emirates, P.O. Box 17666, Al
Ain, UAE. Telephone: +(971) 3713-7450. Fax: +(971) 3767-2022. E-mail: [email protected];
1
1
2
3
4
5
6
7
8
9
10
11
12
13
14
15
16
17
18
19
20
21
22
23
24
Abstract
The burgeoning epidemic of diabetes mellitus (DM) is one of the major global health challenges.
We systematically reviewed the published literature to provide a summary estimate of the
association between DM and active tuberculosis (TB). We searched Medline and EMBASE
databases for studies reporting adjusted estimates on the TB–DM association published before
December 22, 2015, with no restrictions on region and language. In the meta-analysis, adjusted
estimates were pooled using a DerSimonian-Laird random-effects model, according to study
design. Risk of bias assessment and sensitivity analyses were conducted. 44 eligible studies were
included, which consisted of 58,468,404 subjects from 16 countries. Compared with non-DM
patients, DM patients had 3.59–fold (95% confidence interval (CI) 2.25–5.73), 1.55–fold (95%
CI 1.39–1.72), and 2.09–fold (95% CI 1.71–2.55) increased risk of active TB in four prospective,
16 retrospective, and 17 case-control studies, respectively. Country income level (3.16–fold in
low/middle– vs. 1.73–fold in high–income countries), background TB incidence (2.05–fold in
countries with >50 vs. 1.89–fold in countries with ≤50 TB cases per 100,000 person-year), and
geographical region (2.44–fold in Asia vs. 1.71–fold in Europe and 1.73–fold in USA/Canada)
affected appreciably the estimated association, but potential risk of bias, type of population
(general versus clinical), and potential for duplicate data, did not. Microbiological ascertainment
for TB (3.03–fold) and/or blood testing for DM (3.10–fold), as well as uncontrolled DM (3.30–
fold), resulted in stronger estimated association. DM is associated with a two- to four-fold
increased risk of active TB. The association was stronger when ascertainment was based on
biological testing rather than medical records or self-report. The burgeoning DM epidemic could
impact upon the achievements of the WHO “End TB Strategy” for reducing TB incidence.
2
25
26
27
28
29
30
31
32
33
34
35
36
37
38
39
40
41
42
43
44
45
46

Introduction
Despite the decline in the mortality rate of active tuberculosis (TB) since 1990, TB is ranked as
one of the leading causes of death [1]. In 2015, there were an estimated 10.4 million incident TB
cases worldwide [1]. The “End TB Strategy” launched by the World Health Organization (WHO)
in 2016, aims to end the global TB epidemic by 2035 [1]. Targets set in this strategy include 90%
reduction in TB deaths and an 80% reduction in TB incidence by 2030, compared with 2015 [1].
The growing epidemic of diabetes mellitus (DM) is set to become one of the major global health
challenges [2]. The number of individuals with DM is projected to rise from 415 million in 2015
to 642 million by 2040 [3]. It is estimated that over a million TB cases among adults were
affected by DM in 2012 [4]. The rising DM epidemic could contribute to an increase in TB
burden. Although a few studies have failed to confirm a positive association between TB and
DM [5-7], other studies reported a strong association between DM and active TB [8-12]. Based
on earlier published summary effect estimates, DM increases the risk of active TB by 3.11–fold
[13] and latent TB by 1.18–fold [14]. DM also has a major effect on TB treatment outcomes [15,
16]; in particular, it is associated with delayed sputum culture conversion, increased risk of treatment
failure, and increased risk of TB relapse and mortality [17]. With the accumulation of recent
evidence supporting the TB–DM association, there is a need for an updated understanding of the
magnitude of the TB–DM association. This understanding is critical for implementation of
comprehensive TB and DM control programs.
3
47
48
49
50
51
52
53
54
55
56
57
58
59
60
61
62
63
64
65

In this study, we aimed to systematically review the published literature on the association
between active TB and DM, and to statistically summarize the evidence on the strength of the
association.
Materials and Methods
Search strategy and selection criteria
This review follows Cochrane Collaboration guidelines [18] and reports findings using the
Preferred Reporting Items for Systematic reviews and Meta-analyses (PRISMA) guidelines [19].
Please refer to S1 Fig for the PRISMA checklist.
Figure S1: Preferred Reporting Items for Systematic Reviews and Meta-analyses
(PRISMA) checklist.
We searched Medline (from 1945 to December 22, 2015) and EMBASE (from 1980 to
December 22, 2015) databases, for studies on the TB–DM association. For inclusiveness, our
search strategy covered studies that examined any risk factor for TB. The literature search
protocol is summarized in the S1 Box.
Inclusion of studies was restricted to human studies that provided an estimate or allowed us to
compute an estimate of the association, adjusted at least for one variable. No restrictions were
made on study language, population, publication year, or region.
4
66
67
68
69
70
71
72
73
74
75
76
77
78
79
80
81
82

We excluded studies: amongst animals or children, if qualitative in design, case reports, case
series, reviews, anonymous reports, editorials or author commentaries, with no appropriate
control arm or comparator group, where TB patients with DM were not separated from those
with other co-morbidities, of TB outcomes rather than the association, that did not report
adjusted estimates of the TB–DM association, and duplicate reports.
We contacted authors of potentially eligible studies to provide the adjusted estimate for the
association, if the adjusted estimate was not included in the publication. Studies whose authors
did not respond were excluded. The flow diagram of study selection is shown in Fig 1. First
author (RHA) screened all titles and abstracts, reviewed full-text articles, and assessed their
eligibility for inclusion.
Figure 1: Flow diagram of study selection. Published studies were retrieved from the
MEDLINE-PubMed and EMBASE databases. TB: tuberculosis; DM: diabetes mellitus.
Data extraction and quality assessment
Three authors (RHA, JAC, and LJA) designed the literature search terms and strategy. All
potentially relevant full-text articles retrieved and reviewed to confirm eligibility. If eligible, data
were extracted. All authors (RHA, FP, JAC, and LJA) contributed in assessing the eligibility of
the included studies. The first author (RHA) extracted the data, which were re-extracted
independently by at least one co-author (FP, JAC, or LJA). Discrepancies in data extraction were
resolved by consensus or consultation with a third co-author. In addition to extracting baseline
characteristics of included studies, we assessed methodological aspects, such as sampling
strategy, characteristics of the study population, and TB and DM ascertainment. If a study
5
83
84
85
86
87
88
89
90
91
92
93
94
95
96
97
98
99
100
101
102
103

reported more than one adjusted estimate or stratified adjusted estimates, we chose the most
representative and relevant estimate with the most confirmatory DM (i.e. prioritizing HbA1c
over fasting blood glucose (FBG)) and/or TB (i.e. prioritizing bacterial culture over X-ray)
ascertainment strategy, or the estimate adjusted for the largest number of appropriate variables
when the study reported multiple adjustment models. Five of the contacted authors have
provided us with adjusted estimates [7, 20-23]. Two adjusted estimates [24, 25] were extracted
from a previous review [13].
We evaluated each study’s risk of bias (ROB) using nine domains for cohort and cross-sectional
studies, and eleven domains for case-control studies. The ROB domains were adapted from
Cochrane guidelines for systematic reviews [26, 27] and other validated quality assessment tools
[28, 29]. The utilized ROB domains are presented in the S2 Box and were related to different
quality criteria such as rigor of sampling strategy, TB and DM case definition and ascertainment,
and DM timing in relation to TB. In case-control studies, convenience sampling of TB cases was
considered as a probability-based sampling method as long as all cases in the sampling frame
were selected. Based on the composite scores of the ROB domains, each cohort or cross-
sectional study was classified as “potentially of low ROB” (score ≥7) or “potentially of high
ROB” (score <7). Each case-control study was classified as “potentially of low ROB” (score ≥9)
or “potentially of high ROB” (score <9) (S2 Box).
Statistical analysis
For studies reporting stratified crude estimates, we calculated an overall adjusted estimate by
only one stratification if there was an overlap with other strata. In such studies, we prioritized
6
104
105
106
107
108
109
110
111
112
113
114
115
116
117
118
119
120
121
122
123
124

pooling crude estimates that stratified by co-morbidity, location, age, or sex, consecutively.
When there were two or more levels of stratification without overlap, we pooled estimates for
this sub-levels stratification. If a study stratified estimates according to DM type, we pooled the
overall adjusted estimate regardless of the DM type.
In sensitivity analyses, we pooled estimates of studies of “potentially low ROB”, studies unlikely
to contain duplicate individual–level data, and studies in the general population rather than
specific clinical populations. We further pooled estimates stratified by potential for duplicate
data on same patients, country-income level, background TB incidence (≤50 or >50 cases per
100,000 person-year), region, and TB and DM ascertainment methodology. We obtained
relevant data on TB incidence from the included studies or from the closest matching year made
available by public databases.
We pooled adjusted estimates stratified by study design and regardless of study design using
random-effects model [30]. Cochran’s Q statistic was used to test for evidence of heterogeneity
[31, 32]. We estimated the I-squared (I2) as a measure of heterogeneity. We computed Tau-
squared (τ2) to estimate the between-study variance of the true association between TB and DM
[31, 32].
We assessed the presence of publication bias by examining the funnel plots using Egger’s t
statistic to examine asymmetry (S2 Fig) [33]. We used the pooled effect estimate in four
prospective studies to estimate the attributable risk fraction of DM in developing active TB
among people with DM and to estimate the population attributable risk fraction of DM in
developing active TB among the entire population in six high-TB-burden countries (India,
7
125
126
127
128
129
130
131
132
133
134
135
136
137
138
139
140
141
142
143
144
145

Indonesia, China, Nigeria, Pakistan, and South Africa), that accounted for 60% of new TB cases
in 2015 [1]. Calculations are presented in the S1 Text.
Figure S2: Funnel plots assessing the risk of publication bias. (a) in four prospective studies,
(b) 16 retrospective studies that reported RR, RRs, or HR (c) three retrospective studies that
reported an OR, (d) three cross–sectional studies, and (e) 17 case–control studies. Slope line in
the funnel plots represents the fitted-regression line from the standard regression (Egger) test for
small study-effects. Straight line in the funnel plots represents the pooled effect estimate using
the fixed–effect model (not the null hypothesis of 0). RRs: relative risk; RR: rate ratio; OR: odds
ratio; HR: hazard ratio
All Statistical analyses were performed using STATA SE 14 (Stata Corporation, College Station,
TX) [34].
Results
We identified 19,963 publications, 44 of which were found relevant and included in this
systematic review and meta-analysis (Fig 1) [5-12, 20-25, 35-64]. The included studies consisted
of 58,468,404 subjects and 89,592 TB cases and they were set in 16 countries. Most studies were
conducted in Taiwan (11 studies) and USA (11 studies), while only one study was in Africa [59].
Two studies of different designs stratified patients according to DM type (1 or 2) [9, 51], one
study was in patients with type 1 DM [48], while the rest of the studies were either among type 2
DM patients or the type of DM was not specified (presumably, type 2 DM as it is more
prevalent). There were four prospective [8, 23, 35, 36], 19 retrospective [5-7, 20, 22, 24, 37-49],
8
146
147
148
149
150
151
152
153
154
155
156
157
158
159
160
161
162
163
164
165

17 case-control [9-11, 21, 25, 50-61], and three cross-sectional [12, 62, 63] studies. One study
was classified as “other” as the exact study design could not fit into the other categories [64].
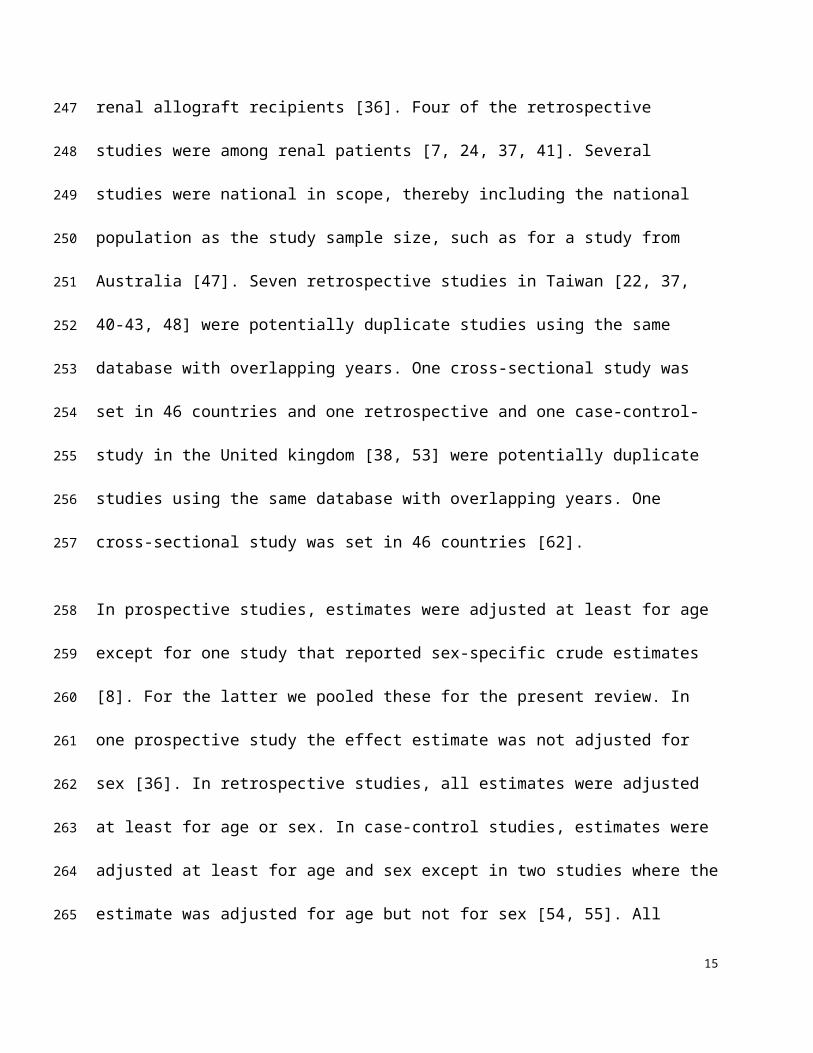
One of the prospective studies was among people aged ≥65 years [35] and one was among renal
allograft recipients [36]. Four of the retrospective studies were among renal patients [7, 24, 37,
41]. Several studies were national in scope, thereby including the national population as the
study sample size, such as for a study from Australia [47]. Seven retrospective studies in Taiwan
[22, 37, 40-43, 48] and one retrospective and one case-control-study in the United kingdom , and
three cross-sectional [12, 62, 63] studies. One study was classified as “other” as the exact study
design could not fit into the other categories [64]. One of the prospective studies was among
people aged ≥65 years [35] and one was among renal allograft recipients [36]. Four of the
retrospective studies were among renal patients [7, 24, 37, 41]. Several studies were national in
scope, thereby including the national population as the study sample size, such as for a study
from Australia [47]. Seven retrospective studies in Taiwan [22, 37, 40-43, 48] were potentially
duplicate studies using the same database with overlapping years. One cross-sectional study was
set in 46 countries and one retrospective and one case-control-study in the United kingdom [38,
53] were potentially duplicate studies using the same database with overlapping years. One
cross-sectional study was set in 46 countries [62].
In prospective studies, estimates were adjusted at least for age except for one study that reported
sex-specific crude estimates [8]. For the latter we pooled these for the present review. In one
prospective study the effect estimate was not adjusted for sex [36]. In retrospective studies, all
estimates were adjusted at least for age or sex. In case-control studies, estimates were adjusted at
least for age and sex except in two studies where the estimate was adjusted for age but not for
9
166
167
168
169
170
171
172
173
174
175
176
177
178
179
180
181
182
183
184
185
186
187

sex [54, 55]. All cross-sectional studies were adjusted at least for age and sex. Baseline
characteristics of all included studies are shown in Tables 1 and 2.
10
188
189

11
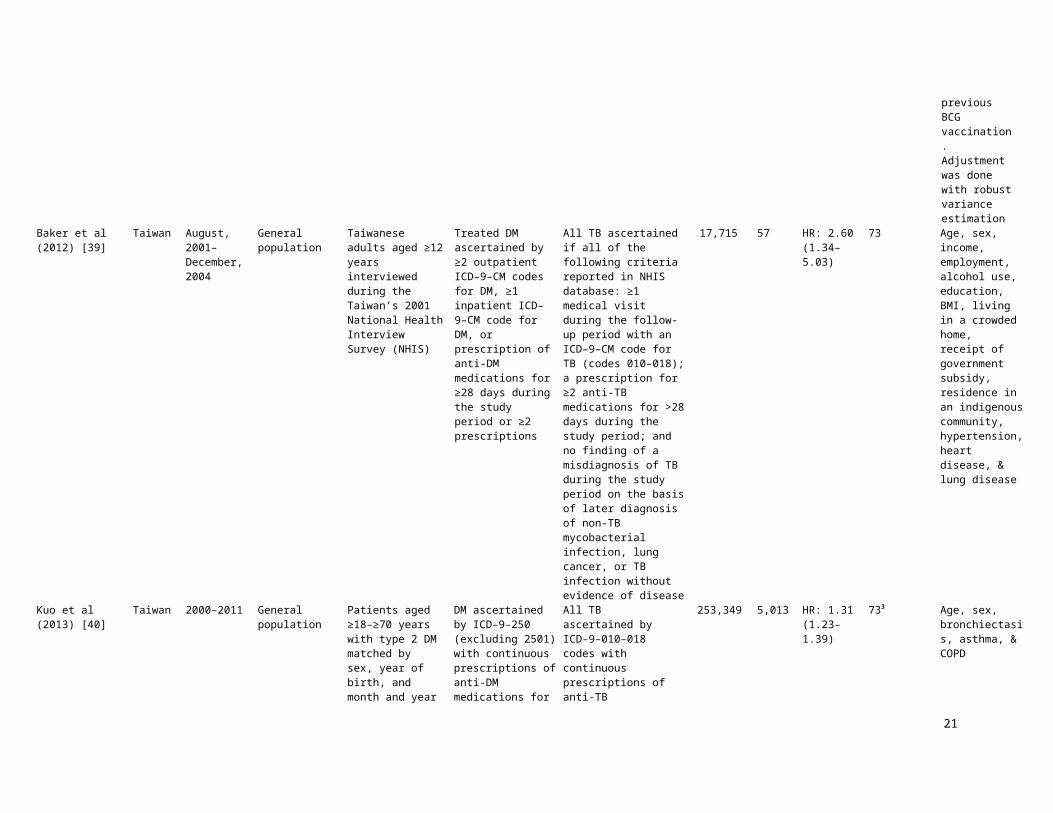
Baseline characteristics of 23 cohort studies, prospective and retrospective, that reported on the association between TB and DM and that were included in the meta-analyses
Country Study period Study location Study population DM ascertainment TB ascertainment Samplesize
TBcases
Adjustedeffect size(95% CI)
TB incidence / 100,000 p–y1
South Korea
1988–1990 Authorized hospitals in South Korea
Civil servants examined by Korean Medical Insurance Corporation who claimed health insurance for TB
DM ascertained by glucose level of ≥119 mg/dl at screening followed by FBG ≥150 mg/dl & PPBG ≥180 mg/dl
Pulmonary TB, bacteriologically ascertained
814,713 5,105 RRs: 4.97(3.68–6.70)
306
Leung et al (2008) China January, 2000–December, 2005
18 elderly health service centers
Elderly people aged≥65 years
DM ascertained by HbA1c ≥7% at enrollment for those with known history of DM based on a physician diagnosis
Culture confirmed pulmonary and extra-pulmonary TB
Active TB
Pulmonary TB
Extrapulmonary TB
42,116 326 HR: 2.69(1.94–3.72)
HR: 2.56 (1.95–3.35)
HR: 2.80 (2.11–3.70)
HR: 0.88 (0.35–2.20)
90
India 1986–1999 Christian Medical College and Hospital at Vellore in southern India
Renal allograft recipients
DM ascertained by FBG >120 mg/dl, or 2-hours PPBG 200>mg/dl, or two elevated levels of either measurement from medical records
All TB ascertained from medical records based on X-ray, AFB, gastric juice, bronchoalveolar specimen, or histopathology
1,251 166 HR: 2.24(1.38–3.65)
1683
USA 1971–1992 General population
Civilian, non-institutionalized adults aged 25–74 years recorded in the First National Health and Nutrition Examination Survey( NHANES I)
DM ascertained by self-report. NHANES I questionnaire asked respondent 'Has a doctor ever told you that you have any of the following conditions, and if so, do you still have it? Diabetes? to assess DM status
All TB. 21 TB cases were ascertained by self-report, the rest based on the ICD-9 - 010-018 and 137, excluding TB exposure without disease (ICD-9-V01.1), primary infection without disease (ICD-9-010.0), TST positivity without diseases (ICD-9-795.5) & subjects who had TB before NHANES I
14,189 61 HR: 7.58(2.94–19.49)
15.43
Chung et al (2014) Taiwan 1997–2010 General population
Newly diagnosed TB patients from the Taiwan’s National Health Insurance Research Database and non-TB subjects from general population
DM ascertained by ICD-9-CM 250 codes from medical records
All TB ascertained by receiving medical care at least three times, including out-patient visits and/or hospitalizations, for a principal diagnosis of TB based on ICD–9–CM 011–018 codes
50,840 10,168 RRs: 1.55(1.47–1.64)
72.5
Taiwan January,1997–December, 2006
General population
Kidney transplant recipients identified from the Taiwan’s National Health Insurance Database
DM ascertained from National Health Insurance Database
Newly diagnosed all TB ascertained by ICD–010–018 codes validated by the use of at least 2 anti-TB medications
4,554 109 OR: 1.42(0.96–2.09)
67.4
China 2006–2008 General population in rural areas
Residents of Danyang county of Jiangsu province and Xiangtan county of Hunan province
DM ascertained by self-reported history of DM by answering the question ‘‘Has a doctor ever told you that you have diabetes?’’
All TB ascertained by sputum smear positive (including scanty positive) or sputum culture-positive for mycobacterium tuberculosis
177,529 117 RRs: 2.43(0.84–7.00)
59.74 in Danyang county
101.1 in Xiangtan county
United Kingdom
1990–2013 Clinical practice research data linked to the hospital episode statistics
DM cohort: patients with first recorded diagnosis for DM (type 1 and 2) aged ≥5 years
DM-free cohort:
DM ascertained by HbA1c >7.5% mmol/mol
All TB ascertained by ICD–10 codesPrescriptions for anti-TB drugs were not used in developing or later validating cases of TB identified by diagnostic
6,941,000 969 RR: 1.30(1.01–1.66)
13.9 in 2012

12
191

13
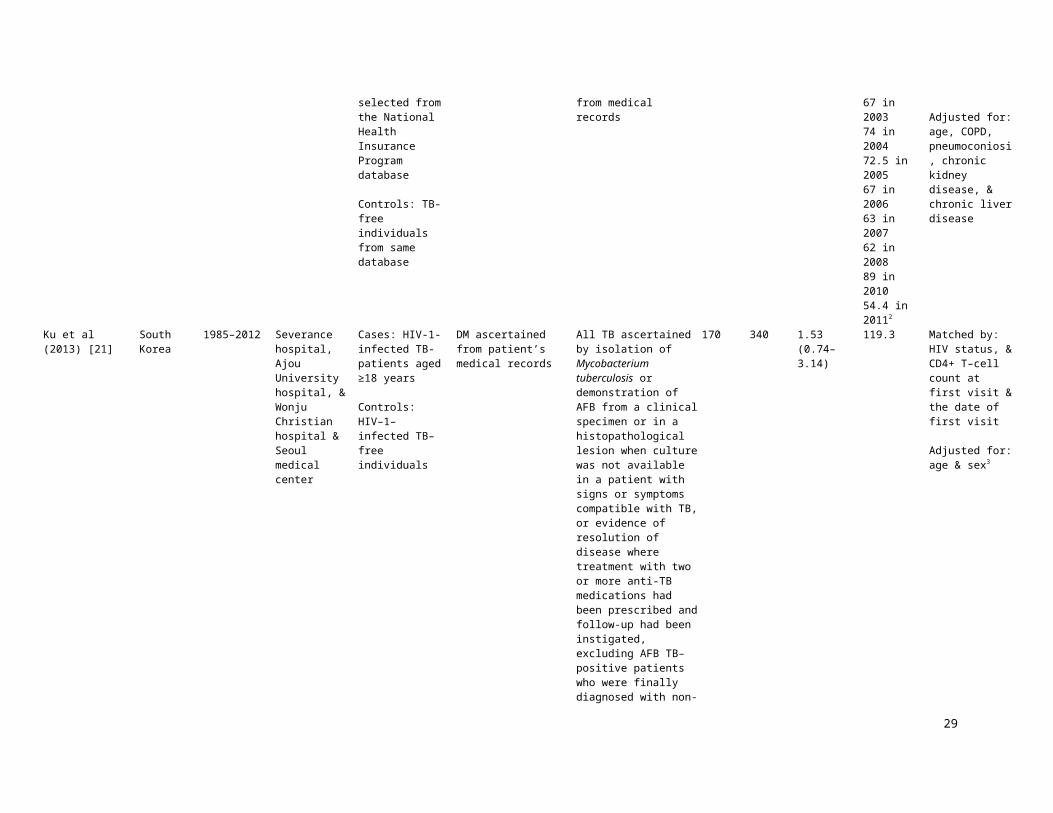
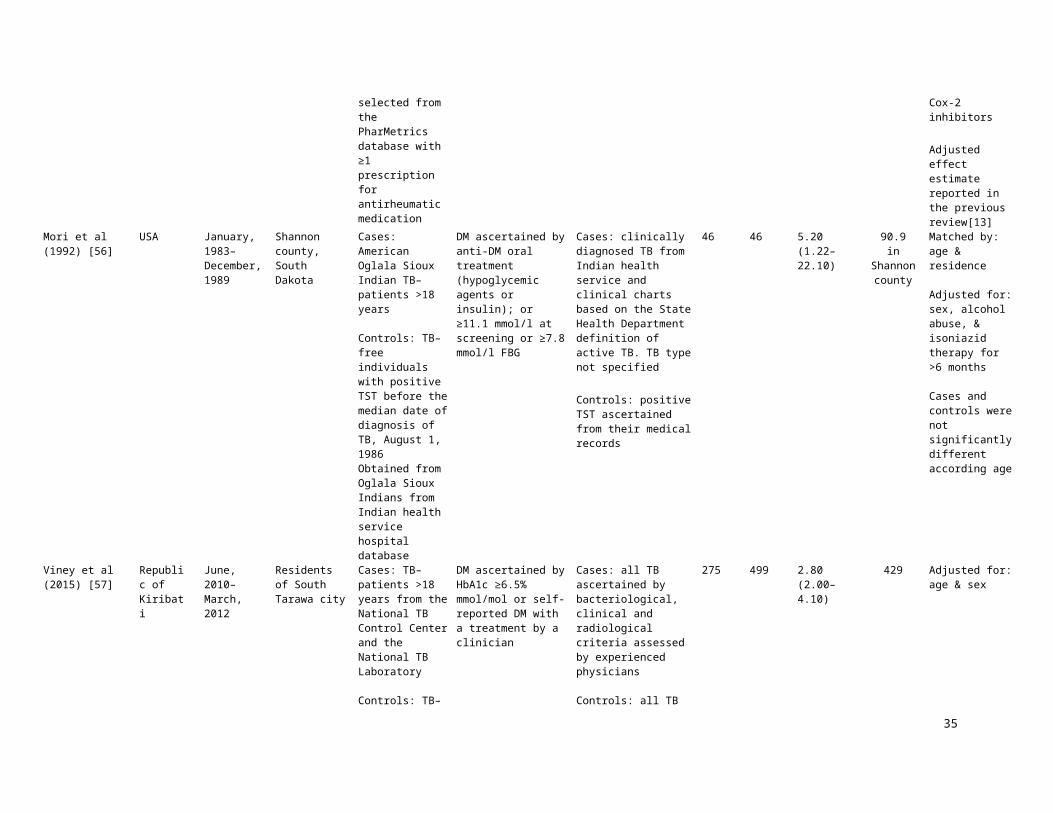
Baseline characteristics of 17 case–control and 3 cross–sectional studies that reported on the association between TB and DM and that were included in the meta-analyses
Country Study period Study location Study population DM ascertainment TB ascertainment TB cases ControlsAdjusted effect sizeOR (95% CI)
TB incidence/ 100,000 p–y1
Matched/Adjusted variables
Alisjahbana et al Indonesia March, 2001– March, 2005
Central Jakarta Cases: TB-patients aged >15 years from outpatients TB-clinics
Controls: TB-free individuals from TB cases communities
DM ascertained by FBG ≥126 mg/dl after stopping taking anti-diabetic agents for 48 hours & FBG were considered impaired for >110 and <126 mg/dl, in accordance with WHO criteria
Pulmonary TB ascertained by clinical presentation & chest X–ray examination confirmed by microscopic detection of AFB
454 556 4.70(2.70–8.10)
128 Matched by: sex, age (±10%), & residential locationAdjusted for: age, sex, BMI, income, number of individuals per household, & presence of TB contact in family or household
Taiwan 1998–2011 General population
Cases: newly diagnosed TB-patients aged ≥20 years selected from the National Health Insurance Program database
Controls: TB-free individuals from same database
DM ascertained by ICD–9 codes from medical records
Pulmonary TB ascertained by ICD–9–010, 011, 012, 018 codes from medical records
11,366 45,464 1.46(1.38–1.54)
64.89 in 199875 in 200267 in 200374 in 200472.5 in 200567 in 200663 in 200762 in 200889 in 201054.4 in 20112
Matched by: age, sex, & index year of TB diagnosis
Adjusted for: age, COPD, pneumoconiosi, chronic kidney disease, & chronic liver disease
South Korea
1985–2012 Severance hospital, Ajou University hospital, & Wonju Christian hospital & Seoul medical center
Cases: HIV-1-infected TB-patients aged ≥18 years
Controls: HIV–1–infected TB–free individuals
DM ascertained from patient’s medical records
All TB ascertained by isolation of Mycobacterium tuberculosis or demonstration of AFB from a clinical specimen or in a histopathological lesion when culture was not available in a patient with signs or symptoms compatible with TB, or evidence of resolution of disease where treatment with two or more anti-TB medications had been prescribed and follow-up had been instigated, excluding AFB TB–positive patients who were finally diagnosed with non-TB mycobacterial infection
170 340 1.53(0.74–3.14)
119.3 Matched by: HIV status, & CD4+ T–cell count at first visit & the date of first visit
Adjusted for: age & sex
Denmark January, 1980–December, 2008
Northern Danish population
Cases: first time hospital contact with principal diagnosis of TB obtained from DNRP who lived in Northern Denmark for ≥6 months since the TB diagnosis date
Controls: TB-free individuals from Danish civilian registration system
DM ascertained by in- or outpatient hospital contact involving diabetes, any use of oral anti-diabetes drugs or insulin, at least one visit to a chiropodist for diabetes foot care, at least five glucose-related services in general practice in 1 year, or at least two glucose-related services each year during 5 subsequent years.
Patients under 30 on therapy = Type 1DM, rest Type 2DM. HbA1c where available for a subset of controls and cases.
Type 1 DM
Type 2 DM
All TB ascertained by ICD–8: 010–019; ICD–10: A15–A19 codes. A subset microbiologically confirmed TB
2,950 14,274 1.18(0.96–1.45)
2.59(0.44–15.29)
1.17(0.95–1.44)
7 Matched by: age (±5 years), sex, country of origin, & place & length of residence in Denmark (±1 year)
Adjusted for: age, sex, country of origin, place & length of residence in Denmark, comorbidities (myocardial infarction, congestive heart failure, peripheral vascular disease, CVD, dementia, COPD, connective tissue disease , ulcer disease, mild liver disease, hemiplegia, moderate to severe renal disease, any tumor, leukemia, lymphoma, metastatic solid tumor, & HIV/AIDS), alcoholism-related disorders, marital status, number of children <15 years, & degree of urbanization
Jurcev-Savicevic Croatia 2006–2008 Seven Croatian Cases: TB-patients DM ascertainment by Pulmonary TB 300 300 2.38 23 Matched by: age (±2

14
193
194
The strongest estimate of the TB–DM association was 7.83 (95% CI 2.37–25.09) in a case-
control study from Russia [58] followed by 7.58 (95% CI 2.94–19.49) in a prospective study
from USA [23]. The lowest effect estimate was 1.00 (95% CI 0.69–1.44) in a retrospective study
from Canada [49] followed by 1.16 (95% CI 0.58–2.32) in a case-control study from USA [61].
All four prospective studies demonstrated a positive association (p<0.05). Fourteen of the 19
retrospective [20, 22, 24, 38-48] and 12 of the 17 case-control studies [10, 11, 25, 50, 52-54, 56-
60] demonstrated a positive association (p<0.05) between DM and TB (Tables 1 and 2).
In the four prospective studies, DM was associated with 3.59–fold (95% CI 2.25–5.73) increased
risk of TB. The I2 was estimated at 77.9% indicating that most variation across studies was due
to heterogeneity in effect size rather than chance. In 16 retrospective studies, DM was associated
with 1.55–fold (95% CI 1.39–1.72) increased risk of TB (I2 = 77.1%). In the 17 case-control
studies, DM was associated with 2.09–fold (95% CI 1.71–2.55) increased risk of TB (I2 =
79.5%). In the three cross-sectional studies, DM was associated with 1.70–fold (95% CI 1.28–
2.24) increased risk of TB (I2 = 28.9%) (Table 3). In all studies regardless of study design, DM
was associated with 2.00-fold (95% CI 1.78–2.24) increased risk of TB (I2 = 90.5%). Forest plots
of meta-analysis according to study design are shown in Fig 2 with summary findings presented
in Table 3.
Figure 2: Forest plot of the meta-analyses. Pooled findings of 44 studies reporting adjusted
estimates of the association between TB and DM, stratified according to study design. Size of the
square is proportional to the precision (weight) of the study-specific effect estimates. Circle is the
study–specific effect point estimate. Arrows indicate that the bars are truncated to fit the plot. The
diamond is centered on the summary effect estimate, and the width indicates the corresponding 95%
CI. RRs: relative risk; RR: rate ratio; OR: odds ratio; HR: hazard ratio.
15
195
196
197
198
199
200
201
202
203
204
205
206
207
208
209
210
211
212
213
214
215
216
217

16
218

Table 3: Summary findings of the meta-analyses for the association between DM and active TB, according to study design
Studies Study population Effect estimate Pooled estimate Heterogeneity measures
Total Total Measure of association Range Summary
estimate 95% CI Q (p-value)1 τ2 2 I2 3
Study designProspective 4 872,269 RRs/HR 2.24–7.58 3.59 2.25–5.73 13.55 (p = 0.004) 0.1619 77.9%
Retrospective 16 56,990,255 RRs/RR/HR 1.00–4.23 1.55 1.39–1.72 65.45 (p < 0.0001) 0.0220 77.1%
Retrospective 3 9,949 OR 1.42–3.59 1.69 1.35–2.12 1.87 (p = 0.392) 0.0000 0.0%
Case-control 17 250,720 OR 1.16–7.83 2.09 1.71–2.55 77.88 (p < 0.0001) 0.1010 79.5%
Cross-sectional 3 327,952 OR 1.40–3.17 1.70 1.28–2.24 2.81 (p = 0.245) 0.0184 28.9%
Other4 1 21,230 RR 6.00 6.00 5.00–7.20 –5 –5 –5
Overall6 44 58,472,375 OR/RRs/RR/HR 1.00–7.83 2.00 1.78–2.24 451.95 (p < 0.0001) 0.0945 90.5%
1 Q: Cochran Q statistic is a measure assessing the existence of heterogeneity in estimates of association between TB and DM.2 τ2: the estimated between–study variance in the true association between TB and DM estimates. The τ2 is for the variance of beta not for the back-transformed estimate.3 I2: a measure assessing the magnitude of between-study variation that is due to differences in the association between TB and DM estimates across studies rather than chance. 4 Study by Ponce-de-Leon A., et al.,[64] neither categorized as prospective, retrospective, cross–sectional, or case–control study. Effect estimate is the individual study effect estimate.5 Meta-analysis was not conducted due to limited number of studies (one study).6 Overall estimate including risk ratios, rate ratios, hazard ratios, and odds ratios, that is regardless of the measure of association and study design. Background incidence rate of TB did not exceed 2 per 100 person-year in studies estimating an OR, therefore it is reasonable to assume that TB is sufficiently rare so that the ORs would estimate the risk ratios. Pooled estimate was implemented using a random-effects model.RRs: relative risk; OR: odds ratio; HR: hazard ratio; RR: rate ratio; CI: confidence interval.
17
219
220

All of the four prospective studies were judged of “potentially low ROB”. Except one study [6],
the 16 retrospective studies reporting relative risk (RRs), hazard ratio (HR), or rate ratio (RR),
were judged of “potentially low ROB”. Of the 17 case-control studies, 13 were judged of
“potentially low ROB” [9-11, 25, 50-54, 56, 57, 59, 61] (S1 Table).
In the sensitivity analyses presented in S1 Table, restricting the meta-analyses to studies judged
of “potentially low ROB”, among only the general population, and with no potential for
duplicate data on the same patients, DM patients were overall, that is by including all studies
regardless of study design, at 2.00–fold (95% CI 1.77–2.27), 2.12–fold (95% CI 1.82–2.48),
1.63–fold (95% CI 1.45–1.82), respectively, increased risk of TB compared to the original
overall estimate including all studies of 2.00–fold (95% CI 1.78–2.24) increased risk of TB
(Table 3).
Moreover, overall, DM patients in low- or middle-income countries (3.16, 95% CI 2.20–4.53), in
settings with TB incidence >50 cases per 100,000 person-year (2.05, 95% CI 1.80–2.33), or in
Asian continent (2.46, 95% CI, 2.04–3.02) were at higher risk of TB than DM patients in high-
income countries, in settings with TB incidence ≤50, or in Europe or USA and Canada,
respectively (S1 Table).
In two prospective studies [8, 35], with microbiologically defined TB, and with blood testing for
DM, patients were at 3.67–fold (95% CI 2.01–6.70) increased risk of TB. Overall, DM patients
with microbiologically defined TB were at 3.03-fold (95% CI 2.31–3.98) increased risk of TB
compared to 1.58–fold (95% CI 1.46–1.71) and 1.73–fold (95% CI 1.36–2.20) based on medical
records or self-reported TB, respectively. Overall, blood tested DM patients were at 3.10–fold
18
218
219
220
221
222
223
224
225
226
227
228
229
230
231
232
233
234
235
236
237
238

(95% CI 2.02–4.74) increased risk of TB compared to 1.60-fold (95% CI 1.18–2.17) and 1.95-
fold (95% CI 0.90–4.25) based on medical records or self-reported DM, respectively (S1 Table).
Overall, DM patients with HbA1c ≥ 6.5%, FBG ≥ 120 mg/dl, or on insulin treatment, were at
1.87–fold (95% CI 1.19–2.93), 3.30-fold (95% CI 2.12–5.14), or 2.51–fold (95% CI 1.62–3.87)
increased risk of TB, respectively (S2 Table).
In the four prospective (p = 0.495), 16 retrospective that reported RR, RRs, or HR (p = 0.439),
three retrospective that reported an OR (p = 0.864), and three cross-sectional (p = 0.696) studies,
reporting on the association between DM and TB, the Egger’s t statistic for asymmetry in the
funnel plot indicated no evidence for the presence of a small-study effect (S2a, S2b, S2c and S2d
Figs, respectively). However, in the 17 case-control studies, the Egger’s t statistic for asymmetry
in the funnel plot indicated evidence for the presence of a small-study effect (p = 0.005) (S2e
Fig).
With a summary RRs of 3.59 among DM patients in the four prospective studies, DM accounts
for 72% of active TB cases among strictly DM patients (attributable risk fraction). In the six
high-TB-burden countries (India, Indonesia, China, Nigeria, Pakistan, and South Africa), that
accounted for 60% of new TB cases in 2015, 18%, 14%, 22%, 11%, 15%, and 15% of active TB
cases in the entire population in these countries is attributed to DM, respectively. For the
population attributable risk fraction, calculations are presented in S1 Text.
Discussion
19
239
240
241
242
243
244
245
246
247
248
249
250
251
252
253
254
255
256
257

In this systematic review and meta-analysis of studies on the TB–DM association, we identified
a strong positive association, but with substantial heterogeneity in effect size between studies.
Stronger associations were noted among DM patients where TB was confirmed
microbiologically, where DM ascertainment was based on blood testing (rather than self-report
or medical records only), and among DM patients with uncontrolled blood glucose. This most
comprehensive review and meta-analysis included 44 observational studies, compared to nine
and 13 [13] studies in the previously published two reviews, one of which included a meta-
analysis of prospective studies [13]. With this increase in published evidence, our meta-analysis
confirmed the result of the earlier meta-analysis [13] and strengthened the evidence base for a
strong association between DM and active TB. Our results demonstrated consistent evidence of a
two- to four-fold increased risk of developing TB disease for DM patients compared to non-DM
patients.
As a result of aging and increasing prevalence of major DM risk factors; particularly obesity and
tobacco use [1, 67-69], it is projected that the number of individuals with DM will rise from 415
million in 2015 to 642 million by 2040 [3]. With the observed TB relative risk of 3.59 among
DM patients in prospective studies, DM will therefore account for an increasing fraction of
active TB cases in the entire population in the future. A frequent misperception is that chronic
diseases such as DM are diseases of affluence [20, 70], in fact they are also common amongst
poorer populations, where infectious diseases such as TB remain prevalent. Estimates suggest
that the DM burden is increasing fastest in those regions where TB remains endemic [46]. From
a public health perspective, it is of note that there are now more TB patients with concomitant
DM than with HIV [71]. Given these findings, it may be challenging to control TB, particularly
in settings that experience the double burden of the twin–epidemic of TB and DM. Robust public
20
258
259
260
261
262
263
264
265
266
267
268
269
270
271
272
273
274
275
276
277
278
279
280
health intervention programs should consider tackling the underlying factors of DM such as lack
of physical activity and obesity. As well as, programs to screen DM patients for TB alongside
controlling blood glucose in TB patients to improve TB/DM treatment outcomes and to control
this “twin epidemic”. Our findings strengthen the evidence base for how DM can impact upon
the achievements of the WHO “End TB Strategy” [1].
The observed slight discrepancy in the summary estimate in the present and the previous meta-
analysis [13] is partially due to the fact that one of the prospective studies [24] included in the
previous meta-analysis was classified as retrospective in our review. Also, we used estimates
from more confirmatory TB (bacterial culture confirmed rather than X-ray ascertained TB) and
DM (HbA1c rather than FBG ascertained DM) ascertainment criteria that adjusted for the largest
number of variables to pool strata-specific estimates, which in turn would produce more reliable
association between TB and DM. In the previous meta-analysis [13], the estimate obtained from
Kim et al., 1995 [8] was age-adjusted for all types of TB using a fixed-effect model, whereas we
adjusted for sex for bacteriologically proven TB only, using a random-effects model. Moreover,
we identified two more prospective studies [23, 35] that contributed 44% of the weight in our
summary estimate. However, excluding one of these two studies , as DM and one-third of TB
cases were ascertained by “self-report”, the summary estimate was 3.18 (95% CI 1.95–5.18),
which is more comparable to that reported in the previous meta-analysis [13]. In the prospective
studies, DM was mostly ascertained prior to the development of TB, suggesting that DM
increases the risk of developing active TB, though some studies screened for DM at the time of
TB diagnosis, and thus infection-related hyperglycemia could also explain some of the
association.
21
281
282
283
284
285
286
287
288
289
290
291
292
293
294
295
296
297
298
299
300
301
302

We conducted sub-group sensitivity analyses to assess the heterogeneity in effect size. Several
factors appeared to have contributed to this heterogeneity, including sampling methodology,
study subjects, year of study, geographical location, exposure and outcome ascertainment
methodology, variability within the specific subpopulation studied, sex and age-group
representation in the sample, and publication bias. However, with the relatively small number of
outcome measures according to study design, it was not possible to quantify the contribution of
these sources of variation to the heterogeneity in the association through a meta-regression
analysis.
All included studies were adjusted for at least age or sex, and estimates from majority of studies
were also adjusted for different demographic and other potential confounders. This ensured that
overall summary estimates were adjusted for at least the major confounding effects of age or sex.
The strongest TB–DM association was observed from the four prospective studies [8, 23, 35,
36]. Data from almost three-quarters of included studies were representative of the general
population. In studies reporting more than one adjusted estimate or strata-specific estimates, we
included the estimates with more confirmatory ascertainment criteria for TB and/or DM, and that
adjusted for the largest number of variables. This in turn produced summary estimates with
lower potential of including false positive or false negative DM or TB cases. Overall, limiting
the meta-analysis to studies judged as “potentially of low ROB” and excluding potentially
duplicate studies did not change the direction nor magnitude of the association.
In the present review, the overall summary estimate in settings with TB incidence >50 cases per
100,000 person-year showed stronger association compared to that in settings with TB incidence
≤50 (Table S1). This is in line with the findings of the previous meta-analysis [13]. Dobler et al.,
22
303
304
305
306
307
308
309
310
311
312
313
314
315
316
317
318
319
320
321
322
323
324

2012 [47], hypothesized that the reason for the stronger association in settings with higher TB
incidence could relate to the quality of diabetes management, assuming healthcare services may
be poorer or harder to access in higher TB incidence settings.
We noticed a stronger association in blood-tested DM patients. DM patients with well-controlled
glucose levels are less likely to be included when the definition of DM is based on blood glucose
levels, which implies that hyperglycaemia rather than a DM diagnosis per se, increases the risk
of TB [47]. DM patients suffer from immune system impairments, resulting in a lack of energy
supply to immune cells, that subsequently increases virulence of infectious microorganisms [72-
75]. These impairments weaken the immune system response to Mycobacterium tuberculosis
[76-78]. This is supported by the observed stronger association in patients with uncontrolled
blood glucose level (FBG ≥120 mg/dl or HbA1c ≥6.5%) (S2 Table).
There are several biological mechanisms that appear to alter the immune system and by which
DM patients may develop TB [72-84]. High levels of insulin were associated with a decrease in
T helper 1 (Th1) immunity through a reduction in the Th1 cell to T helper 2 (Th2) cell ratio and
interferon-c (IFN-c) to interleukin-4 (IL-4) ratio [80]. Other studies showed that nonspecific
IFN-c levels were significantly reduced in people with diabetes compared to people with no
diabetes [81], and that levels of IFN-c were negatively correlated with levels of HbA1c [82].
Neutrophils in people with diabetes were found with a lack in chemotaxis and oxidative killing
potential compared to non-diabetic controls [83]. Leukocyte bactericidal activity was found to be
reduced in people with diabetes, especially those with poor glucose control [84]. These observed
immunologic alterations seen in people with diabetes have also been supported in experimental
animal studies. Diabetic mice experimentally infected with Mycobacterium tuberculosis have
23
325
326
327
328
329
330
331
332
333
334
335
336
337
338
339
340
341
342
343
344
345
346

higher bacterial loads compared to euglycemic mice [85, 86] with significantly lower production
of IFN-c and interleukin-12 and fewer T cells [86].
Several of the included studies had methodological weaknesses. Eight studies [5, 12, 23, 52, 54,
55, 61, 62] relied on “self-reported” DM and four studies [12, 23, 54, 62] relied on “self-
reported” TB. Studies that utilized blood tests to define DM may also have reported stronger
associations between DM and TB, since they can identify undiagnosed DM [13], which is
common in many low– and middle–income countries. In studies that relied on “self-reported”
DM, subjects with controlled blood glucose (euglycemic) would be “misclassified” as DM
patients. This assumption is supported in our sensitivity analyses (S1 Table). There is an
additional potential misclassification of TB and DM cases as studies often used routinely
collected data without validation using laboratory tests [38]. For instance, a single HbA1c
measurement might misclassify individuals as either DM or non-DM patients. It is recommended
that DM diagnosis should be confirmed with a repeat HbA1c test, unless clinical symptoms and
plasma glucose levels >11.1mmol/l (200 mg/dl) are present [87]. Missing adjustment for
potential confounders is also a noteworthy limitation. In six studies [16, 45-48, 76], estimates
were adjusted only for age and/or sex. Individual studies that controlled for the influence of age,
sex, and smoking [35, 53, 58] produced stronger estimates than those controlled for age and sex
[20, 43, 47]. Biased estimates on the TB–DM association may have occurred in studies among
patients receiving dialysis [24, 41] or among subjects from specialty clinics or hospitals rather
than the general population [88]. In almost all case-control studies, sampling of cases and/or
controls was based on non-probability sampling. Studies using hospital-based controls reported
weaker estimates for the association [13].
24
347
348
349
350
351
352
353
354
355
356
357
358
359
360
361
362
363
364
365
366
367
368

DM can affect different aspects of TB natural history and treatment outcomes, and therefore can
impact TB transmission dynamics. An ongoing study has identified seven epidemiologically-
relevant plausible effects for DM on TB natural history, and three for DM on TB treatment
outcomes [89]. Our study, however, was focused on one major aspect of the TB–DM synergy,
that of the association between DM status and active TB disease diagnosis—we did not assess
other aspects of this synergy such as effects of DM on TB infection acquisition, TB reactivation
among those latently infected, TB infectiousness, or TB treatment outcomes. A recent review,
for example, reported that DM increases risk of latent TB by 1.18–fold [14], though with
substantial heterogeneity across studies, and other studies have demonstrated major effects for
DM on TB treatment outcomes [15-17]. Comprehensive and granular characterization and
quantification of the diverse effects of DM on TB is essential for a proper understanding and
estimation of the impact of DM on TB epidemiology.
In most of included studies, type of DM was unclear, thereby limiting our ability to assess the
association by DM type (1, 2, or both). Having said so, in the three studies that assessed the
association of TB with type 1 DM [9, 48, 51], the effect size was comparable to that seen for
type 2 DM studies. HIV/AIDS is a strong risk factor for TB [90], but only a fraction of included
studies controlled for its effect in their assessment of the association. This may not affect
appreciably our results, as HIV prevalence is very low in nearly all countries where the
association was assessed. Age is another confounding factor for the TB–DM association, and
nearly all studies controlled for this factor. Our study was focused on the overall effect of DM on
TB disease, and we did not provide a pooled effect size stratified by age. Despite these
limitations, our review and meta-analyses compiled and summarized important data and
25
369
370
371
372
373
374
375
376
377
378
379
380
381
382
383
384
385
386
387
388
389
390

critically provided narrative information from a large number of studies that reported on the TB–
DM association.
Conclusions
Our systematic review and meta-analysis demonstrated consistent evidence of a substantially
increased risk of TB disease among people with DM. This evidence was based on data from
studies using different designs and reported from six continents. DM patients with uncontrolled
blood glucose (measured by higher FBG or HbA1c) appeared to be at higher risk of active TB
than patients with controlled DM. Efforts to halt the burgeoning DM epidemic would have an
accompanied benefit of alleviating the global burdens of DM and TB. The burgeoning epidemic
of DM is likely to impact upon the achievements of the WHO “End TB Strategy”. Our findings
inform strategy planning of health service provision and implementation of effective prevention
programs to control the “twin epidemic” of DM and TB.
26
391
392
393
394
395
396
397
398
399
400
401
402

Acknowledgments
The authors are very grateful for infrastructure support provided by the Biostatistics,
Epidemiology, and Biomathematics Research Core at Weill Cornell Medicine-Qatar. This
publication was made possible by NPRP grant number 7-627-3-167 from the Qatar National
Research Fund (a member of Qatar Foundation). The findings achieved herein are solely the
responsibility of the authors. The authors are also grateful for infrastructure support provided by
the Biostatistics, Epidemiology, and Biomathematics Research Core at Weill Cornell Medicine-
Qatar. JAC is also supported by the Higher Education Funding Council for England.
Author Contributions
Conceptualization: LJA and JAC.
Data curation: RHA and LJA.
Formal analysis: RHA and LJA.
Funding acquisition: LJA and JAC.
Investigation: RHA, LJA, JAC, and FP.
Methodology: RHA, LJA, JAC, and FP.
Project administration: RHA and LJA.
Resources: RHA and LJA.
Software: RHA and LJA.
Supervision: LJA and JAC.
Validation: RHA, LJA, JAC, and FP.
27
403
404
405
406
407
408
409
410
411
412
413
414
415
416
417
418
419
420
421
422

Visualization: RHA and LJA.
Writing – original draft: RHA.
Writing – review & editing: RHA, LJA, JAC, and FP.
28
423
424
425
References
1. World Health Organization. Global tuberculosis report 2016. http://wwwwhoint/tb/publications/global_report/gtbr2016_main_textpdf?ua=1 (accessed September 15, 2016).
2. Kassebaum NJ, Arora M, Barber RM, Bhutta ZA, Carter A, Casey DC, et al. Global, regional, and national disability-adjusted life-years (DALYs) for 315 diseases and injuries and healthy life expectancy (HALE), 1990-2015: a systematic analysis for the Global Burden of Disease Study 2015. Lancet. 2016;388(10053):1603-58. PubMed PMID: WOS:000385285000009.
3. International Diabetese Fedration. International Diabetese Fedration Atals 2015. http://www.diabetesatlas.org/(accessed September 15, 2016).
4. Lonnroth K, Roglic G, Harries AD. Improving tuberculosis prevention and care through addressing the global diabetes epidemic: from evidence to policy and practice (vol 2, pg 730, 2014). Lancet Diabetes & Endocrinology. 2014;2(10):E16-E. PubMed PMID: WOS:000347778700001.
5. Chen W, Shu W, Wang M, Hou YC, Xia YY, Xu WG, et al. Pulmonary Tuberculosis Incidence and Risk Factors in Rural Areas of China: A Cohort Study. Plos One. 2013;8(3). doi: ARTN e5817110.1371/journal.pone.0058171. PubMed PMID: WOS:000316252500014.
6. Moran-Mendoza O, Marion SA, Elwood K, Patrick D, FitzGerald JM. Risk factors for developing tuberculosis: a 12-year follow-up of contacts of tuberculosis cases. International Journal of Tuberculosis and Lung Disease. 2010;14(9):1112-9. PubMed PMID: WOS:000281275900008.
7. Rungruanghiranya S, Ekpanyaskul C, Jirasiritum S, Nilthong C, Pipatpanawong K, Mavichak V. Tuberculosis in Thai renal transplant recipients: A 15-year experience. Transplantation Proceedings. 2008;40(7):2376-9. doi: 10.1016/j.transproceed.2008.07.034. PubMed PMID: WOS:000259333400080.
8. Kim SJ, Hong YP, Lew WJ, Yang SC, Lee EG. Incidence of pulmonary tuberculosis among diabetics. Tubercle and Lung Disease. 1995;76(6):529-33. doi: Doi 10.1016/0962-8479(95)90529-4. PubMed PMID: WOS:A1995TK62300010.
9. PablosMendez A, Blustein J, Knirsch CA. The role of diabetes mellitus in the higher prevalence of tuberculosis among Hispanics. American Journal of Public Health. 1997;87(4):574-9. doi: Doi 10.2105/Ajph.87.4.574. PubMed PMID: WOS:A1997WY03900011.
10. Alisjahbana B, van Crevel R, Sahiratmadja E, den Heijer M, Maya A, Istriana E, et al. Diabetes mellitus is strongly associated with tuberculosis in Indonesia. International Journal of Tuberculosis and Lung Disease. 2006;10(6):696-700. PubMed PMID: WOS:000237771100017.
11. Perez A, Brown HS, Restrepo BI. Association between tuberculosis and diabetes in the Mexican border and non-border regions of Texas. American Journal of Tropical Medicine and Hygiene. 2006;74(4):604-11. PubMed PMID: WOS:000236750200021.
12. Marks SM. Diabetes and tuberculosis, US National Health Interview Survey, 2000-2005. International Journal of Tuberculosis and Lung Disease. 2011;15(7):982-4. doi: 10.5588/ijtld.10.0637. PubMed PMID: WOS:000292234000022.
29
426
427428429430431432433434435436437438439440441442443444445446447448449450451452453454455456457458459460461462463464465466467468469

13. Jeon CY, Murray MB. Diabetes mellitus increases the risk of active tuberculosis: A systematic review of 13 observational studies (vol 5, pg e152, 2008). Plos Medicine. 2008;5(8):1298-. PubMed PMID: WOS:000258739200019.
14. Lee MR, Huang YP, Kuo YT, Luo CH, Shih YJ, Shu CC, et al. Diabetes mellitus and latent tuberculosis infection: a systemic review and meta-analysis. Clin Infect Dis. 2016. doi: 10.1093/cid/ciw836. PubMed PMID: 27986673.
15. Baker MA, Harries AD, Jeon CY, Hart JE, Kapur A, Lonnroth K, et al. The impact of diabetes on tuberculosis treatment outcomes: A systematic review. Bmc Medicine. 2011;9. doi: Artn 81
10.1186/1741-7015-9-81. PubMed PMID: WOS:000293892000001.16. Faurholt-Jepsen D, Range N, Praygod G, Kidola J, Faurholt-Jepsen M, Aabye MG, et al.
The role of diabetes co-morbidity for tuberculosis treatment outcomes: a prospective cohort study from Mwanza, Tanzania. Bmc Infect Dis. 2012;12. doi: Artn 165
10.1186/1471-2334-12-165. PubMed PMID: WOS:000309419600001.17. Faurholt-Jepsen D, Range N, PrayGod G, Jeremiah K, Faurholt-Jepsen M, Aabye MG, et al.
Diabetes is a strong predictor of mortality during tuberculosis treatment: a prospective cohort study among tuberculosis patients from Mwanza, Tanzania. Trop Med Int Health. 2013;18(7):822-9. doi: 10.1111/tmi.12120. PubMed PMID: WOS:000320335400005.
18. Higgins JP, Green S. Cochrane handbook for systematic reviews of interventions: Wiley Online Library; 2008.
19. Moher D, Liberati A, Tetzlaff J, Altman DG. Preferred reporting items for systematic reviews and meta-analyses: the PRISMA statement. Annals of internal medicine. 2009;151(4):264-9.
20. Kamper-Jorgensen Z, Carstensen B, Norredam M, Bygbjerg IC, Andersen PH, Jorgensen ME. Diabetes-related tuberculosis in Denmark: effect of ethnicity, diabetes duration and year of diagnosis. International Journal of Tuberculosis and Lung Disease. 2015;19(10):1169-75. doi: 10.5588/ijtld.14.0932. PubMed PMID: WOS:000362154700008.
21. Ku NS, Choi YH, Kim YK, Choi JP, Kim JM, Choi JY. Incidence of and risk factors for active tuberculosis in human immunodeficiency virus-infected patients in South Korea. International Journal of Tuberculosis and Lung Disease. 2013;17(6):777-81. doi: 10.5588/ijtld.12.0607. PubMed PMID: WOS:000319845700013.
22. Chung WS, Lin CL, Hung CT, Chu YH, Sung FC, Kao CH, et al. Tuberculosis increases the subsequent risk of acute coronary syndrome: a nationwide population-based cohort study. International Journal of Tuberculosis and Lung Disease. 2014;18(1):79-83. doi: 10.5588/ijtld.13.0288. PubMed PMID: WOS:000329483000016.
23. Cegielski JP, Arab L, Cornoni-Huntley J. Nutritional Risk Factors for Tuberculosis Among Adults in the United States, 19711992. American Journal of Epidemiology. 2012;176(5):409-22. doi: 10.1093/aje/kws007. PubMed PMID: WOS:000308226600007.
24. Chen CH, Lian JD, Cheng CH, Wu MJ, Lee WC, Shu KH. Mycobacterium tuberculosis infection following renal transplantation in Taiwan. Transplant Infectious Disease. 2006;8(3):148-56. doi: DOI 10.1111/j.1399-3062.2006.00147.x. PubMed PMID: WOS:000239964200004.
25. Brassard P, Kezouh A, Suissa S. Antirheumatic drugs and the risk of tuberculosis. Clinical Infectious Diseases. 2006;43(6):717-22. doi: Doi 10.1086/506935. PubMed PMID: WOS:000240050000009.
30
470471472473474475476477478479480481482483484485486487488489490491492493494495496497498499500501502503504505506507508509510511512513514

26. Higgins JPT, Green, S., Cochrane Collaboration. Cochrane Handbook For Systematic Reviews Of Interventions. England, Hoboken, NJ.: Wiley-Blackwell Chichester
2008.27. Higgins JP, Altman, D.G., Gotzsche, P.C., Juni, P., Moher, D., Oxman, A.D., Savovic, J.,
Schulz, K.F., Weeks, L., Sterne, J.A.C., Cochrane Statistical Methods Group. The Cochrane Collaboration’s tool for assessing risk of bias in randomised trials. BMJ. 2011;343:d5928.
28. Hoy D, Brooks P, Woolf A, Blyth F, March L, Bain C, et al. Assessing risk of bias in prevalence studies: modification of an existing tool and evidence of interrater agreement. J Clin Epidemiol. 2012;65(9):934-9. doi: 10.1016/j.jclinepi.2011.11.014. PubMed PMID: 22742910.
29. Viswanathan M, Berkman ND, Dryden DM, Hartling L. Assessing Risk of Bias and Confounding in Observational Studies of Interventions or Exposures: Further Development of the RTI Item Bank. AHRQ Methods for Effective Health Care. Rockville (MD)2013.
30. Harris RJ, Bradburn MJ, Deeks JJ, Harbord RM, Altman DG, Sterne JAC. metan: fixed- and random-effects meta-analysis. Stata Journal. 2008;8(1):3-28. PubMed PMID: WOS:000254886200001.
31. Borenstein M. Introduction to meta-analysis. Chichester, UK: John Wiley & Sons. 2009;xxviii, :421 p. p.
32. Higgins JPT, Thompson SG, Deeks JJ, Altman DG. Measuring inconsistency in meta-analyses. British Medical Journal. 2003;327(7414):557-60. doi: DOI 10.1136/bmj.327.7414.557. PubMed PMID: WOS:000185283700028.
33. Egger M, Smith GD. Meta-Analysis. Potentials and promise. BMJ. 1997;315(7119):1371-4. PubMed PMID: 9432250; PubMed Central PMCID: PMCPMC2127866.
34. StataCorp. 2015. Stata Statistical Software: Release 14. College Station, TX: StataCorp LP.35. Leung CC, Lam TH, Chan WM, Yew WW, Ho KS, Leung GM, et al. Diabetic control and
risk of tuberculosis: A cohort study. American Journal of Epidemiology. 2008;167(12):1486-94. doi: 10.1093/aje/kwn075. PubMed PMID: WOS:000256755900012.
36. John GT, Shankar V, Abraham AM, Mukundan U, Thomas PP, Jacob CK. Risk factors for post-transplant tuberculosis. Kidney International. 2001;60(3):1148-53. doi: DOI 10.1046/j.1523-1755.2001.0600031148.x. PubMed PMID: WOS:000170668100034.
37. Ou SM, Liu CJ, Teng CJ, Lin YT, Chang YS, Chiang SC, et al. Impact of pulmonary and extrapulmonary tuberculosis infection in kidney transplantation: a nationwide population-based study in Taiwan. Transplant Infectious Disease. 2012;14(5):502-9. doi: 10.1111/j.1399-3062.2012.00737.x. PubMed PMID: WOS:000309239500024.
38. Pealing L, Wing K, Mathur R, Prieto-Merino D, Smeeth L, Moore DAJ. Risk of tuberculosis in patients with diabetes: population based cohort study using the UK Clinical Practice Research Datalink. Bmc Medicine. 2015;13. doi: ARTN 135
10.1186/s12916-015-0381-9. PubMed PMID: WOS:000356483400001.39. Baker MA, Lin HH, Chang HY, Murray MB. The Risk of Tuberculosis Disease Among
Persons With Diabetes Mellitus: A Prospective Cohort Study. Clinical Infectious Diseases. 2012;54(6):818-25. doi: 10.1093/cid/cir939. PubMed PMID: WOS:000300790900015.
40. Kuo MC, Lin SH, Lin CH, Mao IC, Chang SJ, Hsieh MC. Type 2 Diabetes : An Independent Risk Factor for Tuberculosis: A Nationwide Population-Based Study. Plos One. 2013;8(11). doi: ARTN e78924
10.1371/journal.pone.0078924. PubMed PMID: WOS:000327254700066.
31
515516517518519520521522523524525526527528529530531532533534535536537538539540541542543544545546547548549550551552553554555556557558559

41. Hu HY, Wu CY, Huang N, Chou YJ, Chang YC, Chu D. Increased risk of tuberculosis in patients with end-stage renal disease: a population-based cohort study in Taiwan, a country of high incidence of end-stage renal disease. Epidemiology and Infection. 2014;142(1):191-9. doi: 10.1017/S0950268813000551. PubMed PMID: WOS:000332523900023.
42. Lee CH, Lee MC, Shu CC, Lim CS, Wang JY, Lee LN, et al. Risk factors for pulmonary tuberculosis in patients with chronic obstructive airway disease in Taiwan: a nationwide cohort study. Bmc Infect Dis. 2013;13. doi: Artn 194
10.1186/1471-2334-13-194. PubMed PMID: WOS:000318934000001.43. Wu CY, Hu HY, Pu CY, Huang N, Shen HC, Li CP, et al. Aerodigestive tract, lung and
haematological cancers are risk factors for tuberculosis: an 8-year population-based study. International Journal of Tuberculosis and Lung Disease. 2011;15(1):125-30. PubMed PMID: WOS:000286488700022.
44. Demlow SE, Oh P, Barry PM. Increased risk of tuberculosis among foreign-born persons with diabetes in California, 2010-2012. Bmc Public Health. 2015;15. doi: ARTN 263
10.1186/s12889-015-1600-1. PubMed PMID: WOS:000351993100001.45. Suwanpimolkul G, Grinsdale JA, Jarlsberg LG, Higashi J, Osmond DH, Hopewell PC, et al.
Association between Diabetes Mellitus and Tuberculosis in United States-Born and Foreign-Born Populations in San Francisco. Plos One. 2014;9(12). doi: ARTN e114442
10.1371/journal.pone.0114442. PubMed PMID: WOS:000346907200088.46. Young F, Wotton CJ, Critchley JA, Unwin NC, Goldacre MJ. Increased risk of tuberculosis
disease in people with diabetes mellitus: record-linkage study in a UK population. Journal of Epidemiology and Community Health. 2012;66(6):519-23. doi: 10.1136/jech.2010.114595. PubMed PMID: WOS:000303608800020.
47. Dobler CC, Flack JR, Marks GB. Risk of tuberculosis among people with diabetes mellitus: an Australian nationwide cohort study. Bmj Open. 2012;2(1). doi: ARTN e000666
10.1136/bmjopen-2011-000666. PubMed PMID: WOS:000315037200075.48. Shen TC, Lin CL, Wei CC, Liao WC, Chen WC, Chen CH, et al. Increased Risk of
Tuberculosis in Patients With Type 1 Diabetes Mellitus: Results From a Population-Based Cohort Study in Taiwan. Medicine. 2014;93(16). doi: ARTN e96
10.1097/MD.0000000000000096. PubMed PMID: WOS:000344144900004.49. Dyck RF, Klomp H, Marciniuk DD, Tan L, Stang MR, Ward HA, et al. The relationship
between diabetes and tuberculosis in Saskatchewan - Comparison of registered Indians and other Saskatchewan people. Canadian Journal of Public Health-Revue Canadienne De Sante Publique. 2007;98(1):55-9. PubMed PMID: WOS:000243628300011.
50. Lai SW, Lin CL, Liao KF, Tsai SM. Increased risk of pulmonary tuberculosis among patients with appendectomy in Taiwan. European Journal of Clinical Microbiology & Infectious Diseases. 2014;33(9):1573-7. doi: 10.1007/s10096-014-2112-0. PubMed PMID: WOS:000340538700014.
51. Leegaard A, Riis A, Kornum JB, Prahl JB, Thomsen VO, Sorensen HT, et al. Diabetes, Glycemic Control, and Risk of Tuberculosis A population-based case-control study. Diabetes Care. 2011;34(12):2530-5. doi: 10.2337/dc11-0902. PubMed PMID: WOS:000298122900009.
52. Jurcev-Savicevic A, Mulic R, Ban B, Kozul K, Bacun-Ivcek L, Valic J, et al. Risk factors for pulmonary tuberculosis in Croatia: a matched case-control study. Bmc Public Health. 2013;13. doi: Artn 991
10.1186/1471-2458-13-991. PubMed PMID: WOS:000329289000008.
32
560561562563564565566567568569570571572573574575576577578579580581582583584585586587588589590591592593594595596597598599600601602603604605

53. Jick SS, Lieberman ES, Rahman MU, Choi HK. Glucocorticoid use, other associated factors, and the risk of tuberculosis. Arthritis & Rheumatism-Arthritis Care & Research. 2006;55(1):19-26. doi: 10.1002/art.21705. PubMed PMID: WOS:000236800400007.
54. Valerie Corris NUaJC. Quantifying the association between tuberculosis and diabetes in the US: a case-control analysis. Chronic Illness. 2012;8(2):121-34.
55. Buskin SE, Gale JL, Weiss NS, Nolan CM. Tuberculosis Risk-Factors in Adults in King County, Washington, 1988 through 1990. American Journal of Public Health. 1994;84(11):1750-6. doi: Doi 10.2105/Ajph.84.11.1750. PubMed PMID: WOS:A1994PR44800009.
56. Mori MA, Leonardson G, Welty TK. The Benefits of Isoniazid Chemoprophylaxis and Risk-Factors for Tuberculosis among Oglala Sioux Indians. Archives of Internal Medicine. 1992;152(3):547-50. doi: DOI 10.1001/archinte.152.3.547. PubMed PMID: WOS:A1992HH85800013.
57. Viney K, Cavanaugh J, Kienene T, Harley D, Kelly PM, Sleigh A, et al. Tuberculosis and diabetes mellitus in the Republic of Kiribati: a case-control study. Trop Med Int Health. 2015;20(5):650-7. doi: 10.1111/tmi.12462. PubMed PMID: WOS:000352534600010.
58. Coker R, McKee M, Atun R, Dimitrova B, Dodonova E, Kuznetsov S, et al. Risk factors for pulmonary tuberculosis in Russia: case-control study. British Medical Journal. 2006;332(7533):85-7. doi: 10.1136/bmj.38684.687940.80. PubMed PMID: WOS:000234777000019.
59. Faurholt-Jepsen D, Range N, PrayGod G, Jeremiah K, Faurholt-Jepsen M, Aabye MG, et al. Diabetes Is a Risk Factor for Pulmonary Tuberculosis: A Case-Control Study from Mwanza, Tanzania. Plos One. 2011;6(8). doi: ARTN e24215
10.1371/journal.pone.0024215. PubMed PMID: WOS:000294678300032.60. Wu HP PY, Hua CC, Shieh WB, Jiang BY, Yu TJ. Pneumoconiosis and liver cirrhosis are
not risk factors for tuberculosis in patients with pulmonary infection. Respirology. 2007;12(3):416-9.
61. Rosenman KD, Hall N. Occupational risk factors for developing tuberculosis. American Journal of Industrial Medicine. 1996;30(2):148-54. doi: Doi 10.1002/(Sici)1097-0274(199608)30:2<148::Aid-Ajim5>3.0.Co;2-X. PubMed PMID: WOS:A1996VA19800005.
62. Goldhaber-Fiebert JD, Jeon CY, Cohen T, Murray MB. Diabetes mellitus and tuberculosis in countries with high tuberculosis burdens: individual risks and social determinants. International Journal of Epidemiology. 2011;40(2):417-28. doi: 10.1093/ije/dyq238. PubMed PMID: WOS:000289165800020.
63. Wang QZ, Ma AG, Han XX, Zhao SL, Cai J, Ma YB, et al. Prevalence of Type 2 Diabetes among Newly Detected Pulmonary Tuberculosis Patients in China: A Community Based Cohort Study. Plos One. 2013;8(12). doi: ARTN e82660
10.1371/journal.pone.0082660. PubMed PMID: WOS:000328740300051.64. Ponce-De-Leon A, Garcia-Garcia MD, Garcia-Sancho C, Gomez-Perez FJ, Valdespino-
Gomez JL, Olaiz-Fernandez G, et al. Tuberculosis and diabetes in southern Mexico. Diabetes Care. 2004;27(7):1584-90. doi: DOI 10.2337/diacare.27.7.1584. PubMed PMID: WOS:000222397100010.
65. Lo HY, Chou P, Yang SL, Lee CY, Kuo HS. Trends in Tuberculosis in Taiwan, 2002-2008. Journal of the Formosan Medical Association. 2011;110(8):501-10. PubMed PMID: WOS:000293490600004.
33
606607608609610611612613614615616617618619620621622623624625626627628629630631632633634635636637638639640641642643644645646647648649650651

66. Service. UPH. Case definitions for public health surveillance. MMWR. 1990;39:39-40.67. Gaziano TA, Bitton A, Anand S, Abrahams-Gessel S, Murphy A. Growing epidemic of
coronary heart disease in low- and middle-income countries. Curr Probl Cardiol. 2010;35(2):72-115. doi: 10.1016/j.cpcardiol.2009.10.002. PubMed PMID: 20109979; PubMed Central PMCID: PMCPMC2864143.
68. Hu FB. Globalization of diabetes: the role of diet, lifestyle, and genes. Diabetes Care. 2011;34(6):1249-57. doi: 10.2337/dc11-0442. PubMed PMID: 21617109; PubMed Central PMCID: PMCPMC3114340.
69. Malik VS, Willett WC, Hu FB. Global obesity: trends, risk factors and policy implications. Nat Rev Endocrinol. 2013;9(1):13-27. doi: 10.1038/nrendo.2012.199. PubMed PMID: 23165161.
70. Ezzati M, Vander Hoorn S, Lawes CM, Leach R, James WP, Lopez AD, et al. Rethinking the "diseases of affluence" paradigm: global patterns of nutritional risks in relation to economic development. PLoS Med. 2005;2(5):e133. doi: 10.1371/journal.pmed.0020133. PubMed PMID: 15916467; PubMed Central PMCID: PMCPMC1088287.
71. Ruslami R, Aarnoutse RE, Alisjahbana B, van der Ven AJ, van Crevel R. Implications of the global increase of diabetes for tuberculosis control and patient care. Trop Med Int Health. 2010;15(11):1289-99. doi: 10.1111/j.1365-3156.2010.02625.x. PubMed PMID: 20955495.
72. Casqueiro J, Casqueiro J, Alves C. Infections in patients with diabetes mellitus: A review of pathogenesis. Indian J Endocrinol Metab. 2012;16 Suppl 1:S27-36. doi: 10.4103/2230-8210.94253. PubMed PMID: 22701840; PubMed Central PMCID: PMCPMC3354930.
73. Peleg AY, Weerarathna T, McCarthy JS, Davis TME. Common infections in diabetes: pathogenesis, management and relationship to glycaemic control. Diabetes-Metabolism Research and Reviews. 2007;23(1):3-13. doi: 10.1002/dmrr.682. PubMed PMID: WOS:000243728600001.
74. Joshi N, Caputo GM, Weitekamp MR, Karchmer AW. Infections in patients with diabetes mellitus. N Engl J Med. 1999;341(25):1906-12. doi: 10.1056/NEJM199912163412507. PubMed PMID: 10601511.
75. Vardakas KZ, Siempos II, Falagas ME. Diabetes mellitus as a risk factor for nosocomial pneumonia and associated mortality. Diabetic Medicine. 2007;24(10):1168-71. doi: DOI 10.1111/j.1464-5491.2007.02234.x. PubMed PMID: WOS:000249660600021.
76. Restrepo BI, Camerlin AJ, Rahbar MH, Wang WW, Restrepo MA, Zarate I, et al. Cross-sectional assessment reveals high diabetes prevalence among newly-diagnosed tuberculosis cases. Bulletin of the World Health Organization. 2011;89(5):352-9. doi: 10.2471/Blt.10.085738. PubMed PMID: WOS:000290604500020.
77. Harries AD, Lin Y, Satyanarayana S, Lonnroth K, Li L, Wilson N, et al. The looming epidemic of diabetes-associated tuberculosis: learning lessons from HIV-associated tuberculosis. International Journal of Tuberculosis and Lung Disease. 2011;15(11):1436-44. doi: 10.5588/ijtld.11.0503. PubMed PMID: WOS:000296174400007.
78. Dooley KE, Chaisson RE. Tuberculosis and diabetes mellitus: convergence of two epidemics. Lancet Infectious Diseases. 2009;9(12):737-46. PubMed PMID: WOS:000272292000016.
79. Geerlings SE, Hoepelman AIM. Immune dysfunction in patients with diabetes mellitus (DM). Fems Immunology and Medical Microbiology. 1999;26(3-4):259-65. doi: DOI 10.1111/j.1574-695X.1999.tb01397.x. PubMed PMID: WOS:000083976800011.
34
652653654655656657658659660661662663664665666667668669670671672673674675676677678679680681682683684685686687688689690691692693694695696
80. Viardot A, Grey ST, Mackay F, Chisholm D. Potential antiinflammatory role of insulin via the preferential polarization of effector T cells toward a T helper 2 phenotype. Endocrinology. 2007;148(1):346-53. doi: 10.1210/en.2006-0686. PubMed PMID: 17008395.
81. Stalenhoef JE, Alisjahbana B, Nelwan EJ, van der Ven-Jongekrijg J, Ottenhoff TH, van der Meer JW, et al. The role of interferon-gamma in the increased tuberculosis risk in type 2 diabetes mellitus. Eur J Clin Microbiol Infect Dis. 2008;27(2):97-103. doi: 10.1007/s10096-007-0395-0. PubMed PMID: 17962984.
82. Tsukaguchi K, Okamura H, Ikuno M, Kobayashi A, Fukuoka A, Takenaka H, et al. [The relation between diabetes mellitus and IFN-gamma, IL-12 and IL-10 productions by CD4+ alpha beta T cells and monocytes in patients with pulmonary tuberculosis]. Kekkaku. 1997;72(11):617-22. PubMed PMID: 9423299.
83. Delamaire M, Maugendre D, Moreno M, Le Goff MC, Allannic H, Genetet B. Impaired leucocyte functions in diabetic patients. Diabet Med. 1997;14(1):29-34. doi: 10.1002/(SICI)1096-9136(199701)14:1<29::AID-DIA300>3.0.CO;2-V. PubMed PMID: 9017350.
84. Rayfield EJ, Ault MJ, Keusch GT, Brothers MJ, Nechemias C, Smith H. Infection and diabetes: the case for glucose control. Am J Med. 1982;72(3):439-50. PubMed PMID: 7036735.
85. Yamashiro S, Kawakami K, Uezu K, Kinjo T, Miyagi K, Nakamura K, et al. Lower expression of Th1-related cytokines and inducible nitric oxide synthase in mice with streptozotocin-induced diabetes mellitus infected with Mycobacterium tuberculosis. Clin Exp Immunol. 2005;139(1):57-64. doi: 10.1111/j.1365-2249.2004.02677.x. PubMed PMID: WOS:000225754600009.
86. Martens GW, Arikan MC, Lee JH, Ren FC, Greiner D, Kornfeld H. Tuberculosis susceptibility of diabetic mice. Am J Resp Cell Mol. 2007;37(5):518-24. doi: 10.1165/rcmb.2006-04780C. PubMed PMID: WOS:000250738200003.
87. World Health Organization. Use of Glycated Haemoglobin (HbA1c) in the Diagnosis of Diabetes Mellitus. http://www.who.int/cardiovascular_diseases/report-hba1c_2011_edited.pdf?ua=1 (accessed October 15, 2017). 2011.
88. Feinstein AR, Walter SD, Horwitz RI. An Analysis of Berksons Bias in Case Control Studies. Journal of Chronic Diseases. 1986;39(7):495-504. doi: Doi 10.1016/0021-9681(86)90194-3. PubMed PMID: WOS:A1986D295500002.
89. Awad SF, Dargham SR, Omori R, Pearson F, Critchley J, Abu-Raddad LJ. Characterizing the Impact of Diabetes Mellitus on Tuberculosis Epidemiology: Analytical Insights. under preperation. 2017.
90. Lienhardt C, Rodrigues LC. Estimation of the impact of the human immunodeficiency virus infection on tuberculosis: tuberculosis risks re-visited? Int J Tuberc Lung Dis. 1997;1(3):196-204. PubMed PMID: 9432364.
35
697698699700701702703704705706707708709710711712713714715716717718719720721722723724725726727728729730731732733734735
736

Supporting information
S1 Table: Summary findings of the meta-analyses for the sensitivity analyses of the
association between DM and active TB in 44 studies, according to study design and overall.
S2 Table: Estimates and summary estimates of the association between DM and active TB,
according to DM ascertainment in blood-tested patients and study design.
S1 Figure: PRISMA checklist.
S2 Figure: Funnel plots assessing the risk of publication bias according to study design.
S1 Box. Data sources and search criteria for systematically reviewing literature reporting
on active tuberculosis (TB) and diabetes mellitus (DM) association.
S2 Box. Criteria used to assess quality of included studies.
S1 Text. Calculation of attributable risk fraction of TB among DM patients and population
attributable risk fraction of TB due to DM.
36
737
738
739
740
741
742
743
744
745
746
747
748
749