DSOM® - Decision Support for Operations and Maintenance ...
30
DSOM DSOM ® - Decision Support for Operations - Decision Support for Operations and Maintenance – Application to a and Maintenance – Application to a USMC Base Centralized Energy System USMC Base Centralized Energy System Presented to: IDEA 95 th Annual Conference 29 June 2004 Dick Meador Program Manager Pacific Northwest National Laboratory
Transcript of DSOM® - Decision Support for Operations and Maintenance ...

DSOMDSOM®® - Decision Support for Operations - Decision Support for Operations and Maintenance – Application to a and Maintenance – Application to a
USMC Base Centralized Energy SystemUSMC Base Centralized Energy System
Presented to:
IDEA 95th Annual Conference 29 June 2004
Dick MeadorProgram Manager
Pacific Northwest National Laboratory
2 04/29/04
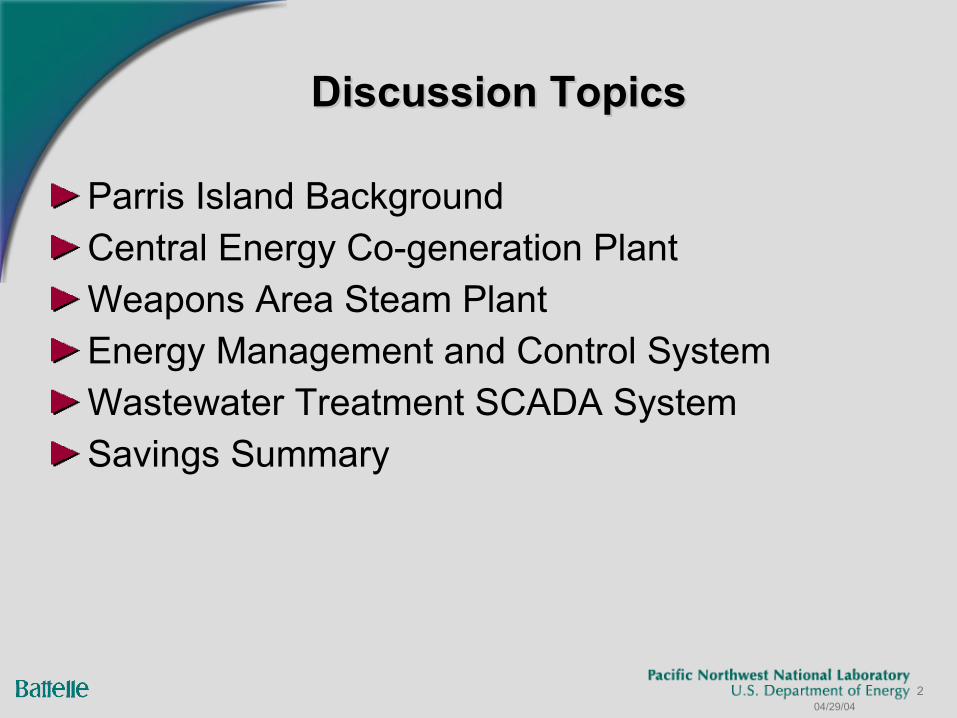
Discussion TopicsDiscussion Topics
Parris Island BackgroundCentral Energy Co-generation PlantWeapons Area Steam PlantEnergy Management and Control SystemWastewater Treatment SCADA SystemSavings Summary
3 04/29/04
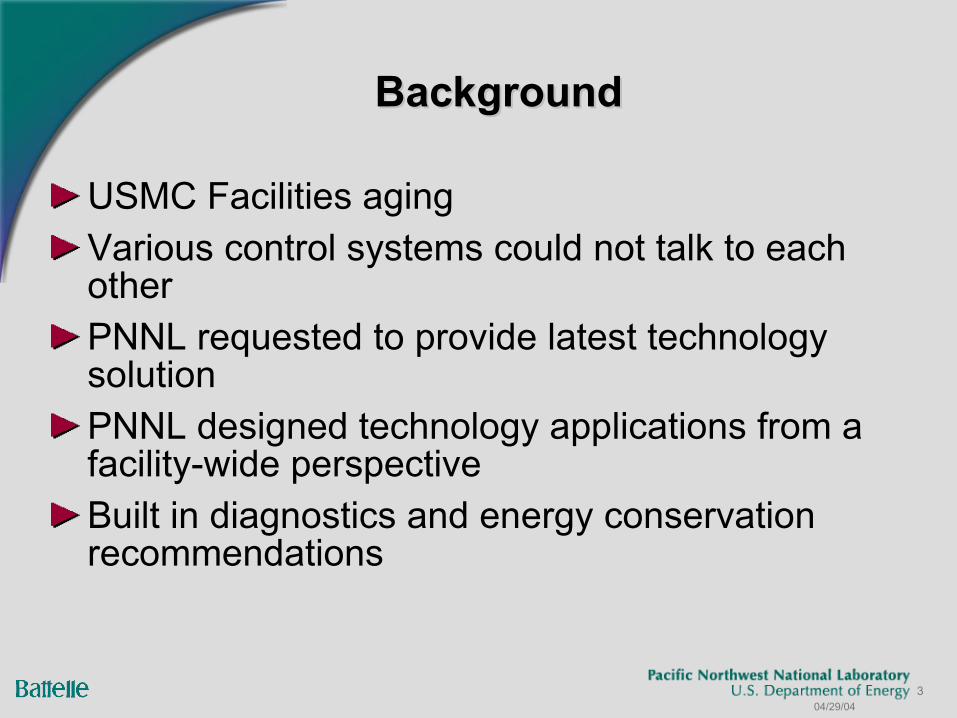
BackgroundBackground
USMC Facilities agingVarious control systems could not talk to each otherPNNL requested to provide latest technology solutionPNNL designed technology applications from a facility-wide perspectiveBuilt in diagnostics and energy conservation recommendations

4 04/29/04
Central Energy PlantCentral Energy Plant
Three 400 psig steam boilers can provide steam to supply three 1-kW extraction steam turbine generators plus 125 psig site steam loadsOne 125 psig boiler to supply site steam when generation is not requiredNatural Gas fired with #2 oil backupCostly penalties for exceeding electrical demand peak for more than 15 minutes
5 04/29/04
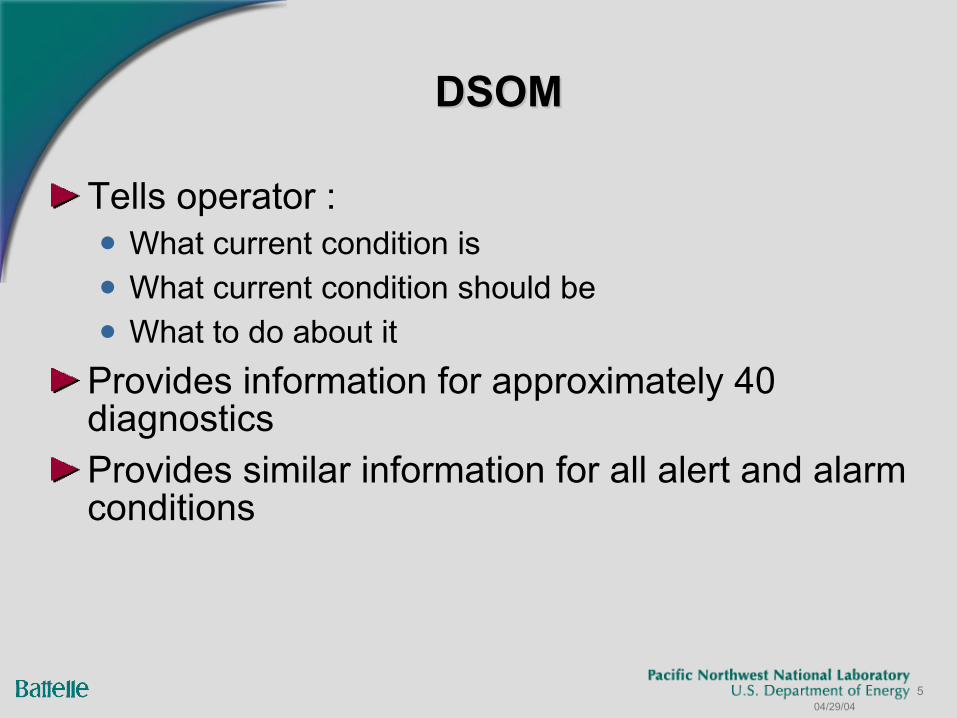
DSOMDSOM
Tells operator : What current condition is What current condition should be What to do about it
Provides information for approximately 40 diagnosticsProvides similar information for all alert and alarm conditions
6 04/29/04
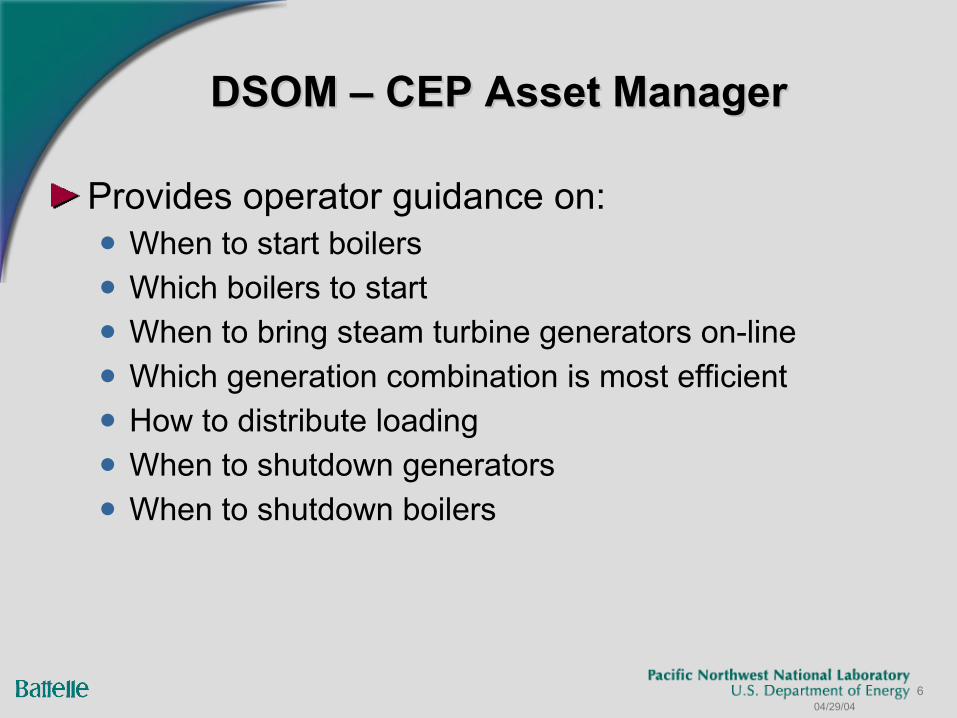
DSOM – CEP Asset ManagerDSOM – CEP Asset Manager
Provides operator guidance on: When to start boilers Which boilers to start When to bring steam turbine generators on-line Which generation combination is most efficient How to distribute loading When to shutdown generators When to shutdown boilers
7 04/29/04
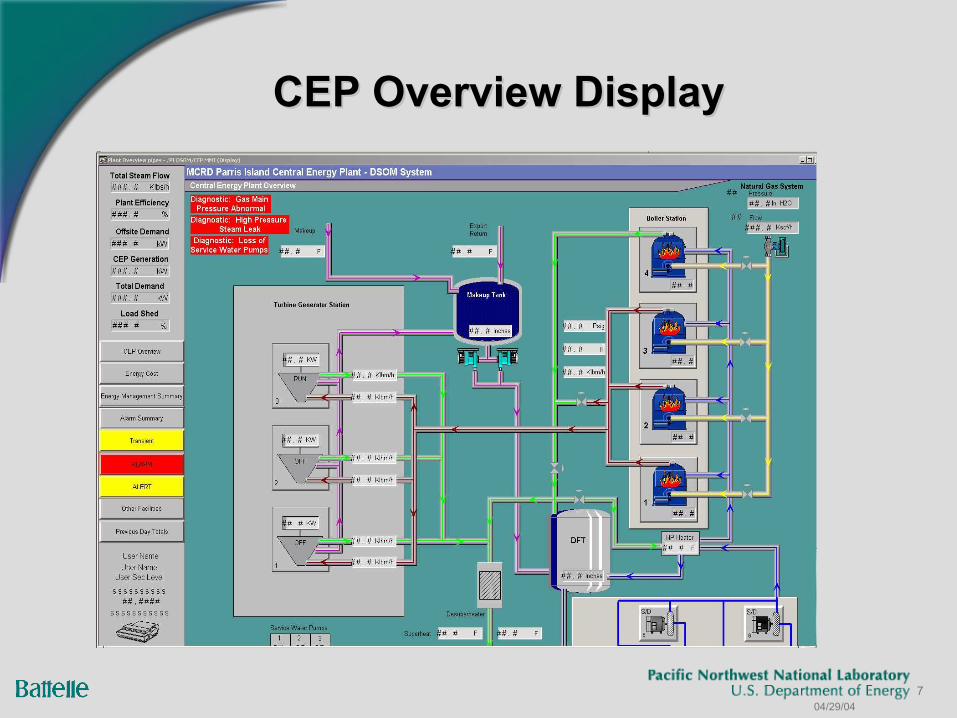
CEP Overview DisplayCEP Overview Display

8 04/29/04
DSOM – CEP Alert Display ExampleDSOM – CEP Alert Display Example
9 04/29/04
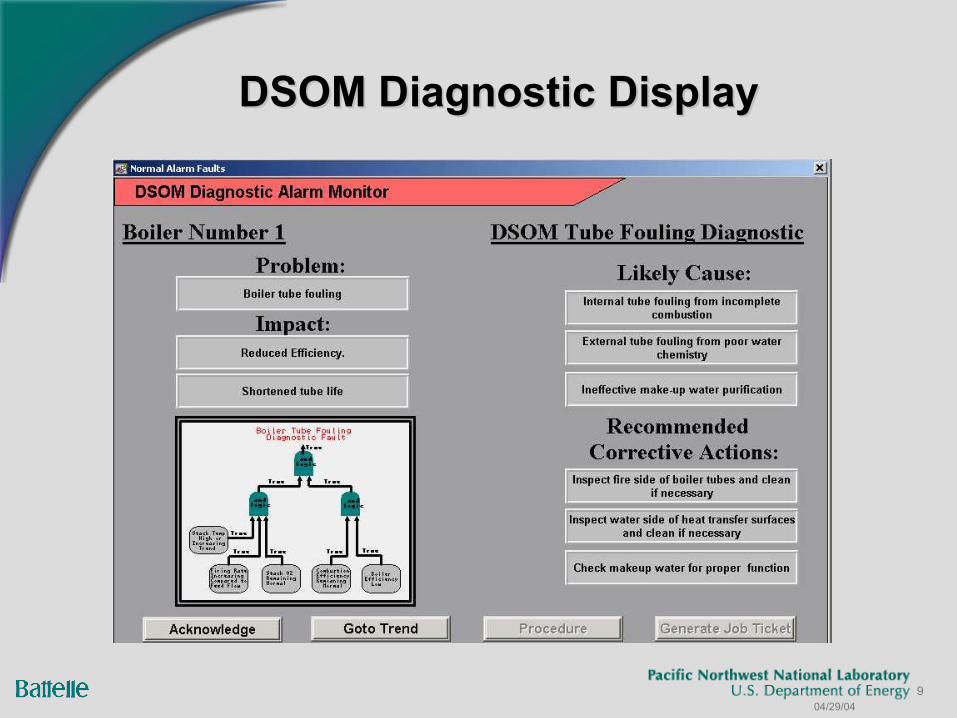
DSOM Diagnostic DisplayDSOM Diagnostic Display

10 04/29/04
DSOM – CEP Engineering Trend DisplayDSOM – CEP Engineering Trend Display
11 04/29/04
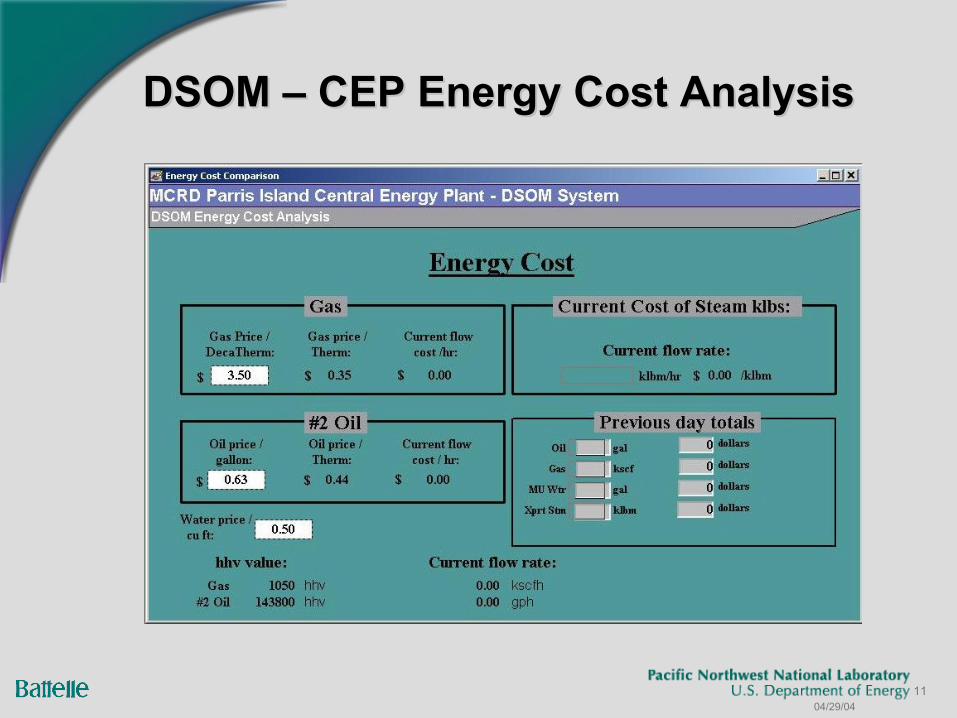
DSOM – CEP Energy Cost AnalysisDSOM – CEP Energy Cost Analysis

12 04/29/04
DSOM – Weapons Area PlantDSOM – Weapons Area Plant
Three 125 psig steam boilers to supply Weapons Area loadsManned 24 hours, 7 days a weekLack of qualified personnelDSOM allowed full remote monitoring with S/D control from CEP DSOM allowed unmanning of the plant

13 04/29/04
DSOM – Weapons Area PlantDSOM – Weapons Area Plant
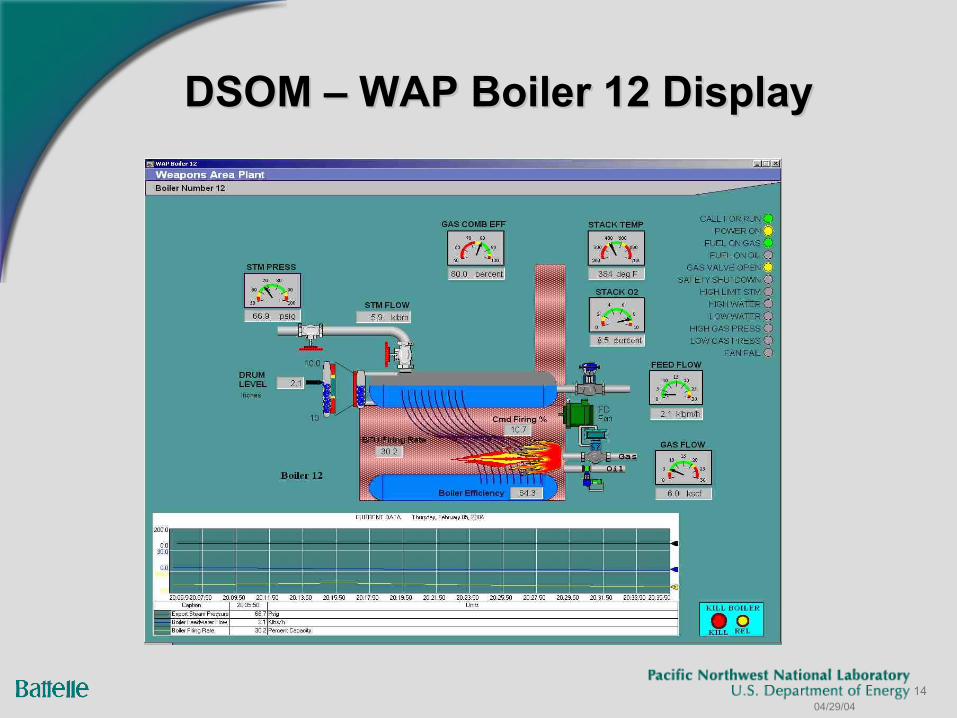
Same software as used at CEPEfficiency and parameter monitoringCan detect Boiler tube leakage Boiler tube fouling Steam drum water level control malfunctions Excessive firebox heat loss Over-firing and stack gas condensation alarms
14 04/29/04
DSOM – WAP Boiler 12 DisplayDSOM – WAP Boiler 12 Display

15 04/29/04
Energy Management and Control SystemsEnergy Management and Control Systems
Five different independent building control systems installedAC&R shop would send out personnel in trucks to reduce Base load demandPNNL engineered system upgraded all with open protocol systemDesigned to coordinate with DSOM at CEP to manage and automatically shed load
16 04/29/04
EMCS Load Shed SchemeEMCS Load Shed Scheme
CEP asset manager sequences generation requirementsEMCS allows for building zone temperature control and occupied/un-occupied modesWhen target Base load is exceeded, load shedding sequence is activatedWill not allow demand to exceed peak
17 04/29/04
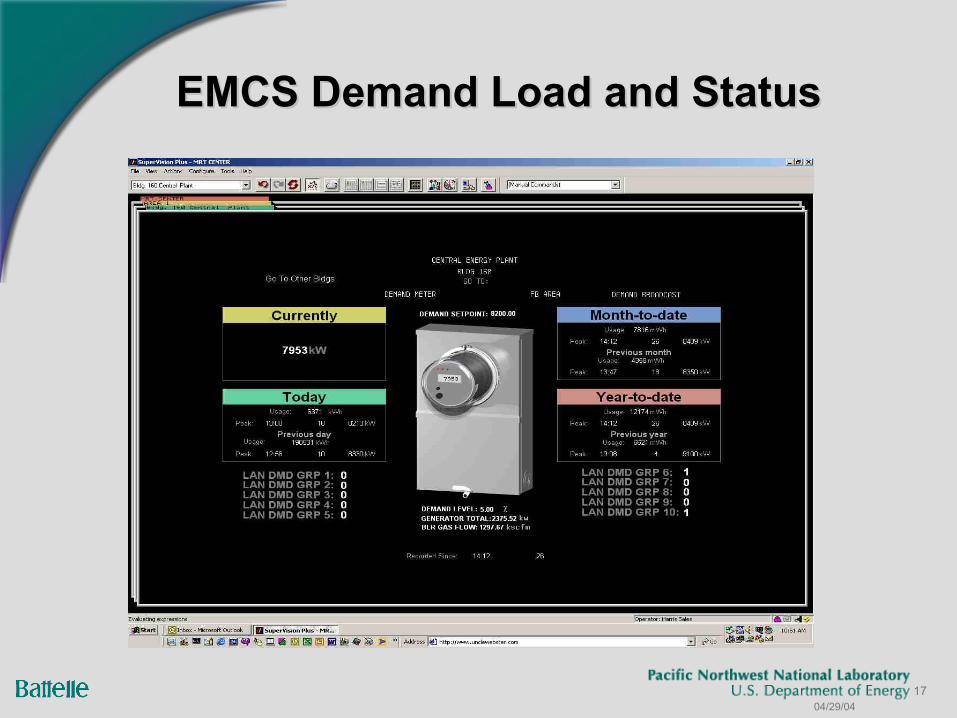
EMCS Demand Load and StatusEMCS Demand Load and Status
18 04/29/04
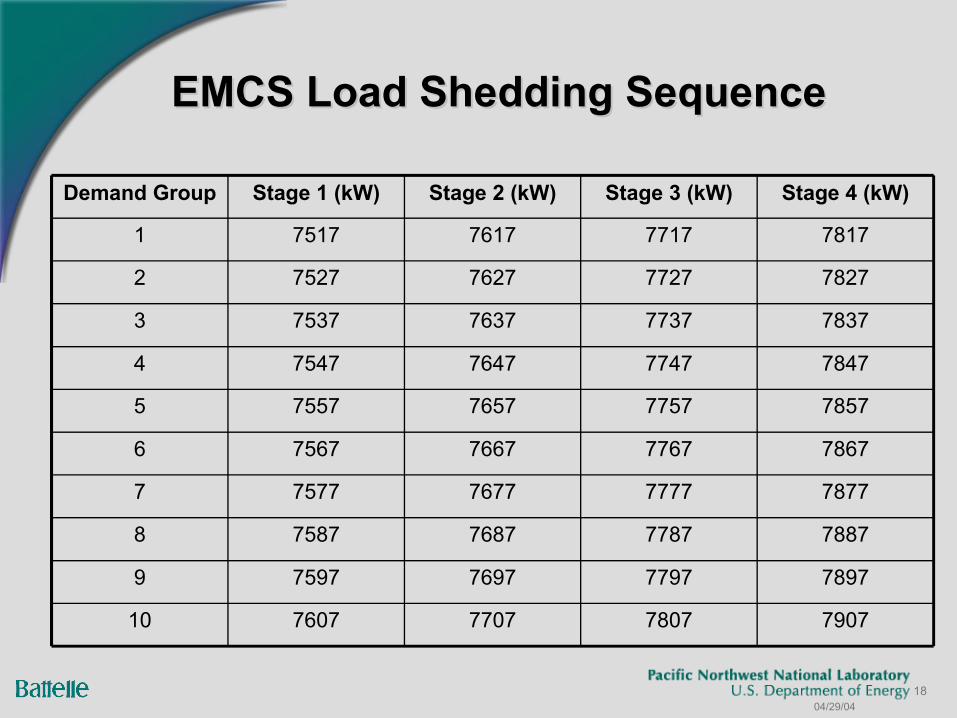
EMCS Load Shedding SequenceEMCS Load Shedding Sequence
790778077707760710
78977797769775979
78877787768775878
78777777767775777
78677767766775676
78577757765775575
78477747764775474
78377737763775373
78277727762775272
78177717761775171
Stage 4 (kW)Stage 3 (kW)Stage 2 (kW)Stage 1 (kW)Demand Group
19 04/29/04
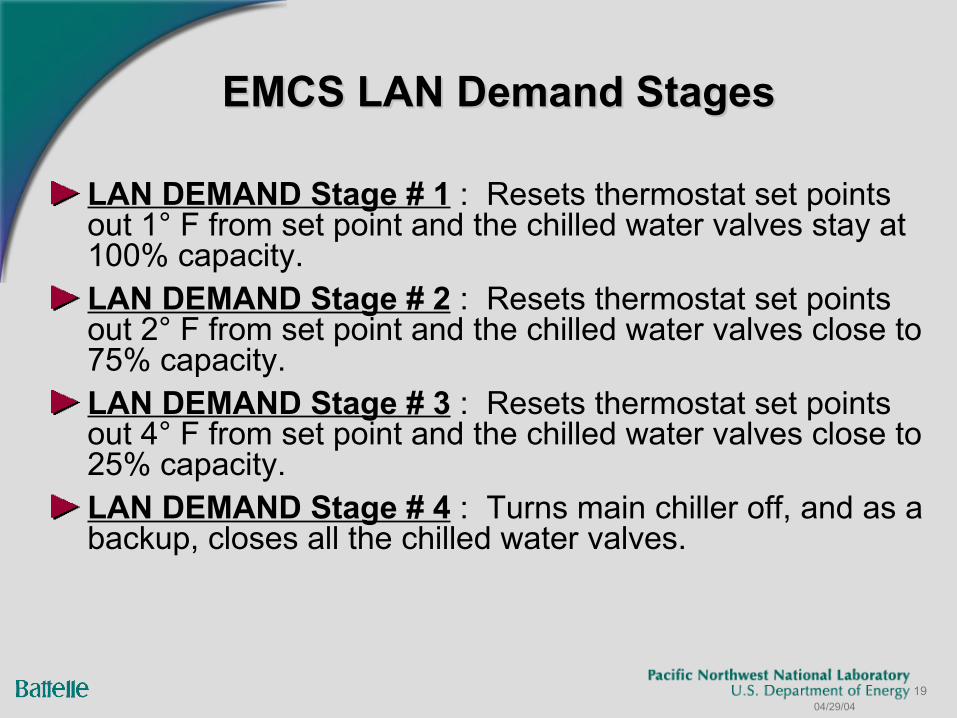
EMCS LAN Demand StagesEMCS LAN Demand Stages
LAN DEMAND Stage # 1 : Resets thermostat set points out 1° F from set point and the chilled water valves stay at 100% capacity.LAN DEMAND Stage # 2 : Resets thermostat set points out 2° F from set point and the chilled water valves close to 75% capacity.LAN DEMAND Stage # 3 : Resets thermostat set points out 4° F from set point and the chilled water valves close to 25% capacity.LAN DEMAND Stage # 4 : Turns main chiller off, and as a backup, closes all the chilled water valves.

20 04/29/04
EMCS SummaryEMCS Summary
Energy Controls Technician can program all load shedding groups and stages according to Base priorities
60 buildings are on-line and are controlled to reduce demand by nearly 2 MW over approximately 3.3 million square feet of building space
21 04/29/04
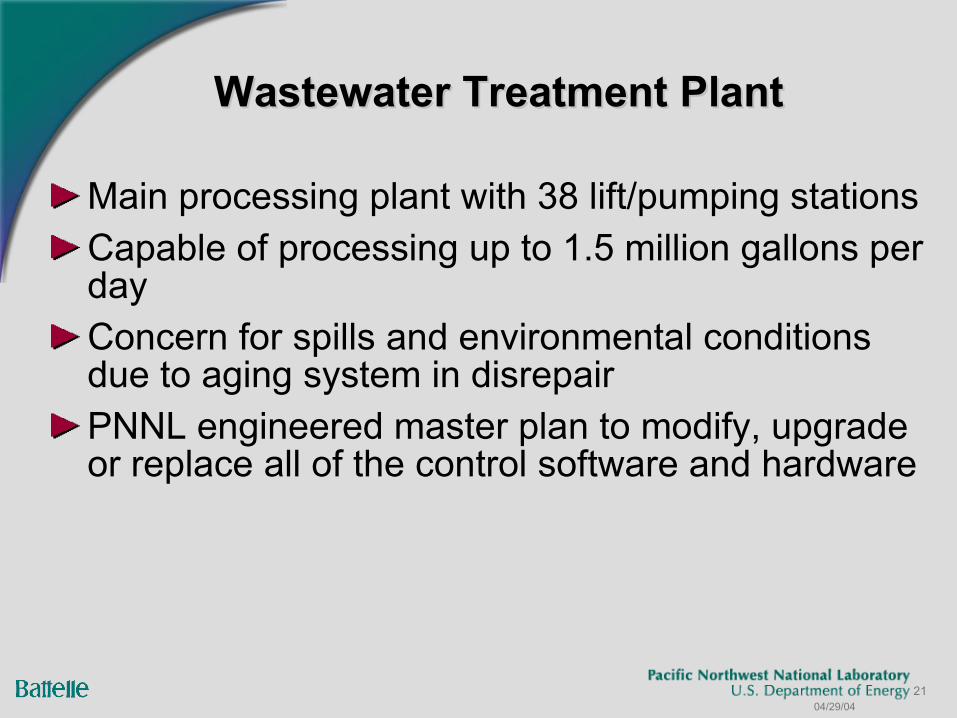
Wastewater Treatment PlantWastewater Treatment Plant
Main processing plant with 38 lift/pumping stationsCapable of processing up to 1.5 million gallons per dayConcern for spills and environmental conditions due to aging system in disrepairPNNL engineered master plan to modify, upgrade or replace all of the control software and hardware
22 04/29/04
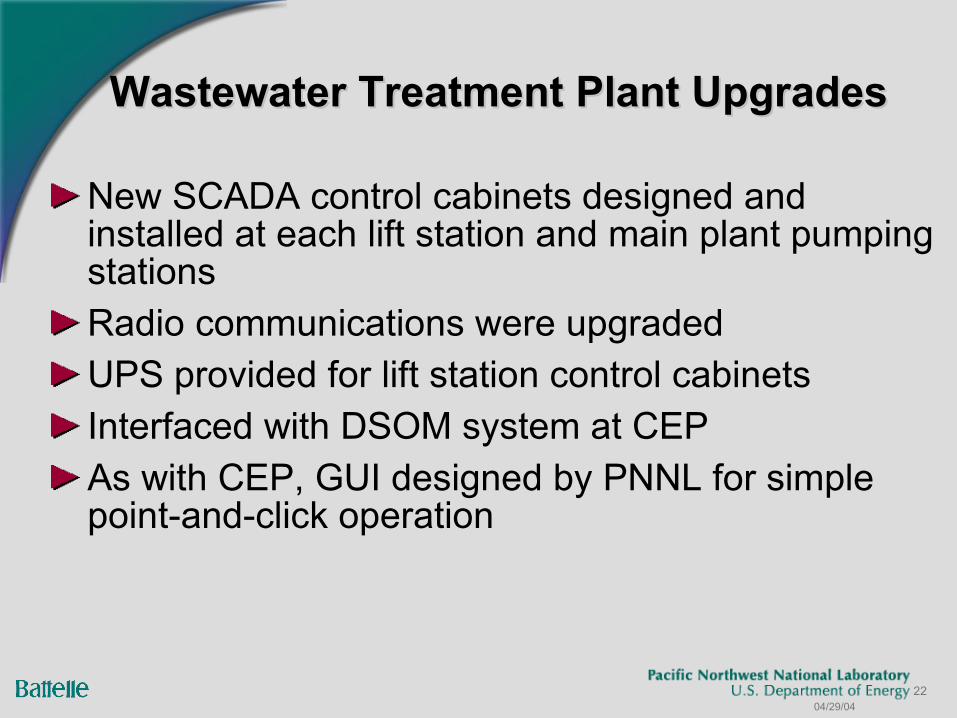
Wastewater Treatment Plant UpgradesWastewater Treatment Plant Upgrades
New SCADA control cabinets designed and installed at each lift station and main plant pumping stationsRadio communications were upgraded UPS provided for lift station control cabinetsInterfaced with DSOM system at CEPAs with CEP, GUI designed by PNNL for simple point-and-click operation
23 04/29/04
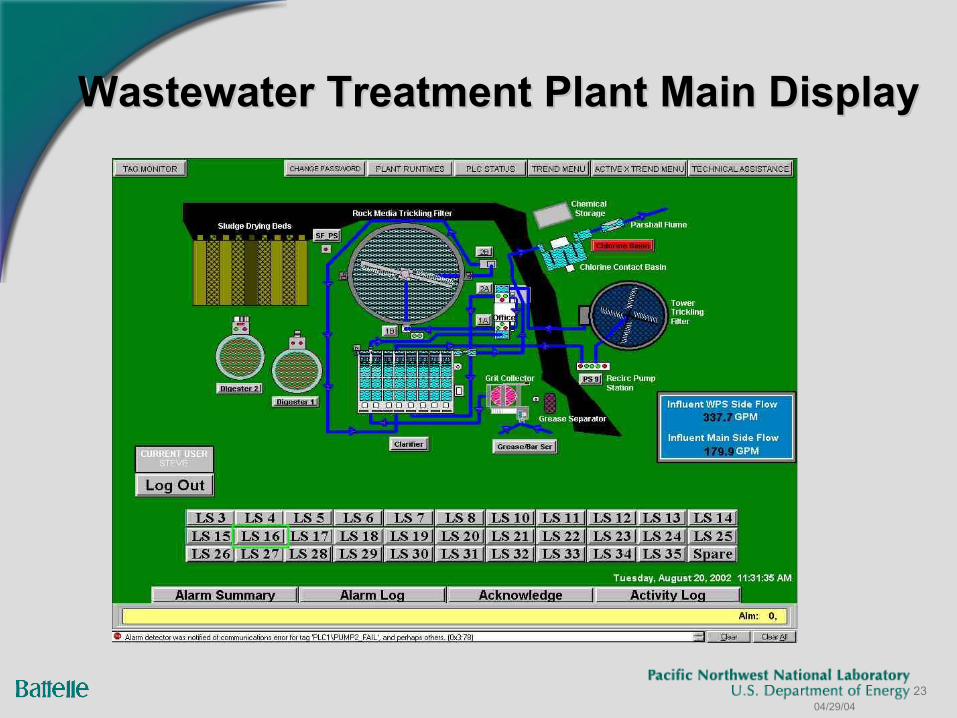
Wastewater Treatment Plant Main DisplayWastewater Treatment Plant Main Display
24 04/29/04
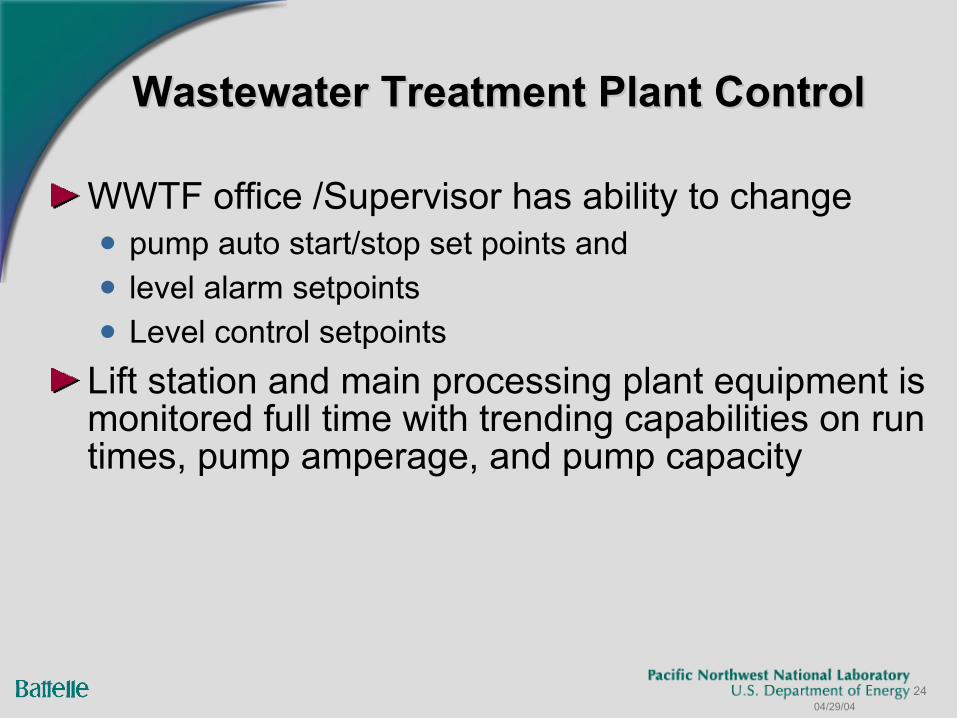
Wastewater Treatment Plant ControlWastewater Treatment Plant Control
WWTF office /Supervisor has ability to change pump auto start/stop set points and level alarm setpoints Level control setpoints
Lift station and main processing plant equipment is monitored full time with trending capabilities on run times, pump amperage, and pump capacity
25 04/29/04
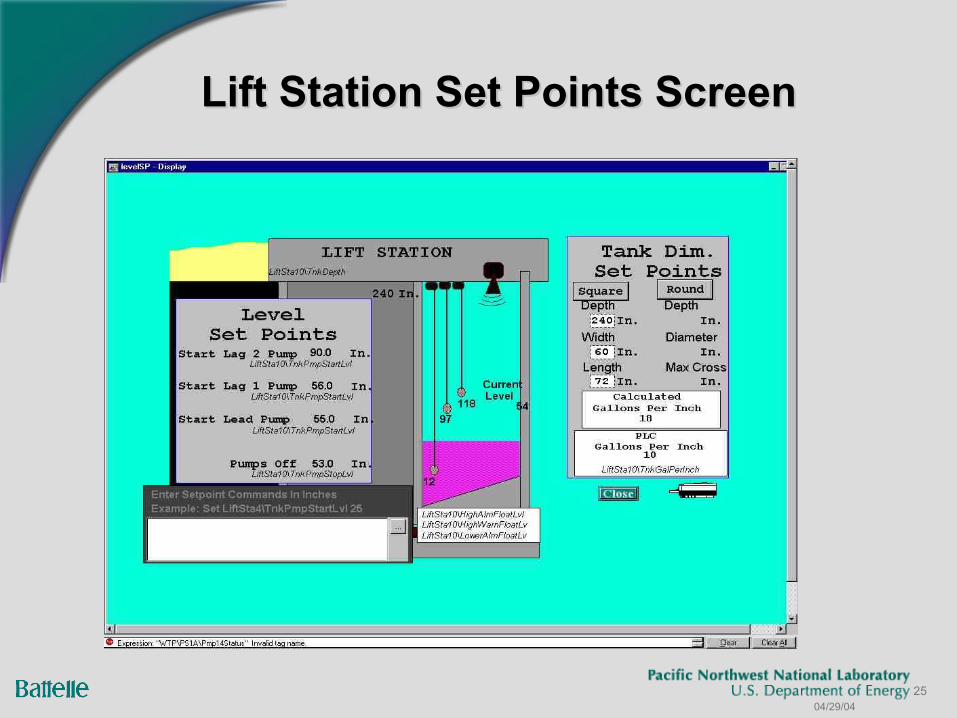
Lift Station Set Points ScreenLift Station Set Points Screen

26 04/29/04
Energy Savings SummaryEnergy Savings Summary
Energy use per square foot went from 51.06 Btu/sqft/dd in the base year FY 1999 down to 45.73 Btu/sqft/dd in FY 2002.
This is a reduction of 5.33 Btu/sqft/dd or a 10.4% reduction from the base year. This can be attributed to DSOM and EMCS activities resulting in coordinated energy control at Parris Island.

27 04/29/04
EMCS Load Shedding SequenceEMCS Load Shedding Sequence
2003
$513,4915.3345.732002
$293,5014.2446.822001
$94,7611.1649.902000
51.061999
$ SavedReduction from BaselineBtu/sqft/dd)Fiscal Year
28 04/29/04
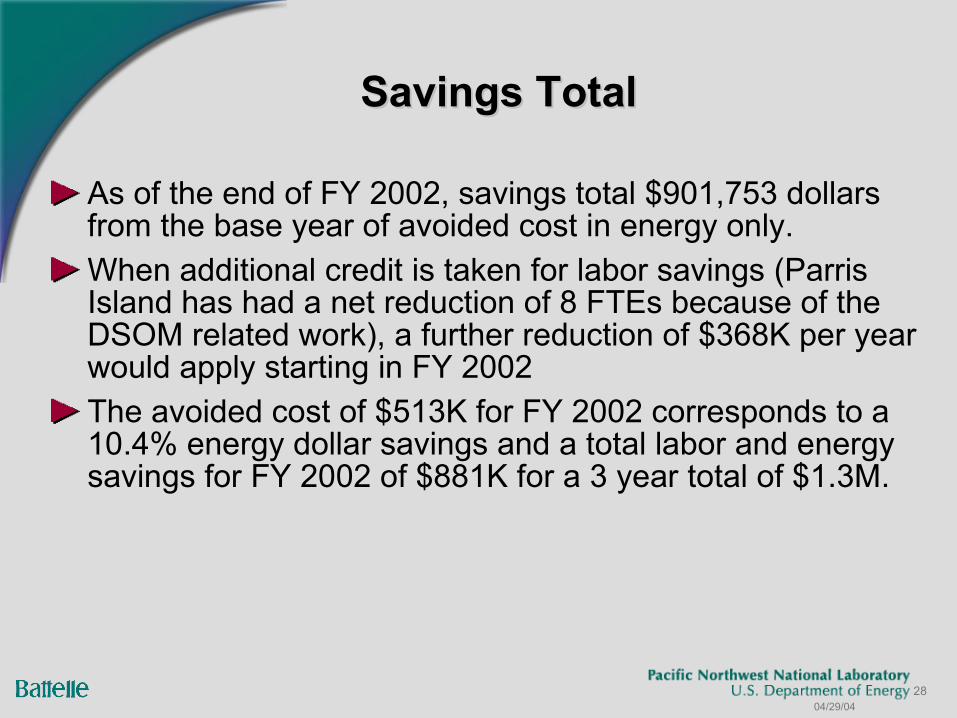
Savings TotalSavings Total
As of the end of FY 2002, savings total $901,753 dollars from the base year of avoided cost in energy only. When additional credit is taken for labor savings (Parris Island has had a net reduction of 8 FTEs because of the DSOM related work), a further reduction of $368K per year would apply starting in FY 2002 The avoided cost of $513K for FY 2002 corresponds to a 10.4% energy dollar savings and a total labor and energy savings for FY 2002 of $881K for a 3 year total of $1.3M.

29 04/29/04
Parris Island Energy Savings GraphParris Island Energy Savings Graph
Parris Island Total Savings
0
200000
400000
600000
800000
1000000
1200000
1400000
1999 2000 2001 2002
Year
$$$ $
30 04/29/04
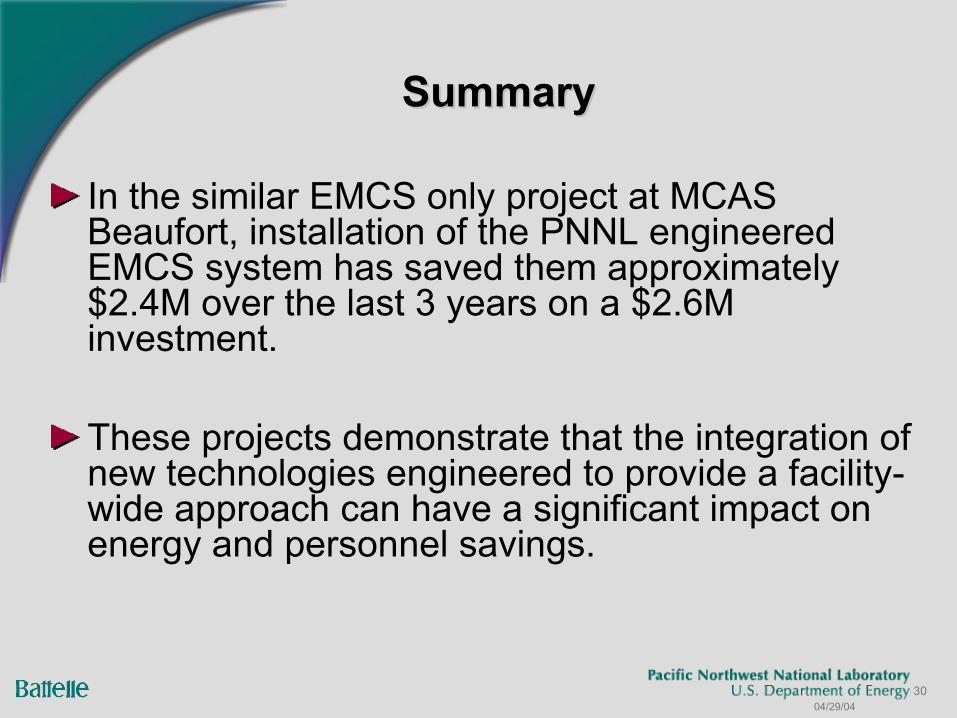
SummarySummary
In the similar EMCS only project at MCAS Beaufort, installation of the PNNL engineered EMCS system has saved them approximately $2.4M over the last 3 years on a $2.6M investment.
These projects demonstrate that the integration of new technologies engineered to provide a facility-wide approach can have a significant impact on energy and personnel savings.