DROUGHT COPYING STRATEGIES AT MUTASA DISTRICT IN …
101
DROUGHT COPYING STRATEGIES AT MUTASA DISTRICT IN ZIMBABWE By NDLOVU BRAIN 2009103611 Submitted in partial fulfilment of the requirements for the degree Masters in Disaster Management In the Disaster Management Training and Education Centre for Africa At the UNIVERSITY OF THE FREE STATE Study Leader: ANDRIES J. JORDAAN 2011
Transcript of DROUGHT COPYING STRATEGIES AT MUTASA DISTRICT IN …
DROUGHT COPYING STRATEGIES AT MUTASA DISTRICT IN ZIMBABWE
By
NDLOVU BRAIN
2009103611
Submitted in partial fulfilment of the requirements for the degree
Masters in Disaster Management
In the
Disaster Management Training and Education Centre for Africa
At the
UNIVERSITY OF THE FREE STATE
Study Leader: ANDRIES J. JORDAAN
2011
ii
DECLARATION
By submitting my thesis, I confirm that the work submitted for assessment for this work is my
own unaided work except where I have explicitly indicated otherwise. I have followed the
required convention in referencing the thoughts and ideas of others and I have not previously
or in its entirety or in part submitted it for obtaining any qualification.
................................................ ...............................................
BRAIN NDLOVU DATE
iii
DEDICATION
To my late brother, Clifford Ndlovu. He encouraged me to do these studies,
but never lived to see my work.
iv
ABSTRACT Recurring droughts are an endemic feature for agriculture in Zimbabwe, a country whose
majority of the population (70%) depends on agricultural based activities as their livelihoods
resource. Concern is growing that drought might become more frequent in the region as a
result of global warming. If this occurs it will exacerbate problems for vulnerable households,
communities and economies. The study reviews coping strategies of the community towards
drought, and assesses the capacity of local institutions in dealing with drought. The
objectives of the study was to identify and examine coping mechanisms in place by individual
households and the community, to identify local institutions involved in drought mitigation, to
assess how local institutions have responded to disaster risk reduction and appraise the
capacity of local institutions involved in risk reduction. Participatory, consultative and
deductive research methods including household surveys, focused group discussions, key
informants interviews, observations and review of literature allowed for the collection of
empirical, descriptive, and spatial data to provide for the appraisal. The study revealed that households in the district have developed sophisticated (ex ante)
risk-management and (ex post) risk-coping strategies to cope with food shortages or drought.
In the initial phases of difficulty, tendency to reduce meal portions, go the whole day without
food, sale of labour and use of available resources such as savings, were the most common.
As the situation intensified, recourse was sought in broader social and economic interactions
such as sending some members of the family to other relatives, cross border trading, sale of
small stock; barter exchange and even begging were established. Finally, sale of productive
assets such as large stock, implements and non productive, but difficult to replace assets,
such as valuable roofing material in the form of asbestos sheets occur. The study
established that various institutions were involved in drought management in the district.
They included government departments, CBOs/NGOs/INGOs, local leadership and the
community, social networks that include friends and relatives and some religious
arganisations. However, not much support had been coming from government institutions as
compared to NGOs. Challenges common to both NGOs and Government departments
included political interference in day-to-day activities that sometimes derailed implementation
of drought risk reduction activities. The existing economic environment had also led to high
staff turn-over in most government departments and shortages of inputs and materials
required for drought risk reduction. The current global economic crisis exacerbated the
situation affecting funding inflows for some NGOs. Recommendations were proposed and
key among them were to design sustainable interventions for a drought prone area and a
local and participatory agro ecosystem appraisal is necessary. The most effective
interventions will prove to be those that enhance household coping strategies. A user friendly
v
satellite remote sensing must be designed and vulnerability maps in the early warning
systems. To establish civil protection committees at grassroots level is of paramount
importance.
vi
ACKNOWLEDGEMENTS
§ I wish to express my sincere gratitude to my study leader Andries J. Jordaan, who
guided me throughout the study period. The gratitude is also extended to staff members
in the department such as Olivia, Alice and Anneline who were always there for advice,
even at short notice.
§ Dr Chikobvu who was instrumental in the design of my questionnaire for quantitative
data, thank you.
§ The study would not have been successful without the support of Mr Cephas Nyambo the
then acting District Agricultural Extension Officer for Mutasa District, for his unfailing
support in gathering the research data.
§ Honestly, the acknowledgement will be incomplete without featuring my wife Ireen and
daughters Luana and Lethabo who endured long hours without their father who was
trying to compile this work into a readable piece.
vii
TABLE OF CONTENTS
DECLARATION ............................................................................................................................................ II
DEDICATION ............................................................................................................................................... III
ABSTRACT .................................................................................................................................................. IV
ACKNOWLEDGEMENTS ........................................................................................................................... VI
TABLE OF CONTENTS ............................................................................................................................. VII
LIST OF TABLES ......................................................................................................................................... X
ABBREVIATIONS AND ACRONYMS ....................................................................................................... XI
CHAPTER 1: INTRODUCTION .................................................................................................................... 1
1.1 INTRODUCTION ................................................................................................................................. 1 1.2 BACKGROUND ................................................................................................................................. 1 1.3 PROBLEM STATEMENT..................................................................................................................... 4 1.4 RESEARCH OBJECTIVE..................................................................................................................... 6 1.5 JUSTIFICATION OF THE STUDY .......................................................................................................... 6 1.6 HYPOTHESIS .................................................................................................................................... 7 1.7 DELIMITATIONS OF THE STUDY ......................................................................................................... 7 1.8 LIMITATIONS OF THE STUDY ............................................................................................................. 7 1.9 THESIS OUTLINE............................................................................................................................... 7 1.10 CONCLUSION ................................................................................................................................... 7
CHAPTER 2: STUDY AREA AND RESEARCH METHODOLOGY .......................................................... 9
2.1. INTRODUCTION ................................................................................................................................. 9 2.2. STUDY AREA .................................................................................................................................... 9 2.3. METHODOLOGY ............................................................................................................................. 13 2.4 CONCLUSION ................................................................................................................................. 16
CHAPTER 3: DROUGHT LITERATURE STUDY ..................................................................................... 18
3.1 INTRODUCTION .............................................................................................................................. 18 3.2 SOUTHERN AFRICA ....................................................................................................................... 18 3.3 PROPOSED DROUGHT PLAN .......................................................................................................... 20 3.4 CONCLUSION ................................................................................................................................. 28
CHAPTER 4: DROUGHT IN ZIMBABWE ................................................................................................. 29
4.1. INTRODUCTION ............................................................................................................................... 29 4.2. THE LEGAL FRAME WORK IN DISASTER MANAGEMENT ................................................................... 29 4.3 DISTRICT LEVEL............................................................................................................................. 31 4.4 CURRENT CHALLENGES WITH THE LEGISLATION AND PRACTICES .................................................. 31 4.5 INSTITUTIONAL INTERVENTION ....................................................................................................... 32 4.6 IRRIGATION DEVELOPMENT ............................................................................................................ 36 4.7 VULNERABILITY AND DROUGHT:..................................................................................................... 36 4.8 COPING STRATEGIES ..................................................................................................................... 38 4.9 CONCLUSION ................................................................................................................................. 48
CHAPTER 5: RESEARCH FINDINGS....................................................................................................... 50
5.1. INTRODUCTION ............................................................................................................................... 50 5.2. HOUSEHOLD DETAILS .................................................................................................................... 50 5.3. AGRICULTURAL PRODUCTION ........................................................................................................ 52
viii
5.4. FOOD AND INCOME SOURCES ......................................................................................................... 55 5.5. COPING STRATEGIES ..................................................................................................................... 57 5.6 INSTITUTIONAL CAPACITY .............................................................................................................. 58 5.7 CONCLUSION ................................................................................................................................. 59
CHAPTER 6: RESULTS DISCUSSION ..................................................................................................... 60
6.1. INTRODUCTION ............................................................................................................................... 60 6.2 HOUSEHOLD DETAILS .................................................................................................................... 60 6.3 BASIC LIVELIHOOD PRACTICES ....................................................................................................... 60 6.4. HOUSEHOLD COPING STRATEGIES ................................................................................................. 63 6.5. INSTITUTIONAL CAPACITY .............................................................................................................. 64 6.6. DISASTER MANAGEMENT PRACTICES ............................................................................................. 68 6.7. CONCLUSION ................................................................................................................................. 69
CHAPTER 7: CONCLUSION AND RECOMMENDATIONS .................................................................... 70
7.1. INTRODUCTION ............................................................................................................................... 70 7.2. CONCLUSION ................................................................................................................................. 70 7.3. RECOMMENDATIONS ...................................................................................................................... 72 7.4. AREAS FOR FURTHER RESEARCH................................................................................................... 73 REFERENCES ......................................................................................................................................... 74
ANNEXURES ............................................................................................................................................... 78
ix
LIST of FIGURES
2.1. Location map of Zimbabwe within Southern Africa 9
2.2. The five natural regions of Zimbabwe 10
2.3. Manicaland Province of Zimbabwe 12
3.1. Ten-step planning process 20
3.2. The drought early warning system in Botswana 27
4.1. The structure of the Zimbabwe Civil Protection system 30
4.2. Drought indicator 39
4.3. Own household cereal production 43
4.4. Household responses to food security emergencies 46
4.5. Differences between households as a function of resource base 48
5.1. Sex of household heads 50
5.2. Family size 51
5.3. Level of education 51
5.4. Percentage of livestock holdings per household 53
5.5. Measures taken by farmers in anticipation to drought 54
5.6. Agricultural inputs assistance to households 54
5.7. Rainfall distribution pattern in Mutasa district 56
5.8. Drought severity in the past five years 57
5.9. Institutions available during drought 58
x
LIST of TABLES
1.1. Hazard types and their contributions to death, 1900-1999 1
2.1. Rainfall characteristics in the five natural regions of Zimbabwe 11
3.1. The annual schedule for the EWS in Botswana 26
4.1. Draft power, size of cultivated land and crop yield 35
4.2. Size of harvest and household food situation 35
4.3. Households livelihoods copying strategies and methods 44
5.1. Age of respondents 50
5.2. Marital status of household head 51
5.3. The hactarage planted every season 52
5.4. Major source of food and income in the last 5 years 55
5.5. Major source of income in the last 5 years 55
5.6. Years harvested below expectation 56
5.7. Household drought mitigation involvement in the community 59
6.1. Institutions and their roles 64
xi
ABBREVIATIONS AND ACRONYMS AGRITEX Agricultural Technical & Extension Services
AIDS Acquired Immune Deficiency Syndrome
BRIMP Botswana Rangeland Inventory and Monitoring Project
CBO Community Based Organisation
CSO Central Statistical Office
DA District Administrator
DAT Drought Assessment Tour
DCPPC District Civil Protection and Planning Committee
DDF District Development Fund
DDRC District Drought Relief Committee
DMS Department of Meteorological Services
DSS Department of Social Services
DVS Department of Veterinary Services
EWS Early Warning System
EWTC Early Warning Technical Committee
EWU Early Warning Unit
FAO Food and Agriculture Organisation
FDG Focused Group Discussion
FEWS Famine Early Warning System
FEWSNET Famine early Warning System Network
GMB Grain Marketing Board
GoZ Government of Zimbabwe
GTZ Germany Technical assistance to Zimbabwe
HIV Human Immune Virus
ICRISAT International Crop Research Institute for the Semi Arid Tropics
IMDC Inter Ministerial Drought Committee
INGO International Non Governmental Organisation
KI Key Informant
KII Key Informant Interview
xii
LPD Livestock Production Department
MLGLH Minisrty of Local Government, Lands and Housing
MLGPW & UD Ministry of Local Government Public works & Urban Development
NCPCC National Civil Protection Coordinating Committee
NDMC National Drought Mitigation Center
NGO Non Governmental Organisation
PA Provincial Administrator
RDC Rural District Council
REWU Regional Early Warning Unit
SADC Southern Africa Development Committee
SPSS Statistical Package for Social scientists
UNAIDS United Nations Programme on AIDS
UNISDR United Nations International Strategy for Disaster Reduction
UNSO United Nations Sudano-Sahelian Office
VGF Vulnerable Group Feeding
VS&L Village Saving & Lending
WFP World Food Program
ZCFU Zimbabwe Commercial Farmers Union
ZFU Zimbabwe Farmers Union
ZimVAC Zimbabwe Vulnerability Assessment Committee
1
CHAPTER 1: INTRODUCTION
1.1 Introduction In this chapter the definition, overview and impact of drought in Zimbabwe and Southern
Africa is outlined. The problem statement is formulated and objectives of the study are
stated. The justification of the work is discussed while the hypothesis, delimitation and
limitations are outlined. The outline of this thesis is then addressed at the end of the chapter.
1.2 Background Southern Africa has a highly variable climate with recurring droughts, an endemic feature of
agriculture (Du Pisani, Fouche & Venter, 1998). About 70% of Zimbabwe’s population
derives its livelihood from subsistence agriculture and other rural activities, but these
livelihoods are threatened by climate change. The agricultural sector’s reliance on seasonal,
rain-fed cultivation makes the sector particularly vulnerable to climate variability and change
(Andear, 2009).The country is prone to drought which has become more frequent in the past
decade (Andear, 2009). Drought is considered by many to be the most complex, but least
understood of all natural hazards, affecting more people than any other hazard in socio-
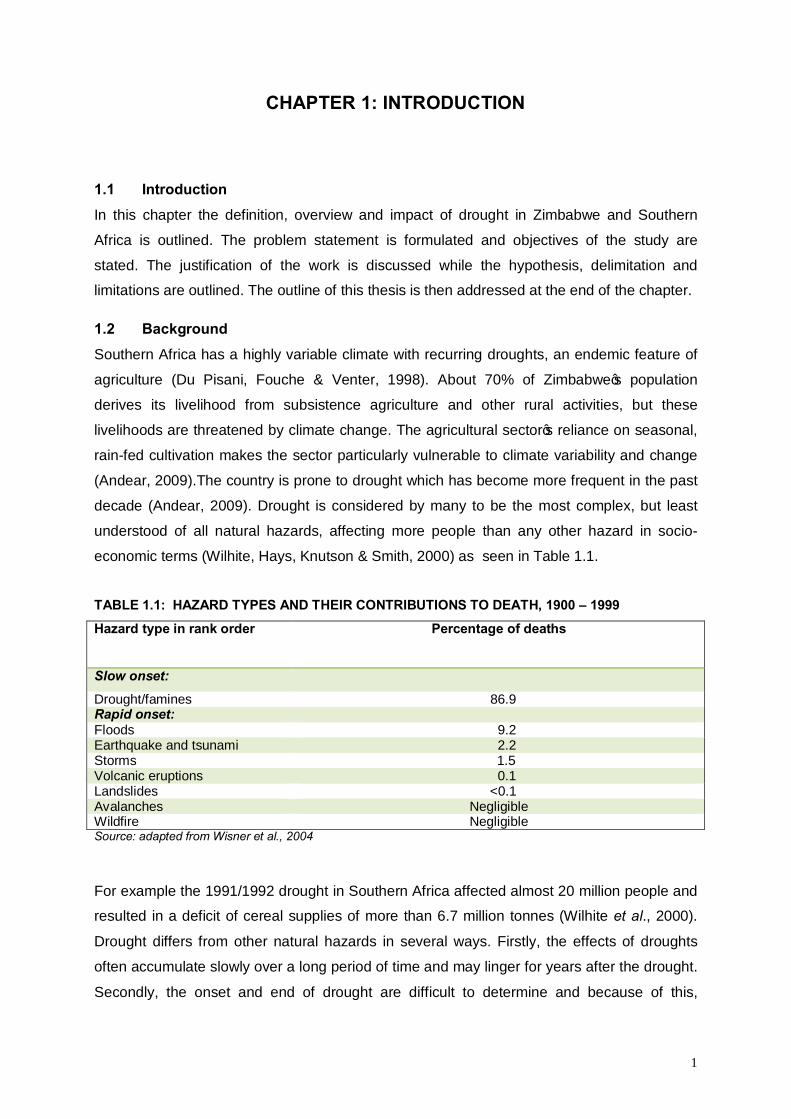
economic terms (Wilhite, Hays, Knutson & Smith, 2000) as seen in Table 1.1.
TABLE 1.1: HAZARD TYPES AND THEIR CONTRIBUTIONS TO DEATH, 1900 – 1999
Hazard type in rank order
Percentage of deaths
Slow onset:
Drought/famines 86.9 Rapid onset: Floods 9.2 Earthquake and tsunami 2.2 Storms 1.5 Volcanic eruptions 0.1 Landslides <0.1 Avalanches Negligible Wildfire Negligible Source: adapted from Wisner et al., 2004
For example the 1991/1992 drought in Southern Africa affected almost 20 million people and
resulted in a deficit of cereal supplies of more than 6.7 million tonnes (Wilhite et al., 2000).
Drought differs from other natural hazards in several ways. Firstly, the effects of droughts
often accumulate slowly over a long period of time and may linger for years after the drought.
Secondly, the onset and end of drought are difficult to determine and because of this,
2
drought is often referred to as a creeping hazard (Wilhite et al., 2000; Wisner et al., 2004).
Thirdly, despite its devastating impact, there is no precise and universally accepted definition
of droughts and this adds to the confusion about whether drought exists, and if it does, its
extent and degree of severity. Fourthly, drought has no structural and physical impact, which
to some extent has hindered the development of accurate, effective, reliable and timely
estimates of its severity and ultimately, the formulation of drought contingency plans by many
governments in Africa (Wilhite et al., 2000; Holloway, 2003).
Drought is a normal, recurring feature of the climate and occurs virtually in all climatic
regimes in high as well as low rainfall areas (International Strategy for Disaster Reduction
(ISDR), 2002). It is a temporary aberration, in contrast to aridity, which is a permanent
feature of the climate restricted to low rainfall areas (Wilhite, Hays & Knutson, 2005). In
Zimbabwe, the incidence of drought is often linked to the occurrence of El Nino episodes and
has worsened since the 1980s (ISDR, 2002). Floods that frequently occur in the northern
and southern provinces of the country, compound drought conditions in other parts of the
country (ISDR, 2002). Drought is a consequence of a natural reduction in the amount of
precipitation received over an extended period of time, usually a season or more and is also
related to timing and effectiveness of the rains such as delays in the beginning of the rainy
season, occurrence of rains in relation to crop growth stages, rainfall intensity and number of
rainfall events (Wilhite et al., 2000; Wilhite, Hays & Knutson, 2005).
There are four perspectives on drought: meteorological, agricultural, hydrological and socio-
economic. Meteorological drought is usually defined by the measure of the departure of
precipitation from the normal and the duration of the dry period. Agricultural definitions refer
to situations in which the moisture in the soil is no longer sufficient to meet the needs of the
crops growing in the area. Hydrological drought deals with surface and subsurface water
supplies (such as stream flow, reservoir/lake levels, ground water). Socio-economic drought
refers to the situation that occurs when economic goods associated with the elements of
meteorological, agricultural and hydrological drought fail to meet the demand (Bang &
Sitango, 2003).
Drought severity is dependent not only on the duration, intensity and geographical extent of a
specific episode, but also on the demands made by human activities and vegetation on an
area’s water supplies. The characteristics of drought, along with its far-reaching impacts,
make its effects on society and environment difficult, though not impossible, to identify and
quantify (Wilhite et al., 2000; Bang & Sitango, 2003; Wilhite, Hays & Knutson, 2005).
3
While drought is widely considered a natural and physical event, it has some social
component. The risk associated with drought for any region is a product of both the exposure
to the event and the vulnerability of the society to the event (Wisner et al., 2004; Wilhite,
Hays & Knutson, 2005). Exposure to drought varies spatially and there is little, if anything,
that can be done to alter the probability of its occurrence yet vulnerability on the other hand,
is determined by social factors such as population size, demographic characteristics, policy,
technology, social behaviour and coping strategies (Wilhite et al., 2000). Thus vulnerability to
drought is likely to change, either increase or decrease in response to changes in these
social factors. It is therefore logical to assume that subsequent droughts in Mutasa district
will have different effects, even if they are identical in intensity, duration and spatial
characteristics, because societal characteristics will have changed. However, much can be
done to reduce the societal vulnerability component to drought.
There is a wide range of institutional capacity to respond to drought emergencies in Southern
Africa. While some countries have a detailed organizational structure in place to coordinate
the actions of government, donors and non-governmental organizations (NGOs), most have
not developed a permanent institutional capacity (Wilhite, 2000). For example, in Zimbabwe
drought emergencies at district level such as Mutasa are coordinated by the District Drought
Relief Committee (DDRC), a committee comprised of district level stakeholders such as the
District Administrator’s office (DA), Agricultural extension services (Agritex), Livestock
Production department (LPD), Veterinary Services department (DVS), department of Social
Services (DSS), the Grain Marketing Board (GMB), the Rural District Council (RDC), NGOs
and other relevant stakeholders that may be co-opted in the committee.
Common problems with drought and other natural hazards is maintaining interest in planning
beyond the relatively short window of opportunity that follows the event, given the on-again,
off-again nature of this phenomenon. Interest in drought planning quickly wanes in the post
drought period when precipitation conditions have returned to normal or above normal level
(Wilhite, 2000). In addition, drought relief committees are well established and domiciled at
district level without well functional corresponding structures at village level where the
drought victims and first responders to drought emergencies are found.Concern is growing
that drought might become more frequent in the region as a result of global warming (ISDR,
2002). If this occurs it will exacerbate problems for vulnerable households, communities and
economies including Mutasa, hence, preparing for and mitigating drought occurring today are
not only essential activities but could help reduce adverse impacts of future change.
4
As vulnerability to drought has increased globally, greater attention should be directed at
reducing risks associated with its occurrence. This could be through the introduction of
planning to improve operational capabilities such as climate and water supply monitoring and
institutional capacity than just relief activities. This change in emphasis is long overdue
(Wilhite, 2000), in fact, mitigating the effects of drought requires the application of all
components of the disaster management cycle rather than the crisis management portion of
the cycle. Because of past emphasis on crisis management such as food aid coming in as
relief, the community of Mutasa has moved from one disaster to another with little, if any,
reduction in risk (FAO, 2010). Many institutions directly involved in drought management
mostly concentrate on the response side of the disaster management cycle than risk
reduction in drought mitigation. Such an approach has failed to build capacity of households
to deal with drought on their own. In addition, drought response has been very expensive
and non sustainable.
1.3 Problem Statement For the past decade, Mutasa district has suffered from at least seven successive agricultural
droughts. The rainfall pattern has been so erratic and mostly characterized by dry spells
such that rain fed agriculture has become unreliable. Poor rainfall has resulted in rural
households failing to harvest any meaningful produce and even those who harvest some
grain; it has not been enough to see them throughout the season resulting in food insecurity
and stress (ZimVAC1, 2009). The situation has further reduced the rural households’
capacity to fend for their children and extended families which in turn limits the households’
ability to engage in other income generating activities, invest or respond to emergencies.
Most farmers depending on rain fed agriculture have experienced a yield decline, with
average yield declining from the expected 4 t/ha to 0.1t/ha. The decline has been
exacerbated by shortage of inputs such as fertilizer, appropriate seed varieties, inadequate
extension services and timing of planting. In addition, the devastating effects of HIV/AIDS
estimated at 15.5% and the continuous rural - urban migration or border jumping to
neighbouring countries such as Mozambique and South Africa in search of opportunities
among the most productive age group, pose a challenge to food production.
The majority of communal farmers have also lost draught power and the high cost of inputs
and unavailability of inputs have further compounded the challenges rural households face to
acquire the necessary inputs they need to realise better yields (Agricultural Technical &
1ZimVAC is a Zimbabwe Vulnerability Assessment Committee that does yearly crop and livestock assessment in the country and feeds the information to government and other stakeholders as an early warning system.
5
Extension, 2008). Most farmers lack the requisite knowledge and skills to manage their
farming activities as commercial enterprises. The situation is exacerbated by the high
extension worker farmer ratio which stands at 1:600. Most of the extension personnel have
left the department due to poor remuneration, and those still hanging on are demotivated and
lack basic support to carry out their duties such as relevant equipment and transport (WFP-
Plan, 2009).
Because of the recurring drought over the years compounded by other limiting factors of
production, most households have become food insecure and most vulnerable cases are
found among women, elderly persons and child headed and/or with chronically ill person
(WFP-Plan, 2009). These households have depended on food aid from World Food Program
(WFP). In 2008/9 farming season WFP through Plan International2 provided food aid to an
average of 125,000 beneficiaries per month (WFP-Plan, 2009) so as to avert hunger and
starvation among the most vulnerable group in a district with an estimated population of
250,000 people (CSO, 2002).Thus, to make a living in semi−arid environments, farmers have
to respond to a huge range of spatial and temporal variability. Variability includes diverse
landscapes, from hillsides to river-banks, a range of soil types and different rainfall
conditions, including drought. The ability to respond to variability3 varies between farmers.
Those with access to external sources of income, like remittances, may be less reliant on
agricultural production than others (Dercon, 2002). Those who own or have preferential
access to draft power or other inputs like labour or fertiliser are able to farm more flexibly.
Those who are constrained to take up other income opportunities due to entry barriers,
mostly depend on local institutions for support (Mombeshora et. al., 1995).
Official perceptions of ‘drought victims’ usually underestimate their resources and resources
fullness. Perhaps this is due to the fact that indicators of vulnerability based on the
measurement of resources are more easily recognizable by outside institutions. However,
people in adverse conditions develop strategies to cope; strategies which remain unnoticed
and understudied. Without a proper understanding of the coping strategies, policy makers
are most likely to make stereotyped responses in both the preventive measures of
vulnerability reduction and relief work. Misdirected relief efforts may undermine rather than
assist the affected communities in their attempts to help themselves towards recovery
(Holoway, 2003; DFID, 2006).
2 Plan International- an international Non- Governmental Organization cooperating with WFP in food aid distribution in Mutasa district 3 Variability- Is the extent to which data points in a data set diverge from the average or mean value
6
1.4 Research objective The purpose of the project was to review the coping strategies of the Mutasa community
towards drought, and assess the capacity of local institutions in dealing with drought.
1.4.1 Sub objectives
§ To identify and assess coping mechanisms in place by individual households and
the community.
§ To identify local institutions involved in drought mitigation.
§ To assess how local institutions have responded to disaster risk reduction.
§ To review the capacity of local institutions involved in risk reduction.
1.5 Justification of the study Despite the community’s exposure and experience with drought that has become a common
phenomenon in the district, by and large, many households have remained vulnerable to
subsequent droughts. A lot of work on crop and livestock assessments has been extensively
covered by ZimVAC from 2002-2009 (ZimVAC, 2009), FEWSNET4 (2008) and FAO5 (2010).
These have been partly government and produced controversial results. In addition,
vulnerability, coping strategies of the community and capacity of institutions involved in
drought mitigation have only been mentioned in passing. The scope of this work is different
from these studies as it attempts to focus in detail on the coping strategies employed by
households/communities as well as capacity and challenges facing local institutions to
strengthen the ability of communities, households and individuals to be more resilient to
drought.
Once the study is done, it can be used repeatedly over a number of years until significant
changes in the underlying economy render them invalid. It suggests that outside agencies
must understand the coping strategies, otherwise external humanitarian interventions will
undermine them, creating aid dependency and all manner of unintended and detrimental
outcomes. Rural economies in developing countries tend not to change all that rapidly,
however, and a good household/community baseline will generally be valid for three to ten
years (Holzmann & Bouddreau, 2008). What varies is the prevailing level of food security, but
this is a function of variations in hazard, not variations in the baseline. Put another way, the
4 FEWSNET – a Famine Early Warning System Network 5 FAO- the United Nations Food and Agricultural Organization
7
level of maize production may vary from year to year (hazard), but the underlying pattern of
agricultural production does not (the baseline) (Holzmann & Bouddreau, 2008).
1.6 Hypothesis Owing to prevalence of drought in rural Mutasa, the community has developed coping
strategies, and there are institutions that assist the community to mitigate drought impact.
1.7 Delimitations of the study The research only focused on Mutasa district and only zeroed in on coping strategies applied
from year 2000 up to 2011 and institutional capacity during the same period.
1.8 Limitations of the study The study results may not be applicable outside the district of Mutasa since coping strategies
may be area specific. In addition, due to time and financial resources, only a small sample of
the population was interviewed. Equally, the results gathered as coping strategies and
capacity of the institutions may change from time to time since these are dynamic variables.
The researcher also worked for Plan International, an INGO that distributed food aid in the
area thus there was the risk that respondents may had exaggerated the situation on ground
linking the research to other baseline surveys done by Plan International yearly, prior to food
aid distribution in the district. The most vulnerable in the community had normally been given
priority regarding relief.
1.9 Thesis outline
This thesis is divided into seven chapters. Chapter 1 outlines the problem statement,
formulated study objectives and gives definitions and impact of drought. Chapter 2 mainly
gives an oversight of the study area in terms of location and climatic conditions. It further
details the methodology used to gather and analyze data to meet the study objectives.
Chapter 3 forms the bulk of literate on drought coping mechanisms, drought management by
Southern African countries, drought plans and challenges of drought management in SADC
countries. Chapter 4 is dedicated to the legal framework guiding disaster management in
Zimbabwe, and also reviews literature on drought coping strategies commonly employed by
households and communities in dealing with drought. Results of the study are detailed in
Chapter 5 and presented in the form of graphs, tables and other charts. Discussion of the
results constitutes Chapter 6 while conclusion and recommendations for areas that need
further research are drawn in Chapter 7.
1.10 Conclusion Drought is considered by many to be the most complex, but least understood of all natural
hazards, affecting more people than any other hazard. It is a normal recurring feature of
8
climate and occurs in virtually all climatic regions. Drought is the consequence of a natural
reduction in the amount of precipitation received over an extended period of time, but other
climatic factors such as high temperature and wind can significantly aggravate the severity of
the event. It has adverse social, economic and environmental impact that can lead to overall
reduction in GDP, food security and water sources.
Indeed, drought is a problem as revealed by the study. However, as per the study hypothesis
which has been proven correct by the research, the community has developed coping
strategies, and there are institutions that assist the community to mitigate drought impact
though with challenges.
The next chapter describes the study area and methodology.
9
CHAPTER 2: STUDY AREA AND RESEARCH METHODOLOGY
2.1. Introduction This chapter begins with the description of the study area, that is, location, climate, soil types
and an overview of the district where the study was conducted is outlined. The last section of
this chapter unpacks the methodologies employed for both qualitative and quantitative data
and the statistical analyses used.
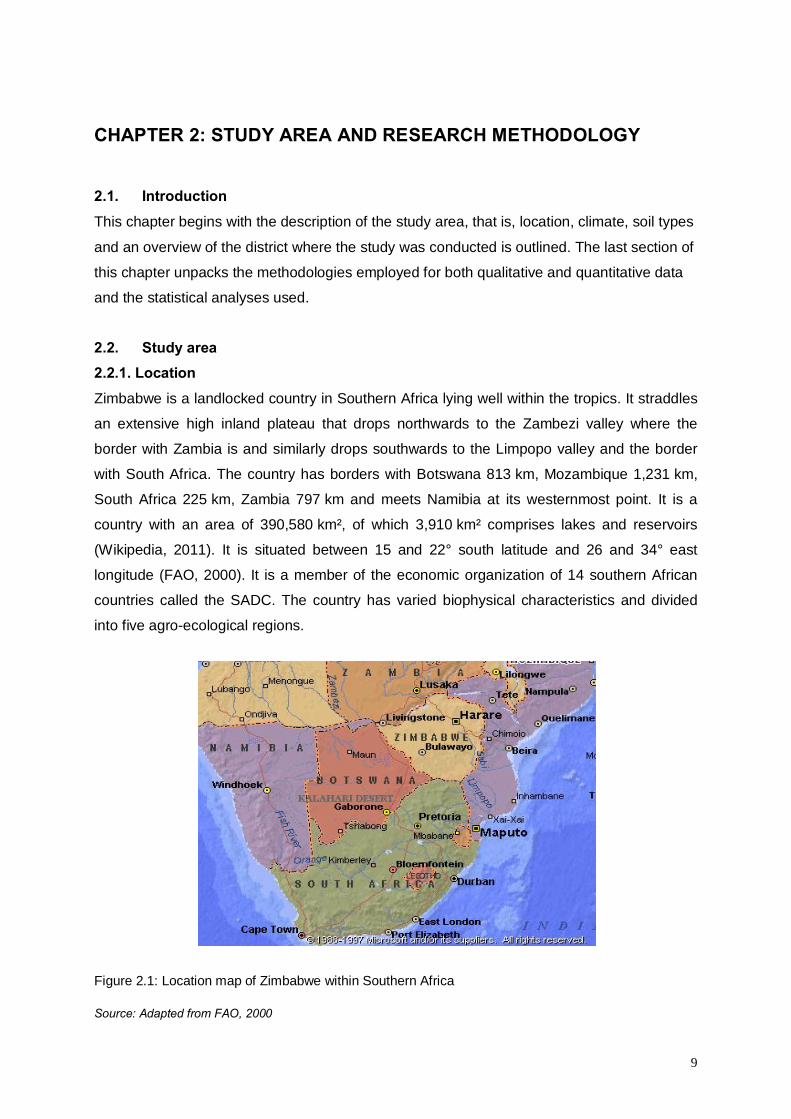
2.2. Study area 2.2.1. Location Zimbabwe is a landlocked country in Southern Africa lying well within the tropics. It straddles
an extensive high inland plateau that drops northwards to the Zambezi valley where the
border with Zambia is and similarly drops southwards to the Limpopo valley and the border
with South Africa. The country has borders with Botswana 813 km, Mozambique 1,231 km,
South Africa 225 km, Zambia 797 km and meets Namibia at its westernmost point. It is a
country with an area of 390,580 km², of which 3,910 km² comprises lakes and reservoirs
(Wikipedia, 2011). It is situated between 15 and 22° south latitude and 26 and 34° east
longitude (FAO, 2000). It is a member of the economic organization of 14 southern African
countries called the SADC. The country has varied biophysical characteristics and divided
into five agro-ecological regions.
Figure 2.1: Location map of Zimbabwe within Southern Africa
Source: Adapted from FAO, 2000
10
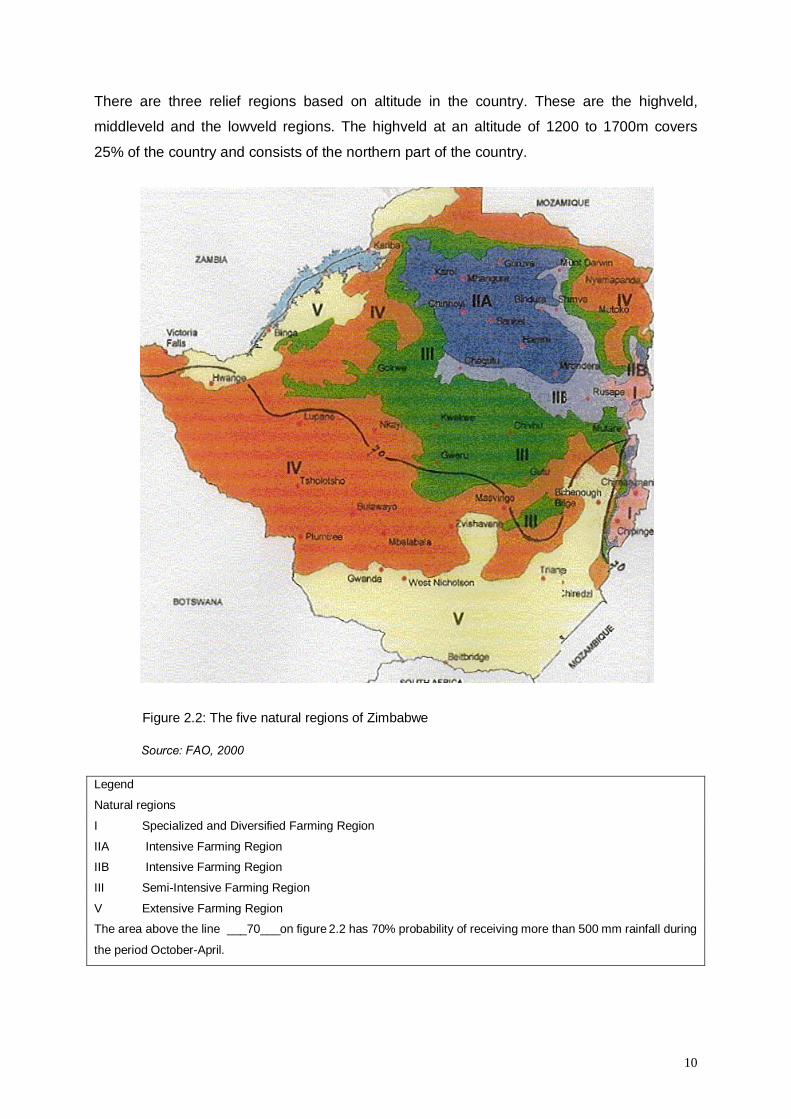
There are three relief regions based on altitude in the country. These are the highveld,
middleveld and the lowveld regions. The highveld at an altitude of 1200 to 1700m covers
25% of the country and consists of the northern part of the country.
Figure 2.2: The five natural regions of Zimbabwe
Source: FAO, 2000
Legend
Natural regions
I Specialized and Diversified Farming Region
IIA Intensive Farming Region
IIB Intensive Farming Region
III Semi-Intensive Farming Region
V Extensive Farming Region
The area above the line ___70___on figure 2.2 has 70% probability of receiving more than 500 mm rainfall during
the period October-April.
11
The middleveld ranges from 900 to 1200m covering almost 40% of the central part of the
country and 35% of the country that is below 900m and covering mostly the southern part of
the country constitutes the lowveld area. Altitude and relief greatly influence the country’s
climate (Dube, 2008).
2.2.2. Climate
The country has been divided into five broad natural regions (NRs) in which the dominant
partitioning factor is rainfall (Figure 2.1).
Climatic conditions are largely sub-tropical with one rainy season, between November and
March. The rainy season is typically a time of heavy rainfall from November to March. The
whole country is influenced by the Intertropical Convergence Zone during January. In years
when it is poorly defined, then there is below average rainfall and a likelihood of serious
drought in the country (as happened in 1983 and 1992). When it is well-defined then rainfall
is average or well above average, as in 1981 and 1985. Only 37% of the country receives
rainfall considered adequate for agriculture (Table 2.1) so rainfall is considered the most
limiting factor in agriculture (FAO, 2000; Wikipedia, 2011). The reliability of rainfall decreases
from north to south and from east to west. Variability ranges from 20% in the north to 45% in
the south. The major important feature in Zimbabwe’s climate is the erratic rainfall pattern
that has led to recurrent droughts (Dube, 2008).
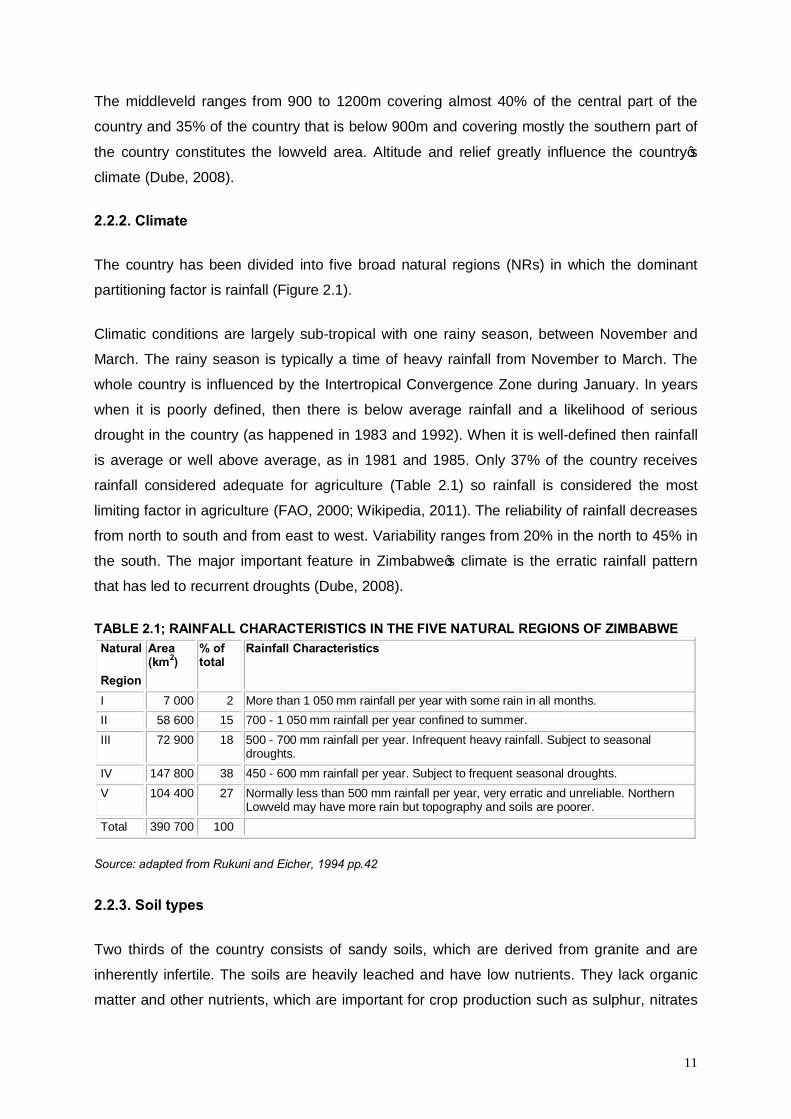
TABLE 2.1; RAINFALL CHARACTERISTICS IN THE FIVE NATURAL REGIONS OF ZIMBABWE Natural
Region
Area (km2)
% of total
Rainfall Characteristics
I 7 000 2 More than 1 050 mm rainfall per year with some rain in all months. II 58 600 15 700 - 1 050 mm rainfall per year confined to summer. III 72 900 18 500 - 700 mm rainfall per year. Infrequent heavy rainfall. Subject to seasonal
droughts. IV 147 800 38 450 - 600 mm rainfall per year. Subject to frequent seasonal droughts. V 104 400 27 Normally less than 500 mm rainfall per year, very erratic and unreliable. Northern
Lowveld may have more rain but topography and soils are poorer. Total 390 700 100
Source: adapted from Rukuni and Eicher, 1994 pp.42
2.2.3. Soil types
Two thirds of the country consists of sandy soils, which are derived from granite and are
inherently infertile. The soils are heavily leached and have low nutrients. They lack organic
matter and other nutrients, which are important for crop production such as sulphur, nitrates
12
and phosphates. Fertile basaltic soils are predominantly in the low veld where potential for
crop production is high under irrigation. The high veld is mostly dominated by heavy clayey
soils (Dube, 2008). Soils, to a certain extent, give variation to the vegetation type. The
biophysical characteristics such as rainfall, relief, soil and vegetation constitute the five agro-
ecological zones for which different farming practices take place.
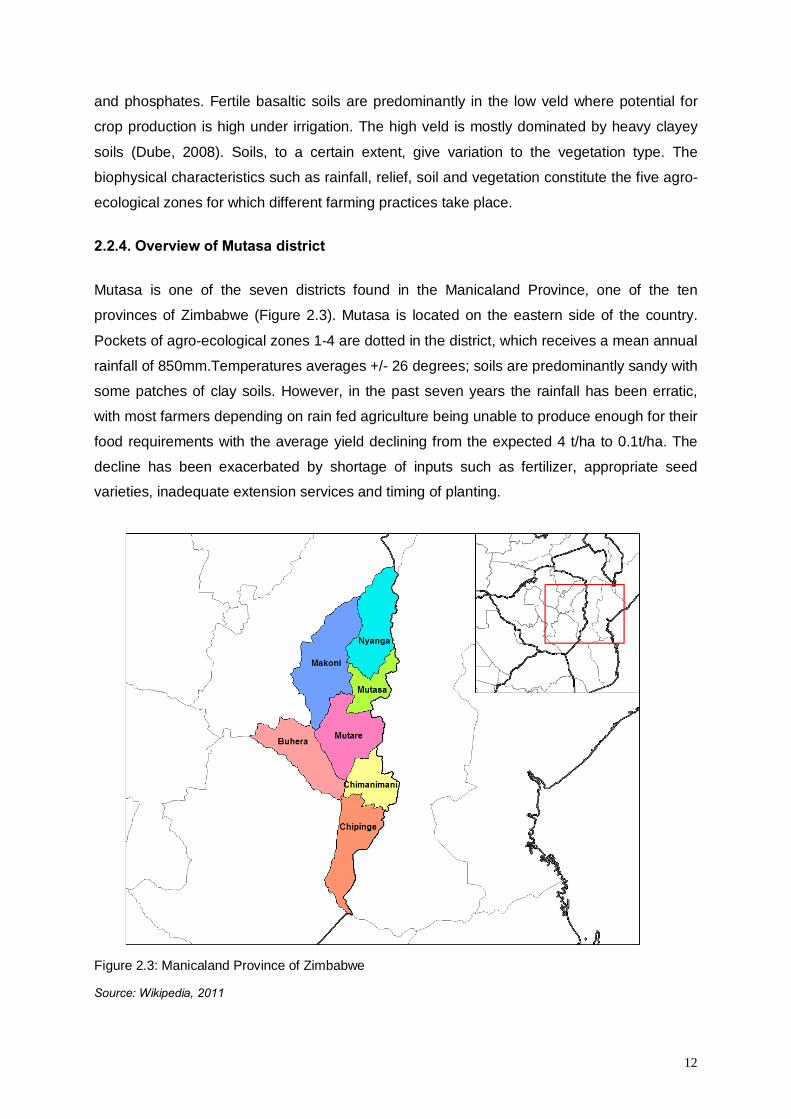
2.2.4. Overview of Mutasa district
Mutasa is one of the seven districts found in the Manicaland Province, one of the ten
provinces of Zimbabwe (Figure 2.3). Mutasa is located on the eastern side of the country.
Pockets of agro-ecological zones 1-4 are dotted in the district, which receives a mean annual
rainfall of 850mm.Temperatures averages +/- 26 degrees; soils are predominantly sandy with
some patches of clay soils. However, in the past seven years the rainfall has been erratic,
with most farmers depending on rain fed agriculture being unable to produce enough for their
food requirements with the average yield declining from the expected 4 t/ha to 0.1t/ha. The
decline has been exacerbated by shortage of inputs such as fertilizer, appropriate seed
varieties, inadequate extension services and timing of planting.
Figure 2.3: Manicaland Province of Zimbabwe
Source: Wikipedia, 2011
13
In addition, the devastating effects of HIV/AIDS estimated at 15.5% and the continuous rural
- urban migration or border jumping to neighbouring countries such as Mozambique and
South Africa in search of opportunities among the productive age group poses a challenge to
food production. The majority of communal farmers have also lost drought power and the
high cost of inputs, and unavailability of inputs have further compounded the challenges rural
households face to acquire the necessary inputs they need to realise better yields
(Agricultural Technical & Extension, 2008). Most farmers lack the requisite knowledge and
skills to manage their farming activities as commercial enterprises. The situation is
exacerbated by the high extension worker/farmer ratio, which stands at 1:600. Most of the
extension personnel have left the department due to poor remuneration and those still
hanging on are demotivated, and lack basic support to carry out their duties such as relevant
equipment and transport (WFP-Plan, 2009).
Because of the recurring drought over the years compounded by other limiting factors of
production, most households have become food insecure and most vulnerable cases are
found among women, elderly persons and child headed households and/or with chronically ill
persons. These households have depended on food aid from World Food Program (WFP). In
2008/9 farming season WFP through Plan International6 provided food aid to an average of
125,000 beneficiaries per month (WFP-Plan , 2009) so as to avert hunger and starvation
among the most vulnerable groups in a district that has a population of 250,000 people
(CSO, 2002 ).
2.3. Methodology 2.3.1. Tools
This study employed a participatory approach to capture both quantitative and qualitative
data on the coping strategies of the community, households, individuals and institutional
capacity within a given rural ward through the eyes and experiences of individuals,
households and district level key informants. A desk review of existing data was conducted
prior to field data collection to help the researcher appreciate how the community would
normally conduct itself in adversity. Such reviews helped guide the direction of primary
research and for cross-checking information collected in the field (Holzmann & Boudreau,
2008). Two questionnaires were designed and administered to the community. The first
questionnaire was administered in a close-ended format to individuals in the community and
the second one of an open-ended format for district level key informant interviews (KII). A
third guide was designed and used in focus group discussions (FGDs) at community level.
6 Plan International- an international Non- Governmental Organization cooperating with WFP in food aid distribution in Mutasa district
14
2.3.2. Statement of Consent
For ethical research principles for all household questionnaires, a statement of consent was
made with each interviewee that reads as follows:
We are conducting interviews with households in the area in order to understand more
about the coping strategies and capacity of institutions with regards to drought in the
district. Information collected from interviews will be confidential and no names of people
interviewed will be used. Household information will be kept confidential. Please note that
there is no benefit or incentive being given to participating in the interview now or in the
future. You are free to decline to be interviewed, if you wish, or to decline to answer
particular questions if you wish.
2.3.3. Sampling framework
The primary data constituted structured questionnaires that were administered at household
level through interviews, community level by FGDs and KII.
Mutasa district, with a total of thirty-one (31) wards was zoned7 into three regions/livelihood
zones. Each ward has an average of eight villages. Each village has an average of 150
households (Census, 2002). A stratified random sampling method was employed. In each of
the three livelihood zones, three wards were randomly selected. In each of the three wards,
four villages were randomly selected and in each of the selected villages five households
were interviewed using the closed-ended questionnaire. Sampling of households was
through random stratified sampling at village level. This then translated to a total sample size
of 180 households interviewed in the district. While ten per cent of the number of households
could be ideal to give a fair and balanced sample, the researcher was limited by inadequate
funding for a very big exercise. However, the chosen sample size still gave a representative
insight into the required information. One FDG was conducted per ward and an average of
25-30 individuals would constitute this group. Therefore a total of 9 FDGs were conducted in
the district.
Institutions involved in drought mitigation and response (KI- key informants) were each
interviewed using the open-ended questionnaire. These KI included the MRDC, the DA’s
office, GMB, department of social welfare, Agricultural Technical & Extension Services
(AGRITEX), DLVS, local NGOs, CBOs, VS&L groups, burial societies, religious leaders,
Chiefs and village heads. The same institutions also constituted the District Drought Relief
Committee (DDRC). At household and village level, information gathered included:
7Livelihood zoning – a delineation of areas within which people share broadly the same patterns of livelihood
15
- demographics
- vulnerable groups, individuals
- rainfall pattern
- agricultural production,
- market and economic trends
- food availability
- sources of food
- household sources of income
- sources of expenditure
- status of stock and status of capital and assets
- coping strategies/mechanisms
- constraints faced by households/communities to use these strategies
- level of preparedness by individuals
- livelihoods
- Institutions involved in drought mitigation and response.
At key informant and institutional level information gathered included:
- their view of the drought phenomenon
- their mandate with regards to drought
- programs in place (current)
- programs applied (previously)
- capacity
- limitations
- the level of participation of communities of Mutasa
- recommendations.
2.3.4. Data collection
Data collectors (four enumerators) were trained for one day on the methodologies and
techniques of data collection in rural context. Simulations were carried out as the basis to
ensure that approaches and questionnaires were evenly understood in the team. The
objective of training and simulations was to reach homogeneous data collection in order to
guarantee the reliability of the collected information. Guidelines and questionnaires were
then tested and validated at team level before the actual data collection exercise. The main
data collection tools included the household questionnaire, key informant interviews, FDGs
and past records on research/surveys in the related field of study.
16
2.3.5. Pre-testing of tools In order to check the correctness of the questions and to find out if the subjects had the
same understanding of the questions pre-testing of the tools was done. This exercise was of
importance in adapting the questions to local cultural settings, thus minimising the risk of
conveying ambiguous questions and eliciting inaccurate responses from the local population.
Ten men from one ward outside the sampled areas were involved in the pretesting, and
afterwards some changes were made in the instruments.
2.3.6. Data analysis 2.3.6.1. Quantitative data Before entering data in the computer, completed questionnaires were checked daily for
errors such as inconsistencies in data filling, data entry and completeness of the data. Every
evening, the data collecting team would meet for ± 60 minutes daily to discuss data gathered
and trends. That was critical as it enabled the team to reflect on the various aspects of the
programme and iron out challenges to make adjustments where possible. Only a few
questionnaires were spoilt and these were not further considered for this research. Data
analysis was done using SPSS8 version 18. Descriptive statistics, charts, graphs and
frequency tables were produced, then interpretation and presented in Chapter 5.
2.3.6.2. Qualitative data Analysis of qualitative data from semi-structured interviews from key informants and focused
group discussions included ordering of emerging issues in the interviews and making
summaries. Sorting and ordering of responses from semi-structured interviews were done
manually and grouped into thematic areas.
2.4 Conclusion
The major important feature in Zimbabwe’s climate is the erratic rainfall pattern that has led
to recurrent droughts. The country has been divided into five broad Natural Regions (NRs) in
which the dominant partitioning factor is rainfall. Climatic conditions are largely sub-tropical
with one rainy season, between November and March. Two thirds of the country consists of
sandy soils, which are derived from granite and are inherently infertile. The soils are heavily
leached and have low nutrients. All these factors increase the severity of drought.
8 A statistical package for social scientists.
17
A participatory approach was used to gather both qualitative and quantitative data using both
closed and open ended questionnaires. A desk review was employed for literature review for
purposes of data triangulation and an SPSS version 18 package was used for data analyses.
The next chapter reviews drought management in SADC countries, challenges on policies
and some countries that have advanced mechanisms to manage drought are discussed as
successful models.
18
CHAPTER 3: DROUGHT LITERATURE STUDY
3.1 Introduction This chapter reviews drought management in Southern Africa. A 10-step drought plan is
discussed and unpacked in detail as a planning tool that can be applied to all countries that
are drought prone. While it is noted that most countries in the SADC region have not
developed permanent institutional capacity, Botswana has a robust integrated drought early
warning system herein outlined.
3.2 Southern Africa Drought is a chronic problem in sub-Saharan Africa and the most important factor affecting
livelihoods of the people in the region (Hagman, 1984; Sear, Campbell, Dambe & Slade,
1999; Wilhite et al., 2000). Yet, the drought risk reduction concept is not at the core of
disaster management in most countries of Africa (Dube, 2008). Disaster reduction efforts in
Africa have followed a somewhat different course than those in other continents. In Southern
Africa, and perhaps more widely across Africa, the field of disaster reduction has never
explicitly achieved the same policy stature or secured levels of financial commitment
comparable to those seen in Asia or Latin America (Holloway, 2003). This is not only due to
the nature of Africa’s disaster risk profile, which has differed from that reflected in other
continents. It is also explained by the character of international assistance that has tended to
be prolonged aid for refugees/displaced populations or highly visible food and other
humanitarian assistance in times of drought and famine (Holloway, 2003).
In part it also reflects the political priorities of Africa’s emerging democracies. In Southern
Africa specifically, issues concerning development and national security have been
historically associated with struggles for independence and freedom from political, military
and other forms of oppression. These preoccupations, rather than concerns for threats
triggered by nature, have dominated national and regional security agendas. Even today,
despite some progress in favour of democratic governance across southern Africa, actual
and potential internal conflict is perceived as and remains the primary threat to national
security in several countries (Holloway, 2003).
Despite the limited profile given to disaster management in the region, the protection of
national and regional food security was an early strategic priority for the Southern African
Development Coordination Conference (SADCC), SADC’s predecessor (Wilhite et al., 2000;
UNISDR, 2002). This was reflected in the establishment of a Regional Early Warning Unit
19
(REWU) in the then SADCC Food Security Technical Advisory Unit based in Harare (Wilhite
et al., 2000; Holloway, 2003). The REWU built capacity to monitor and consolidate data on
regional food security for each growing season.
During 1997 UNSO compiled a disaster management report on southern Africa countries
namely; Angola, Botswana, Lesotho, Malawi, Mauritius, Mozambique, Namibia, South Africa,
Swaziland, Zambia and Zimbabwe in order to establish the status of drought preparedness,
primary drought policy and planning needs and lastly constraints that exist with regards to
drought policy and plan development. The study was evaluated from the perspective of the
three critical components of a drought plan:
• Monitoring and early warning
• Vulnerability and impact assessment
• Mitigation and response (Wilhite, 2002).
Results indicated a wide range of institutional capacity to respond to drought emergences in
Southern Africa. Wilhite, Hays & Knutson (2005) reported that although some countries have
detailed organizational structures in place to coordinate the actions of government at various
levels, as well as those of partners, such as donors and NGOs, most of the countries have
not developed a permanent institutional capacity. The common problem with drought and
other natural hazards is maintaining interest in planning beyond the relatively short window of
opportunity that follows the event. Interest in drought planning quickly wanes in the post
drought period when precipitation conditions have returned to normal or above normal levels.
Drought response is coordinated through natural disaster authorities; a case in point is
Lesotho, Zambia and Zimbabwe. Drought relief is directed at human relief and no post-
response and recovery evaluation are undertaken, hence opportunities to learn from the past
are lost (Wilhite, 2002; NDMC, 2007). On a positive note, however, drought and famine early
warning systems commonly exist despite the obsolete equipment and poor meteorological
networks used; vulnerability of elements at risk are often carried out and economic
diversification as a risk mitigation measure is evident (The International Famine Centre,
2002; DNMC 2011).
The International Famine Centre (2002) further indicates that no drought plans existed in
Angola, Lesotho, Malawi, Maritius, Mozambique, Namibia, Swaziland, Zambia and
Zimbabwe. Some infrastructure does exist in most countries to respond to drought
conditions, but on a reactive or crisis management basis. However, Botswana and South
Africa clearly stand apart from other countries in terms of their experiences and prevailing
20
status in drought planning (Wilhite, Hays & Knutson, 2005; UNISDR, 2002). Drought
planning in Botswana is part of development planning and institutional structure is well
defined. In South Africa, an inclusive forum with all major players is in place and has led a
shift from exclusive emphasis on commercial farmers to include communal poor farmers and
farm workers (Wilhite, 2002).
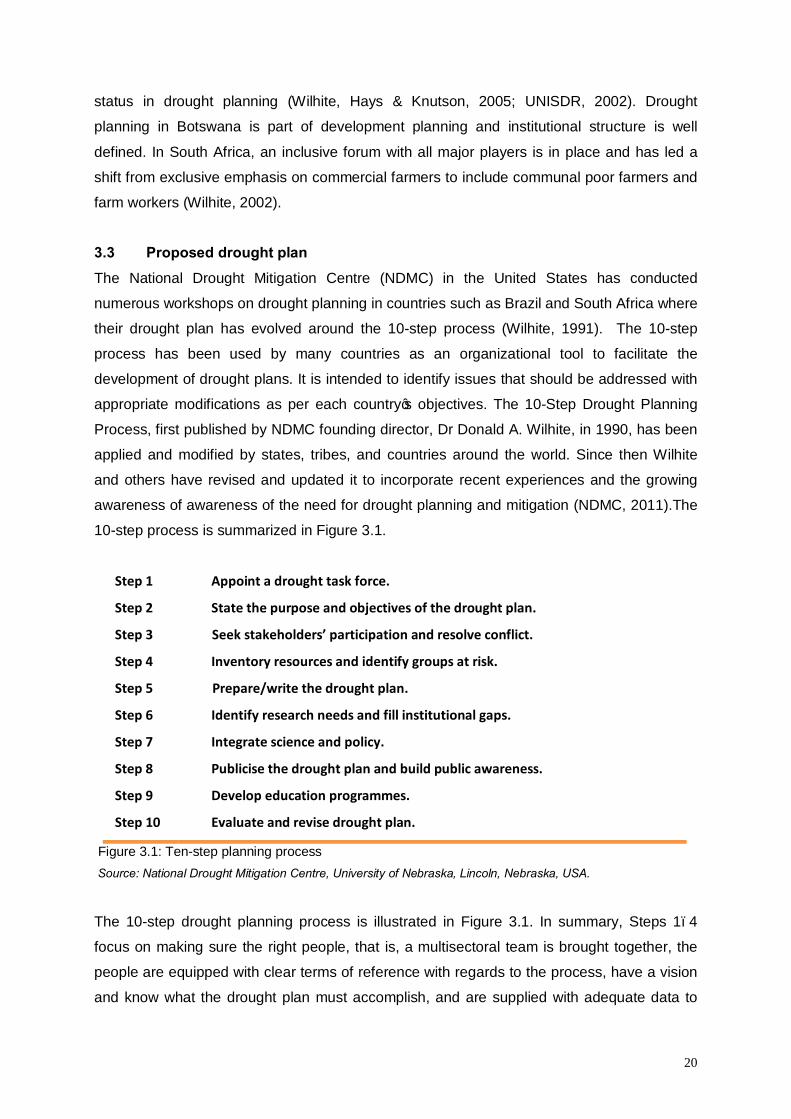
3.3 Proposed drought plan The National Drought Mitigation Centre (NDMC) in the United States has conducted
numerous workshops on drought planning in countries such as Brazil and South Africa where
their drought plan has evolved around the 10-step process (Wilhite, 1991). The 10-step
process has been used by many countries as an organizational tool to facilitate the
development of drought plans. It is intended to identify issues that should be addressed with
appropriate modifications as per each country’s objectives. The 10-Step Drought Planning
Process, first published by NDMC founding director, Dr Donald A. Wilhite, in 1990, has been
applied and modified by states, tribes, and countries around the world. Since then Wilhite
and others have revised and updated it to incorporate recent experiences and the growing
awareness of awareness of the need for drought planning and mitigation (NDMC, 2011).The
10-step process is summarized in Figure 3.1.
Step 1
Step 2
Step 3
Step 4
Step 5
Step 6
Step 7
Step 8
Step 9
Step 10
Appoint a drought task force.
State the purpose and objectives of the drought plan.
Seek stakeholders’ participation and resolve conflict.
Inventory resources and identify groups at risk.
Prepare/write the drought plan.
Identify research needs and fill institutional gaps.
Integrate science and policy.
Publicise the drought plan and build public awareness.
Develop education programmes.
Evaluate and revise drought plan.
Figure 3.1: Ten-step planning process Source: National Drought Mitigation Centre, University of Nebraska, Lincoln, Nebraska, USA.
The 10-step drought planning process is illustrated in Figure 3.1. In summary, Steps 1–4
focus on making sure the right people, that is, a multisectoral team is brought together, the
people are equipped with clear terms of reference with regards to the process, have a vision
and know what the drought plan must accomplish, and are supplied with adequate data to
21
make fair and equitable decisions when formulating and writing the actual drought plan
(Wilhite et al., 2000; Wilhite, Hayes & Knutson, 2005; NDMC, 2011). Step 5 involves the
process of developing an organizational structure set for the specific task necessary to
prepare the plan and the plan, which should be treated as a process, rather than a discrete
event that produces a static document. A risk assessment is undertaken in conjunction with
this step in order to construct a vulnerability profile for key economic sectors, population
groups, regions, and communities (Wilhite et al., 2000; Wilhite, Hayes & Knutson, 2005;
NDMC, 2011). Steps 6 and 7 describe the need for ongoing research and coordination
between scientists and policy makers. Steps 8 and 9 detail the importance of promoting and
testing the plan before drought occurs. Finally, Step 10 stresses the need of revising the plan
to keep it current and evaluating its effectiveness in the post drought period. Although the
steps are sequential, many of these tasks are addressed simultaneously under the
leadership of a drought task force and its complement of committees (Sear, et al., 1999;
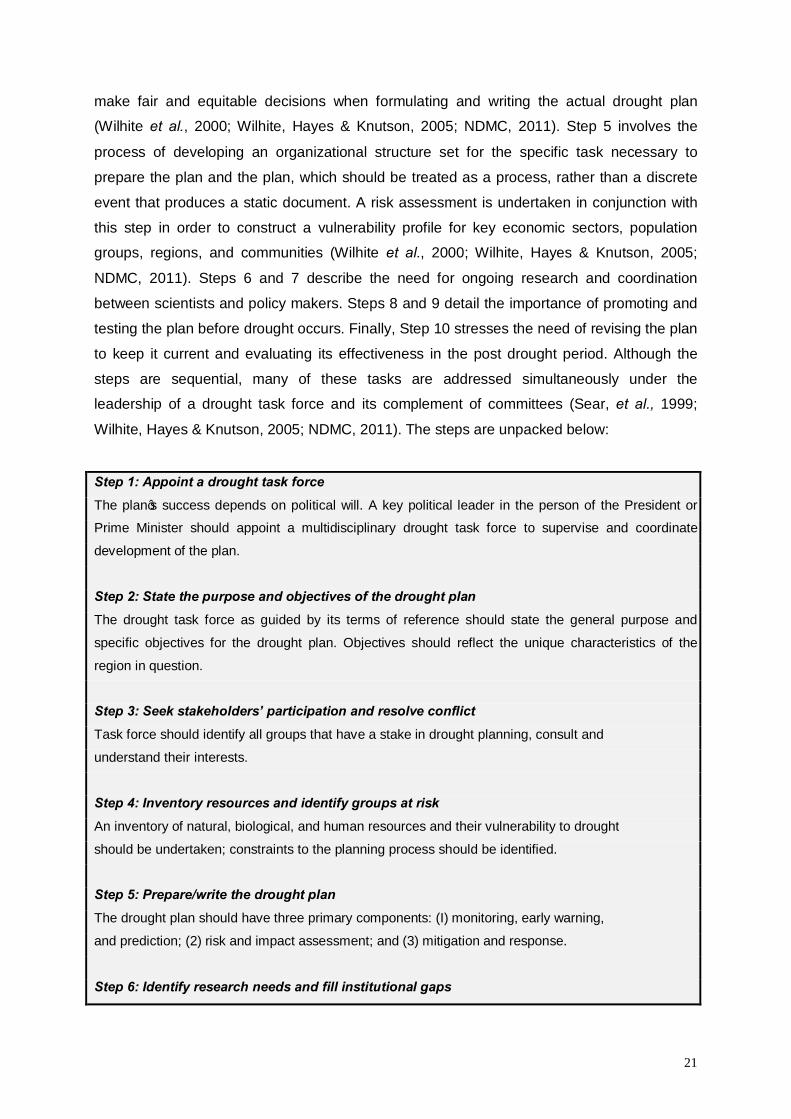
Wilhite, Hayes & Knutson, 2005; NDMC, 2011). The steps are unpacked below:
Step 1: Appoint a drought task force The plan’s success depends on political will. A key political leader in the person of the President or
Prime Minister should appoint a multidisciplinary drought task force to supervise and coordinate
development of the plan.
Step 2: State the purpose and objectives of the drought plan The drought task force as guided by its terms of reference should state the general purpose and
specific objectives for the drought plan. Objectives should reflect the unique characteristics of the
region in question.
Step 3: Seek stakeholders’ participation and resolve conflict Task force should identify all groups that have a stake in drought planning, consult and
understand their interests.
Step 4: Inventory resources and identify groups at risk An inventory of natural, biological, and human resources and their vulnerability to drought
should be undertaken; constraints to the planning process should be identified.
Step 5: Prepare/write the drought plan The drought plan should have three primary components: (I) monitoring, early warning,
and prediction; (2) risk and impact assessment; and (3) mitigation and response.
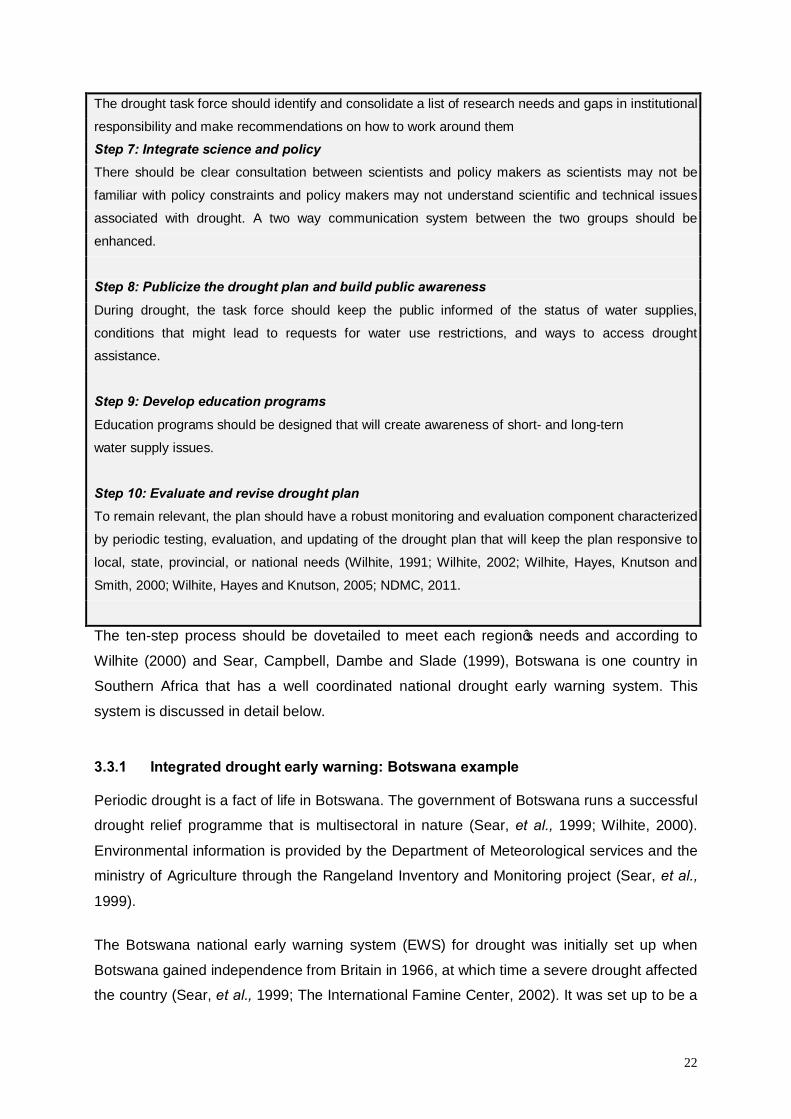
Step 6: Identify research needs and fill institutional gaps
22
The drought task force should identify and consolidate a list of research needs and gaps in institutional
responsibility and make recommendations on how to work around them
Step 7: Integrate science and policy There should be clear consultation between scientists and policy makers as scientists may not be
familiar with policy constraints and policy makers may not understand scientific and technical issues
associated with drought. A two way communication system between the two groups should be
enhanced.
Step 8: Publicize the drought plan and build public awareness During drought, the task force should keep the public informed of the status of water supplies,
conditions that might lead to requests for water use restrictions, and ways to access drought
assistance.
Step 9: Develop education programs Education programs should be designed that will create awareness of short- and long-tern
water supply issues.
Step 10: Evaluate and revise drought plan To remain relevant, the plan should have a robust monitoring and evaluation component characterized
by periodic testing, evaluation, and updating of the drought plan that will keep the plan responsive to
local, state, provincial, or national needs (Wilhite, 1991; Wilhite, 2002; Wilhite, Hayes, Knutson and
Smith, 2000; Wilhite, Hayes and Knutson, 2005; NDMC, 2011.
The ten-step process should be dovetailed to meet each region’s needs and according to
Wilhite (2000) and Sear, Campbell, Dambe and Slade (1999), Botswana is one country in
Southern Africa that has a well coordinated national drought early warning system. This
system is discussed in detail below.
3.3.1 Integrated drought early warning: Botswana example
Periodic drought is a fact of life in Botswana. The government of Botswana runs a successful
drought relief programme that is multisectoral in nature (Sear, et al., 1999; Wilhite, 2000).
Environmental information is provided by the Department of Meteorological services and the
ministry of Agriculture through the Rangeland Inventory and Monitoring project (Sear, et al.,
1999).
The Botswana national early warning system (EWS) for drought was initially set up when
Botswana gained independence from Britain in 1966, at which time a severe drought affected
the country (Sear, et al., 1999; The International Famine Center, 2002). It was set up to be a
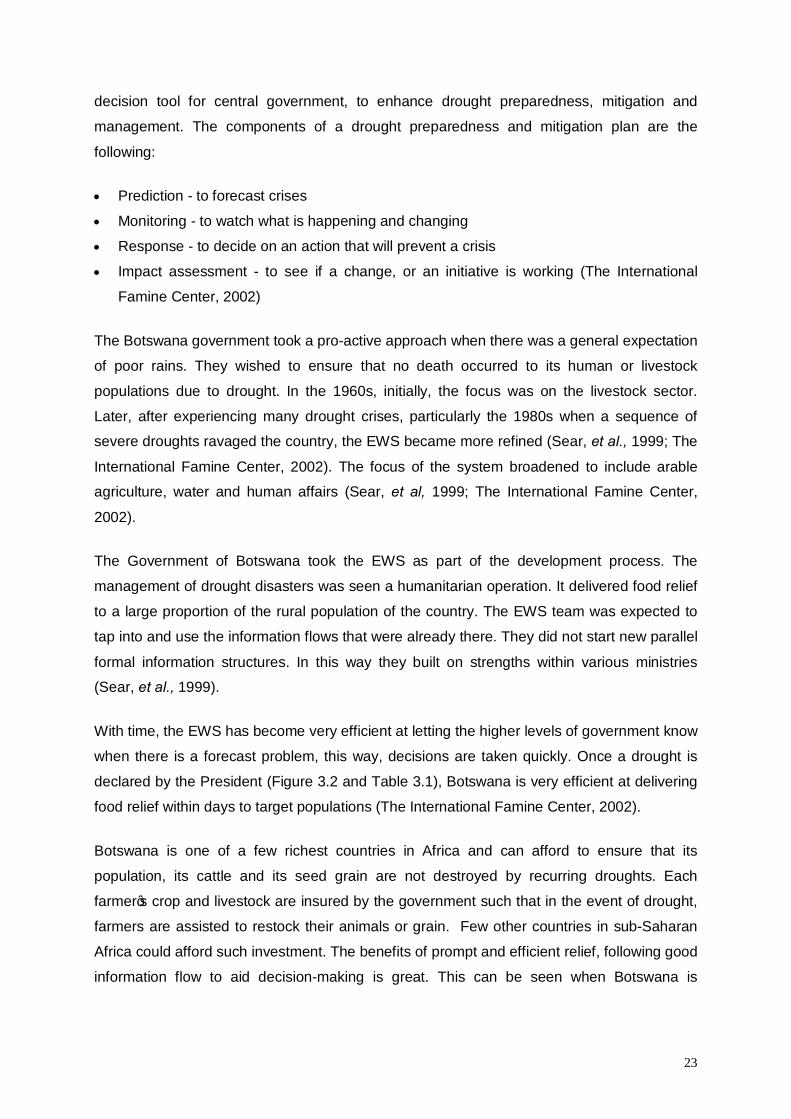
23
decision tool for central government, to enhance drought preparedness, mitigation and
management. The components of a drought preparedness and mitigation plan are the
following:
• Prediction - to forecast crises
• Monitoring - to watch what is happening and changing
• Response - to decide on an action that will prevent a crisis
• Impact assessment - to see if a change, or an initiative is working (The International
Famine Center, 2002)
The Botswana government took a pro-active approach when there was a general expectation
of poor rains. They wished to ensure that no death occurred to its human or livestock
populations due to drought. In the 1960s, initially, the focus was on the livestock sector.
Later, after experiencing many drought crises, particularly the 1980s when a sequence of
severe droughts ravaged the country, the EWS became more refined (Sear, et al., 1999; The
International Famine Center, 2002). The focus of the system broadened to include arable
agriculture, water and human affairs (Sear, et al, 1999; The International Famine Center,
2002).
The Government of Botswana took the EWS as part of the development process. The
management of drought disasters was seen a humanitarian operation. It delivered food relief
to a large proportion of the rural population of the country. The EWS team was expected to
tap into and use the information flows that were already there. They did not start new parallel
formal information structures. In this way they built on strengths within various ministries
(Sear, et al., 1999).
With time, the EWS has become very efficient at letting the higher levels of government know
when there is a forecast problem, this way, decisions are taken quickly. Once a drought is
declared by the President (Figure 3.2 and Table 3.1), Botswana is very efficient at delivering
food relief within days to target populations (The International Famine Center, 2002).
Botswana is one of a few richest countries in Africa and can afford to ensure that its
population, its cattle and its seed grain are not destroyed by recurring droughts. Each
farmer’s crop and livestock are insured by the government such that in the event of drought,
farmers are assisted to restock their animals or grain. Few other countries in sub-Saharan
Africa could afford such investment. The benefits of prompt and efficient relief, following good
information flow to aid decision-making is great. This can be seen when Botswana is
24
compared with other drought-prone sub-Saharan African countries (Sear, et al., 1999; The
International Famine Centre, 2002).
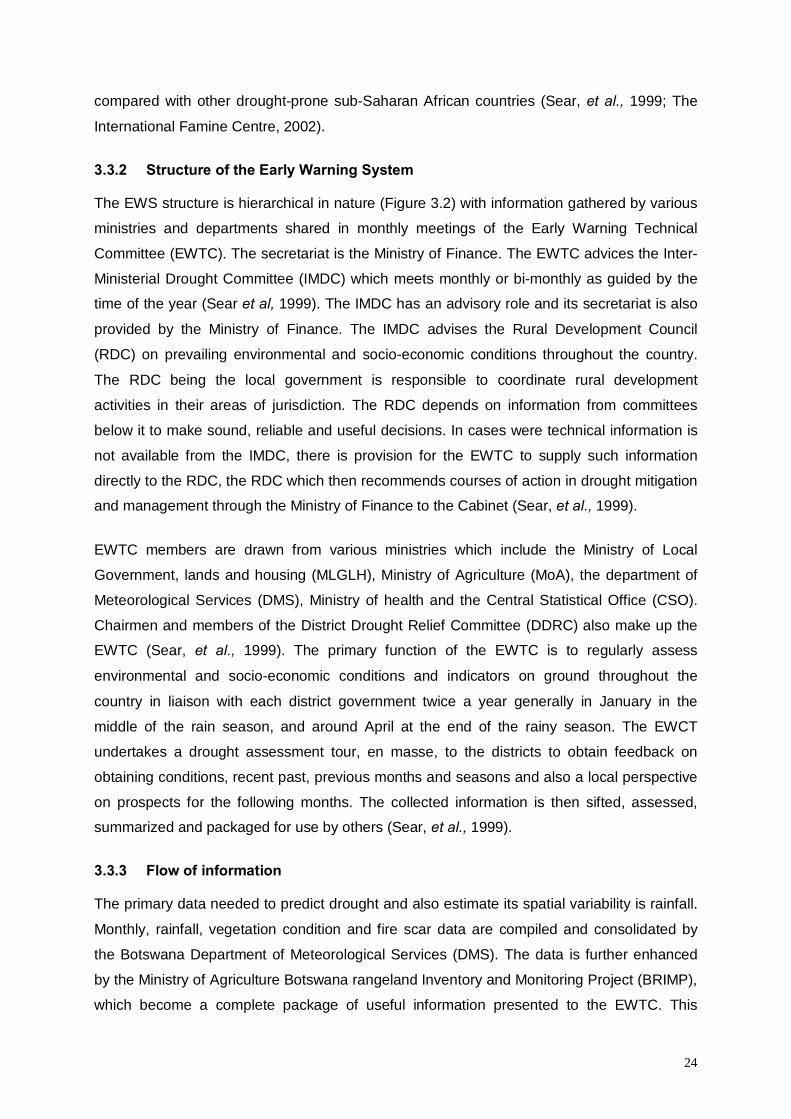
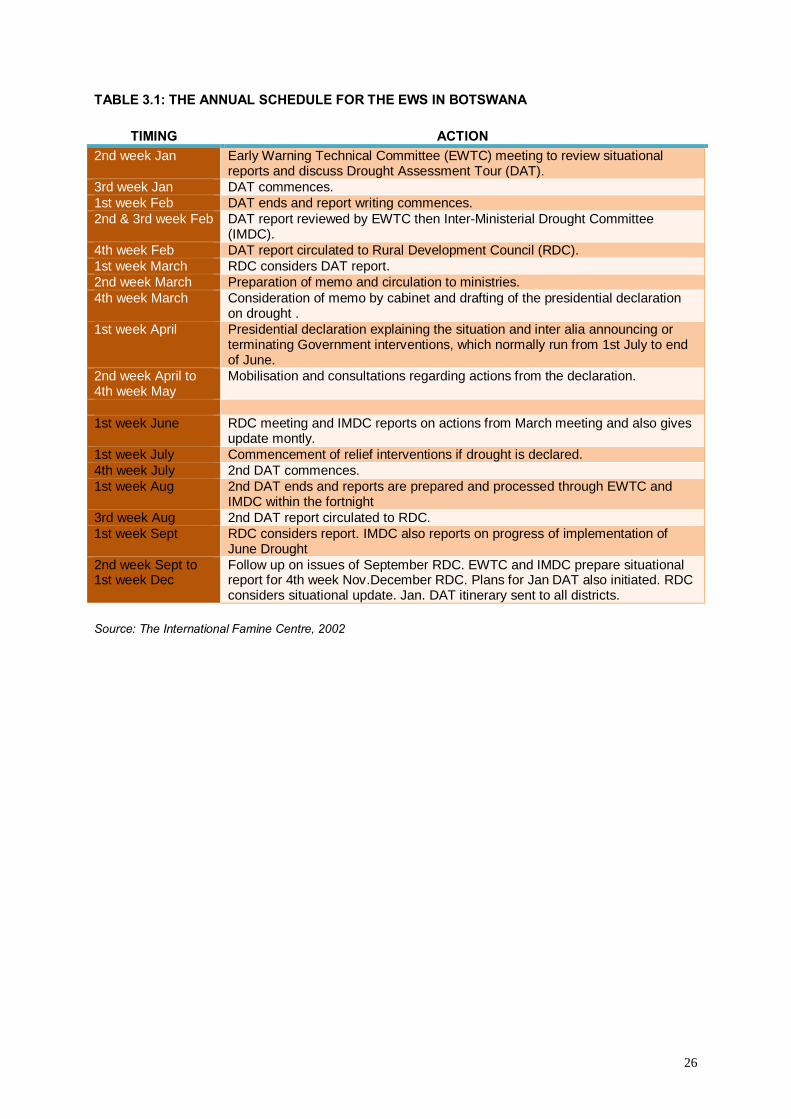
3.3.2 Structure of the Early Warning System
The EWS structure is hierarchical in nature (Figure 3.2) with information gathered by various
ministries and departments shared in monthly meetings of the Early Warning Technical
Committee (EWTC). The secretariat is the Ministry of Finance. The EWTC advices the Inter-
Ministerial Drought Committee (IMDC) which meets monthly or bi-monthly as guided by the
time of the year (Sear et al, 1999). The IMDC has an advisory role and its secretariat is also
provided by the Ministry of Finance. The IMDC advises the Rural Development Council
(RDC) on prevailing environmental and socio-economic conditions throughout the country.
The RDC being the local government is responsible to coordinate rural development
activities in their areas of jurisdiction. The RDC depends on information from committees
below it to make sound, reliable and useful decisions. In cases were technical information is
not available from the IMDC, there is provision for the EWTC to supply such information
directly to the RDC, the RDC which then recommends courses of action in drought mitigation
and management through the Ministry of Finance to the Cabinet (Sear, et al., 1999).
EWTC members are drawn from various ministries which include the Ministry of Local
Government, lands and housing (MLGLH), Ministry of Agriculture (MoA), the department of
Meteorological Services (DMS), Ministry of health and the Central Statistical Office (CSO).
Chairmen and members of the District Drought Relief Committee (DDRC) also make up the
EWTC (Sear, et al., 1999). The primary function of the EWTC is to regularly assess
environmental and socio-economic conditions and indicators on ground throughout the
country in liaison with each district government twice a year generally in January in the
middle of the rain season, and around April at the end of the rainy season. The EWCT
undertakes a drought assessment tour, en masse, to the districts to obtain feedback on
obtaining conditions, recent past, previous months and seasons and also a local perspective
on prospects for the following months. The collected information is then sifted, assessed,
summarized and packaged for use by others (Sear, et al., 1999).
3.3.3 Flow of information
The primary data needed to predict drought and also estimate its spatial variability is rainfall.
Monthly, rainfall, vegetation condition and fire scar data are compiled and consolidated by
the Botswana Department of Meteorological Services (DMS). The data is further enhanced
by the Ministry of Agriculture Botswana rangeland Inventory and Monitoring Project (BRIMP),
which become a complete package of useful information presented to the EWTC. This
25
information is crucial to facilitate government decision-making. Besides providing crucial
information to the monthly EWTC meetings, the BRIMP and DMS staff report directly to the
districts every two months to District administrators who would prefer easier to understand
data in order to assess the situation in their areas of regular operation.
The MoA input to the EWTC is co-ordinated by the own Early Warning Unit (EWU). The Unit
handles the secondary data not provided by either BRIMP or DMS. It picks up discrepancies
and provides a co-ordinated MoA view to the EWTC. The EWU working in conjunction with
the EWTC produce the official Botswana food security Bulletin every two months. Regional
information from SADC is disseminated by the EWU. The EWU while linked to SADC, its
primary role is in national drought early warning within the EWT (Sear et al, 1999; The
International Famine Center, 2002).
When drought is imminent, some drought relief programmes are activated. This follows
declaration as a national disaster or within individual districts (Sear, et al., 1999). In such
emergencies, the Nutrition unit of the Ministry of Health works with the MLGLH to implement
relief programs. The system of relief distribution to targeted populations is extremely efficient.
There is continuous campaigns of monitoring the nutritional status of target populations – the
most vulnerable groups, and to date, the nutritional status of the country’s under -5s is used
as a proxy for the whole population (Sear, et al., 1999). The Relief Intervention Program is
based on approved projects and programs already in the National Development Plan (The
International Famine Center, 2002).
The major objectives of relief intervention are:
• To prevent human deaths due to drought.
• To prevent a fall in nutrition levels for those groups considered most vulnerable.
• To ensure that there is an emergency water supply for human consumption.
• To make up for income lost by households as a result of drought - this is a labour-
based programme.
• To protect the basic assets that households need for their survival, such as breeding
stock and animals for ploughing and transport.
• To facilitate recovery and rehabilitation following drought (The International Famine
Center, 2002).
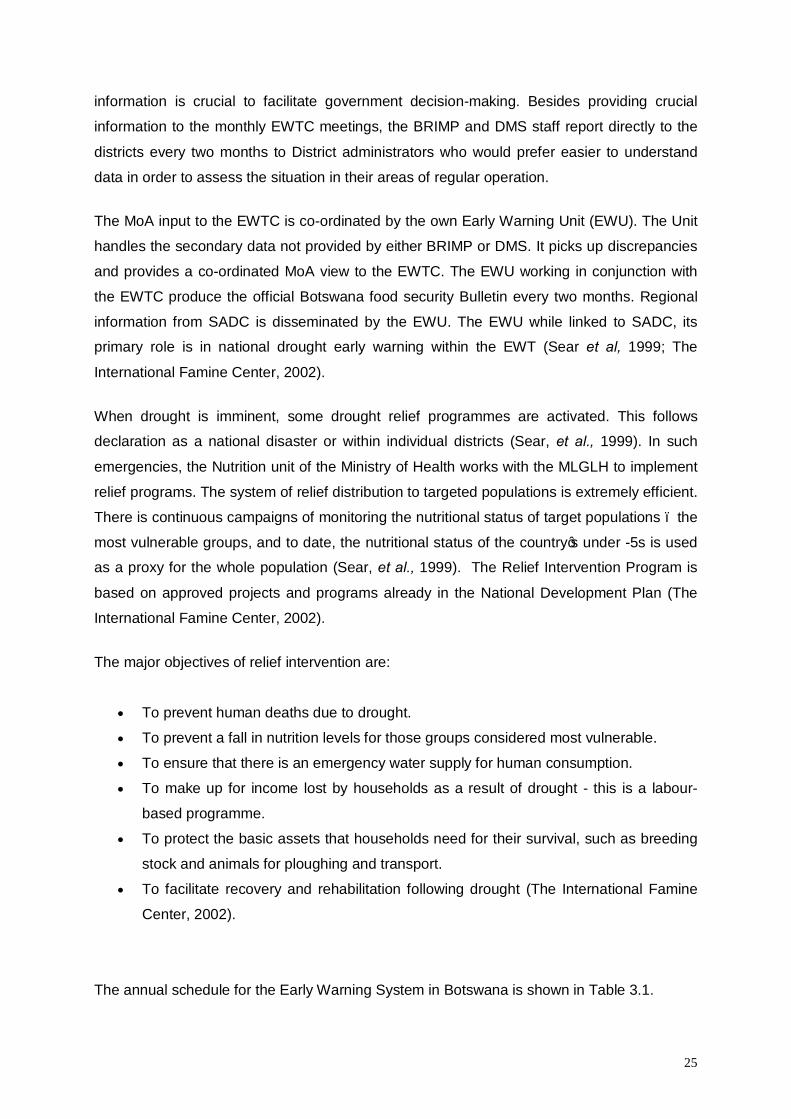
The annual schedule for the Early Warning System in Botswana is shown in Table 3.1.
26
TABLE 3.1: THE ANNUAL SCHEDULE FOR THE EWS IN BOTSWANA
TIMING ACTION 2nd week Jan Early Warning Technical Committee (EWTC) meeting to review situational
reports and discuss Drought Assessment Tour (DAT). 3rd week Jan DAT commences. 1st week Feb DAT ends and report writing commences. 2nd & 3rd week Feb DAT report reviewed by EWTC then Inter-Ministerial Drought Committee
(IMDC). 4th week Feb DAT report circulated to Rural Development Council (RDC). 1st week March RDC considers DAT report. 2nd week March Preparation of memo and circulation to ministries. 4th week March Consideration of memo by cabinet and drafting of the presidential declaration
on drought . 1st week April Presidential declaration explaining the situation and inter alia announcing or
terminating Government interventions, which normally run from 1st July to end of June.
2nd week April to 4th week May
Mobilisation and consultations regarding actions from the declaration.
1st week June RDC meeting and IMDC reports on actions from March meeting and also gives
update montly. 1st week July Commencement of relief interventions if drought is declared. 4th week July 2nd DAT commences. 1st week Aug 2nd DAT ends and reports are prepared and processed through EWTC and
IMDC within the fortnight 3rd week Aug 2nd DAT report circulated to RDC. 1st week Sept RDC considers report. IMDC also reports on progress of implementation of
June Drought 2nd week Sept to 1st week Dec
Follow up on issues of September RDC. EWTC and IMDC prepare situational report for 4th week Nov.December RDC. Plans for Jan DAT also initiated. RDC considers situational update. Jan. DAT itinerary sent to all districts.
Source: The International Famine Centre, 2002
27
Figure 3.2: The drought early warning System in Botswana Source: Sear et al., 1999
Office of the President
Rural Development Council
Inter Ministerial Drought committee
Early Warning Technical
Committee
Relief Implementation eg.
By Ministry of health and
MLGLH
District
Governments
Ministry of Finance
Committee secretariat
District Drought
Relief Committee
Ministry of Health
Central statistical
Office
Other departments
Ministry of Local Government,
Lands and Housing (MLGLH)
Dept of
Meteorological
services
Ministry of
Agriculture
Botswana Rangeland Inventory and Monitoring Project (BRIMP)
and (Department of Meteorological Services) DMS
projects
28
3.3.1 Challenges of the Early Warning System It is clear that there is poor communication between central technical committees and district
representatives outside formal drought assessment tours. Decisions made on drought and
information thereof from the central government to districts and village levels is not
disseminated in an understandable form. Despite investment in drought management, lack of
understanding at community levels that drought is a chronic problem is very worrying (Sear,
et al., 1999). There is also limited prevention and mitigation built into these plans in addition
to the fact that drought planning quickly wanes in the period immediately after the dry period
following rains.
3.4 Conclusion Drought is the single most important factor affecting livelihoods in Southern Africa, but
drought risk is not yet well managed. Most countries have the infrastructure to plan for
drought, but the planning has been on a crisis or response basis. Botswana and South Africa
stand out as countries with robust drought management systems in sub-Sahara Africa. A 10-
step drought plan presented by the USA is a useful tool for drought management that can be
adopted by drought-prone countries. It can be dovetailed by each country to meet its own
context. The next chapter deals with the legal framework that guides drought management in
Zimbabwe and the drought coping strategies employed at both household and community
level.
29
CHAPTER 4: DROUGHT IN ZIMBABWE
4.1. Introduction In this chapter the reader will be introduced to the legal framework that guides disaster
management in Zimbabwe. This is the Civil Protection Act of 1989 (chapter10:06) and other
complementary sections of the law that support the Act. The last section discusses
vulnerability and drought. It further reviews coping strategies employed by the drought-prone
communities.
4.2. The legal frame work in disaster management The Civil Protection Act 5 of 1989 (Chapter 10:06) is the principal act and regulatory
framework that guides and regulates disaster management in Zimbabwe (UNISDR, 2004).
The Civil Protection Act is complemented by other sections of the law (MLGPW &UD, 2006)
such as Environmental Management Act (Chapter 20:27) of 2002, the Health Public Act
(chapter 15:09), the Rural District Councils Act (Chapter 29:13), the Urban Councils Act
(Chapter 29:15), the Regional Town and Country Planning Act (Chapter 29:12), the Defence
Act (Chapter 11:02) and the Police Act (Chapter 11:10) which have some relevant sections in
disaster management.
It is National Policy for Civil Protection that every citizen of Zimbabwe should assist where
possible to avert or limit the effects of disaster. As provided by the Zimbabwe Civil Protection
Act of 1989, central government initiates hazard reduction measures through relevant sector
Ministries with the local administration taking the responsibility for implementing its
effectiveness (UNISDR, 2004; MLGPW &UD, 2006).
The Department of Civil Protection under the Ministry of Local Government, Public Works
and National Housing was mandated to spearhead disaster risk reduction and response. The
Department had the overall co-ordination of all relevant disaster management stakeholders.
The system used the existing Government departments, private sector, and NGO
organizations whose regular activities contained elements of disaster risk prevention and
community development. The structure of the civil protection system is illustrated in Figure
4.1.
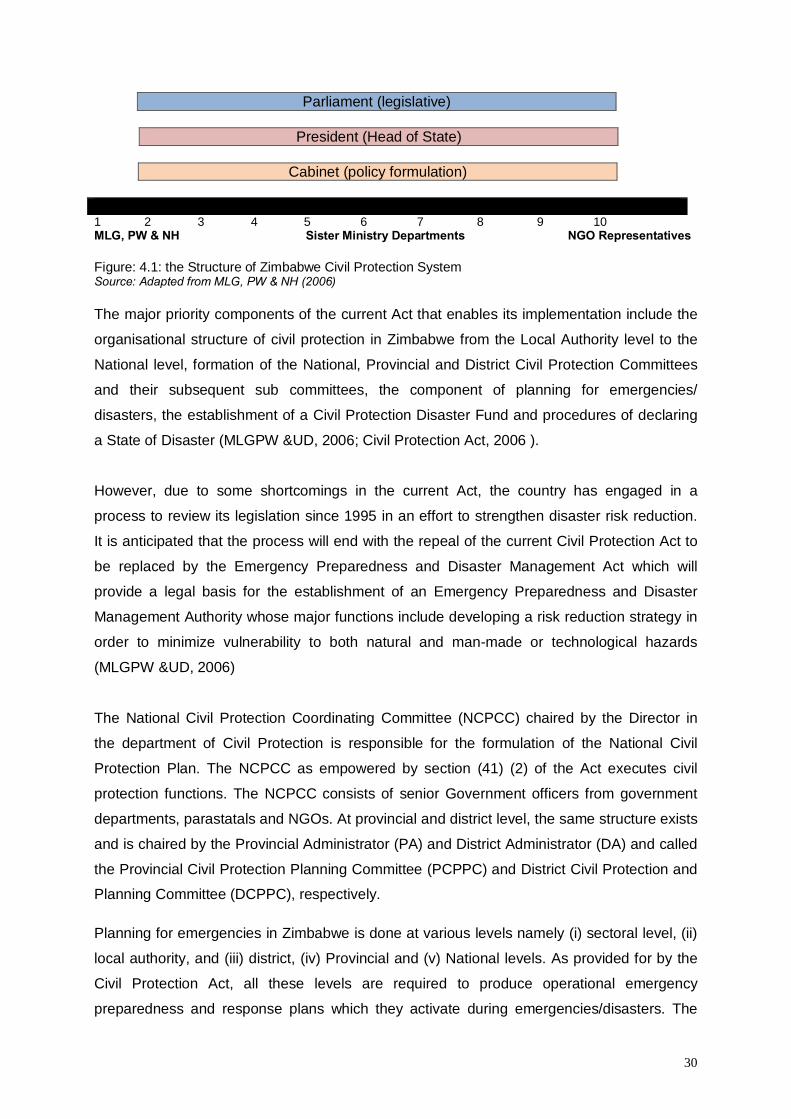
30
Parliament (legislative)
President (Head of State)
Cabinet (policy formulation)
1 2 3 4 5 6 7 8 9 10 MLG, PW & NH Sister Ministry Departments NGO Representatives Figure: 4.1: the Structure of Zimbabwe Civil Protection System Source: Adapted from MLG, PW & NH (2006) The major priority components of the current Act that enables its implementation include the
organisational structure of civil protection in Zimbabwe from the Local Authority level to the
National level, formation of the National, Provincial and District Civil Protection Committees
and their subsequent sub committees, the component of planning for emergencies/
disasters, the establishment of a Civil Protection Disaster Fund and procedures of declaring
a State of Disaster (MLGPW &UD, 2006; Civil Protection Act, 2006 ).
However, due to some shortcomings in the current Act, the country has engaged in a
process to review its legislation since 1995 in an effort to strengthen disaster risk reduction.
It is anticipated that the process will end with the repeal of the current Civil Protection Act to
be replaced by the Emergency Preparedness and Disaster Management Act which will
provide a legal basis for the establishment of an Emergency Preparedness and Disaster
Management Authority whose major functions include developing a risk reduction strategy in
order to minimize vulnerability to both natural and man-made or technological hazards
(MLGPW &UD, 2006)
The National Civil Protection Coordinating Committee (NCPCC) chaired by the Director in
the department of Civil Protection is responsible for the formulation of the National Civil
Protection Plan. The NCPCC as empowered by section (41) (2) of the Act executes civil
protection functions. The NCPCC consists of senior Government officers from government
departments, parastatals and NGOs. At provincial and district level, the same structure exists
and is chaired by the Provincial Administrator (PA) and District Administrator (DA) and called
the Provincial Civil Protection Planning Committee (PCPPC) and District Civil Protection and
Planning Committee (DCPPC), respectively.
Planning for emergencies in Zimbabwe is done at various levels namely (i) sectoral level, (ii)
local authority, and (iii) district, (iv) Provincial and (v) National levels. As provided for by the
Civil Protection Act, all these levels are required to produce operational emergency
preparedness and response plans which they activate during emergencies/disasters. The
31
National Civil Protection Plan forms the overall framework for the promotion, co-ordination
and execution of emergency and disaster management in Zimbabwe. The localised plans
should dovetail in to the National plan (MLGPW &UD, 2006).
4.3 District Level There are 55 District Civil Protection Units corresponding to the 55 administrative districts. A
“District“, which forms the smallest civil protection unit, is headed by the District
Administrator, assisted by a District Civil Protection Planning Committee. The same
multisectoral approach is reflected at all levels. Each area may appoint sub-committees to
cover the following sectors:
(i) Public awareness/relations
(ii) Manpower and Training
(iii) Supplies
(iv) Telecommunications
(v) Transportation
(vi) Health and Welfare
(vii) Emergency Management.
Based on the national policy that “every Zimbabwean citizen has a responsibility in the event
of a major disaster or local emergency, to assist, where possible, themselves and their
community“, the understanding and cooperation of the public, in order to obtain full value for
the preparedness process, the interaction between the emergency authorities and the public
are enhanced by programmes of education and information designed to ensure that the
public would, in time of disaster, react intelligently and promptly (MLGPW &UD, 2006).
4.4 Current challenges with the legislation and practices Political will is amply demonstrated by the existence of the legal enabling statute, which
creates the conducive environment in which a dedicated disaster management department
was spawned. The institutional framework, appropriate policy development and legislative
codes all flow from the corporate commitment. However, it is without challenges. The
Government of Zimbabwe has not yet developed a database on disaster risk reduction.
Information is still being managed at institutional level through sharing reports, minutes,
newsletters, and email facilities (MLGPW &NH, 2006). The Department has no modern
infrastructure that facilitates communication and networking between disaster risk reduction
institutions and research centres. However, the recently developed bill has the provision to
facilitate communication and networking through the establishment of a disaster
management centre where relevant stakeholders would be housed and linked together
(MLGPW &NH, 2006). It is noted that funds for the envisaged centre are still yet to be
32
secured. By and large, information is disseminated through the press, by pamphlets and road
shows. Budgetary constrains limit the use of the electronic media whose effect is far
reaching. While the act provides for the establishment of the Disaster Fund, many a time, the
Fund is not able to fulfil all disaster management needs throughout the year.
Where more resources are required in the event of major disasters occurring at any given
time, the enabling legislation has a provision through which the Treasury can inject additional
funding, but normally these funds are diverted from other developmental projects, which
either have to be suspended or deferred. The finance budgeted by the government for a year
is inadequate and as a result local provincial and district structures are not provided with a
budget to finance these disaster management activities. It is therefore difficult to conduct
these activities without proper funding. In addition, some parts of the country remain remote
such that radio, television and telephone services are still poor to a point where it is difficult
to share early warning on imminent disasters in those areas (Dube, 2008)
4.5 Institutional intervention As stipulated by the Act, every citizen or institution has a role to play in disaster management
in the country. As such, many institutions at district level are involved in activities to do with
disaster management. Activities at district level are coordinated by the DA. For example, in
Zimbabwe drought emergencies at district level such as Mutasa are coordinated by the
District Drought Relief Committee (DDRC), a committee comprised of district level
stakeholders such as the District Administrator’s office (DA), Agricultural Extension &
Technical Services (AGRITEX), Livestock Production department (LPD), Veterinary Services
department (DVS), department of Social Services (DSS), the Grain Marketing Board (GMB),
the Rural District Council (RDC), NGOs and other relevant stakeholders that may be co-
opted in the committee. However, activities of this committee are not pro-active and do not
have the resources to carry out its mandate. The committee is reactive, only meeting when
there is a disaster, which requires the distribution of maize and other inputs from either the
NGOs or the government controlled Grain Marketing Board (GMB) (Dube, 2008).
.
As noted, various institutions were involved in drought management in rural Zimbabwe
including government departments, traditional institutions and NGOs. The private sector was
not very visible in drought management, only NGOs were involved in different aspects of
drought risk reduction; many offering short-term assistance (relief services) that satisfied
immediate needs. Some provided technical assistance and financial/material support for
initiatives that helped communities in rebuilding their livelihoods. Major activities included,
harnessing of surface and ground water, rehabilitation of water sources, small livestock
33
support, agricultural inputs, supporting irrigation schemes, supporting conservation farming,
promoting planting of drought tolerant crops, promoting small gardens, food relief and
capacity building in various aspects of drought coping and risk reduction (Ndlovu, 2010).
A survey carried out by Ndlovu (2010) indicates that informal institutions have not played a
major role in drought risk reduction. Their role (e.g. Chieftainship) has only been limited to
food distribution activities. Ndlovu (2010) further observes that traditional norms and beliefs
are no longer effective in reducing land degradation because law enforcement is now weak.
This may continue for some time in future in view of the growing population pressure on the
environment.
A number of challenges impede the implementation of drought coping and risk reduction
initiatives by many institutions. Government departments are commonly constrained by
inadequate resources (both financial and material) to implement programmes; they do not
have the resources for training farmers. Most farmers lack the requisite knowledge and skills
to manage their farming activities as commercial enterprises. The situation is exacerbated by
the high extension worker farmer ratio, which stands at 1:600. Most of the extension
personnel have left the department due to poor remuneration and those still hanging on are
demotivated and lack basic support to carry out their duties such as relevant equipment and
transport (WFP-Plan, 2009).
Most NGOs have a small number of staff, based at district level and not at ward or local level
making monitoring of NGO projects weak. Challenges common to both NGOs and
Government departments include political interference in day to day activities that sometimes
derail implementation of drought risk reduction activities. The existing economic environment
has also led to high staff turn-over in most government departments and shortages of inputs
and materials required for drought risk reduction. The current global economic crisis will
further exacerbate the situation as it has already started affecting funding inflows for some
NGOs (Ndlovu, 2010).
The recurrent droughts have made it difficult for communities to recover, resulting in a
continuous need for drought relief. The strategic grain reserve for the country is a central
government responsibility carried out by the Grain Marketing board, which is a parastatal. It
maintains the reserve both in grain and in cash. Grain silos are situated in the northern parts
of the country. However, a number of temporary sites are created to cope with emergencies.
During sustained periods of droughts importation of grain takes place. Such importation may
require assistance from the international community through the UN-WFP donors and their
34
implementing partners. The GMB, which used to be a strategic grain reserve had lost the
capacity to provide for locals after the industry was deregularised (FAO, 2004). GMB used to
enjoy the monopoly as the sole buyer of grain in Zimbabwe. Deregularisation of the industry
saw entry of new players that outcompeted GMB and had since failed to buy enough grain
for its strategic reserve mandate and left the population vulnerable in the event of a major
drought (FAO, 2004).
Drought relief programmes have been implemented in Zimbabwe to avert hunger and
famine. Some of the government drought relief’s objectives have been to prevent hunger,
starvation, malnutrition and disease outbreaks, reduction of malnutrition of the under fives
through supplementary feeding and protection of the asset base of rural households from
distress sales of assets (GoZ, 2005). Eldridge (2002) and Munro (2006) have raised
pertinent issues on the food relief in Zimbabwe. While vulnerable households have benefited
from food aid, food was targeted at communal farmers in food deficit areas in significant
quantities and high regularity. The programme kept moving into food deficit areas during
drought thus averting hunger and starvation. However, food aid programmes failed to reach
large numbers of its target group (Munro, 2006). Eldridge (2002) augured that famine was
avoided in the 1991/1992 drought by the activities of those affected by drought than relief
itself. Even the beneficiaries of the food aid would employ other strategies such as harvest of
wild fruits, casual labour and sell of livestock in exchange for grain and remittances of cash
and groceries from relatives in urban areas, because the food that vulnerable households
received only lasted for a few days before the next distribution date the following month due
to inadequate quantities.
Despite the important role played by livestock, during and post drought periods, very little
support has been extended to livestock farmers to save their animals during drought periods
(Eldridge, 2002). Work summarized by Dube (2008) shows that livestock are critical assets in
both disaster response and mitigation. Livestock are useful in providing income and land
preparation. There is a positive correlation between the number of cattle owned and land
size cultivated as reflected in Table 2.2. Those farmers with at least five head of cattle
produced at least eight bags of grain from the land cultivated while those with fewer cattle
had a correspondingly poor harvest. Ownership of cattle enabled farmers to be flexible in
their cropping patterns and also afforded them the opportunity to plough as much field as
they desired, yet farmers without draught animals found it difficult to plough large enough
pieces of land for adequate household grain. They could not take advantage of early
showers and the erratic rainfall distribution to plant as they wished since they had to wait and
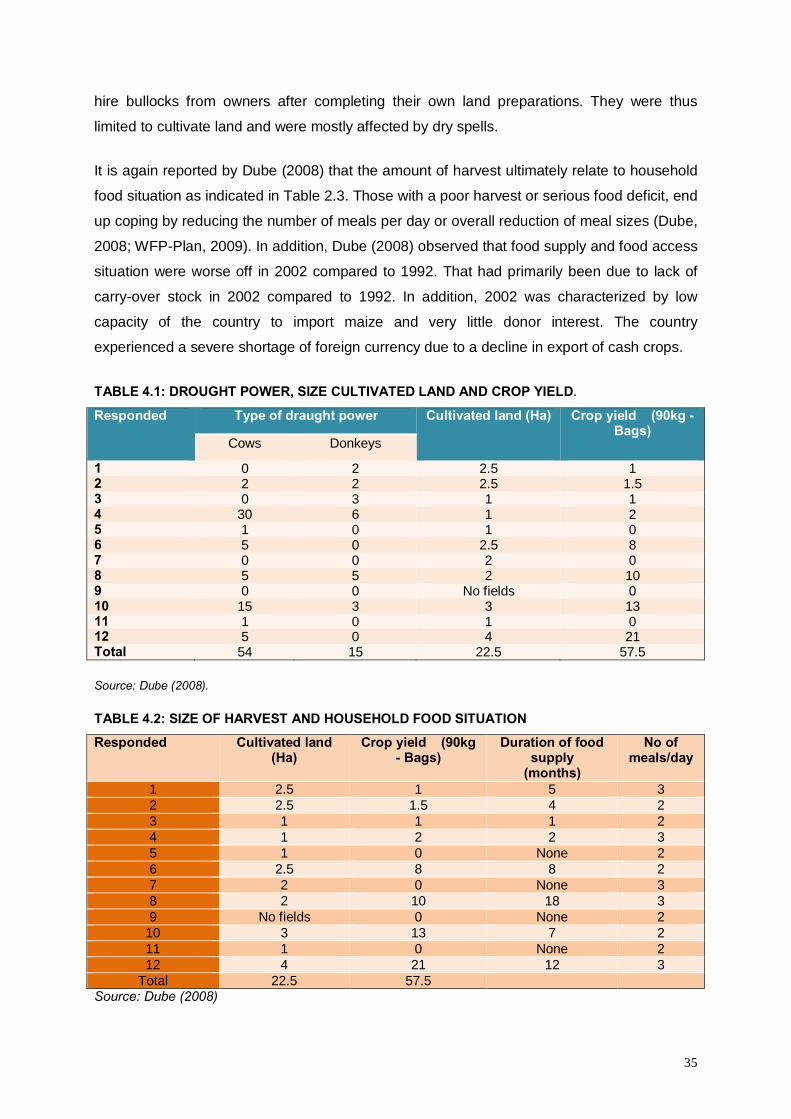
35
hire bullocks from owners after completing their own land preparations. They were thus
limited to cultivate land and were mostly affected by dry spells.
It is again reported by Dube (2008) that the amount of harvest ultimately relate to household
food situation as indicated in Table 2.3. Those with a poor harvest or serious food deficit, end
up coping by reducing the number of meals per day or overall reduction of meal sizes (Dube,
2008; WFP-Plan, 2009). In addition, Dube (2008) observed that food supply and food access
situation were worse off in 2002 compared to 1992. That had primarily been due to lack of
carry-over stock in 2002 compared to 1992. In addition, 2002 was characterized by low
capacity of the country to import maize and very little donor interest. The country
experienced a severe shortage of foreign currency due to a decline in export of cash crops.
TABLE 4.1: DROUGHT POWER, SIZE CULTIVATED LAND AND CROP YIELD. Responded Type of draught power Cultivated land (Ha) Crop yield (90kg -
Bags) Cows Donkeys
1 0 2 2.5 1 2 2 2 2.5 1.5 3 0 3 1 1 4 30 6 1 2 5 1 0 1 0 6 5 0 2.5 8 7 0 0 2 0 8 5 5 2 10 9 0 0 No fields 0 10 15 3 3 13 11 1 0 1 0 12 5 0 4 21 Total 54 15 22.5 57.5
Source: Dube (2008).
TABLE 4.2: SIZE OF HARVEST AND HOUSEHOLD FOOD SITUATION Responded Cultivated land
(Ha) Crop yield (90kg
- Bags) Duration of food
supply (months)
No of meals/day
1 2.5 1 5 3 2 2.5 1.5 4 2 3 1 1 1 2 4 1 2 2 3 5 1 0 None 2 6 2.5 8 8 2 7 2 0 None 3 8 2 10 18 3 9 No fields 0 None 2
10 3 13 7 2 11 1 0 None 2 12 4 21 12 3
Total 22.5 57.5 Source: Dube (2008)
36
4.6 Irrigation development
The Government of Zimbabwe (GOZ) has recognized the role of irrigation development as a
key drought mitigation measure. Tremendous strides have been made by the government,
the private sector and the donor community in the area of irrigation development since
independence in 1980. It is estimated that 120 000 ha are under irrigation (FAO, 2000). The
report further mention that in general, yields achieved on smallholder schemes are higher
than rain fed dry-land yields in communal areas. Gross margins for irrigating farmers were
significantly greater than for dry-land farmers. The effect of irrigation on increasing crop
production and incomes is even more marked in the dry winter season, when dry-land
production is impossible because of lack of rain. With a more integrated approach
smallholder irrigation can be the basis for rural development and improved standards of living
among Zimbabwe's rural communities. In areas of very low rainfall, as in Natural Regions IV
and V, (Figure 2.4) farmers enjoy the human dignity of producing their own food instead of
depending on food handouts from the Department of Social Welfare (FAO, 2000).
4.7 Vulnerability and drought Climate variability is the single most important factor affecting the livelihoods of the people in
the region, but drought risk is not yet well managed (Sear, Campbell, Dambe &Slade, 1999).
Severe droughts in 1980s, 1990s, and 2000s to date, have significantly reduced agricultural
production and disrupted national economies (Sear, et al., 1999). Concern is now growing
that drought might become more frequent in the region as a result of global warming (Sear,
et al., 1999; ISDR, 2002; Bang & Sitango, 2003). If this occurs it will exacerbate problems for
vulnerable households, communities and economies. Drought has actually caused more
socio – economic damage than any other hazard in the whole world (Wilhite, 2000; Wilsner,
et al., 2004).
However, drought has no structural and physical impact, which to some extent has hindered
the development of accurate, effective, reliable and timely estimates of its severity and
ultimately, the formulation of drought contingency plans by many governments in Africa
(Wilhite, 2000).
In disasters such as drought, a geophysical or weather related event is implicated in some
way as a trigger event or a link in the chain of causes. Even when such a natural hazard
appears to be directly linked to loss of life, there are social factors that need to be considered
involved in causing people’s vulnerability (Wilhite, 2000; Wisner, et al., 2004). Vulnerability is
a function of social, economic and political processes that determine how a hazard event
would affect people in varying ways (Wilhite, 2000). Furthermore, human activities can
37
modify biological events in the long run such as deforestation or many years later such as
the introduction of new animal or seed. Until the emergence of the idea of vulnerability to
explain disasters, many views have been of the idea that disasters are as a result of natural
hazards (Wisner, et al., 2004). Vulnerability is a function of factors that influence the degree
to which someone’s life, assets and livelihood are prone to damage by a discrete and
identifiable hazard. Some people are more prone to damage or loss in the face of a different
hazard and variations in impact are also a result of differences in wealth, caste, ethnicity,
gender, health and physiological status, disability and age, immigration status and types of
social networks (Dercon, 2002).
Vulnerable people are those that find it difficult to reconstruct their livelihoods following a
disaster such as drought. In general the poor suffer more from drought than the rich (Wisner,
et al., 2004). While vulnerability and poverty are not synonymous, the two are highly
correlated. For example, drought may cause moisture stress leading to destruction of crops
and livestock in an area. Firstly the rich may lose more animals in quantitative terms say ten
out of twenty animals but still remain with a portion of the herd for restocking in the near
future even including cross breeding and supplementary feeding. Yet, the poor loses all the
three animals he has.
Secondly, the rich have an option to send their animals for relief grazing if the duration of
drought is to continue in the area while the poor on the other hand may have to watch
helplessly as the animals succumb to drought. Because livestock are also used for draft
power, the poor become more vulnerable to a future drought since they cannot even till their
land more productively due to lack of draft power.
Thirdly, the impact of drought is much more severe for the poor than the rich. Even if all
livestock were wiped out by drought for both the poor and rich, assets for the rich are in
many cases insured against local risk and usually have savings and are credit worthy. They
can still mobilize their savings and purchase other livestock or still approach a bank for a
restocking loan. The poor, by contrast, may fail to ever restock again following death of all
their livestock (Dacron, 2002; Wisner, et al., 2004).
However, many vulnerability aspects are temporary and will change with changes in life
stages such as marriage, age, immigration status and land ownership, occupation (Wisner,
et al., 2004). These changing factors also influence, to a greater extent, the coping strategies
of the same people in adversity, and so determine survival. Rural households normally
protect themselves against the adverse impacts of drought through coping strategies.
Households at risk have developed sophisticated (ex ante) risk-management and (ex post)
risk-coping strategies (Dercon, 2002; Mombeshora, et. al., 1995).
38
Since drought is a recurrent event in Zimbabwe, coping strategies in the face of drought
should be fast improving. Dercon (2002) and Mombeshora, et al., (1995 ) report rural
households resorting to income diversification, through combining activities with low positive
covariance and income-skewing, for example taking up low risk activities even at the cost of
low return. In practice, this implies that households are usually involved in a variety of
activities, including farm and off-farm activities, use seasonal migration to diversify, etcetera
or focus on low risk activities even at the cost of a low return.
While Wisner, et al. (2004) suggest income diversification to reduce drought disaster risk,
Dercon (2002) argues that entry constraints for the poor who are most vulnerable limit the
usefulness of income diversification. Informal risk-sharing only provides limited protection,
especially for some of the poor and their sustainability during periods of change is in doubt.
Public safety nets are likely to be beneficial, but their impact is at times limited while they
may have negative externalities on households not covered by the safety net (Dercon, 2002).
Risk-coping strategies may also involve attempting to earn extra income when hardship
occurs. Kochar (1995) as cited by Dercon (2002) reports increased labour supply as the key
response in the ICRISAT villages of Ethiopia. The literature on coping strategies when
famine strikes also regularly report attempts to earn additional income through a reallocation
of labour, including temporary migration, earning income from collecting wild foods (also for
own consumption), and gathering activities (such as increased firewood collection).
4.8 Coping strategies
Coping is the manner in which people act within the confines of existing resources and range
of expectations to achieve various means (Wisner, et al, 2004). It does not only involve the
management of limited resources but how it is done in unusual, abnormal and adverse
situations. Resources may include land, livestock, draught animals, seed for crops and
labour. To mobilize resources people should be entitled to command them which can be
through exercise of rights, using the market, calling upon obligations or even through theft
and violence (Ndlovu, 2010). While the major objective of coping strategies is usually
assumed to be survival in the face of adverse events, such an approach masks other
important purposes as explained by Maslow’s hierarchy of human needs (Wisner, et al.,
2004). It is important not to oversimplify and over-generalise the expectations and priorities
of vulnerable people in disasters.
When people know an event may occur in the future in a similar pattern as it has happened
in the past, they set up ways of coping with it. Such coping strategies are guided by the
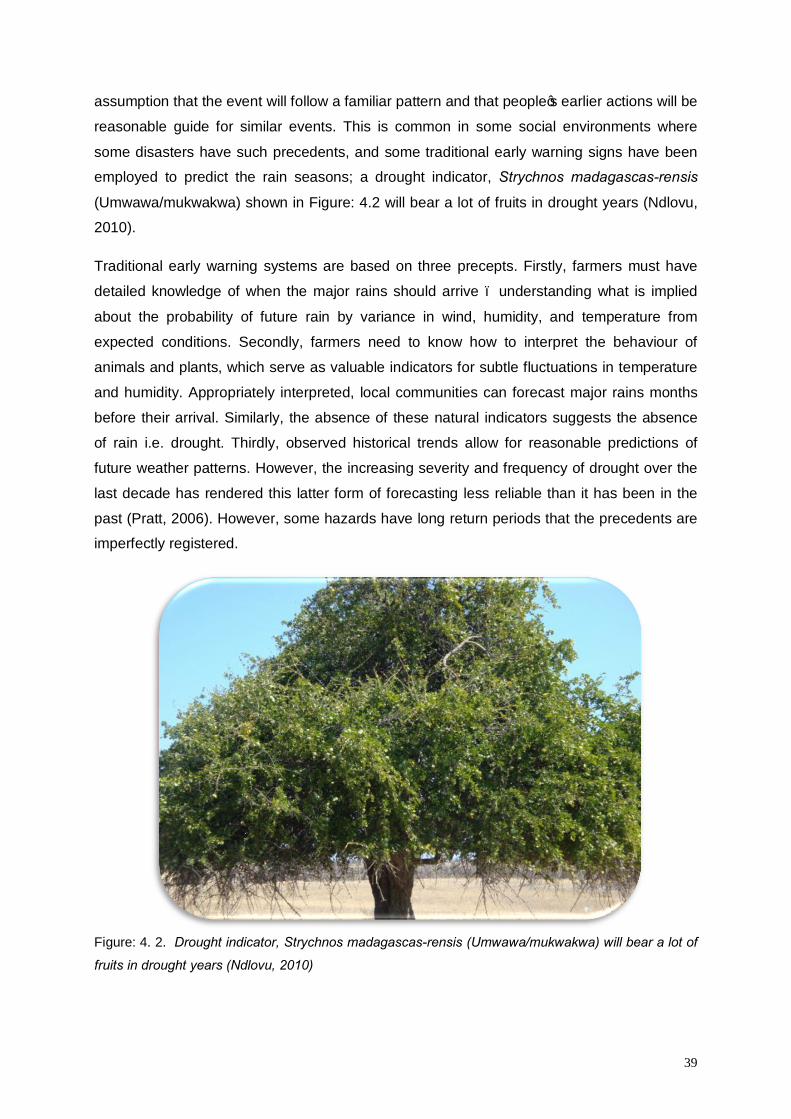
39
assumption that the event will follow a familiar pattern and that people’s earlier actions will be
reasonable guide for similar events. This is common in some social environments where
some disasters have such precedents, and some traditional early warning signs have been
employed to predict the rain seasons; a drought indicator, Strychnos madagascas-rensis
(Umwawa/mukwakwa) shown in Figure: 4.2 will bear a lot of fruits in drought years (Ndlovu,
2010).
Traditional early warning systems are based on three precepts. Firstly, farmers must have
detailed knowledge of when the major rains should arrive – understanding what is implied
about the probability of future rain by variance in wind, humidity, and temperature from
expected conditions. Secondly, farmers need to know how to interpret the behaviour of
animals and plants, which serve as valuable indicators for subtle fluctuations in temperature
and humidity. Appropriately interpreted, local communities can forecast major rains months
before their arrival. Similarly, the absence of these natural indicators suggests the absence
of rain i.e. drought. Thirdly, observed historical trends allow for reasonable predictions of
future weather patterns. However, the increasing severity and frequency of drought over the
last decade has rendered this latter form of forecasting less reliable than it has been in the
past (Pratt, 2006). However, some hazards have long return periods that the precedents are
imperfectly registered.
Figure: 4. 2. Drought indicator, Strychnos madagascas-rensis (Umwawa/mukwakwa) will bear a lot of
fruits in drought years (Ndlovu, 2010)
40
Coping strategies may take forms, some of which may even be prescribed and discouraged
by members of a social group or gender. Following destruction of livelihoods assets and
means, women and children are at danger of using sex as a survival strategy (Natrass,
2002). It has been observed elsewhere that economic factors reinforce unsafe practices
especially where sex is a currency by which African women and girls are frequently expected
to pay for life’s opportunities, as permission for crossing borders, passing a grade at school
to a trading license (UNAIDS, 1999). Poverty exacerbates the situation by encouraging
women to engage in sex as an economic strategy for survival (Nattrass, 2002).
Building up of stocks of food and other saleable assets is cited as one important coping
strategy of rural households (Dercon, 2002; Wisner, et al., 2004; Ndlovu, 2010). Rural people
who have access to land often store grain and other staple food. This is an important buffer
against expected seasonal shortages, as well as prolonged periods of hardship. Livestock
farmers may follow a strategy of increasing their herd size in years of good rains and grass
availability in order to maintain the herd size in the inevitable bad years with high mortality.
A study done by Ndlovu (2010) in Bulilima and Mangwe districts of Zimbabwe observes that
asset disposal has increased over the years with the selling of cattle and small livestock such
as goats and chickens being the most popular coping strategy in the two districts. As well as
providing income during a period of drought, selling cattle does have the benefit of reducing
the herd size so that not all livestock die due to a shortage of feed. Some cattle may be sold
to buy supplementary feed to save other cattle during drought years. Although the selling and
consumption of small livestock, especially chicken and goats, was common to most of the
households who had them, this coping mechanism did not significantly reduce vulnerability
because of the little money they fetched on the market. The selling of assets, if relied upon
too much, can in the long run increase drought risk, as communities will not have enough
productive assets to prepare for future droughts.
Davies (1996) indicates that buying and selling cattle is generally recognized as a common
strategy to cope with income fluctuations due to drought in many rural areas. However, a
relatively large proportion of households often do not own any. Dercon (2002) finds that only
half the households in a sample in Western Tanzania own cattle, even though cattle are
important in the farming system and in their culture. It is not that other households simply
choose to enter into other activities; rather, investing into livestock requires a sizeable
surplus: livestock are expensive. A cow, for example, costs about a fifth of an average crop
income. Cattle ownership is generally determined by endowments in male labour and land,
41
suggesting that those with a poorer endowment cannot generate sufficient means to enter
into cattle rearing, leaving them relatively more exposed to income risk (Dercon, 2002). More
generally, the failure to cope with drought effects is not only reflected in household
consumption. Effects on nutrition, health and education are also observed, as are intra
household consequences. Children are often taken out of school in response to adverse
income shocks; the result is lower accumulation of human capital (Dercon, 2002).
Ndlovu (2010) has observed that in many rural areas where livestock provide a major source
of income, during the wet season rangeland forage is of adequate quality and quantity for
livestock to thrive, but grazing declines from April onwards such that by August/September,
livestock need supplementary feeding to sustain growth rates and prevent loss of summer
weight gains and body condition. Some farmers meet this feed requirement from grown
pastures or multi-purpose trees and crop by-products. After the catastrophic droughts of
1999/92 and 1993/94, the approach to handling drought has changed. Since then communal
farmers have become more responsive to drought so that culling and selling some stock,
lease grazing and hand feeding of animals for survival has now been widely adopted. The
chosen course of action depends on the farmers' circumstances i.e. resources at his/her
disposal, severity of the drought, market availability and veterinary movement restrictions.
However it is still a common practice that a “do nothing” approach is the first strategy
employed by all farmers. In the long term, the most sustainable approach to drought
mitigation is establishment of “strategic fodder reserves” through planting of fodder crops,
conservation of forages and storage for use at strategic times. This should be accompanied
by a pre-prepared drought plan (Chinembiri, 1999).
Diversification of production is regarded as one most important risk-averse strategy with the
farming people. Usually their production involves mixed cropping, intercropping, the
cultivation on non-staple root crops and use of kitchen gardens. This strategy provides a
surplus in good years since it is normally planned on the basis of meeting subsistence needs
in bad years (Wisner et al., 2004). It should be noticed that diversifying production makes
use of environmental variations and provides the best chance of an optimum yield under all
variations of weather and plant pests.
Income diversification is very common among rural households these days. It becomes even
more important following a drought that temporarily disrupts farm and livestock production.
Black smiting, charcoal making, honey collection and crafts have increasingly become
important since they do not suffer directly from the impact of drought or climate change.
Wisner, et al. (2004) noted brewing beer as an important source of income, especially for
42
women and drought reduction of beer ingredients can affect their income and nutrition.
However, some coping strategies such as charcoal production can be effective in the short
run while they undermine the basis of livelihood in the long run in the form of de-vegetation,
soil erosion and finally desertification.
Migration has been cited by Dercon (2002) as one of the coping strategies in drought
disasters. Migration comes with a lot of challenges though (Bradshaw, 2004). Following a
disaster as has been the tendency worldwide many male head of households migrate
resulting in an increase in the number of female headed households. The reasons are
twofold: frustration at not being able to fulfill one’s role as breadwinner; and the intention to
seek work and send remittances to the family, even when they do not subsequently do so.
For women who have to remain behind, the impact is twofold: not only await a remittance
that take time to arrive, but also be left without subsistence resources, because in order to
finance the migration, the household (i.e. the man) has to sell assets such as livestock or the
house (Bradshaw, 2004). The impact on women of migration by male heads of household
has more than just a financial dimension: women must assume headship of their households
and the responsibilities that this entails (Bradshaw, 2004).
In adversity people also rely on social support networks. These include rights and obligations
between members of the same household and with other wider groups with a shared identity
such as a clan or tribe (Dercon, 2002). Parents may influence strategic marriage partners for
their daughters or sons into a comparatively wealthy family to call on resources in difficult
times. There are also wider obligations from the whole community to assist those facing
acute hunger and some public assistance and food aid from a number of Non Governmental
Organizations have been very helpful in Mutasa district. At the same time, sources of
household income other than the dominant one may be employed, such as casual labour,
petty trading, cross border trading and artisanal work.
There is also sale of household disposable assets that do not undermine future productive
capacity such as small stock and building material. However, as crisis deepens, sale of more
productive assets such as ox for ploughing, agricultural implements and early marriages may
have to be arranged. It is clear that these strategies do not seem to try maintaining an
adequate food intake for a household but instead are aimed at preserving the means for
continuing the household’s livelihood after the drought. As highlighted, food aid in Mutasa
has been very helpful to meet food deficit requirements for many vulnerable households. It
was observed that in the 2008/9 farming season WFP through Plan International provided
food aid to an average of 125,000 beneficiaries per month (WFP-Plan reports, 2009) so as to
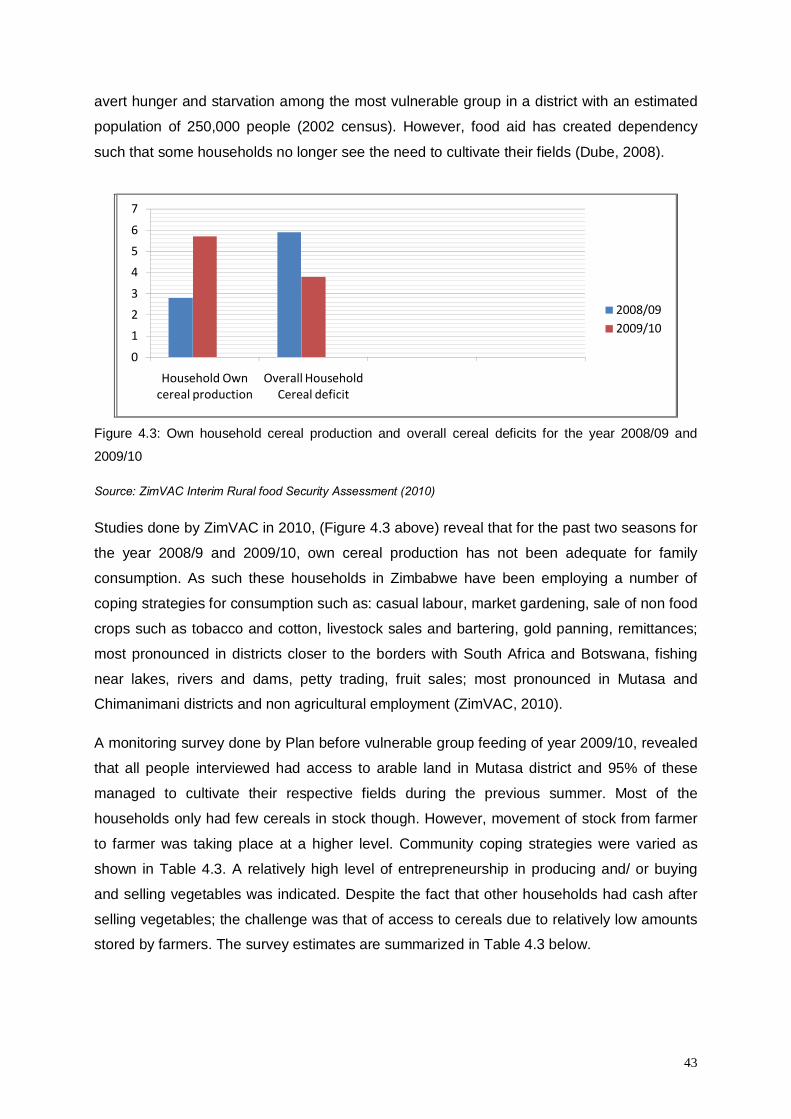
43
avert hunger and starvation among the most vulnerable group in a district with an estimated
population of 250,000 people (2002 census). However, food aid has created dependency
such that some households no longer see the need to cultivate their fields (Dube, 2008).
Figure 4.3: Own household cereal production and overall cereal deficits for the year 2008/09 and
2009/10
Source: ZimVAC Interim Rural food Security Assessment (2010)
Studies done by ZimVAC in 2010, (Figure 4.3 above) reveal that for the past two seasons for
the year 2008/9 and 2009/10, own cereal production has not been adequate for family
consumption. As such these households in Zimbabwe have been employing a number of
coping strategies for consumption such as: casual labour, market gardening, sale of non food
crops such as tobacco and cotton, livestock sales and bartering, gold panning, remittances;
most pronounced in districts closer to the borders with South Africa and Botswana, fishing
near lakes, rivers and dams, petty trading, fruit sales; most pronounced in Mutasa and
Chimanimani districts and non agricultural employment (ZimVAC, 2010).
A monitoring survey done by Plan before vulnerable group feeding of year 2009/10, revealed
that all people interviewed had access to arable land in Mutasa district and 95% of these
managed to cultivate their respective fields during the previous summer. Most of the
households only had few cereals in stock though. However, movement of stock from farmer
to farmer was taking place at a higher level. Community coping strategies were varied as
shown in Table 4.3. A relatively high level of entrepreneurship in producing and/ or buying
and selling vegetables was indicated. Despite the fact that other households had cash after
selling vegetables; the challenge was that of access to cereals due to relatively low amounts
stored by farmers. The survey estimates are summarized in Table 4.3 below.
0
123
456
7
Household Own cereal production
Overall Household Cereal deficit
2008/092009/10
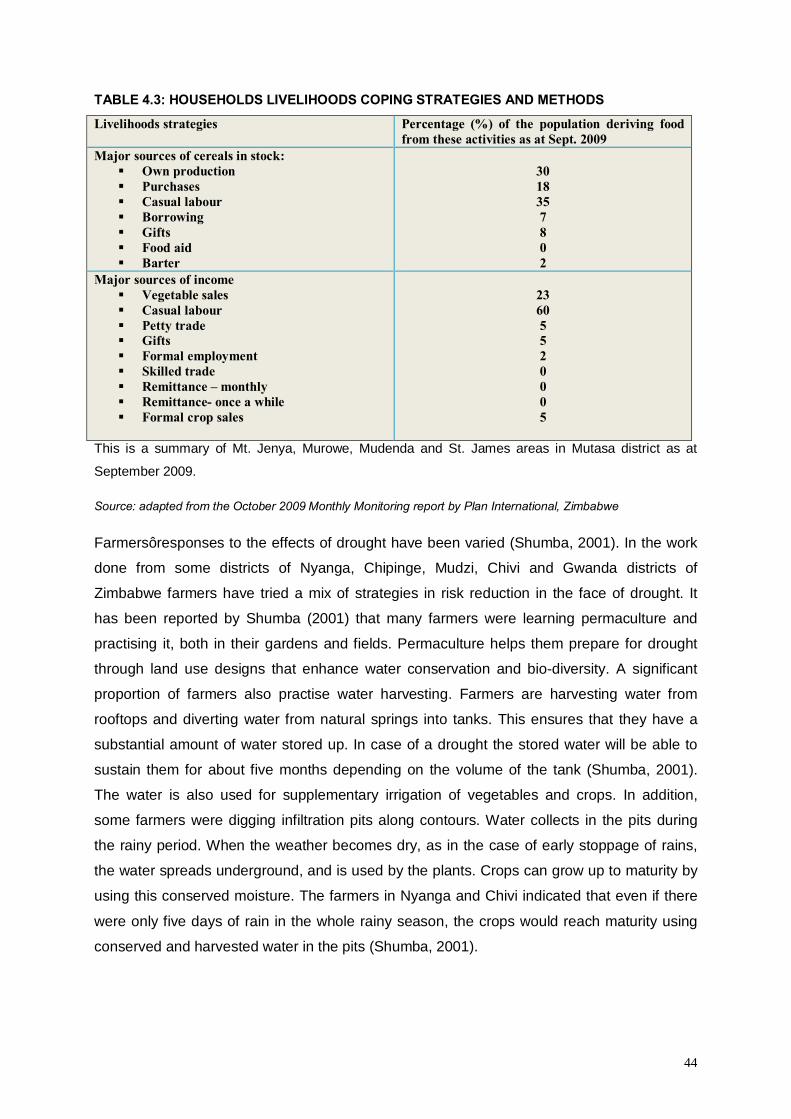
44
TABLE 4.3: HOUSEHOLDS LIVELIHOODS COPING STRATEGIES AND METHODS
Livelihoods strategies Percentage (%) of the population deriving food from these activities as at Sept. 2009
Major sources of cereals in stock: § Own production § Purchases § Casual labour § Borrowing § Gifts § Food aid § Barter
30 18 35 7 8 0 2
Major sources of income § Vegetable sales § Casual labour § Petty trade § Gifts § Formal employment § Skilled trade § Remittance – monthly § Remittance- once a while § Formal crop sales
23 60 5 5 2 0 0 0 5
This is a summary of Mt. Jenya, Murowe, Mudenda and St. James areas in Mutasa district as at
September 2009.
Source: adapted from the October 2009 Monthly Monitoring report by Plan International, Zimbabwe
Farmers’ responses to the effects of drought have been varied (Shumba, 2001). In the work
done from some districts of Nyanga, Chipinge, Mudzi, Chivi and Gwanda districts of
Zimbabwe farmers have tried a mix of strategies in risk reduction in the face of drought. It
has been reported by Shumba (2001) that many farmers were learning permaculture and
practising it, both in their gardens and fields. Permaculture helps them prepare for drought
through land use designs that enhance water conservation and bio-diversity. A significant
proportion of farmers also practise water harvesting. Farmers are harvesting water from
rooftops and diverting water from natural springs into tanks. This ensures that they have a
substantial amount of water stored up. In case of a drought the stored water will be able to
sustain them for about five months depending on the volume of the tank (Shumba, 2001).
The water is also used for supplementary irrigation of vegetables and crops. In addition,
some farmers were digging infiltration pits along contours. Water collects in the pits during
the rainy period. When the weather becomes dry, as in the case of early stoppage of rains,
the water spreads underground, and is used by the plants. Crops can grow up to maturity by
using this conserved moisture. The farmers in Nyanga and Chivi indicated that even if there
were only five days of rain in the whole rainy season, the crops would reach maturity using
conserved and harvested water in the pits (Shumba, 2001).
45
It was also noted that some households had a specific granary stocked with grain (sorghum,
millets, and maize for a shorter period of time), especially those resistant to post harvest
pests. This granary was kept untouched and out of bounds for children (Shumba, 2001).
Only the head of the household was allowed into it. Some households were slowly discarding
the idea of growing maize as the main crop. They were shifting to the use of traditional crops
for example small grains, that it, millets, sorghums.
These crops are drought resistant and therefore give a good yield even with very little rain.
Farmers are also looking for indigenous maize varieties (i.e. Kalahari) that are short season,
high yielding, drought tolerant and post-harvest pest resistant. An indigenous finger millet
variety, chiraufe, is also planted in drought years. Nyamunhororo, a cucurbit, is popular as
the small pumpkin ripens fast and saves people from possible starvation. It is not only
drought resistant, but can survive in poor soils. The early maturing cowpea variety Vigna
unguiculata is also planted in drought seasons.
Models developed by Watts (1983) and USAID (1999) on vulnerability assessments sum up
findings reported by a numerous researchers. Coping strategies by individuals or households
are influenced by endowments in terms of resources or lack of them. Figure 4.4 shows the
relation between the vulnerability level and coping strategies of households in response to
shocks and hazards such as drought.
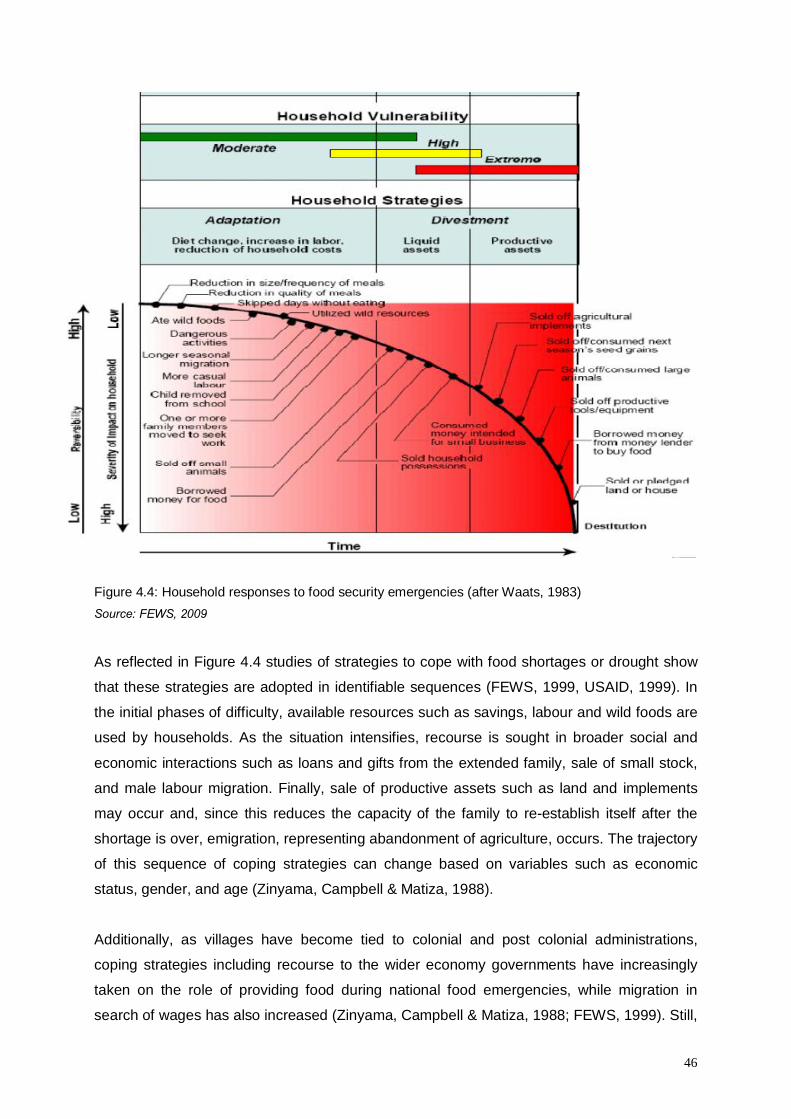
46
Figure 4.4: Household responses to food security emergencies (after Waats, 1983) Source: FEWS, 2009
As reflected in Figure 4.4 studies of strategies to cope with food shortages or drought show
that these strategies are adopted in identifiable sequences (FEWS, 1999, USAID, 1999). In
the initial phases of difficulty, available resources such as savings, labour and wild foods are
used by households. As the situation intensifies, recourse is sought in broader social and
economic interactions such as loans and gifts from the extended family, sale of small stock,
and male labour migration. Finally, sale of productive assets such as land and implements
may occur and, since this reduces the capacity of the family to re-establish itself after the
shortage is over, emigration, representing abandonment of agriculture, occurs. The trajectory
of this sequence of coping strategies can change based on variables such as economic
status, gender, and age (Zinyama, Campbell & Matiza, 1988).
Additionally, as villages have become tied to colonial and post colonial administrations,
coping strategies including recourse to the wider economy governments have increasingly
taken on the role of providing food during national food emergencies, while migration in
search of wages has also increased (Zinyama, Campbell & Matiza, 1988; FEWS, 1999). Still,
47
traditional household coping strategies continue to be of importance (FEWS, 1999; USAID,
1999).These traditional strategies have environmental, economic and social components.
Environmentally based strategies include ecological diversification (vlei and stream bank
cultivation), gathering of wild fruits, hunting and fishing, strict control of access to water and
pasture, and in case of herders, mobility. Economic strategies to cope with food shortages
include increased trade, production of crafts, brewing beer for sale, sale of livestock and
household effects, growing drought-resistant crops, storage of foods, and, finally, migration.
Social strategies include the increased borrowing of food through extended family links,
prayer to rainmakers, raiding, sharing, reducing meals, splitting herds, arranging marriages,
begging and finally stealing (Zinyama, Campbell & Matiza, 1988; Wisner, et al., 2004).
Households are impacted differently by the same coping strategies (Hutchinson, 1992). The
resiliency or the ability of any group or household to recover from adverse change is a
function of several factors as shown in Figure 4.5. It is determined by the range of options
available to exploit. For example, if the household is situated near a major urban centre or
where there is viable commercial agriculture, opportunities for outside employment stand to
be high (Zinyama, Campbell & Matiza, 1988; Hutchinson, 1992; USAID, 1999). Again, if the
household is located close to a busy road on its own, this scenario stands to facilitate
movement to distant areas where more alternatives exist for income generation.
Another factor that conditions the ability of a group or household to cope is the level of
resources upon which the group or household can draw. The comparison between different
households is illustrated in Figure 4.5 (Hutchinson, 1992; FEWS, 1999). This graph clearly
demonstrates the following scenarios: Firstly, households with different endowment levels
will cross critical thresholds at different times. Secondly, some comparatively better
resourced households may actually increase their resource base during emergencies by way
of purchasing of assets through exploiting those already in distress disposal of assets
especially from households constituting the of lower economic classes. Thirdly, different
households may belong to different social networks that work favourably in terms of resource
access. It may come in the form of kinship to a well resourced and extended family, clan or
tribal group that remains cohesive and supportive to its members during times of shocks.
Fourthly, the same coping strategies may have different impact to different households
depending on the resource base of a household. Put differently, disposal of small animals will
have no impact on a rich household, but the loss of household resources may substantially
increase the vulnerability to food insecurity of a poorer household as it may fail to recharge
its stock in future as opportunities arise. Lastly, and not surprisingly, some groups may enjoy
access to greater political power or class/caste positions than others, which permits them to
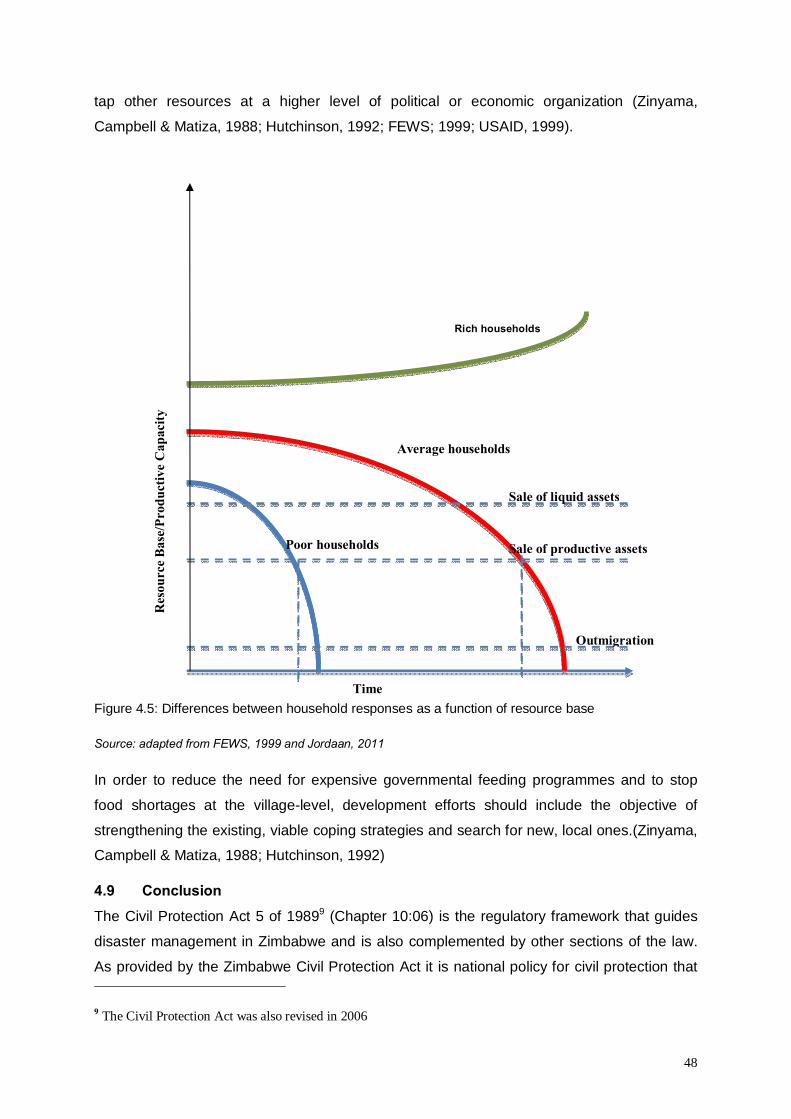
48
tap other resources at a higher level of political or economic organization (Zinyama,
Campbell & Matiza, 1988; Hutchinson, 1992; FEWS; 1999; USAID, 1999).
Rich households
Figure 4.5: Differences between household responses as a function of resource base
Source: adapted from FEWS, 1999 and Jordaan, 2011
In order to reduce the need for expensive governmental feeding programmes and to stop
food shortages at the village-level, development efforts should include the objective of
strengthening the existing, viable coping strategies and search for new, local ones.(Zinyama,
Campbell & Matiza, 1988; Hutchinson, 1992)
4.9 Conclusion The Civil Protection Act 5 of 19899 (Chapter 10:06) is the regulatory framework that guides
disaster management in Zimbabwe and is also complemented by other sections of the law.
As provided by the Zimbabwe Civil Protection Act it is national policy for civil protection that
9 The Civil Protection Act was also revised in 2006
Average households
Poor households
Sale of liquid assets
Sale of productive assets
Outmigration
Res
ourc
e B
ase/
Prod
uctiv
e C
apac
ity
Time
49
every citizen of Zimbabwe should assist where possible to avert or limit the effects of
disaster. There are many institutions/organizations that are involved from the national up to
grassroots level. While disaster committees exist from national to district level, the same
committees are not vibrant at village level if at all. Because drought is a recurrent event,
copying strategies are fast improving in the communities. However, some coping strategies
may take forms some of which may even be proscribed and discouraged by members of a
social group or gender. Literature on coping reflects an identifiable sequence of coping
strategies adopted by households. Households start with non erosive to erosive ones as the
drought severity intensifies. The following chapter presents findings of the study yet, the
discussion of results will be done in Chapter 6.
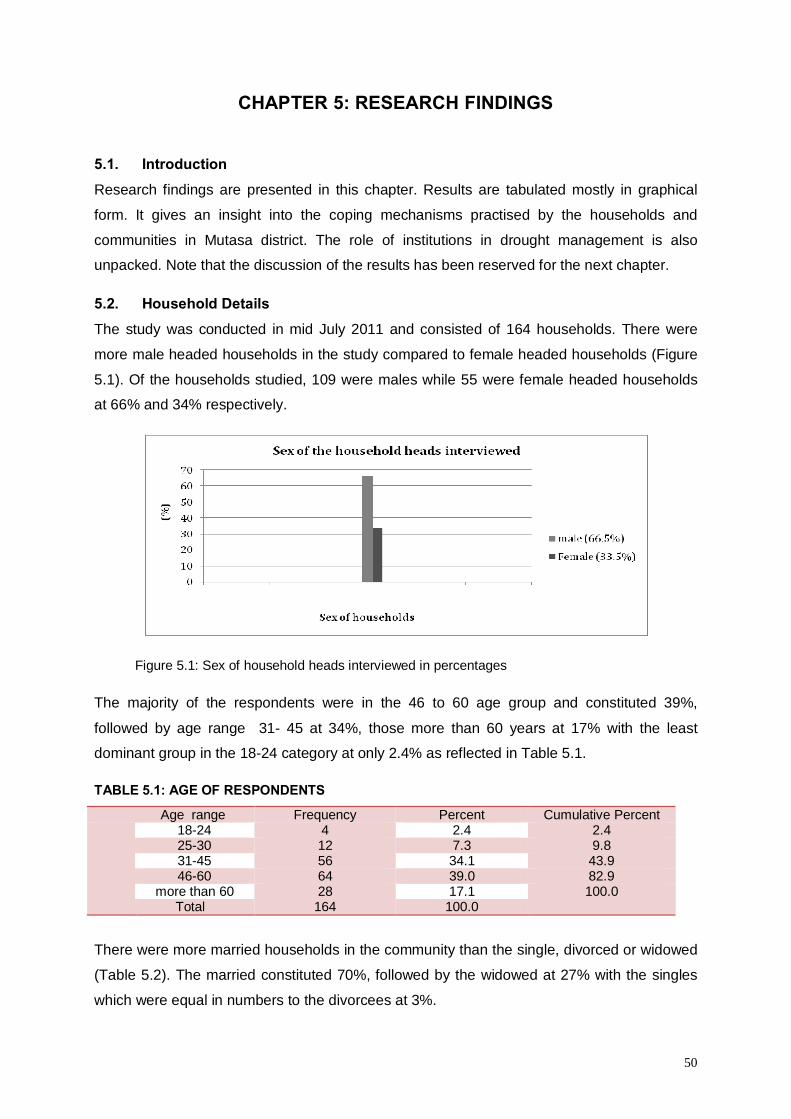
50
CHAPTER 5: RESEARCH FINDINGS
5.1. Introduction Research findings are presented in this chapter. Results are tabulated mostly in graphical
form. It gives an insight into the coping mechanisms practised by the households and
communities in Mutasa district. The role of institutions in drought management is also
unpacked. Note that the discussion of the results has been reserved for the next chapter.
5.2. Household Details The study was conducted in mid July 2011 and consisted of 164 households. There were
more male headed households in the study compared to female headed households (Figure
5.1). Of the households studied, 109 were males while 55 were female headed households
at 66% and 34% respectively.
Figure 5.1: Sex of household heads interviewed in percentages
The majority of the respondents were in the 46 to 60 age group and constituted 39%,
followed by age range 31- 45 at 34%, those more than 60 years at 17% with the least
dominant group in the 18-24 category at only 2.4% as reflected in Table 5.1.
TABLE 5.1: AGE OF RESPONDENTS
Age range Frequency Percent Cumulative Percent 18-24 4 2.4 2.4
25-30 12 7.3 9.8 31-45 56 34.1 43.9 46-60 64 39.0 82.9
more than 60 28 17.1 100.0 Total 164 100.0
There were more married households in the community than the single, divorced or widowed
(Table 5.2). The married constituted 70%, followed by the widowed at 27% with the singles
which were equal in numbers to the divorcees at 3%.
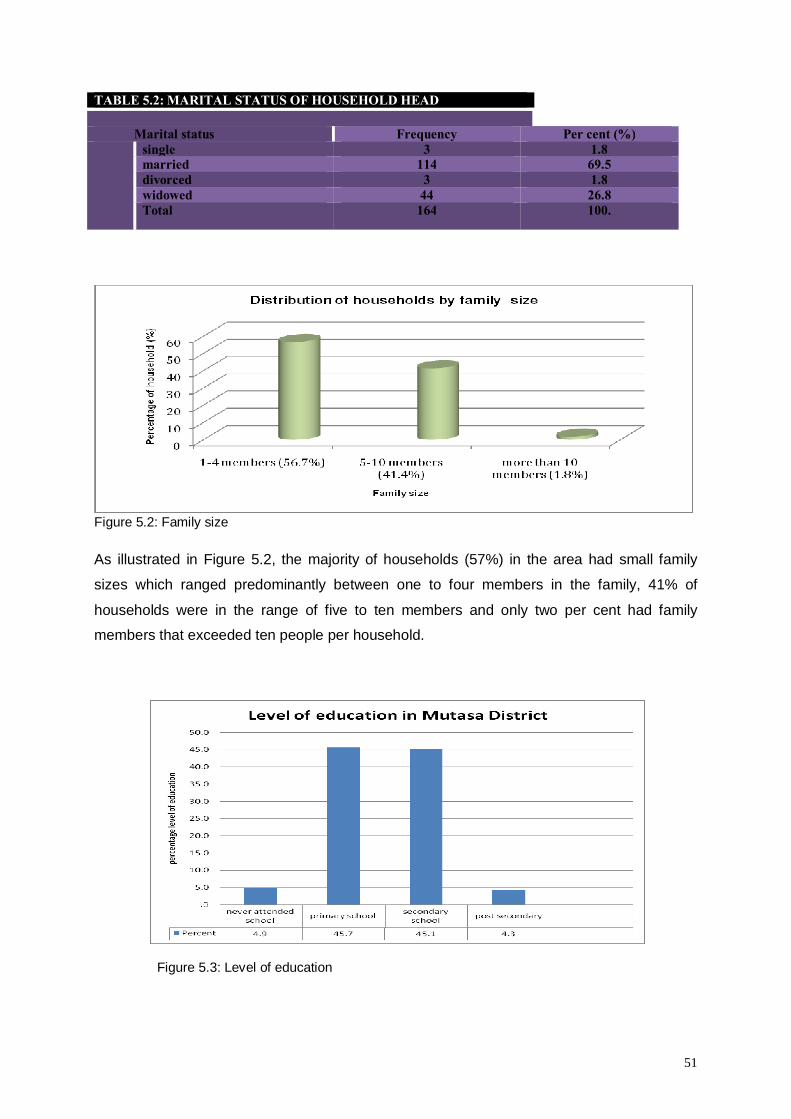
51
TABLE 5.2: MARITAL STATUS OF HOUSEHOLD HEAD Marital status Frequency Per cent (%) single 3 1.8
married 114 69.5 divorced 3 1.8 widowed 44 26.8 Total 164 100.
Figure 5.2: Family size
As illustrated in Figure 5.2, the majority of households (57%) in the area had small family
sizes which ranged predominantly between one to four members in the family, 41% of
households were in the range of five to ten members and only two per cent had family
members that exceeded ten people per household.
Figure 5.3: Level of education
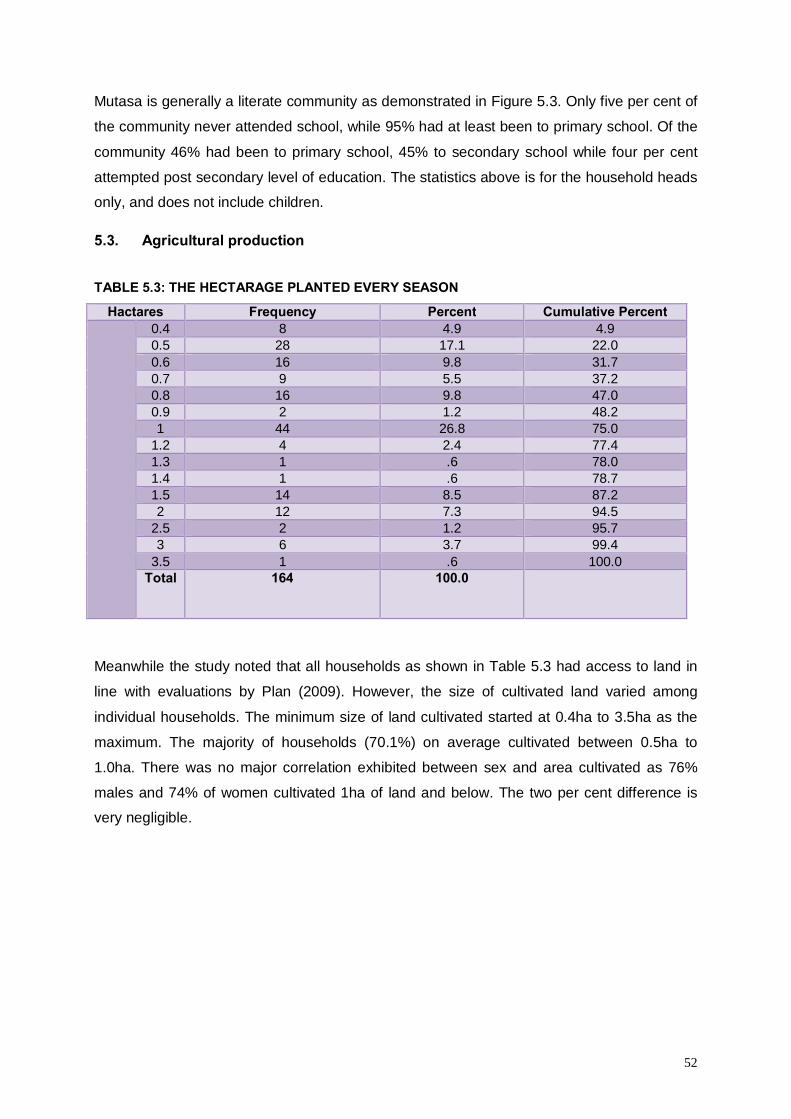
52
Mutasa is generally a literate community as demonstrated in Figure 5.3. Only five per cent of
the community never attended school, while 95% had at least been to primary school. Of the
community 46% had been to primary school, 45% to secondary school while four per cent
attempted post secondary level of education. The statistics above is for the household heads
only, and does not include children.
5.3. Agricultural production TABLE 5.3: THE HECTARAGE PLANTED EVERY SEASON
Hactares Frequency Percent Cumulative Percent 0.4 8 4.9 4.9
0.5 28 17.1 22.0 0.6 16 9.8 31.7 0.7 9 5.5 37.2 0.8 16 9.8 47.0 0.9 2 1.2 48.2 1 44 26.8 75.0
1.2 4 2.4 77.4 1.3 1 .6 78.0 1.4 1 .6 78.7 1.5 14 8.5 87.2 2 12 7.3 94.5
2.5 2 1.2 95.7 3 6 3.7 99.4
3.5 1 .6 100.0 Total 164 100.0
Meanwhile the study noted that all households as shown in Table 5.3 had access to land in
line with evaluations by Plan (2009). However, the size of cultivated land varied among
individual households. The minimum size of land cultivated started at 0.4ha to 3.5ha as the
maximum. The majority of households (70.1%) on average cultivated between 0.5ha to
1.0ha. There was no major correlation exhibited between sex and area cultivated as 76%
males and 74% of women cultivated 1ha of land and below. The two per cent difference is
very negligible.
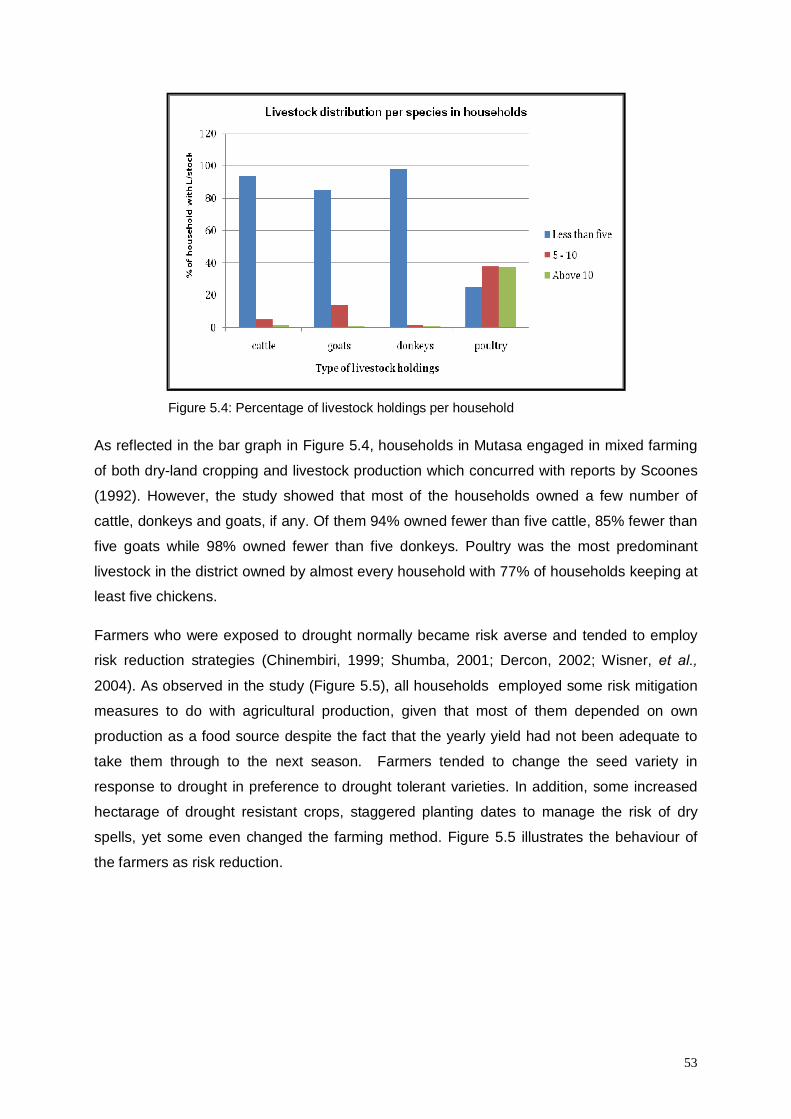
53
Figure 5.4: Percentage of livestock holdings per household
As reflected in the bar graph in Figure 5.4, households in Mutasa engaged in mixed farming
of both dry-land cropping and livestock production which concurred with reports by Scoones
(1992). However, the study showed that most of the households owned a few number of
cattle, donkeys and goats, if any. Of them 94% owned fewer than five cattle, 85% fewer than
five goats while 98% owned fewer than five donkeys. Poultry was the most predominant
livestock in the district owned by almost every household with 77% of households keeping at
least five chickens.
Farmers who were exposed to drought normally became risk averse and tended to employ
risk reduction strategies (Chinembiri, 1999; Shumba, 2001; Dercon, 2002; Wisner, et al.,
2004). As observed in the study (Figure 5.5), all households employed some risk mitigation
measures to do with agricultural production, given that most of them depended on own
production as a food source despite the fact that the yearly yield had not been adequate to
take them through to the next season. Farmers tended to change the seed variety in
response to drought in preference to drought tolerant varieties. In addition, some increased
hectarage of drought resistant crops, staggered planting dates to manage the risk of dry
spells, yet some even changed the farming method. Figure 5.5 illustrates the behaviour of
the farmers as risk reduction.
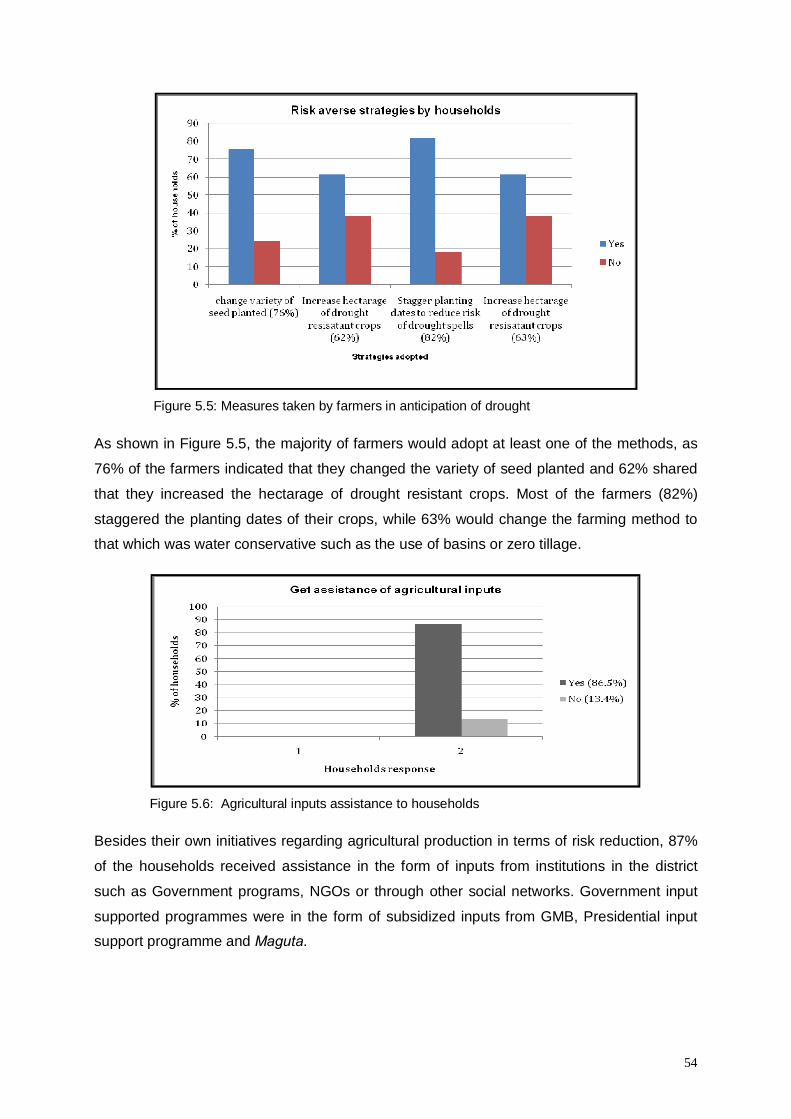
54
Figure 5.5: Measures taken by farmers in anticipation of drought
As shown in Figure 5.5, the majority of farmers would adopt at least one of the methods, as
76% of the farmers indicated that they changed the variety of seed planted and 62% shared
that they increased the hectarage of drought resistant crops. Most of the farmers (82%)
staggered the planting dates of their crops, while 63% would change the farming method to
that which was water conservative such as the use of basins or zero tillage.
Figure 5.6: Agricultural inputs assistance to households
Besides their own initiatives regarding agricultural production in terms of risk reduction, 87%
of the households received assistance in the form of inputs from institutions in the district
such as Government programs, NGOs or through other social networks. Government input
supported programmes were in the form of subsidized inputs from GMB, Presidential input
support programme and Maguta.
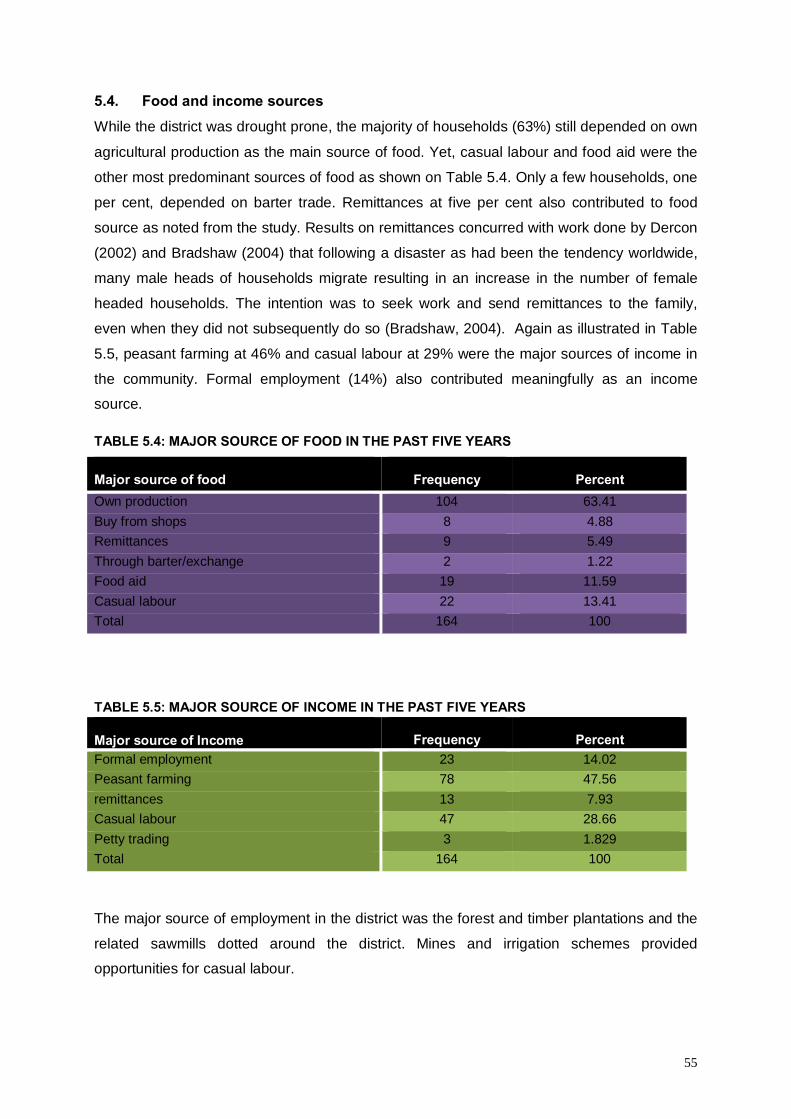
55
5.4. Food and income sources While the district was drought prone, the majority of households (63%) still depended on own
agricultural production as the main source of food. Yet, casual labour and food aid were the
other most predominant sources of food as shown on Table 5.4. Only a few households, one
per cent, depended on barter trade. Remittances at five per cent also contributed to food
source as noted from the study. Results on remittances concurred with work done by Dercon
(2002) and Bradshaw (2004) that following a disaster as had been the tendency worldwide,
many male heads of households migrate resulting in an increase in the number of female
headed households. The intention was to seek work and send remittances to the family,
even when they did not subsequently do so (Bradshaw, 2004). Again as illustrated in Table
5.5, peasant farming at 46% and casual labour at 29% were the major sources of income in
the community. Formal employment (14%) also contributed meaningfully as an income
source.
TABLE 5.4: MAJOR SOURCE OF FOOD IN THE PAST FIVE YEARS Major source of food
Frequency
Percent
Own production 104 63.41 Buy from shops 8 4.88 Remittances 9 5.49 Through barter/exchange 2 1.22 Food aid 19 11.59 Casual labour 22 13.41 Total 164 100
TABLE 5.5: MAJOR SOURCE OF INCOME IN THE PAST FIVE YEARS
Major source of Income
Frequency
Percent Formal employment 23 14.02 Peasant farming 78 47.56 remittances 13 7.93 Casual labour 47 28.66 Petty trading 3 1.829 Total 164 100
The major source of employment in the district was the forest and timber plantations and the
related sawmills dotted around the district. Mines and irrigation schemes provided
opportunities for casual labour.
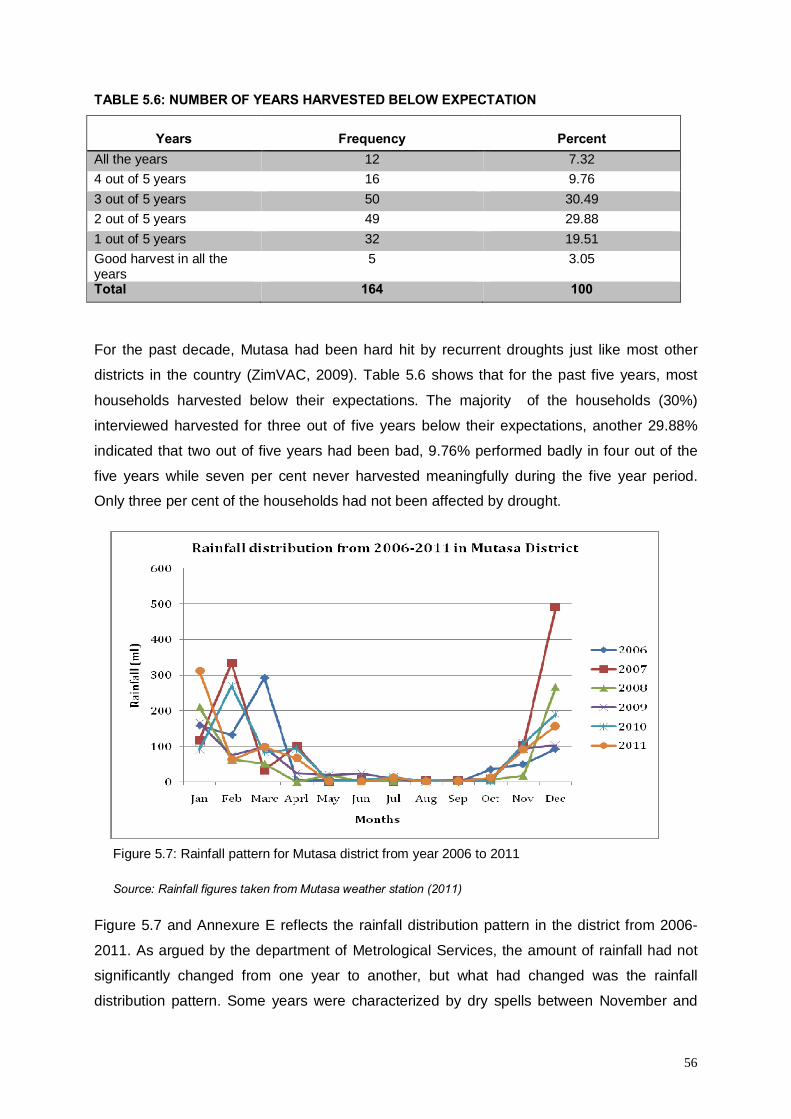
56
TABLE 5.6: NUMBER OF YEARS HARVESTED BELOW EXPECTATION
Years
Frequency
Percent
All the years 12 7.32 4 out of 5 years 16 9.76 3 out of 5 years 50 30.49 2 out of 5 years 49 29.88 1 out of 5 years 32 19.51 Good harvest in all the years
5 3.05
Total 164 100
For the past decade, Mutasa had been hard hit by recurrent droughts just like most other
districts in the country (ZimVAC, 2009). Table 5.6 shows that for the past five years, most
households harvested below their expectations. The majority of the households (30%)
interviewed harvested for three out of five years below their expectations, another 29.88%
indicated that two out of five years had been bad, 9.76% performed badly in four out of the
five years while seven per cent never harvested meaningfully during the five year period.
Only three per cent of the households had not been affected by drought.
Figure 5.7: Rainfall pattern for Mutasa district from year 2006 to 2011
Source: Rainfall figures taken from Mutasa weather station (2011)
Figure 5.7 and Annexure E reflects the rainfall distribution pattern in the district from 2006-
2011. As argued by the department of Metrological Services, the amount of rainfall had not
significantly changed from one year to another, but what had changed was the rainfall
distribution pattern. Some years were characterized by dry spells between November and
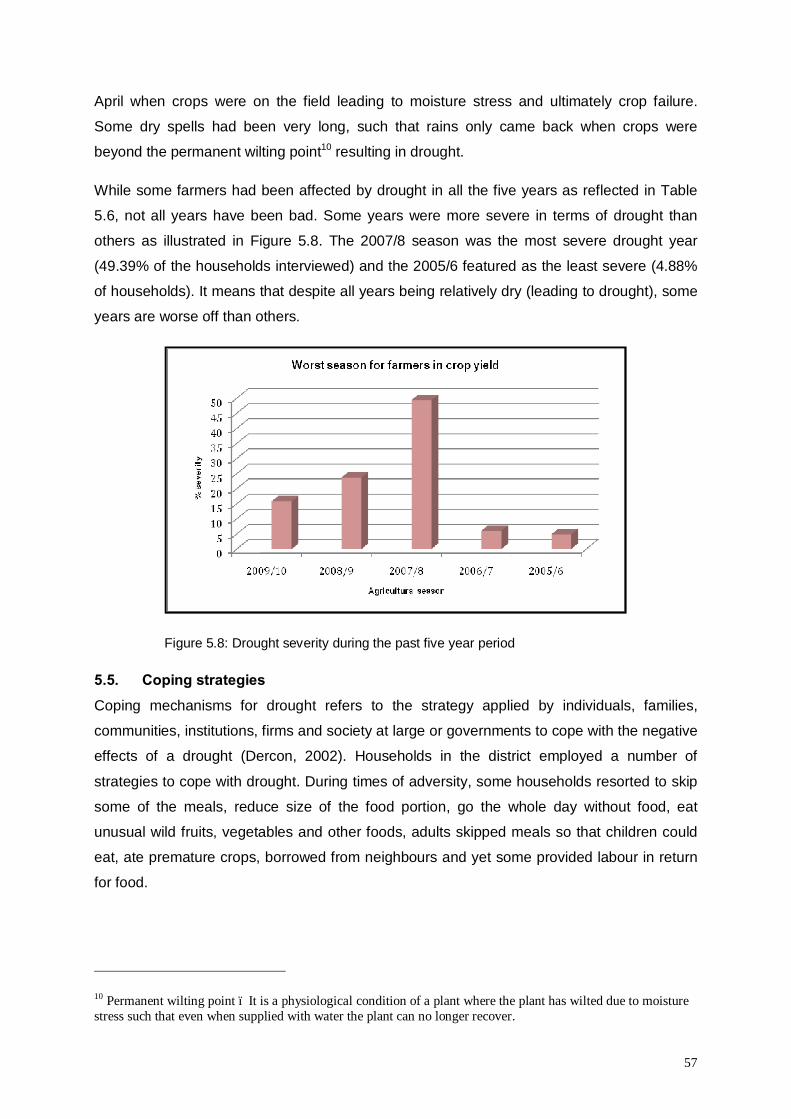
57
April when crops were on the field leading to moisture stress and ultimately crop failure.
Some dry spells had been very long, such that rains only came back when crops were
beyond the permanent wilting point10 resulting in drought.
While some farmers had been affected by drought in all the five years as reflected in Table
5.6, not all years have been bad. Some years were more severe in terms of drought than
others as illustrated in Figure 5.8. The 2007/8 season was the most severe drought year
(49.39% of the households interviewed) and the 2005/6 featured as the least severe (4.88%
of households). It means that despite all years being relatively dry (leading to drought), some
years are worse off than others.
Figure 5.8: Drought severity during the past five year period
5.5. Coping strategies Coping mechanisms for drought refers to the strategy applied by individuals, families,
communities, institutions, firms and society at large or governments to cope with the negative
effects of a drought (Dercon, 2002). Households in the district employed a number of
strategies to cope with drought. During times of adversity, some households resorted to skip
some of the meals, reduce size of the food portion, go the whole day without food, eat
unusual wild fruits, vegetables and other foods, adults skipped meals so that children could
eat, ate premature crops, borrowed from neighbours and yet some provided labour in return
for food.
10 Permanent wilting point – It is a physiological condition of a plant where the plant has wilted due to moisture stress such that even when supplied with water the plant can no longer recover.
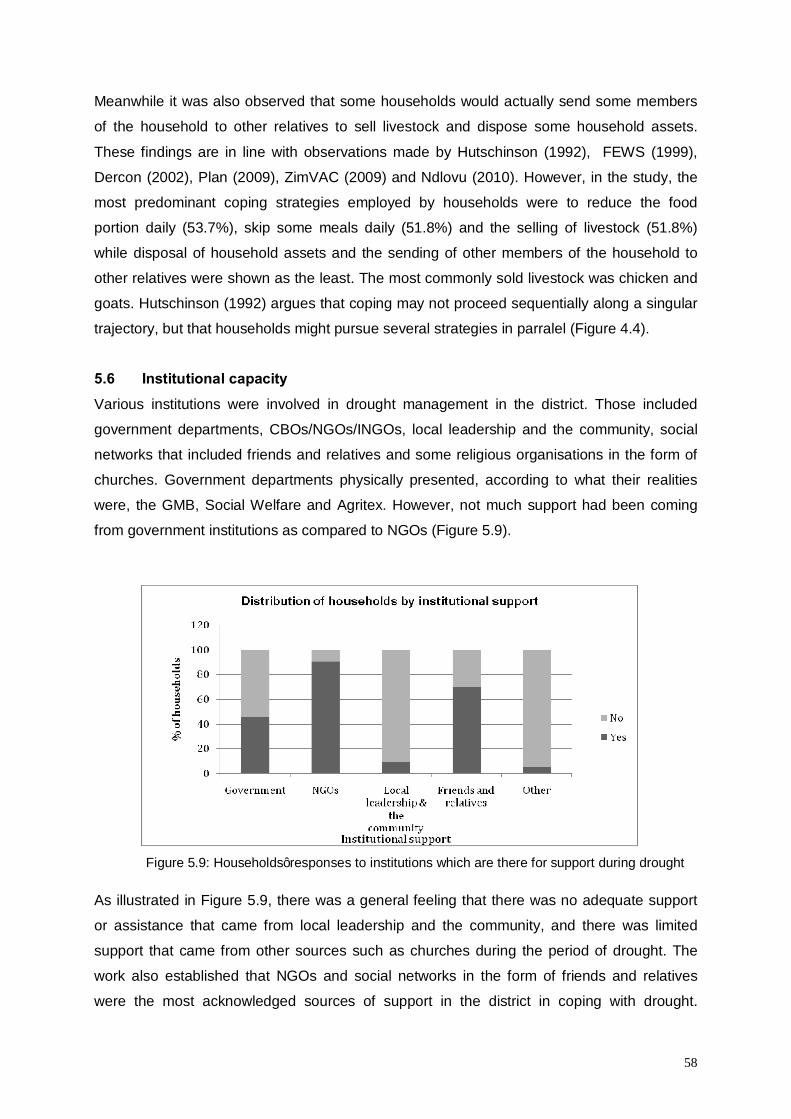
58
Meanwhile it was also observed that some households would actually send some members
of the household to other relatives to sell livestock and dispose some household assets.
These findings are in line with observations made by Hutschinson (1992), FEWS (1999),
Dercon (2002), Plan (2009), ZimVAC (2009) and Ndlovu (2010). However, in the study, the
most predominant coping strategies employed by households were to reduce the food
portion daily (53.7%), skip some meals daily (51.8%) and the selling of livestock (51.8%)
while disposal of household assets and the sending of other members of the household to
other relatives were shown as the least. The most commonly sold livestock was chicken and
goats. Hutschinson (1992) argues that coping may not proceed sequentially along a singular
trajectory, but that households might pursue several strategies in parralel (Figure 4.4).
5.6 Institutional capacity Various institutions were involved in drought management in the district. Those included
government departments, CBOs/NGOs/INGOs, local leadership and the community, social
networks that included friends and relatives and some religious organisations in the form of
churches. Government departments physically presented, according to what their realities
were, the GMB, Social Welfare and Agritex. However, not much support had been coming
from government institutions as compared to NGOs (Figure 5.9).
Figure 5.9: Households’ responses to institutions which are there for support during drought
As illustrated in Figure 5.9, there was a general feeling that there was no adequate support
or assistance that came from local leadership and the community, and there was limited
support that came from other sources such as churches during the period of drought. The
work also established that NGOs and social networks in the form of friends and relatives
were the most acknowledged sources of support in the district in coping with drought.
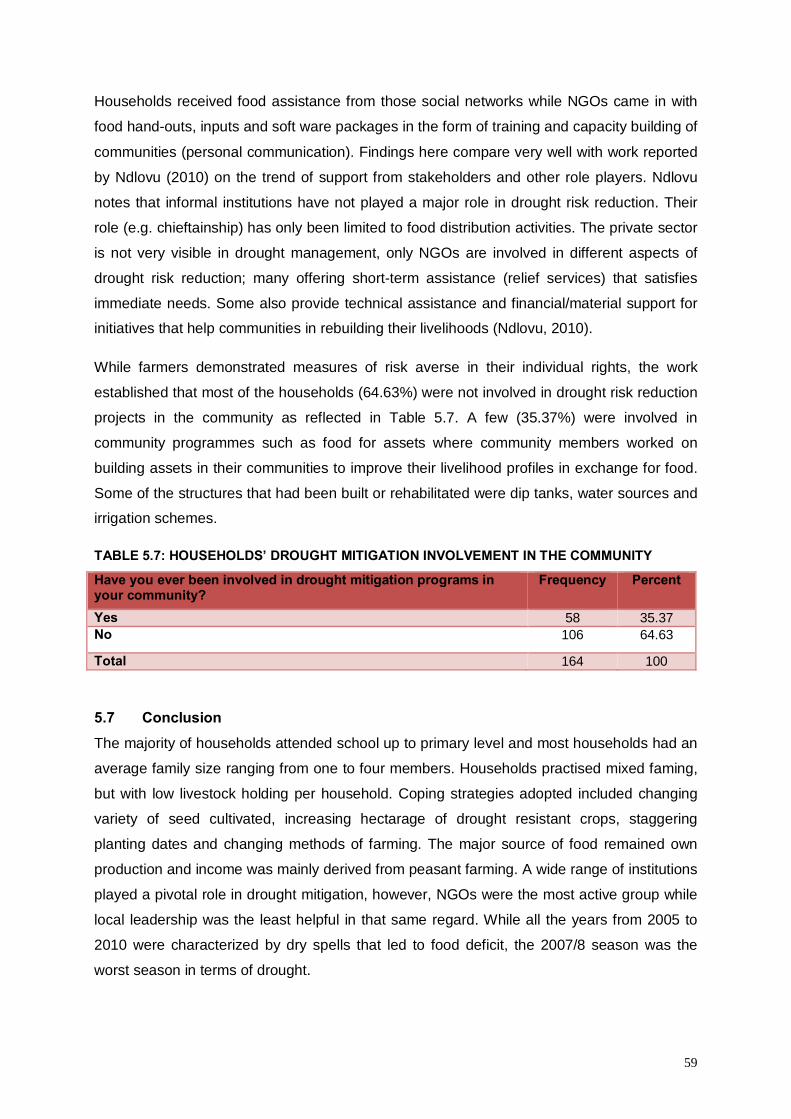
59
Households received food assistance from those social networks while NGOs came in with
food hand-outs, inputs and soft ware packages in the form of training and capacity building of
communities (personal communication). Findings here compare very well with work reported
by Ndlovu (2010) on the trend of support from stakeholders and other role players. Ndlovu
notes that informal institutions have not played a major role in drought risk reduction. Their
role (e.g. chieftainship) has only been limited to food distribution activities. The private sector
is not very visible in drought management, only NGOs are involved in different aspects of
drought risk reduction; many offering short-term assistance (relief services) that satisfies
immediate needs. Some also provide technical assistance and financial/material support for
initiatives that help communities in rebuilding their livelihoods (Ndlovu, 2010).
While farmers demonstrated measures of risk averse in their individual rights, the work
established that most of the households (64.63%) were not involved in drought risk reduction
projects in the community as reflected in Table 5.7. A few (35.37%) were involved in
community programmes such as food for assets where community members worked on
building assets in their communities to improve their livelihood profiles in exchange for food.
Some of the structures that had been built or rehabilitated were dip tanks, water sources and
irrigation schemes.
TABLE 5.7: HOUSEHOLDS’ DROUGHT MITIGATION INVOLVEMENT IN THE COMMUNITY
Have you ever been involved in drought mitigation programs in your community?
Frequency Percent
Yes 58 35.37 No 106 64.63
Total 164 100
5.7 Conclusion The majority of households attended school up to primary level and most households had an
average family size ranging from one to four members. Households practised mixed faming,
but with low livestock holding per household. Coping strategies adopted included changing
variety of seed cultivated, increasing hectarage of drought resistant crops, staggering
planting dates and changing methods of farming. The major source of food remained own
production and income was mainly derived from peasant farming. A wide range of institutions
played a pivotal role in drought mitigation, however, NGOs were the most active group while
local leadership was the least helpful in that same regard. While all the years from 2005 to
2010 were characterized by dry spells that led to food deficit, the 2007/8 season was the
worst season in terms of drought.
60
CHAPTER 6: RESULTS DISCUSSION
6.1. Introduction In this chapter an analysis of findings is done. Results are discussed and further compared to
literature and research results from other scholars. Interestingly, results compare well with
other published literature. Results further confirm the hypothesis made by the researcher that
the community has developed copying strategies to manage drought.
6.2 Household details The study noted that all households (Table 5.1) had access to land although the size of
cultivated land varied among individual households. Since the majority of (57%) had small
family sizes, labour could be a limiting factor in agricultural production. However, the
community has strength in literacy levels (Figure 5.3). Education is a vital vehicle for access
to information and technology. It is paramount to development as it enables people to
acquire knowledge and skills to make informed decisions about their social, economic and
political situations. Literacy level in this study was considered a proxy to enhanced capacity
of people to make rational decisions on agricultural and non agricultural development as well
as assimilate knowledge and skills to improve their livelihoods.
6.3 Basic livelihood practices Livelihoods in Mutasa district are mostly agro based and the major source of food is own
production through agricultural activities, food aid and casual labour while their income
sources are mainly peasant farming and casual labour. Given the agro-centrality of their
livelihoods in an environment that is drought prone, the households are therefore vulnerable
to the erratic weather pattern obtaining in the district. Andear (2009) reports that about 70%
of Zimbabwe’s population derives its livelihood from subsistence agriculture and other rural
activities, but these livelihoods are threatened by climate change. The agriculture sector’s
reliance on seasonal, rain-fed cultivation makes the sector particularly vulnerable to climate
variability and change (Andear, 2009). While the amount of rainfall in any given year in the
decade may not have changed per se, it is the erratic rainfall distribution that has led to
agricultural drought.
The study also revealed an interesting scenario on household demographics. As illustrated in
Figure 5.5, the majority of households (57%) have few family members ranging from one to
four members. Limiting labour could also affect agricultural production. It was noted in the
study that migration was one coping strategy employed by households in adversity, which
was in line with work by Bradshaw (2004) who indicated that in adversity the economic active
61
age group and male head of households migrate resulting in an increase in the number of
female headed households.
The severity of drought had been worsened by the shortage of draft power. The study
revealed that the majority of households increased hectarage of drought resistant crops in
anticipation to drought (Figure 5.5) yet the majority of households (56.7%) had an average
household size of one to four members as shown in Figure 5.2. Migration, due to the
economic decline and the devastating impact of HIV and Aids on the most economically
active age group, has robbed farmers of the much needed household labour. Assuming the
community is also affected by HIV as are other communities in Zimbabwe, the impact of HIV,
itself a “creeping emergency” has progressively contributed to the severity of droughts.
Poorly managed responses to HIV/AIDS have contributed to vulnerability at household level.
In this context there is increasing awareness that the typical humanitarian response of
providing food aid will not solve this problem because the underlying causes of HIV/Aids
pandemic do not make these droughts normal ones. There is no end to it because people
are too weak to plant, cultivate their lands and even harvest, so this challenge may not go
away with improved weather (Holloway, 2003).
Meanwhile, the study demonstrated a high degree of risk averseness among the farmers.
Figure 5.6 showed that farmers in the district employed various risk mitigation and coping
strategies. Farmers developed a number of strategies ranging from varying the seed variety
– taking up maize resistant cultivars, increasing hectarage of the drought resistant crops,
intercropping, and stagger planting dates, and apply conservation agriculture to mixed
farming of crops and livestock.
These strategies compare well with findings by numerous development practitioners and
researchers. Amani and Maro (1991) argue that to improve food security in food deficit
areas, the production of drought resistant crops such as sorghum and millet needs to be
encouraged. This strategy must be combined with a strategy to increase household income
through off farm employment and production of high value crops. Although sorghum and
millet are more drought resistant, improved maize production technologies offer higher
returns, so advice to grow unimproved millet and sorghum has threatened the credibility of
extension workers. Thus initiatives to promote sorghum and millet cannot be based solely on
food security objectives, but must arise out of the recognition of these crops as industrially
important. Maize preference is a result of government support in terms of research,
extension, credits, markets, infrastructure and processing of this crop at national level due to
urban and industrial demands for maize (Rorhbach & Mwila, 1992).
62
The study also established that farmers changed seed variety in preparation for drought.
87% of the farmers got the seed through programmes running in the district. The seed was
not readily available and when available, it was way above the reach of many farmers
because it was very expensive. Seed was normally supplied for free by donor agencies or at
subsidized rate by a lot of government supported inputs programmes. These included the
GMB (a parastatal) which provided maize seed and fertilizer to farmers during the 2010/2011
agricultural season at US$5.00/10kg and US$7.00/50kg compared to market rates of
US$22.00/10kg and US$30.00/50kg respectively. There have been other programmes such
as Maguta and the Presidential input support programmes all intended to assist the farmer in
terms of access to inputs (personal comms.). Regrettably, the supply of inputs were done
very late, way past the recommended planting period11 for the crop due to planning, lack of it
or both in addition to limited seed varieties. At times, the distribution was marred by political
controversy with those who had higher political offices/muscle looting most of the inputs at
the expense of the general populace (personal comms.) Farmers had to choose from what
was available and mostly maize had been the seed of choice in government led
programmes. NGOs were very active in the supply of agricultural inputs in the district either
through physical distribution or the voucher and seed fair approach. NGOs such as Africare,
Plan International and GTZ were mentioned as the most active in this regard. However, the
biggest challenge was the sustainability of these inputs in the long run, especially from
NGOs.
As observed by Dercon (2002), diversification of production is regarded as one most
important risk-averse strategy with the farming people. Usually their production involves
mixed cropping, intercropping, the cultivation on non-staple root crops and use of kitchen
gardens. This strategy provides a surplus in good years since it is normally planned on the
basis of meeting subsistence needs in bad years (Wisner, et al., 2004). It must be noticed
that diversifying production makes use of environmental variations and provides the best
chance of an optimum yield under all variations of weather and plant pests.
The study revealed that farmers owned livestock, which were a source of income during
drought. When livestock were impacted by drought, the resulting depression in productivity in
rural areas dependent on animals for traction, nutrition and revenues, lasted well beyond the
term of the drought itself (Blackburn, et al., 1993). Livestock were sold to middlemen or local
butcheries in times of stress to smoothen food consumption patterns, but the majority owned
11 Recommended planting period for maize in the district is between November to mid January
63
mainly poultry, and with a few who owned cattle. However, a relatively large proportion of
households often did not own any. This practice was in line with observations by Dercon
(2002) who established that only half the households in a sample in Western Tanzania
owned cattle, even though cattle were important in the farming system and for other
traditional reasons.
The major sources of food as reflected in the study are own production, casual labour and
food aid. Actually the majority of households depend on farm activity to produce food in an
environment that is faced with erratic rainfall pattern that has in turn led to recurrent
droughts. The dependency of the majority on own production makes the community more
vulnerable to droughts because their livelihoods by nature of being reliant on rain fed
agriculture will remain fragile. It was established that casual labour while being a positive
source of both food and income, it had mainly been employed as a coping mechanism
following crop failure. Yet food aid only benefited a few categories of people based on
officials’ perception of vulnerability, and was not sustainable.
6.4. Household coping strategies Literature on coping with drought reflects that individual households’ coping mechanisms
follow an identifiable sequence as confirmed by the model developed by Watts in 1983 and
later modified by other scholars (FEWS, 1999).
From the focused group discussions held, it came out strongly backed by literature that
strategies to cope with food shortages or drought were adopted in an identifiable sequence.
In the initial phases of difficulty, tendency to reduce meal portion, skip some meals, adults
skip meals so children can eat, eating of wild fruits and immature crops, go the whole day
without food, sale of labour and use of available resources such as savings, were the most
common. As the situation intensified, resource was sought in broader social and economic
interactions such as sending some members of the family to other relatives, cross border
trading, sale of small stock; barter exchange and even begging were established. Finally,
sale of productive assets, such as large stock, implements and non productive but difficult to
replace assets, such as valuable roofing material in the form of asbestos sheets occur.
Since this reduces the capacity of the family to re-establish itself after the shortage was over,
emigration of the male labour and the economically active age group occurred and in turn
reduced labour for agriculture in the following season (Hutchinson, 1992; USAID, 1999). The
trajectory of this sequence of coping strategies starts with non erosive ones to erosive ones
that make households more vulnerable to feature droughts (FEWS, 1999).
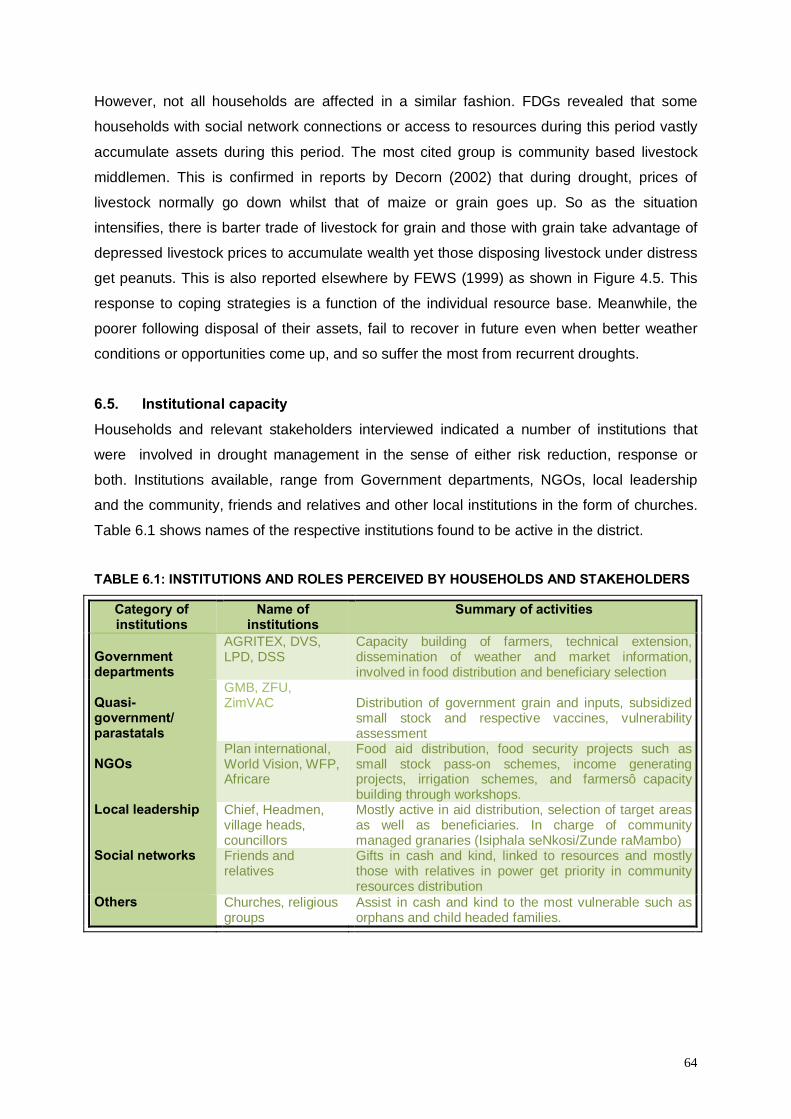
64
However, not all households are affected in a similar fashion. FDGs revealed that some
households with social network connections or access to resources during this period vastly
accumulate assets during this period. The most cited group is community based livestock
middlemen. This is confirmed in reports by Decorn (2002) that during drought, prices of
livestock normally go down whilst that of maize or grain goes up. So as the situation
intensifies, there is barter trade of livestock for grain and those with grain take advantage of
depressed livestock prices to accumulate wealth yet those disposing livestock under distress
get peanuts. This is also reported elsewhere by FEWS (1999) as shown in Figure 4.5. This
response to coping strategies is a function of the individual resource base. Meanwhile, the
poorer following disposal of their assets, fail to recover in future even when better weather
conditions or opportunities come up, and so suffer the most from recurrent droughts.
6.5. Institutional capacity Households and relevant stakeholders interviewed indicated a number of institutions that
were involved in drought management in the sense of either risk reduction, response or
both. Institutions available, range from Government departments, NGOs, local leadership
and the community, friends and relatives and other local institutions in the form of churches.
Table 6.1 shows names of the respective institutions found to be active in the district.
TABLE 6.1: INSTITUTIONS AND ROLES PERCEIVED BY HOUSEHOLDS AND STAKEHOLDERS
Category of institutions
Name of institutions
Summary of activities
Government departments
AGRITEX, DVS, LPD, DSS
Capacity building of farmers, technical extension, dissemination of weather and market information, involved in food distribution and beneficiary selection
Quasi-government/ parastatals
GMB, ZFU, ZimVAC
Distribution of government grain and inputs, subsidized small stock and respective vaccines, vulnerability assessment
NGOs
Plan international, World Vision, WFP, Africare
Food aid distribution, food security projects such as small stock pass-on schemes, income generating projects, irrigation schemes, and farmers’ capacity building through workshops.
Local leadership Chief, Headmen, village heads, councillors
Mostly active in aid distribution, selection of target areas as well as beneficiaries. In charge of community managed granaries (Isiphala seNkosi/Zunde raMambo)
Social networks
Friends and relatives
Gifts in cash and kind, linked to resources and mostly those with relatives in power get priority in community resources distribution
Others Churches, religious groups
Assist in cash and kind to the most vulnerable such as orphans and child headed families.
65
6.5.1. Roles and challenges of government departments The study established that government agencies had the mandate to work with farmers on
agricultural extension services. The departments such as the Department of Social Services
and RDC coordinated other players that worked with these households from registration to
work within the district, introducing them to communities and joint implementation, monitoring
and evaluation of activities. Departments in the Ministry of Agriculture such as Agritex, DVS
and LPD mostly did the extension work.
Extension work entails the training of farmers, demonstrating appropriate agricultural
practices, knowledge sharing and latest technology testing and dissemination. Major
challenges observed with these departments are shortage of resources such as transport
and other consumables for farmer training (Ndlovu, 2010). The situation is exacerbated by
shortage of experienced extension workers due to high staff turnover, which has led to the
high extension worker farmer ratio which stands at 1:600. Most of the extension personnel
have left the department due to poor remuneration, and those remaining behind are mostly
demotivated to execute their duties (WFP-Plan, 2009).
6.5.2. Roles and challenges of Quasi-government/parastatals
These are seen to play a major role in farmer coordination and formation of farmer field
schools particularly from farmer unions (ZFU & ZCFU). The farmers’ unions have mostly
registered farmers to get subsidized inputs such as seed, fertilizer and animal vaccinations.
However, of late, farmers’ unions lack one voice for advocacy and policy, because they have
become many hence fight for space, so this result in confusion to the farmers. In addition,
these institutions are not always available on ground and only appear towards the beginning
of agricultural seasons to collect farmer subscription fees (personal communication).
The GMB serves as the national strategic grain reserve. Mostly inputs and grain from
government coffers are stored and distributed though the parastatal at highly subsidized
rates. While GMB has played a strategic role in grain storage and subsequent distribution in
times of adversity many a time, GMB is not well resourced to buy all the produce from
farmers who produce in excess. This is also confirmed by FAO reports of 2004. Even when
the produce is delivered to GMB, payment to producers has taken too long at times
stretching for months. GMB has in turn lost most of the market share to private traders
following liberalization of the market.
GMB used to enjoy the monopoly to buy grain until the market was liberalized then started to
face competitors in the form of private traders who offered cash at collection of produce at
66
the farmers’ door steps. In addition, when food was finally distributed by GMB, transport and
logistics, delayed supplies and identification of beneficiaries took long so that the targeted
people were already starving by the time food was distributed.
6.5.3. Roles and challenges of Non Governmental Organisations
NGOs’ work in Mutasa has been complementary to Government efforts. The Government of
Zimbabwe remains the duty bearer in disasters even though every legal persona is
mandated to respond in disasters according to the Civil Protection Act (Zambia, 1989).. The
study found that NGOs were involved in various community projects that addressed risk
reduction and response to disasters. In risk reduction and preparedness, NGOs such as Plan
International and World Vision were found to be constructing and rehabilitating irrigation
schemes in the district to address the perennial water challenges from rain-fed agriculture.
They facilitated seed availability to communities through organizing agricultural inputs and
technology fairs. Some livestock pass on schemes12 were also conducted by the same
NGOs as a way of building drought resilience in the community. Livestock were seen as a
source of income when the drought situation intensified.
Farmers were being trained on best agronomic practices, conservation and livestock
management skills that fitted well with the drought prone areas. Plan International in
particular, had established viable village saving and lending schemes (VS&L) for credit and
income access to the rural households in the district (see Annexure D). Some projects
included food for assets programmes where the communities created assets in return for
food. Common assets created by communities were dip tanks, dams, roads that linked them
to markets and schools for human capital development. Drought response programmes were
also noted in the study as vulnerable group feeding (VGF), food handouts to people living
with HIV/AIDS and the aged who was labour constrained.
These NGOs were not without challenges as noted during the study. The study confirmed
reports by Ndlovu (2010). Most NGOs had a small number of staff, based at district level and
not at ward or local level making monitoring of NGO projects weak. Challenges common to
both NGOs and Government departments included political interference in day-to-day
activities that sometimes derailed implementation of drought risk reduction activities. The
situation was also exacerbated by demands of a lot of paper work with RDC that derailed
registration and project implementation. The existing economic environment also led to high
12 A pass-on scheme is an arrangement where beneficiaries of livestock or any other inputs are grouped together and given the livestock/inputs. The livestock/inputs are given to one member of the group who will in turn pass-on the offspring and remains with parental stock or the other way round to the other member until everyone benefits in that group. The system promotes ownership, knowledge sharing and sustainability.
67
staff turn-over in most government departments and shortages of inputs and materials
required for drought risk reduction (personal comms.). The current global economic crisis
would further exacerbate the situation as it had already started affecting funding inflows for
some NGOs (Ndlovu, 2010).
6.5.4. Roles and challenges of local leadership
Local leaders are the custodians of government and local authority by-laws. They enforce
these by-laws at community level and also coordinate the payment of taxes at this level.
Local leaders also take care of the local granaries (Isiphala seNkonsi) - from field cultivation
of crops, harvesting, storage and the subsequent identification of beneficiaries and
distribution of the grain. But the study noted that the role of local leadership was mostly
limited to the identification of beneficiaries of food aid programmes and the food distribution
component. The findings concurred with work by Ndlovu (2010) who earlier reported that
informal institutions had not played a major role in drought risk reduction. Their role (e.g.
Chieftainship) had only been limited to food distribution activities. Ndlovu (2010) further
observed that traditional norms and beliefs were no longer effective in reducing land
degradation because law enforcement was now weak. That might continue for some time in
future in view of the growing population pressure on the environment.
6.5.5. Roles and challenges of social networks Households (69.5%) interviewed, acknowledged the assistance they received from friends
and relatives. The victims called upon obligations from other family members, kin, patrons,
friends, from the general public by appeals to moral duty. Remittances or other assistance
came in the form of cash or kind. However, as noted by Dercon (2002), the social safety nets
are most likely to benefit those who have resourceful extended families and relatives in
political power. It has negative effects on those with poor relatives to assist them, and their
impact is at times limited while they may have negative externalities on households not
covered by the safety net.
6.5.6. Roles and challenges of churches and other religious groups
In the context of drought, churches played a significant role in providing food baskets to the
vulnerable members of the community, including payment of school fees to orphans and
other vulnerable children. They provided psycho-social support to some desperate cases.
One major challenge with the assistance coming from churches and religious institutions was
that it was distributed on discriminatory basis, targeting mostly members that belonged to
that congregation or members of the same religious group.
68
6.6. Disaster management practices Drought emergencies at district level were coordinated by the DDRC, a committee made up
of district level authority and other stakeholders in the livelihoods sector such as the District
Administrator’s office (DA), Agricultural extension services (Agritex), Livestock Production
department (LPD), Veterinary Services department (DVS), department of Social Services
(DSS), the Grain Marketing Board (GMB), the Rural District Council (RDC), NGOs and other
relevant stakeholders that may be co-opted in the committee. The committee in liaison with
ZimVAC conducted vulnerability assessment and hazard mapping in the district. The DDRC
managed relief, decided the targeting criteria in terms of areas and vulnerable groups. The
committee also allocated grain from the GMB to respective areas in the district. This
committee like its sister committee, the Civil Protection Committee, was well established and
domiciled at district level, without well functional corresponding structures at village level
where the drought victims and first responders to drought emergencies were found.
However, common problems with drought and other natural hazards noted by the study as
observed by Wilhite (2000), are maintaining interest in planning beyond the relatively short
window of opportunity that follows the event, given the on-again, off-again nature of this
phenomenon. Interest in drought planning quickly wanes in the post drought period when
precipitation conditions have returned to normal or above normal level. This is evidenced by
the reduced number of meetings if any after the drought period (personal communication).
The departments in the Ministry of Agriculture, Mechanisation and Irrigation Development
(MAMID), such as Agritex and Livestock Production are involved in the yearly ZimVAC’s
vulnerability assessments and also conduct their independent crop and livestock
assessments. There are also complementary assessments done by the famine early warning
network (FEWSNET). All these results are used in triangulation by the National Government
to predict the prospects of the season and when a national food deficit is anticipated,
mobilization of resources is done to cover for the shortfall.
NGOs as indicated play a pivotal role in capacity building of the rural households through
giving support to government departments to conduct famer trainings. Construction of
irrigation schemes and rehabilitation of the same in Mutasa district reduces the households’
vulnerability to drought by way of provision of dependable water sources that allow farmers
to cultivate throughout the year without moisture stress worries. However, the number of plot
holders in irrigation schemes vis-a vis on dry-land farming is insignificant. For example, Plan
International constructed a 30ha Makuwaza irrigation which had 60 plot holders and EU
constructed a 29 ha Manunure irrigation but that also had only 58 plot holders.
69
Meanwhile, only 35.37% of household in the study acknowledged their participation in
disaster risk reduction programmes in the community, but it would appear more people
actually did risk reduction projects subconsciously or unknowingly. Capacity building
workshops, livestock pass-on projects, food for assets programmes such as dip tank and
irrigation schemes rehabilitation, while facilitated, were not taken as livelihoods disaster
proofing. Extension support by extension departments on issues such as conservation
farming, crop rotation, destocking, stover harvesting and treatment were not recognized as
risk reduction yet, all these were done in the research area.
However, many departments or quasi government institutions such as GMB, DDF, Agritex,
Irrigation and division of Livestock and Veterinary Services remained under funded and
under resourced (personal communication). Meanwhile, local leadership or informal
institutions were only visible during food distribution, but were no longer active at enforcing
by-laws on land degradation (Ndlovu, 2010).
6.7. Conclusion
Livelihoods in Mutasa district are agro-based. The dependency of the livelihoods on rain-fed
agriculture makes the community vulnerable to climate change, particularly the erratic rainfall
pattern. Households have devised a multitude of coping strategies to avert starvation which
span from risk mitigation to response. Table 6.1 summarises the role played by institutions to
build households’ resilience to cope with drought. Institutions available in the community,
range from local leadership, churches, local authorities, government department, quasi
government and parastatals, NGOs, DDRC, Civil Protection Committee and ZimVAC.
Challenges of the institutions include lack of funding, staff-turn over, understaffing and lack of
interest in drought planning post the drought phase when rainfall normalizes.
70
CHAPTER 7: CONCLUSION AND RECOMMENDATIONS 7.1. Introduction In this chapter conclusions are drawn and recommendations made based on the research,
discussions and literature reviews of previous chapters. Recommendations are made on
some grey areas that were identified by the research, but could not be covered either
because they were not within the scope of the study or due to resource constraints.
7.2. Conclusion About 70% of Zimbabwe’s population derives its livelihood from subsistence agriculture and
other rural activities, but these livelihoods are threatened by climate change. The agriculture
sector’s reliance on seasonal, rain-fed cultivation makes the sector particularly vulnerable to
climate variability and change (Andear, 2009). Mutasa district is prone to drought. Although
drought can result from a number of different causes, one of the most common drought
scenarios occurs when crops and livestock suffer from severe moisture stress. This is when
available water is less than the physiological needs of the same. In the past five years,
almost all have been agricultural droughts. The rainfall pattern has been so erratic and
mostly characterized by dry spells such that rain fed agriculture has become unreliable.
Poor rainfall has resulted in rural households failing to harvest any meaningful produce, even
those who harvested some grain; it was not enough to see them throughout the season
resulting in food insecurity and stress as confirmed by reports from ZimVAC (2009). Most
farmers depending on rain-fed agriculture experienced a yield decline, with average yield
declining from the expected 4 t/ha to 0.1t/ha. The decline has been exacerbated by shortage
of inputs such as fertilizer, appropriate seed varieties, inadequate extension services and
timing of planting. In addition, the devastating effects of HIV/Aids estimated at 15.5% and the
continuous rural - urban migration or border jumping to neighbouring countries such as
Mozambique and South Africa in search of opportunities among the most productive age
group posed a challenge to food production.
The majority of communal farmers lost drought power and the high cost of inputs and
unavailability of inputs had further compounded the challenges rural households faced. To
acquire the necessary inputs they needed to realise better yields (Agricultural Technical &
Extension, 2008). Most farmers lacked the requisite knowledge and skills to manage their
farming activities as commercial enterprises. The situation was exacerbated by the high
extension worker farmer ratio and demotivated staff.
71
The major source of food was own production and casual labour while income sources were
peasant farming, casual labour and formal employment. The livelihoods of the farmers were
therefore fragile since their livelihoods which were agro-based faced the threat of drought.
Farmers had, however, employed a number of drought coping strategies in anticipation of,
and during the drought period. The households mostly changed the seed variety planted,
increased the hectarage of drought resistant crops, staggered planting dates to reduce risk of
dry spells, changed farming methods and adopted water conservation techniques.
Meanwhile during the drought period, the households had been forced to adopt coping
mechanisms in an identifiable sequence, from the least to the most erosive ones.
The study established that households started by reducing size of the food portion, skipped
some of the meals, at times went for the whole day without food, were forced to eat unusual
wild fruits and vegetables, ate premature crops, borrowed from neighbours and provided
labour in return for food. But when the situation deteriorated, mechanisms such as sending
some members of the family to other relatives, distress disposal of livestock and other
productive household assets and migration were not uncommon.
A wide range of agencies are involved in drought mitigation in the form of government
departments, quasi-government institutions, NGOs, local leadership and other community
organizations while the private sector has not been active. The limited involvement of the
private sector has also been reported by Ndlovu (2010). Agencies have led and implemented
a number of risk reduction programmes to increase the communities’ resilience to drought.
Irrigation construction and rehabilitation, dip tanks rehabilitation, livestock pass on schemes,
agricultural inputs and market fairs, income generating activities, VS&L schemes and farmer
training in various agricultural facets were revealed.
The agencies involved in drought risk reduction have done so with community involvement
and participation, a key factor in sustainability of most of these interventions. However, their
work has faced a number of obstacles in the form of underfunding, lack of resources, staff
turnover and political interference. The non availability of corresponding effective structures
or committees such as DDRC and Civil Protection Committees at village/ward level may
need to be reviewed.
Disaster management in the country is currently regulated by the Civil Protection Act number
5 (Zambia,1989). This act is being complemented by other sections of the law for synergism
and effectiveness. Funding of the Civil Protection Unit under which the act is administered is
provided for in annual budgets. However, funding has not been adequate to meet both
mitigation plans and emergency response even though there is a provision in the Act for
72
Treasury to inject additional funding. In order to effectively respond to emergencies,
government has had to divert funds that are meant for other developmental projects in other
areas. In most cases, NGOs or international agencies such as WFP have come to the rescue
of the state in terms of importation and feeding of vulnerable groups while Unicef has also
played an important role in the water and sanitation sector by providing water treatment
chemicals.
However, due to some shortcomings in the current Act, the country has engaged in a
process to review its legislation since 1995 in an effort to strengthen disaster risk reduction.
It is anticipated that the process will end with the repeal of the current Civil Protection Act
and to be replaced by the Emergency Preparedness and Disaster Management Act which
will provide a legal basis for the establishment of an Emergency Preparedness and Disaster
Management Authority whose major functions include developing a risk reduction strategy in
order to minimize vulnerability to both natural and man-made or technological hazards
(MLGPW & UD, 2006).
7.3. Recommendations The recommendations are derived from responses from interviewees:
a) It is suggested that outside agencies must understand the local coping strategies,
otherwise external humanitarian interventions will undermine them, creating aid
dependency and all manner of unintended and detrimental outcomes.
b) To design sustainable interventions for a drought prone area, a local and participatory
agro ecosystem appraisal is necessary. Further, the most effective interventions will
prove to be those that enhance household coping strategies.
c) The communities should not be taken as passive recipients of aid, but could be very
resourceful in programme implementation if their views and participation are solicited.
d) Robust committees such as the DDRC and the Civil Protection Committee should be
established up to village level where first responders to drought are located.
e) Given the anticipated climatic change that is set to further disrupt the rainfall pattern
making rain fed agriculture even more non reliable (Andear, 2009), the scaling up of
irrigation infrastructure is called for. Yields achieved on smallholder schemes are higher
than rain fed dry-land yields in communal areas. Gross margins for irrigating farmers are
significantly greater than for dry-land farmers. As noted by FAO (2000) the effect of
irrigation on increasing crop production and incomes is even more marked in the dry
winter season, when dry-land production is impossible because of lack of rain.
73
f) There is urgent need for the government to adequately address the challenges faced by
extension agencies such as transport, stationery for farmer training, in service training
resources and staff demotivation due to poor remuneration (extension staff are on
US$250.00/month on average).
g) Off-farm income or income diversification should be promoted to avoid the risk
associated with relying on farming alone.
h) Detection of localized crop failures should be part of a functioning early warning system.
i) Drought tolerant crops such as sorghum and millet may be promoted by government
through a provision of ready markets for the same or grain exchange programmes at
GMB, for example a farmer coming in with a tonne of millet and barter trade for maize,
their favourite staple food.
j) Local leadership should be seen playing a more active role in leading drought mitigation
strategies at community level that just to be associated with food aid distribution.
k) Food for work programmes have been successful when local management exists prior to
drought, but the expectations of physical labour should be reduced in these programmes
since they are eroding people’s ability to manage their domestic needs and to prepare
their lands.
l) There is need for the government to expedite the review process of the Civil Protection
Act that is set to be replaced by the Emergency preparedness and Disaster Management
Act. This will pave way to the establishment of an authority that will be more robust in
disaster risk reduction than the current scenario where activities of the Civil Protection
Unit are mostly confined to disaster response. Response is more costly and
unsustainable than mitigation.
7.4. Areas for further research a) Need still exists to further understand the types of food security decision-making by rural
households.
b) There is need to look at how vulnerability maps can be designed and be used in the first
stages of targeting to improve the cost effectiveness of resource allocation.
c) Design and use of user friendly satellite remote sensing in the early warning systems.
d) More research into sustainable non farm incomes in the rural context.
74
REFERENCES
Agricultural Technical & Extension. (2008). Quarterly report. Unpublished
Amani, H. K.R. & Maro W.E. (1991). Household food security in Tanzania: Preliminary
findings from four regions: In Market reforms, research policies, and SADCC food security,
Eds. Rukuni, M. and Wyckoff77-89. Harare, Zimbabwe: University of Zimbabwe, Department
of Agricultural Economics and Extension, University of Zimbabwe/Michigan State University
Food Security Research in Southern Africa Project.
Andear, C. (2009). Zimbabwe- Coping with drought and climate change. [Electronic].
Available: http://www.adaptationlearning.net [2011, March 13].
Bang, S.K. & Sitango, K. (2003). Indigenous Drought Coping Strategies and Risk
Management against EL Nino in Papua New Guinea: CGPRT centre WORKING PAPER No.
74. [Electronic]. Available: http://ageconsearch.umn.edu/bitstream/32687/1/wp [2011,
March 13].
Blackburn, H.D., Glimp, H., Phillip, D., Child, D. & Pope, A. (1993). Utilization and
preservation of livestock resources. Washington, DC. US Agency for International
Development (USAID), Bureau for Food and Humanitarian Assistance, Office of U.S. Foreign
Disaster Assistance (OFDA).
Bradshaw, S. (2004). Socio-economic impacts of natural disasters: a gender analysis.
Sustainable development and Human settlements division, Santiago, Chile. [Electronic].
Available: http://www.eclac.org [2011, February 21].
Campbell, D. J., Zinyama, L. M. & Matiza, T. (1991). "Coping with food deficits in rural
Zimbabwe: The sequential adoption of indigenous strategies." Research in Rural Sociology
and Development 5:73-85.
Chinembiri, F. M. (1999). Communal Area Livestock Management Systems in Zimbabwe. In
FAO Corporate Document Repository; Agriculture and Consumer Protection. [Electronic].
Available: http://www.fao.org/ [2011, April 01].
Davies, S. (1996). Adaptable Livelihoods, London: Macmillan Press.
75
Dercon, S. (2002). ‘Income Risk, Coping Strategies and Safety Nets’, World Institute of
Development economics Research, Discussion paper NO 2002/22, United Nations
University.
DFID. (2006). Reducing the Risk of disasters- Helping to Achieve Sustainable Poverty
Reduction in a Vulnerable World: (Unpublished paper). A DFID policy paper.
Dube, C. (2008). The impact of Zimbabwe’s drought policy on Sontala Rural Community in
Matabeleland South Province. MSc Thesis, Department of geology, Geography and
environmental studies; Stellenbosch University. [Electronic]. Available:
http:// scholar.sun.ac.za/handle/10019.1/2138 [2011, March 2].
Eldridge, C. (2002). Why was there no famine following the 1992 southern African drought?
IDS Bulletin 33, 4: 79-87.
FAO. (2000). Socio-economic impact of smallholder irrigation development in Zimbabwe.
[Electronic]. Available: http://www.fao.org [2011, April 2].
FAO. (2010). Crop and Livestock Assessment. 2nd round. (Unpublished Doc.).
FEWS. (1999). FEWS Current Vulnerability Assessment Guidance Manual. Introduction to
Current Vulnerability Guidelines. [Electronic]. Available: http://www.the-ecentre.net [2011,
October 01].
FEWSNET. (2008). 1st Crop assessment of 2008. Unpublished.
Holloway, A. (2003). Disaster risk reduction in Southern Africa: hot rhetoric, cold
Reality in: AFRICAN SECURITY REVIEW, Vol. 12, No.1, 2003,
Holzmann, P. & Boudreau, T. (2008). The Practitioners’ Guide to Household Economy
Approach. [Electronic]. Available: www.feg-consulting.com. [2010, April 14].
Hutchinson, C. F. (1992). Early warning and vulnerability assessment for famine mitigation.
Tucson, Arizona: University of Arizona, Office of Arid Lands Studies. Prepared for the
USAID/OFD Athrough the USDA/OICD, Washington, D.C.
76
Mombeshora, B., Mavedzenge, B., Madhara, M., Chibudu, C., Chikura, S., & Scoones, I.
(1995). Coping with risk and uncertainty. ILEIA Newsletter Vol. 11 No. 4 p. 10. [Electronic].
Available: www.metafro.be/leisa/1995/11-4-10.pdf [2010, April 16].
Munro, L.T. (2006). Zimbabwe’s drought relief programme in the 1990s. A re-assessment
using the national household survey data. Journal of contingencies and crisis management
14, 3:125-141.
Nattrass, N. (2002). AIDS and Human Security in Southern Africa: In the Journal of Social
dynamics, 28:1 (2002). 1-19.
Ndlovu, S. (2010). Coping with drought: Research findings from Bulilima and Mangwe
Districts, Matabeleland South, Zimbabwe. Practical action. [Electronic]. Available:
http://www.preventionweb.net/ [2011, March 13].
NDMC. (2007). Drought preparedness planning: The 10-step process. [Electronic]. Available:
Accessed on 15 September 2011 from: http:www.p2paysorg/ref/50/49988.pdf [2011,
September 15].
NDMC. (2011). Drought Planning Processes. [Electronic]. Available:
www.drought.unl.edu/planning/planningprocesses.aspx. [2011, September 15].
Pratt, C. (2006). Traditional early warning systems & coping strategies for drought among
pastoralist communities, Northeastern province, Kenya: Tufts University, USA. [Electronic].
Available: http://www.tufts.edu/ (2011, July 26).
Rorhbach, D.D. & Mwila, C. (1989). Industrial utilization of sorghum and millet in Zambia:
An approach to food security. In Food security ypolicies in the SADCC region, eds. M.
Rukuni, Mudimu, G. & Jayne, T.S. 191-203. Harare, Zimbabwe: University of Zimbabwe,
Department of Agricultural Economics and Extension, University of Zimbabwe/Michigan
State University Food Security Research in Southern Africa Project.
Shumba, O. (2001). Farmers' responses to reduce the risk of drought. LEISA Magazine,
17.1, April 2001. [Electronic]. Available: http://www.agriculturesnetwork.org [2011, April 02].
77
The International Famine Centre. (2002). Drought early warning System (EWS) - Botswana.
[Electronic]. Available: http://www.ucc.ie/ [2011, September 11].
UNAIDS. (1999). AIDS epidemic update. [Electronic]. Available: http://www.unaids.org
[2010, June 29].
UNISDR. (2002). Living with Risk. A global review of disaster reduction initiatives –
Preliminary version (ADRC, ISDR, UN, WMO).
WFP- Plan. (2009). Vulnerable Group Feeding. Monthly Monitoring Report. (unpublished)
Wikipedia. (2011). Geograghy of Zimbabwe. [Online]. Retrived from:
http://en.wikipedia.org/wiki/Geography_of_Zimbabwe [2011, April 08].
Wilhite, D.A. (1991). Drought planning: A process for State government. Water Resources
Bulletin. 27 (1): 29-38.
Wilhite, D.A., Hays, M.J., Knutson, C. & Smith, K.H. (2000). Planning for drought: Moving
from crisis to risk management. Journal of the American water Resources association 36:
697-710.
Wilhite, D.A., Hays, M.J. & Knutson, C. L. (2005). Drought preparedness planning: building
institutional capacity.
Wisner, B., Blaikie, P., Cannon, T.Y. & Davis, J. (2003). At Risk. 2nd ed., Wiltshire, UK:
Cromwell Press.
ZimVAC. (2009). Zimbabwe Vulnerability Assessment Committee (ZimVAC) Interim Rural
Food Security Assessment. Co-ordinated by the Scientific Industrial Research and
Development (SIRDIC) & Food and Nutrition Council (FNC), Harare, Zimbabwe.
Zimbabwe. Chapter 10:06. (1996). Civil Protection Act. (Act 5/1989). Chapter 10:06.
Revised Edition, Harare, Zimbabwe: Government printer.
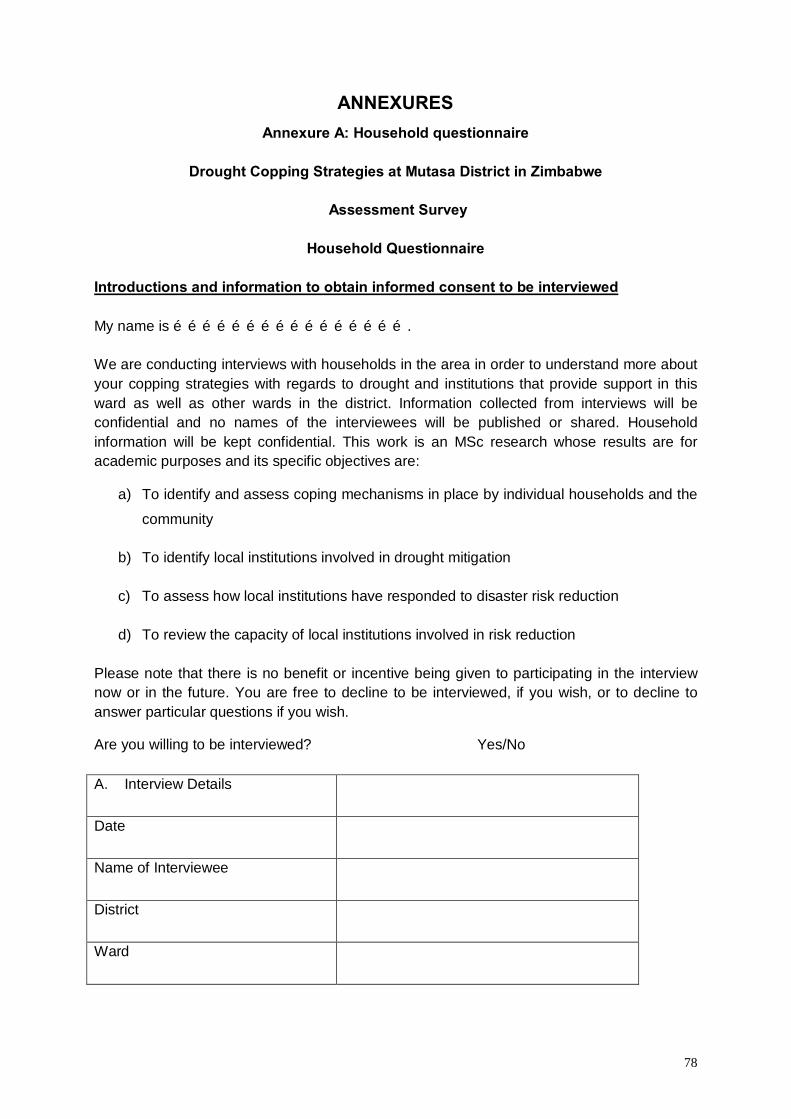
78
ANNEXURES Annexure A: Household questionnaire
Drought Copping Strategies at Mutasa District in Zimbabwe
Assessment Survey
Household Questionnaire
Introductions and information to obtain informed consent to be interviewed
My name is ………………………………………….
We are conducting interviews with households in the area in order to understand more about your copping strategies with regards to drought and institutions that provide support in this ward as well as other wards in the district. Information collected from interviews will be confidential and no names of the interviewees will be published or shared. Household information will be kept confidential. This work is an MSc research whose results are for academic purposes and its specific objectives are:
a) To identify and assess coping mechanisms in place by individual households and the
community
b) To identify local institutions involved in drought mitigation
c) To assess how local institutions have responded to disaster risk reduction
d) To review the capacity of local institutions involved in risk reduction
Please note that there is no benefit or incentive being given to participating in the interview now or in the future. You are free to decline to be interviewed, if you wish, or to decline to answer particular questions if you wish.
Are you willing to be interviewed? Yes/No
A. Interview Details
Date
Name of Interviewee
District
Ward
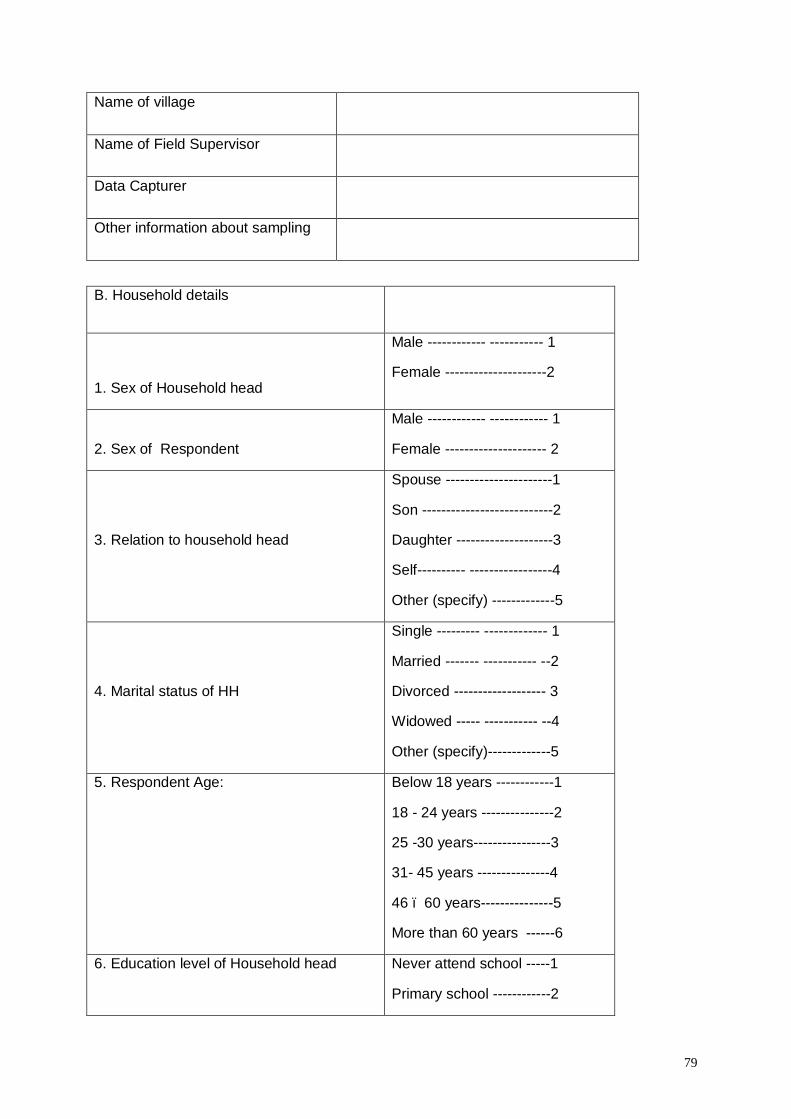
79
Name of village
Name of Field Supervisor
Data Capturer
Other information about sampling
B. Household details
1. Sex of Household head
Male ------------ ----------- 1
Female ---------------------2
2. Sex of Respondent
Male ------------ ------------ 1
Female --------------------- 2
3. Relation to household head
Spouse ----------------------1
Son ---------------------------2
Daughter --------------------3
Self---------- -----------------4
Other (specify) -------------5
4. Marital status of HH
Single --------- ------------- 1
Married ------- ----------- --2
Divorced ------------------- 3
Widowed ----- ----------- --4
Other (specify)-------------5
5. Respondent Age: Below 18 years ------------1
18 - 24 years ---------------2
25 -30 years----------------3
31- 45 years ---------------4
46 – 60 years---------------5
More than 60 years ------6
6. Education level of Household head
Never attend school -----1
Primary school ------------2
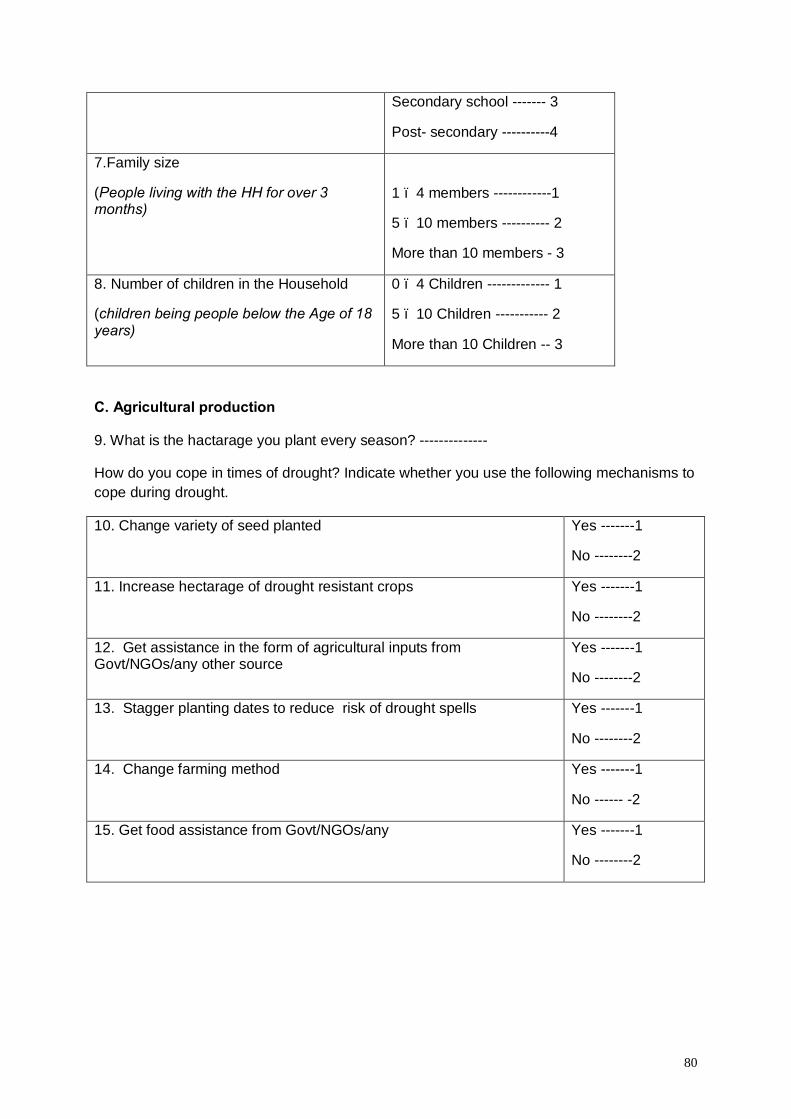
80
Secondary school ------- 3
Post- secondary ----------4
7.Family size
(People living with the HH for over 3 months)
1 – 4 members ------------1
5 – 10 members ---------- 2
More than 10 members - 3
8. Number of children in the Household
(children being people below the Age of 18 years)
0 – 4 Children ------------- 1
5 – 10 Children ----------- 2
More than 10 Children -- 3
C. Agricultural production
9. What is the hactarage you plant every season? --------------
How do you cope in times of drought? Indicate whether you use the following mechanisms to cope during drought.
10. Change variety of seed planted Yes -------1
No --------2
11. Increase hectarage of drought resistant crops Yes -------1
No --------2
12. Get assistance in the form of agricultural inputs from Govt/NGOs/any other source
Yes -------1
No --------2
13. Stagger planting dates to reduce risk of drought spells Yes -------1
No --------2
14. Change farming method Yes -------1
No ------ -2
15. Get food assistance from Govt/NGOs/any Yes -------1
No --------2
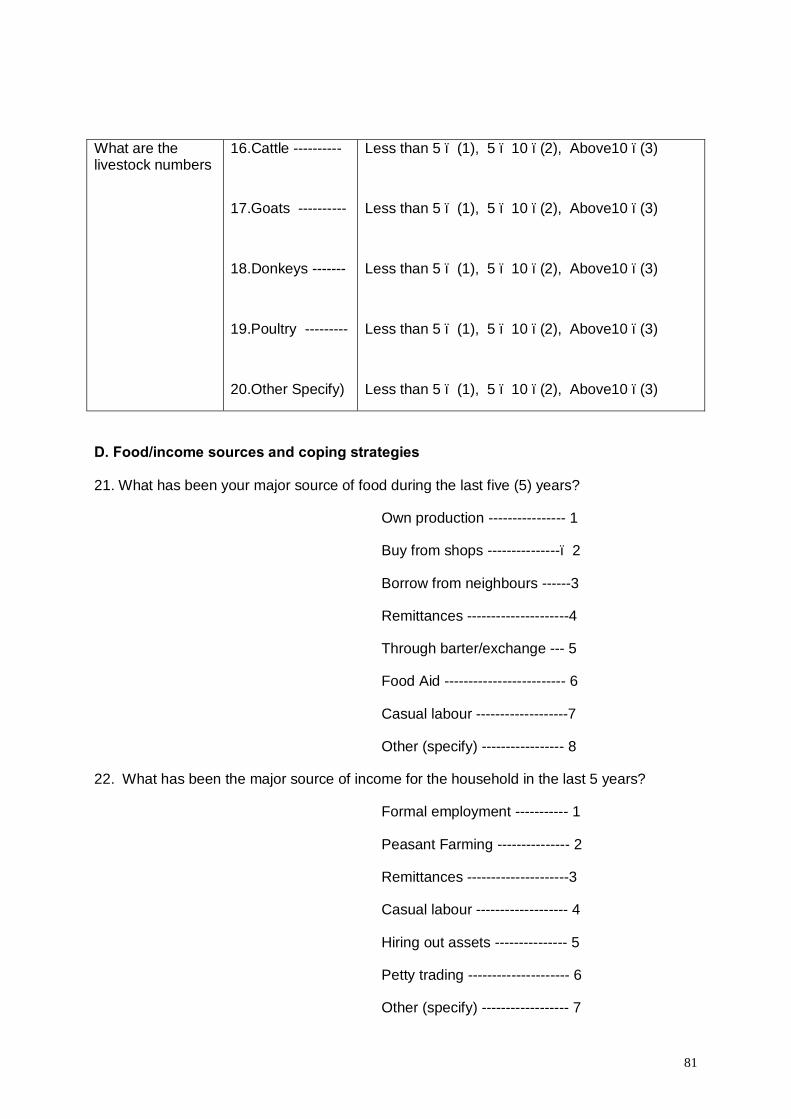
81
D. Food/income sources and coping strategies
21. What has been your major source of food during the last five (5) years?
Own production ---------------- 1
Buy from shops ---------------– 2
Borrow from neighbours ------3
Remittances ---------------------4
Through barter/exchange --- 5
Food Aid ------------------------- 6
Casual labour -------------------7
Other (specify) ----------------- 8
22. What has been the major source of income for the household in the last 5 years?
Formal employment ----------- 1
Peasant Farming --------------- 2
Remittances ---------------------3
Casual labour ------------------- 4
Hiring out assets --------------- 5
Petty trading --------------------- 6
Other (specify) ------------------ 7
What are the livestock numbers
16.Cattle ----------
17.Goats ----------
18.Donkeys -------
19.Poultry ---------
20.Other Specify)
Less than 5 – (1), 5 – 10 –(2), Above10 –(3)
Less than 5 – (1), 5 – 10 –(2), Above10 –(3)
Less than 5 – (1), 5 – 10 –(2), Above10 –(3)
Less than 5 – (1), 5 – 10 –(2), Above10 –(3)
Less than 5 – (1), 5 – 10 –(2), Above10 –(3)
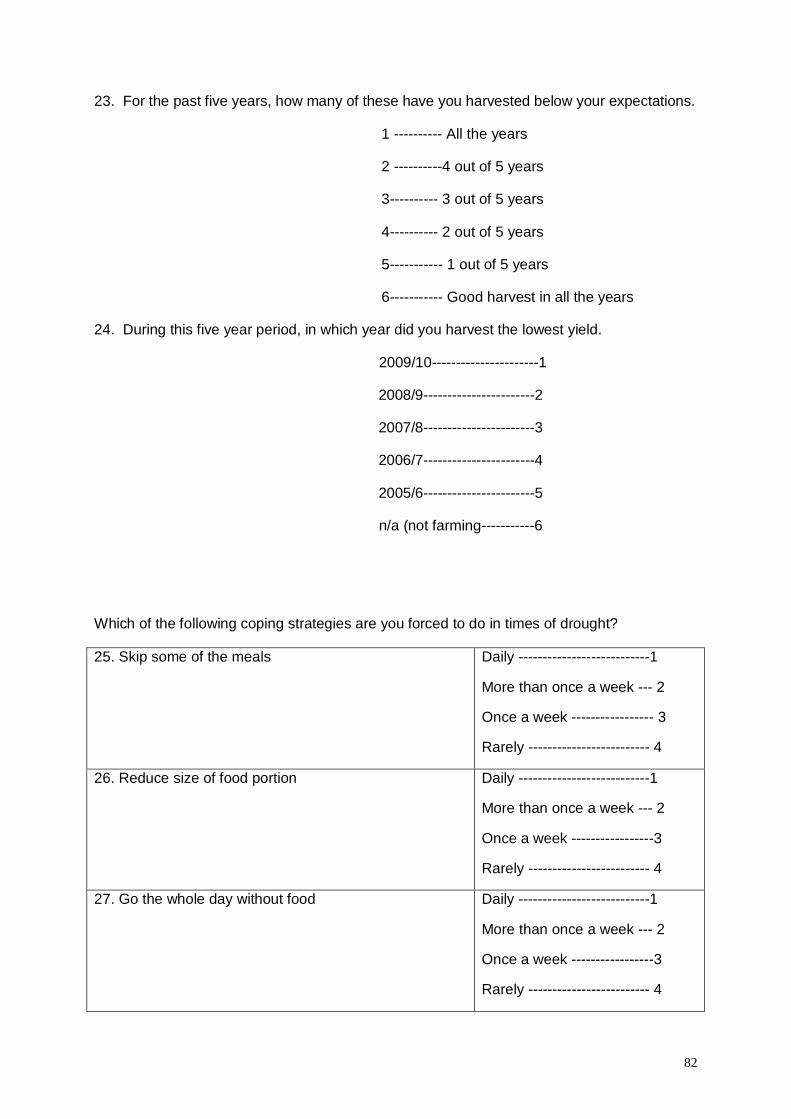
82
23. For the past five years, how many of these have you harvested below your expectations.
1 ---------- All the years
2 ----------4 out of 5 years
3---------- 3 out of 5 years
4---------- 2 out of 5 years
5----------- 1 out of 5 years
6----------- Good harvest in all the years
24. During this five year period, in which year did you harvest the lowest yield.
2009/10----------------------1
2008/9-----------------------2
2007/8-----------------------3
2006/7-----------------------4
2005/6-----------------------5
n/a (not farming-----------6
Which of the following coping strategies are you forced to do in times of drought?
25. Skip some of the meals Daily ---------------------------1
More than once a week --- 2
Once a week ----------------- 3
Rarely ------------------------- 4
26. Reduce size of food portion Daily ---------------------------1
More than once a week --- 2
Once a week -----------------3
Rarely ------------------------- 4
27. Go the whole day without food Daily ---------------------------1
More than once a week --- 2
Once a week -----------------3
Rarely ------------------------- 4
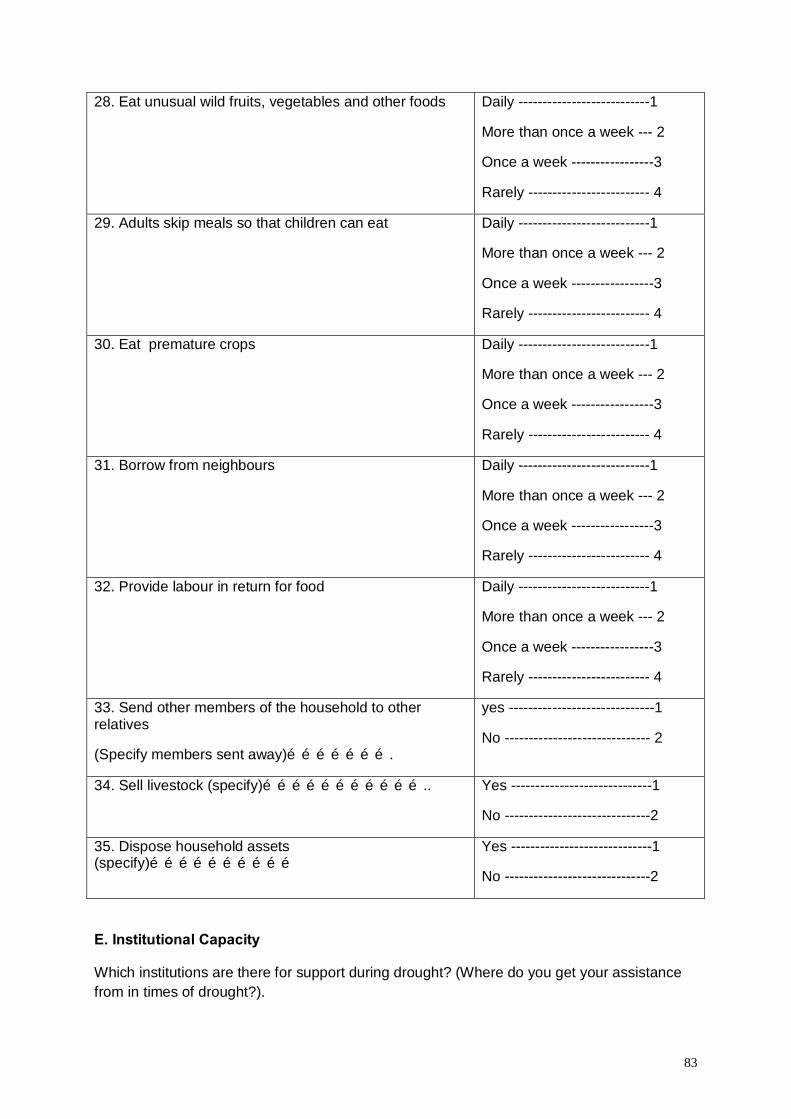
83
28. Eat unusual wild fruits, vegetables and other foods Daily ---------------------------1
More than once a week --- 2
Once a week -----------------3
Rarely ------------------------- 4
29. Adults skip meals so that children can eat Daily ---------------------------1
More than once a week --- 2
Once a week -----------------3
Rarely ------------------------- 4
30. Eat premature crops Daily ---------------------------1
More than once a week --- 2
Once a week -----------------3
Rarely ------------------------- 4
31. Borrow from neighbours Daily ---------------------------1
More than once a week --- 2
Once a week -----------------3
Rarely ------------------------- 4
32. Provide labour in return for food Daily ---------------------------1
More than once a week --- 2
Once a week -----------------3
Rarely ------------------------- 4
33. Send other members of the household to other relatives
(Specify members sent away)………………….
yes ------------------------------1
No ------------------------------ 2
34. Sell livestock (specify)…………………………….. Yes -----------------------------1
No ------------------------------2
35. Dispose household assets (specify)…………………………
Yes -----------------------------1
No ------------------------------2
E. Institutional Capacity
Which institutions are there for support during drought? (Where do you get your assistance from in times of drought?).
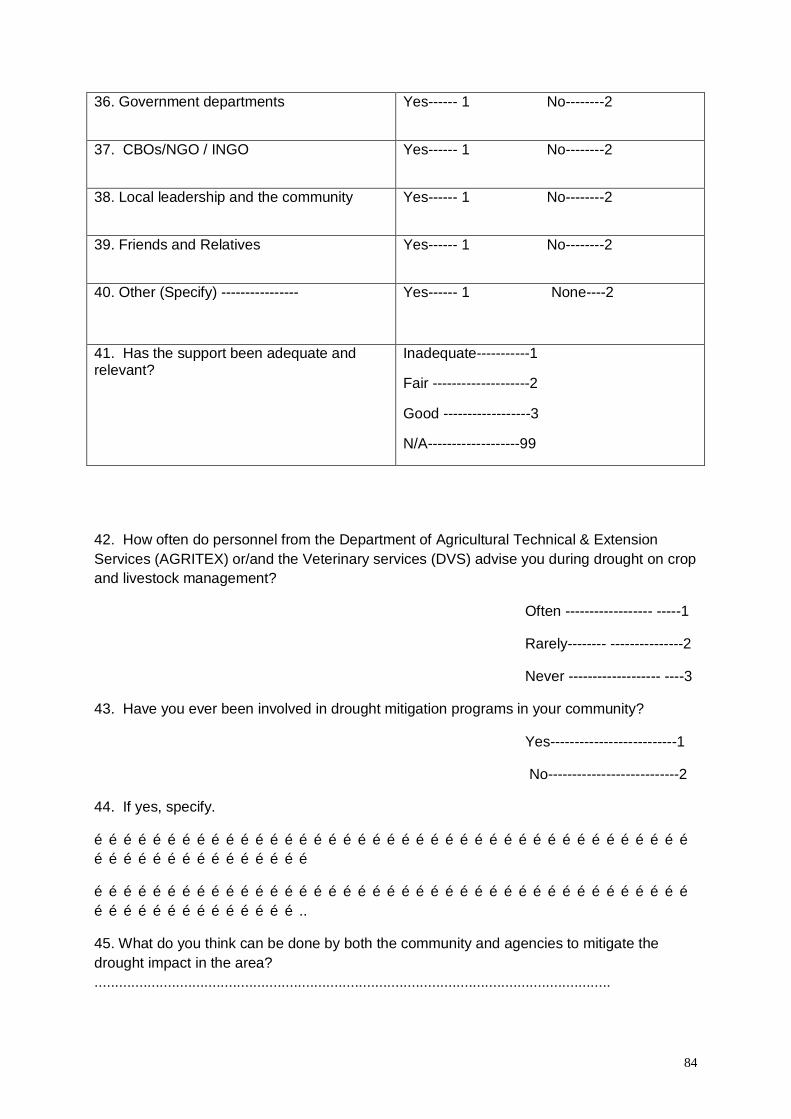
84
36. Government departments
Yes------ 1 No--------2
37. CBOs/NGO / INGO
Yes------ 1 No--------2
38. Local leadership and the community
Yes------ 1 No--------2
39. Friends and Relatives
Yes------ 1 No--------2
40. Other (Specify) ----------------
Yes------ 1 None----2
41. Has the support been adequate and relevant?
Inadequate-----------1
Fair --------------------2
Good ------------------3
N/A-------------------99
42. How often do personnel from the Department of Agricultural Technical & Extension Services (AGRITEX) or/and the Veterinary services (DVS) advise you during drought on crop and livestock management?
Often ------------------ -----1
Rarely-------- ---------------2
Never ------------------- ----3
43. Have you ever been involved in drought mitigation programs in your community?
Yes--------------------------1
No---------------------------2
44. If yes, specify.
……………………………………………………………………………………………………………………………………………………
…………………………………………………………………………………………………………………………………………………..
45. What do you think can be done by both the community and agencies to mitigate the drought impact in the area? ...............................................................................................................................
85
……………………………………………………………………………………………………………………………………………………..………………………………………………………………………………………………………………………………………………………
Thank you very much for your assistance.
(End Interview)
Other observations about/on the interview:
……………………………………………………………………………………………………………
……………………………………………………………………………………………………………
……………………………………………………………………………………………………………
……………………………………………………………………………………………………………
……………………………………………………………………………………………………………
……………………………………………………………………………………………………………
……………………………………………………………………………………………………………
……………………………………………………………………………………………………………
……………………………………………………………………………………………………………
……………………………………………………………………………………………………………
86
Annexure B: Key Informant Guidelines
1. Do you see drought as a challenge to livelihoods in this district?
2. For the past five years in this district how many of them have been drought years? Which
one was the most severe?
3. How do you try to influence the food insecure farming households to improve their food
security?
4. During drought, which household member/s do you have the most contact with? (Probe for
head of household, male/female, age, etc)
5. What coping strategies are commonly used by households in this community during
periods of drought?
6. Which are the strategies that are used more or only by the most food insecure
households?
7. What community support structures currently exist to assist households to cope with
drought? Can you tell us about these and how well they work?
8. Now looking at the most food insecure households, in what ways do community leaders
and communities in this area currently support and include people from the most food
insecure households? Please give examples where possible.
9. What are the other agencies that are actively involved in drought mitigation in the district?
10. Can you describe their key programs in the communities and impact if any?
11. What are the major challenges of these agencies?
12. What do you think can be done better by these communities and other stakeholders to
mitigate the drought impact?
Thank you for your cooperation
87
Annexure C: Guidelines for FDGs
1. Do you see drought as a challenge to your livelihoods in this district?
2. For the past five years in this district how many of them have you harvested below your
expectations? Which one was the most severe?
3. How do you try to improve food security in your households?
4. During drought, which stakeholders do you have the most contact with? (Probe for
programs done by the same)
5. What coping strategies do you commonly use in this community during periods of
drought?
6. Which are the strategies that are used more or only by the most food insecure
households?
7. What community support structures currently exist to assist households to cope with
drought? Can you tell us about these and how well they work?
8. Now looking at the most food insecure households, in what ways do community leaders
and communities in this area currently support and include people from the most food
insecure households? Please give examples where possible.
9. What are the other agencies that are actively involved in drought mitigation in the district?
10. Can you describe their key programs in the communities and impact if any?
11. What are the major challenges of these agencies?
12. What do you think can be done better by this community and other stakeholders to
mitigate the drought impact?
Thank you for making it here
88
Annexure D: VS&L explanation
The VS&L project is a community based saving and credit initiative by which the community
members are mobilized to form savings groups. The project is targeted at women and
children (though men are allowed to participate) who are trained on the VS&L methodology.
These groups function on the basis of individual members saving with the group on a regular
basis which is usually a month and at the same time borrowing from the group to finance
income generating activities/projects (IGA/IGPs). The borrowed money is repaid within an
agreed timeframe which is usually a month at an agreed interest rate. Group funds increase
through regular savings and interest rates charged on borrowed funds. For each group the
savings and borrowing activities go for an agreed period of time called the saving cycle which
is usually a year. At the end of the saving cycle which usually coincides with the end of the
year, total group funds are shared among group members who are encouraged to use the
money for the purchase of assets in addition to re-investment in IGPs, purchase of
agricultural inputs and payment of school fees. To effectively manage this project at
community level and for sustainability, cluster facilitators (CF) are trained to work with these
groups at community level. The CFs are group leaders chosen by a group of clubs in a
geographical area and undergo an extensive training program in the VS&L methodology. The
CFs manages VS&L activities at community level and are the interface between VS&L clients
and NGO Field officers.
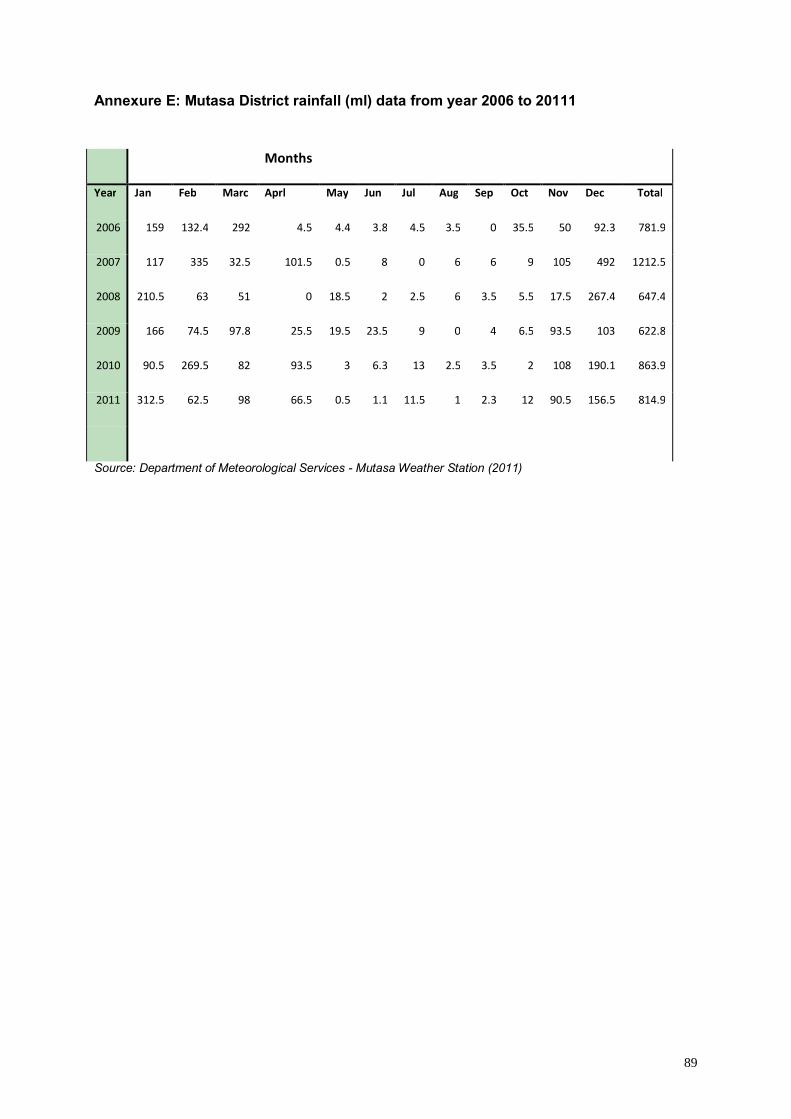
89
Annexure E: Mutasa District rainfall (ml) data from year 2006 to 20111
Months
Year Jan Feb Marc Aprl May Jun Jul Aug Sep Oct Nov Dec Total
2006 159 132.4 292 4.5 4.4 3.8 4.5 3.5 0 35.5 50 92.3 781.9
2007 117 335 32.5 101.5 0.5 8 0 6 6 9 105 492 1212.5
2008 210.5 63 51 0 18.5 2 2.5 6 3.5 5.5 17.5 267.4 647.4
2009 166 74.5 97.8 25.5 19.5 23.5 9 0 4 6.5 93.5 103 622.8
2010 90.5 269.5 82 93.5 3 6.3 13 2.5 3.5 2 108 190.1 863.9
2011 312.5 62.5 98 66.5 0.5 1.1 11.5 1 2.3 12 90.5 156.5 814.9
Source: Department of Meteorological Services - Mutasa Weather Station (2011)