Driving the Digital Way - Report from Policybazaar
83
Transcript of Driving the Digital Way - Report from Policybazaar


80 Policybazaar.com

February, 2018
©Policybazaar Insurance Web Aggregator Private Limited. All rights reserved.
DRIVING THE DIGITAL WAY: THE WORLD OF CAR INSURANCE BUYERS Behaviour of Car Insurance Customers in Indian Digital Landscape

Policybazaar.com 1
This page is intentionally left blank
.

2 Policybazaar.com
Dedicated to our insurance partners and the Motor Business Unit of Policybazaar
without whose support, this report would not have been possible. Special thanks
to Tarun (Mathur) who envisioned this work and was a key driving force

Policybazaar.com 3
This page is intentionally left blank

4 Policybazaar.com
CONTENTS
FOREWORD .................................................................................................................................................. 5
OVERVIEW .................................................................................................................................................... 8
Segmentation by Geography ................................................................................................................... 9
Segmentation by Vehicle-Make ............................................................................................................ 10
Segmentation by Geography & Vehicle Make ...................................................................................... 12
Segmentation by NCB ............................................................................................................................ 14
Segmentation by NCB and Vehicle Make.............................................................................................. 15
Segmentation by Fuel Type ................................................................................................................... 16
Segmentation by Fuel Type and Vehicle Make ..................................................................................... 16
Segmentation by Vehicle Age ................................................................................................................ 17
Segmentation by Vehicle Type .............................................................................................................. 18
Segmentation by Digital Behaviour ...................................................................................................... 20
Conclusion .................................................................................................................................................. 22
Next Steps .................................................................................................................................................. 22
Appendix .................................................................................................................................................... 24

Policybazaar.com 5
This page is intentionally left blank

6 Policybazaar.com
FOREWORD
e are pleased to announce the 1st ever market report from Policybazaar.com titled
‘Driving the Digital Way: The World of Car Insurance Buyers’. This report is an
attempt of first of its kind in the Indian market where the insurance buyers are
increasingly seeking the digital mode to make their purchases. With presumptive growths over
100% year-on-year for almost a decade, the adoption of digital route is perhaps strongly felt in
the car insurance market in India. Yet, there have been no significant reporting of customer
purchase behavior or that of portfolio performance across the market in all these years. This
attempt by Policybazaar is therefore the first major step across the industry to recognize this
segment separately and to examine the customer behavior closely to drive value for all
stakeholders involved.
The digital car insurance market has been lauded across the world for the unique capabilities
they bring to the table, for both the customer and the producers. The channel offers
personalization of offers beyond comparison to any other medium and is apt for consumers to
get the best tailored plans. With rising competition across the motor insurance market in India
and the need for improved profitability, this segment offers also perhaps the best route for
producers to ‘segment’ and ‘target’ the consumers appropriately to generate both growth and
profits. There has however been a dearth of availability of good data for most players in the
market on this segment. With this report and further work being done by Policybazaar.com, we
hope to guide the market to comprehend this segment better and improve the adoption of more
innovative strategies to service the digital customer.
While we have offered a study of the claims behavior of the market across the usual set of
segments and parameters measured in the offline world, one of the most interesting aspects
that came out of this study is the role played by behavioral parameters of a customer on their
claims experience. It is an oft-repeated maxim across the insurance world that car insurance is
underwritten on the ‘driver-customer’ and not the asset. The nature and outcome of such a
cover is then intuitively closely linked to the nature of the customer. It is here that the digital
world offers a significant leap on understanding the customer’s predispositions & propensities.
We have hence kept a key focus of this report also towards profiling the customer behavior
through the purchase journey and correlating the same to their claims experience. This is
therefore, in our view, a significant step forward in paving the way for a new and different
world of car-insurance-underwriting in this market.
W

Policybazaar.com 7
Last but most importantly, all these studies and propositions would not have been possible but
for the tremendous support offered by our insurance partners. From sharing the data to closely
working with our teams, the study and the report are a testament to the strong belief of our
partners to ‘resolve’ this common goal. The report is hence dedicated to all our key partners
who have made this happen and who have vowed to continue this support for the betterment of
the market.
We plan to continue this initiative going forward and to share the industry-level performance at
regular intervals. We will hence continue to seek your feedback on enhancing this report to
include further details and analyses. We hope to make this report a mainstay on the annual
calendar to provide a significant glimpse into the digital car insurance market in the country.
Vaidyanathan Ramani
Head - Product & Innovation

8 Policybazaar.com
OVERVIEW
The motor portfolio is the largest segment for most general insurers in the market today. Hence
the profitability of this book has an immense importance. The outcome is heavily influenced by
loss ratio of the portfolio and is a direct outcome of the pricing and underwriting strategies
rolled out by the insurer. Our focus of this study has therefore been the loss ratio for the Pvt.
Car portfolio of Policybazaar and the various sub-segments arising within. Specifically, we have
given attention to the own-damage component of the portfolio as it anchors the underwriting
strategies for all market players driving 50-60% of overall Pvt. Car premiums. Over the next few
pages, we present to you the performance of Policybazaar’s Private Car OD portfolio for
Accident Year (AY) 2016-17 in India which is an indicator for the digital market at large.
At an overall level, the OD loss ratio for AY 2016-17 is measured to be 76%. While there are no
established market-level statistics available for comparison, it is conventionally known that this
loss ratio is lower than what the market anticipates with a portfolio that is skewed towards
renewals and rollover policies. At a frequency of 18% and severity of ₹ 19,651/- per claim, the
Policybazaar portfolio presents a very significant opportunity for the insurance companies. This
is further enhanced from the wide variance exhibited by different segments within the portfolio
– Loss ratios vary widely from low double digits to well above 100%.
Overall portfolio rate (realized) at 1.47% is comparable to the rest of the market for a book of
similar average age (median age is between 3 and 4 years) and tenure. In terms of makes,
Maruti & Hyundai together constitute ~46% of portfolio – the book is more diverse across
makes in comparison to the distribution in offline market. Average IDV is measured to be ₹ 3.02
Lacs giving an average realization of ₹4,439 as Motor OD premium per policy.
Loss Ratio
76%
Frequency
18%
Severity
₹19,651
Accident Year
2016-17
Overall Statistics

Policybazaar.com 9
SEGMENTATION BY GEOGRAPHY
About 80% of Policybazaar’s business earned in 2016-17 came from 9 states – Maharashtra,
Delhi, Haryana, Karnataka, Uttar Pradesh, Andhra Pradesh, Tamilnadu, Gujarat and Rajasthan.
While these 9 states are also major contributors in the offline motor insurance market, there is
one key difference. The Policybazaar portfolio shows a positive skew in terms of states like
Haryana, Uttar Pradesh and Karnataka while relative shares of Maharashtra, Tamilnadu and
Andhra Pradesh are sharply lower than the offline market.
Interestingly, the South-West belt of Andhra Pradesh-Karnataka-Maharashtra is the most
profitable segment for Policybazaar that contributed 1/3rd of overall business at 61% loss ratio.
At the other end of the spectrum, UP-Haryana-Gujarat were the worst performing states with a
loss ratio of 82% and accounting for almost 1/4th of total business. Delhi showed a marked
difference in performance from its surrounding areas (in UP and Haryana) and was among the
largest and profitable segments.
Table A: Key Statistics by Major States
Further segmentation of loss ratio performance by major cities however brings out the wide
variance and associated opportunity even within these states. While the profitable states saw
its fair and large share of cities with good performance (e.g Maharashtra with Mumbai, Pune
and Thane), there were outliers, both positive and negative, within that showed marked
difference in performance.
First on the bright side, Ghaziabad and Gurgaon, at 72% and 75% loss ratio were considerably
lower than the average loss ratio displayed by their states – 80% and 84%. A similar good
performance was seen also at upcoming towns of Moradabad and Meerut of Uttar Pradesh.
Mumbai, which was the most profitable large city for Policybazaar with a loss ratio of 48%, also
displayed a significantly lower loss performance than the 63% seen for Maharashtra. At the
other end of the spectrum however, Lucknow, Chandigarh and the Gujarat belt of Bharuch,
Gandhinagar, Rajkot and Valsad displayed loss ratios higher than even 100% that depreciated
State Kar AP Mah Del TN Raj UP Guj Har
LR 59% 59% 63% 66% 77% 78% 80% 81% 84%
Frequency 15% 17% 16% 15% 16% 16% 18% 19% 20%
Severity 18,140 15,938 19,347 19,371 21,069 22,696 21,454 22,021 22,335
Earned Prop. % 10% 4% 18% 18% 4% 3% 8% 4% 12%

10 Policybazaar.com
the margins on the portfolio. The opportunity for segmentation is hence immense on the digital
channel, with consumers even across the border (e.g Delhi with its NCR neighbours) exhibiting
very different loss performance.
Chart A: Loss Ratio by Major Cities
SEGMENTATION BY VEHICLE-MAKE
Maruti and Hyundai were the largest 2 portfolios contributing 46% of total business together.
Honda, Ford and Volkswagen contributed another 20% while the others contributed the rest.
While M&M was the most profitable portfolio at loss ratio of just 60%, it was a comparatively
small segment and hence the overall profitability of the portfolio was anchored on Maruti (and
to a lesser extent on Hyundai) which exhibited a lower-than-average loss ratio of 68%. Maruti’s
Table B: Key Statistics by major Car Makes
Vehicle Make M&M CHEVROLET MARUTI HONDA HYUNDAI TATA TOYOTA FORD RENAULT SKODA VW
LR 60% 63% 68% 69% 72% 73% 76% 77% 89% 102% 104%
Frequency 15% 13% 15% 21% 20% 11% 21% 19% 28% 27% 33%
Severity 33,695 18,019 14,764 21,642 15,988 22,082 27,856 23,008 32,620 32,097 27,468
Earned Prop. % 4% 5% 24% 8% 22% 4% 5% 7% 3% 3% 6%
48%
61% 61% 63% 66% 71% 72% 73% 75% 76% 76%
83% 87% 87%
100% 110%
5% 1% 1% 4% 18% 2% 2% 2% 7% 1% 1% 2% 2% 2% 1% 1% 0%
20%
40%
60%
80%
100%
120%
LR by Cities
Loss Ratio Earned Proportion

Policybazaar.com 11
loss frequency of 15% was crucial in this outcome as it restrained the loss ratio to below 70%
with the given severity of ₹14,000
At the other end of the spectrum, Skoda and Volkswagen were both above 100% on loss
performance and had an equally high frequency on claims. In fact, for Volkswagen, 1 out every 3
vehicles made a claim in 2016-17 which is very high considering that the average vehicle under
consideration was either a renewal or rollover.
The mid-market of Hyundai, Toyota, Tata and Ford displayed loss ratios in the known ranges
(with the offline market) and similar claim frequencies. There was however a marked
differential performance with the Tata portfolio – the book had the lowest claims incidence at
11% but had a comparatively higher severity of ₹22,000 that brought the loss ratio higher into
the 70s range. This adverse outcome on severity was majorly driven due to a few large
losses/thefts within the segment. However as the segment was one of the smallest, we did not
do further segregation (the sub-segments were not of size and performance that was consistent
to be considered homogenous). This is one area that we will continue to watch and seek
corrective action going forward.
Almost as a converse, Honda vehicles displayed a ‘high’ claims frequency of 21% but at the
comparative ‘lower’ severity of ₹21,000 (3/4th of Honda portfolio was City and Amaze, hence
this severity is ‘low’), the book returned a fantastic loss ratio below 70%. Detailed make-level
segmentation and statistics are made available at the end of the report under the Appendix
section for a much closer examination.
Chart B: Loss Ratio by Major Makes
60% 63% 68% 69% 72% 73% 76% 77%
89% 98%
102% 104%
0%
20%
40%
60%
80%
100%
120%
LR- Key Vehicle Makes

12 Policybazaar.com
SEGMENTATION BY GEOGRAPHY & MAKE
Further segmentation of the loss performance by both Geography and Vehicle-Make indicated
that geography was a stronger factor than make for the golden ‘south-west’ corridor
(Maharashtra, Karnataka and Andhra Pradesh) – a fact underlined by ‘good’ performance for all
of top 5 vehicle-makes across these states. In fact, Delhi too exhibited a similar all-pervasive
and almost-uniform performance across all the top 5 vehicle-makes. While there was still scope
to segment down into vehicle-makes for improved performance and profitability, these
geographies provided an overall opportunity for growth.
Table C: Loss Ratio by Major States and Major Vehicle Makes
At the other end, 2 states with worst performances – Uttar Pradesh and Haryana – exhibited an
almost unilateral deterioration across makes that once again emphasized geography as key
element in segmentation and pricing. However, all was not lost in these areas with at least one
key vehicle-make (Maruti in Uttar Pradesh and Honda-Mahindra in Haryana) reflecting areas of
opportunity. The predominant loss performance across however calls for caution even as
segmentation is applied further for improving performance and growth in these areas.
Perhaps the biggest reason for segmentation was felt in the ‘middle’ states – Rajasthan, Gujarat
and Tamilnadu – where the performance across the different vehicle-makes was starkly
different. All the 3 states exhibited good performance across more than 2/3rd of the portfolio
that made selection within the segment a key factor for profitable outcome. These 3 states are
also among the Top 10 markets for car insurance in India and hence these present a significant
opportunity from differentiated offers.
Loss Ratio MARUTI HYUNDAI HONDA MAHINDRA TOYOTA INDUSTRY
AP 50% 60% 52% 51% 39% 59%
Del 62% 63% 65% 65% 59% 66%
Guj 64% 64% 58% 82% 108% 81%
Har 77% 90% 72% 59% 78% 84%
Kar 54% 65% 59% 45% 44% 59%
Mah 56% 51% 64% 58% 68% 63%
Raj 65% 98% 62% 46% 72% 78%
TN 70% 61% 66% 60% 92% 77%
UP 67% 93% 77% 97% 85% 80%
Industry 68% 72% 69% 60% 76% 76%

Policybazaar.com 13
Further segmentation of vehicle-makes by key cities also strengthened the geographic factor in
the loss ratios for the ‘golden’ south-west states as well as Delhi. Here, all key cities exhibited
almost unilateral good performances across segments that drove the regions’ loss outcome.
There were one to two sub-segments that presented a differentiation opportunity (like Hyundai
in Hyderabad or Toyota across Thane and Pune) but the size of differential win was
considerably small and hence not pursued in detail.
There was however strength for the argument for segmentation across the cities from other key
states. Here, there were marked differences in performances across vehicle-makes that created
opportunities to further sub-segment customers and drive customized offerings. For example,
Gurgaon, while still is part of Haryana that has a high loss ratio, demonstrated good loss
performance across all makes including Hyundai where its performance was bordering the
acceptable limit. Similarly, Ghaziabad, Faridabad, Noida and Surat – all exhibited relatively good
performance on their Honda portfolio that indicated certain customer segmentation at work in
the choice of these vehicle-makes. Hyundai, on the other hand, was seen to exhibit a good
performance across all of Western region including the cities in Gujarat which indicated further
factors at play in the loss ratio outcome.
A detailed make-level analysis across key cities is presented at the end of the report for further
leverage through segmentation
Table D: Loss Ratio by Major Cities and Major Vehicle Makes
Loss Ratio MARUTI HYUNDAI HONDA MAHINDRA TOYOTA INDUSTRY
BANGALORE 54% 61% 55% 55% 28% 60%
CHENNAI 88% 62% 40% 18% 117% 73%
DELHI 62% 63% 65% 65% 59% 66%
FARIDABAD 71% 77% 70% 54% 126% 87%
GHAZIABAD 65% 78% 61% 79% 128% 72%
GURGAON 66% 75% 65% 46% 69% 75%
HYDERABAD 53% 72% 35% 32% 17% 61%
MUMBAI 51% 38% 53% 24% 43% 48%
NAVI MUMBAI 63% 27% 66% 20% 47% 58%
NOIDA 106% 87% 43% 229% 54% 87%
PUNE 57% 46% 50% 31% 89% 63%
SURAT 83% 49% 30% 21% 63% 73%
THANE 62% 62% 46% 65% 89% 71%
INDUSTRY 68% 72% 69% 60% 76% 76%

14 Policybazaar.com
SEGMENTATION BY NCB
The No-Claim-Bonus (NCB) was the next key variable that was used for segmentation of the
portfolio’s performance to look for differentiation. For this analysis, the NCB that was applied in
the new policy was indexed as the reference. The analysis brought out an important but
somewhat expected outcome – Vehicles that reported a claim in the previous year and
consequently carried a 0% NCB into the new policy exhibited a significantly worse loss ratio
than those that didn’t. In fact, this segment demonstrated a fairly higher loss frequency of 28%,
the highest in the portfolio, which was the causing factor for the performance seen. This
increase of more than 25% in claims incidence from those who had at least a no-claims-in-last-
year has led to the industry extinguishing the accumulated NCB for such customers at the first
instance of a claim. While we believe that there exists an opportunity within this segment for
differentiation in terms of number of claims made in lifetime of the car/ driver-customer, there
was dearth of this data being available that prevented us from doing a detailed analysis. This is
therefore another area that we intend to record and analyze more going forward.
Table E: Key Statistics on all No-Claim-Bonus levels
Chart B: Frequency and Severity at all No-Claims-Bonus levels
NCB 0 20 25 35 45 50
LR 85% 71% 67% 70% 71% 67%
Frequency 28% 22% 18% 15% 12% 9%
Severity 21,911 21,066 19,425 19,619 18,371 15,641
Earned Prop. % 30% 23% 17% 10% 6% 10%

Policybazaar.com 15
All the other NCB levels – from 20% to 50% - exhibited similar loss ratio performance that
spanned between 67% and 71%. There was however a marked correlation between the rising
levels of NCB and decreasing claims frequency - With every rise in NCB level, there was a 20-
25% decrease in claims incidence. Accounting for variations in the severity, the steady loss ratio
performance indicates that the market has almost already factored in this outcome in the
pricing of these policies. We believe that this documented study can only further enhance this
market behavior and emphasize this differentiation going forward.
SEGMENTATION BY NCB AND VEHICLE MAKE
Further segmentation of the NCB’s correlation with loss performance lead us to believe, at first
instance, a differentiated outcome where all makes except Mahindra – Maruti, Hyundai, Honda
and Toyota – reflected the underlying principle of NCB-portfolios exhibiting loss ratios lower
than Zero-NCB portfolio. However, a closer examination of Mahindra portfolio revealed 2 large
claims (in the 35% NCB category) which if considered to be one-off, altered the outcome to
align to the rest of the portfolio. The make-wise segmentation hence also provides strong
credence to the market practice on pricing the customers who carry NCB into the new policy.
Table F: Loss Ratio at all No-Claim-Bonus levels and major Vehicle Makes
There were however differences within the makes on the quantum of variance driven by the
claim-made-in-previous-year behavior that could lead to a more intelligent pricing strategy for
the insurance companies. The loss ratio of Zero-NCB Hyundai, for example, was most
pronounced at 90% leading to a 25-30% reduction with rising NCB levels. This segment was
also sharply responsible to drive the overall performance of the zero-NCB segment well above
80%. There may be hence further scope for sharpening the differentiated offers currently being
offered to customers in this sub-segment. At the other end, Toyota exhibited steady but very
NCB-LR MARUTI HYUNDAI HONDA MAHINDRA TOYOTA INDUSTRY
0 79% 90% 75% 54% 77% 85%
20 70% 63% 71% 71% 72% 71%
25 59% 66% 61% 46% 74% 67%
35 66% 70% 74% 84% 69% 70%
45 59% 71% 60% 58% 75% 71%
50 61% 65% 55% 49% 61% 67%
INDUSTRY 68% 72% 69% 60% 76% 76%

16 Policybazaar.com
small variance in loss ratios across different levels of NCB which indicates that the market has
potentially ‘sized-up’ the opportunity in its current pricing strategy.
SEGMENTATION BY FUEL TYPE
On fuel type, the analysis of loss ratio yielded results that fully anticipated and were in line with
the experience of the offline market. Petrol cars remained the most profitable segment for the
insurance companies while the other fuels – Diesel and CNG – had equivalent level of high loss
ratios. The variance between petrol and other fuels was observed to be of the order of 25%.
While the observation mirrors the common market knowledge of Petrol and Diesel cars (the
fuel type functions as an indicator of the level of usage), the existence of significant variances in
their loss ratios reflects the opportunity that remains for further differentiation. Taking the
differences in IDV at current prices to be about 15-20%, the overall delta in performance of
petrol cars vs. diesel/CNG cars turns up to be of the order of 35-40%. We anticipate that this
difference will be built into the pricing strategies focused on this segment going forward.
Chart C: Loss Ratio by Fuel Types- Petrol, Diesel, CNG and Others
SEGMENTATION BY FUEL TYPE AND MAKE
The significant differentiation in loss ratio outcome between petrol and other fuels continued
across different vehicle-makes as well. While the rise in loss performance from petrol to diesel
fuel was of order of 30% in Honda and Hyundai makes, Maruti vehicles demonstrated an almost
50% increase when fuel type was changed. This almost unilateral difference in loss

Policybazaar.com 17
performance across major makes in market lends further credence to the market practice of
treating the fuel type as a proxy for vehicle utilization – Diesel and CNG vehicles are on an
average driven for much longer distance and remain on road for longer time than those driven
on Petrol.
The differentiation however did not work for Toyota in our portfolio owing to strong
performance from diesel-driven Innova and Fortuner segments. We discuss more about these
vehicle models in a later segment. We believe that this again presents an incredible opportunity
for differentiated proposition to Toyota diesel-car customers
Table G: Loss Ratio by Fuel Type and Major Vehicle Makes
SEGMENTATION BY VEHICLE AGE
Analysis of loss ratio performance by vehicle age indicates an increasing curve till Year 4 after
which there is an improvement with loss ratios dropping below 60% by Year 6. This checkered
performance of loss ratio is an outcome of the trends seen in the underlying factors – (1) Loss
Frequency and (2) Loss Severity.
Chart D: Loss Ratio at all Vehicle Ages
Fuel Type MARUTI HYUNDAI HONDA MAHINDRA TOYOTA INDUSTRY
Petrol 57% 66% 63% - 72% 64%
Diesel 85% 85% 88% 60% 72% 87%
CNG 83% 98% - - - 84%
Others 81% 83% 121% 55% 227% 95%
INDUSTRY 68% 72% 69% 60% 76% 76%
72%
80% 83%
85%
72%
59%
68% 68% 64%
58%
50%
60%
70%
80%
90%
1 2 3 4 5 6 7 8 9 10
Loss
Rat
io
Vehicle Age
LR by Vehicle Age

18 Policybazaar.com
On loss frequency, a unilateral decreasing trend is observed for the Policybazaar portfolio with
rise in vehicle age. From a high of 27% for new vehicles, the loss frequency drops to 12-9%
from Year 6. On loss severity as well, as shown in Chart E, there is a uniform drop between
Years 1 – 6 after which the severity stabilizes to levels around ₹13,000-₹15,000.
While both frequency and severity provide almost similar unilateral trend behavior, the actual
outcome of loss ratios are also dependent on pricing. From Year 1 to Year 2, there is a drop of
25%-30% in premium levels owing to average provision of NCB and drop in IDV of the vehicle.
Against this, the overall drop in frequency and severity are to the tune of 15-20%. This
therefore leads to the observed rise in loss ratios between Year 1 and 2. The same trend
continues till about Year 4 after which the drop in NCB levels get restrained (to between 0 and
5%). As a result, the drop in frequency and severity levels get pronounced against price which
drives the first drop of loss ratios for a given cohort of cars. This trend can be further extended
to illustrate the observed loss ratio behavior until Year 10.
Chart E: Frequency and Severity at all Vehicle Ages
SEGMENTATION BY VEHICLE TYPE
The last piece on segmentation of loss ratio performance (from a traditional channel
perspective) was through consideration of the Vehicle Type – SUVs, Sedans and Hatchbacks. In
the offline market, the car type is again considered as a representation of the level and place of
utilization of the vehicle being insured – this leads to clear differentiation in loss ratio
outcomes.
27% 26%
24%
21%
15%
12% 11% 10%
9% 9%
0%
5%
10%
15%
20%
25%
30%
-
5,000
10,000
15,000
20,000
25,000
30,000
1 2 3 4 5 6 7 8 9 10
FREQ
UEN
CY
SEV
ERIT
Y
VEHICLE AGE
ACPC Frequency

Policybazaar.com 19
On the digital market, while the differentiation continued between the stated segments, the
nature of variance was not strictly as anticipated. The SUVs and Mini-SUVs, for example,
demonstrated a very good and profitable loss performance across all different models from
stables of different makes – Mahindra, Honda, Toyota, Maruti and Hyundai. Loss ratio for a
significant majority of these models remained at sub-60 levels leaving large margins for the
insurance companies. This thus remains a major differentiation opportunity going forward.
Table H: Loss Ratio by Vehicle Type: SUVs, Sedans & Hatchbacks
On the other hand, the sedans and hatchbacks provided a mixed bag – some models were
strongly positive with lower loss ratios while the others led to sharp drain in margins for the
insurance companies. There was however no singular rule or guiding principle that fully
explained the differentiation in performance of various models. Some key trends that anchored
this differentiation were however noticeable:
Car-types with larger share of diesel and CNG-models had higher loss ratios
Vehicle Type Model Loss Ratio Severity Frequency
CRETA 32% 19,422 29%
FORTUNER 45% 49,146 18%
ERTIGA 52% 19,409 23%
SCORPIO 60% 29,260 13%
XUV 500 62% 41,032 20%
INNOVA 67% 44,752 12%
CIAZ 52% 17,708 35%
XCENT 53% 17,763 26%
NEW CITY 58% 23,912 19%
SX4 58% 14,341 15%
CIVIC 64% 22,170 14%
VERNA 67% 21,420 26%
SWIFT DZIRE 77% 18,642 22%
CITY 77% 18,245 20%
ETIOS 82% 19,518 28%
AMAZE 85% 26,947 27%
COROLLA ALTIS 104% 38,534 24%
ZEN 43% 10,406 7%
RITZ 54% 12,822 15%
WAGON R 58% 12,000 13%
BRIO 59% 16,203 19%
I 10 67% 12,792 17%
GRAND I10 68% 16,294 31%
SANTRO 69% 12,864 12%
ALTO 70% 12,793 11%
CELERIO 74% 17,251 24%
SWIFT 78% 15,476 22%
EON 86% 14,348 22%
I 20 88% 20,496 28%
ETIOS LIVA 110% 22,890 31%
SUV/
Mini-SUV
Sedan
Hatchback

20 Policybazaar.com
D-segment cars (2 Litre + capacity) exhibit lower loss ratios
Panel-auto parts drive up severity levels leading to higher loss performances
Table H above lists the complete list of models and their loss performance for a detailed picture.
SEGMENTATION BY DIGITAL BEHAVIOUR
Finally, a report on digital customer behavior cannot be complete without considering their
actual behavior online through the purchase process. This last segmentation analysis was hence
focused on 2 key aspects of the customer journey while buying a motor insurance policy – (1)
No. of days to expiry and (2) Requirement for assistance while purchase
The time frame to current policy expiry emerged as a key variable that exhibited a high
correlation to the loss behavior of the portfolio. It is now known that the cohort that renews the
car policy at least 4 days prior to the expiry demonstrated a drop of 20-25% in loss ratios from
those who renew within the last 4 days or later. The former segment displayed a loss ratio of
60-65% against the 80-85% observed on the latter cohort.
On a similar note, the availing of assistance in the purchase process further differentiated the
customer loss behavior by an equally significant margin. The analysis of the Policybazaar
portfolio indicated that customers who buy car insurance on their own and take very little
assistance from a tele-calling agent were found to have lower propensity to claim in general and
delivered 12%-15% lower loss ratio experience than those who needed significant assistance
from the Policybazaar team and who spent a considerable time understanding the different
options and features available across the market.
Chart E: L/R by Days-to-Expiry and gap between Assisted and Unassisted Loss Ratios at Respective Duration
A - Assisted U - Unassisted

Policybazaar.com 21
We believe this behavior is not accidental and is inherently based on customer’s own
knowledge of their driving style and the risk that is riding on their car. Consequently this
translates to higher incidence of claim and increased loss ratio. Interestingly, this gap between
the self-serviced and assisted customers was almost uniform across the spectrum of days to
expiry; that is, at any stage before expiry of current policy, the self-serviced was better than an
assisted customer by almost the same margin of 10-12%.
Chart F: Loss Ratio by Assisted and Unassisted (Assistance Type)
The identification of these two digital behavior factors is an important milestone for this report
as these factors confirm the existence and need for differentiation of digital insurance
customers from traditional segmentation methods. The successful demonstration of the role of
these factors also helps strengthen the viewpoint that digital channels may help commence the
idea of underwriting the consumer-driver rather than the vehicle as the motor insurance
market matures in the Indian landscape.

22 Policybazaar.com
Conclusion
Against the apprehensions across different segments in the market, digital car insurance sale in
India is very much viable. There exists significant opportunity for growth and equally large
sections of profitability if one were to apply the right set of analytics and segmentation. This, in
fact, will be the key to the growth of this segment going forward and will redefine the way car
insurance has been underwritten so far in the market.
At the same time, the digital market also indicates few important but interesting differences
from the offline market that we have come to know. A sample list of important inferences:
SUVs are profitable across different makes
All hatchbacks are not unprofitable
Self-serviced car insurance purchases exhibit lower loss ratios
Customers who renew their car insurances at least 4 days prior to expiry are profitable
But perhaps the greatest benefit of the digital channel is the ability to individually and
separately underwrite every risk that comes on board. The capability to personalize pricing
helps in applying the observed trends to specific customer segments, far more easily. The
segmentation can therefore be extended to multiple dimensions, eventually resulting in a
technical pricing model for all cars and car owners across the market.
We fervently hope we have provided that first leap for the market to move towards this
scenario. We are equally thankful to our partners who contributed immensely to this study and
helped define the digital car insurance market in India in this entirety for the first time. With
the market projected to grow at 100% and beyond year-on-year, the opportunity ahead for the
market is immense.
Next Steps
Our key endeavor out of this report is not just to report the state of market once but rather
continue to exhibit the trend of the market year-on-year going forward. The market is in a
continuous state of movement and the changing trends will have as much importance as the
starting point. We are hopeful that our partners will continue to contribute to this initiative and
help us in presenting this vision to the market periodically.

Policybazaar.com 23
We also plan to compile a similar market-view on other product categories that are sold
digitally in India – specifically Health insurance. We also hope to compile market segmentation
and analytics of Motor Third Party losses for the digital market in the near future.
Once again, we thank all our partners for providing the data and sharing their thoughts and
ideas that have greatly helped in formation of this report. We wish to be a key anchor for our
partners for their foray into this market and help deliver a win-win outcome for all
stakeholders involved. Wishing you all a very happy and profitable 2018!!
Ankit Mittal
Vice President - Actuarial

24 Policybazaar.com
Appendix

Policybazaar.com 25
1. LR Detail by Vehicle Makes
1.1 Maruti
Registration state Loss Ratio ACPC Frequency Earned
Proportion
Rate
Realization
Burn Rate
Karnataka 54% 11,916 14% 8% 1.40% 0.76%
Andhra Pradesh 50% 11,041 13% 3% 1.46% 0.75%
Maharashtra 56% 12,903 15% 17% 1.49% 0.84%
Delhi 62% 15,729 13% 23% 1.54% 0.95%
Tamil Nadu 70% 14,872 14% 3% 1.43% 1.00%
Rajasthan 65% 16,872 12% 3% 1.54% 1.00%
Uttar Pradesh 67% 15,578 14% 9% 1.54% 1.04%
Gujarat 64% 15,052 14% 4% 1.57% 1.01%
Haryana 77% 16,759 17% 14% 1.59% 1.23%
Others 91% 14,997 19% 17% 1.43% 1.34%
Total 68% 14,764 15% 100% 1.50% 1.03%
Registration City Loss Ratio ACPC Frequency Earned
Proportion
Rate
Realization
Burn Rate
MUMBAI 51% 10,549 16% 5% 1.46% 0.76%
HYDERABAD 53% 9,556 15% 1% 1.45% 0.85%
BANGALORE 54% 11,089 16% 7% 1.41% 0.77%
PUNE 57% 13,891 14% 3% 1.55% 0.88%
THANE 62% 15,189 14% 2% 1.44% 0.93%
NAVI MUMBAI 63% 11,851 18% 1% 1.45% 0.92%
DELHI 62% 15,729 13% 23% 1.54% 0.95%
GHAZIABAD 65% 16,545 13% 2% 1.54% 1.01%
GURGAON 66% 14,962 16% 6% 1.56% 1.04%
FARIDABAD 71% 14,462 18% 3% 1.62% 1.13%
SURAT 83% 14,931 21% 1% 1.63% 1.40%
CHENNAI 88% 15,714 17% 1% 1.45% 1.25%
NOIDA 106% 19,819 19% 2% 1.53% 1.66%
Others 73% 15,324 15% 43% 1.49% 1.10%
Total 68% 14,764 15% 100% 1.50% 1.03%

26 Policybazaar.com
NCB Loss Ratio ACPC Frequency Earned
Proportion
Rate
Realization
Burn Rate
0 79% 15,618 26% 26% 2.06% 1.56%
20 70% 16,515 19% 22% 1.65% 1.13%
25 59% 14,551 16% 19% 1.53% 0.91%
35 66% 15,467 13% 11% 1.34% 0.90%
45 59% 12,368 11% 7% 1.14% 0.70%
50 61% 11,822 8% 14% 1.02% 0.65%
Others 72% 14,224 21% 2% 1.96% 1.19%
Total 68% 14,764 15% 100% 1.50% 1.03%
Vehicle Model Loss Ratio ACPC Frequency Earned
Proportion
Rate
Realization
Burn Rate
A STAR 52% 10,417 12% 2% 1.36% 0.77%
ALTO 70% 12,793 11% 14% 1.40% 1.02%
BALENO 45% 15,659 14% 1% 1.78% 0.55%
CELERIO 74% 17,251 24% 2% 1.65% 1.23%
CIAZ 52% 17,708 35% 2% 1.72% 0.90%
ERTIGA 52% 19,409 23% 5% 1.58% 0.87%
RITZ 54% 12,822 15% 6% 1.45% 0.84%
SWIFT 78% 15,476 22% 22% 1.58% 1.26%
SWIFT DZIRE 77% 18,642 22% 18% 1.56% 1.22%
SX4 58% 14,341 15% 4% 1.26% 0.78%
WAGON R 58% 12,000 13% 18% 1.44% 0.87%
ZEN 43% 10,406 7% 3% 1.33% 0.63%
Others 88% 17,986 10% 4% 1.50% 1.19%
Total 68% 14,764 15% 100% 1.50% 1.03%
Fuel Type Loss Ratio ACPC Frequency Earned
Proportion
Rate
Realization
Burn Rate
Petrol 57% 12,730 12% 62% 1.44% 0.83%
Diesel 85% 19,114 27% 28% 1.62% 1.39%
CNG 83% 16,108 20% 7% 1.57% 1.39%
Others 81% 12,978 24% 3% 1.75% 1.51%
Total 68% 14,764 15% 100% 1.50% 1.03%

Policybazaar.com 27
Vehicle Age Loss Ratio ACPC Frequency Earned
Proportion
Rate
Realization
Burn Rate
1 69% 18,897 26% 17% 1.74% 1.16%
2 70% 17,571 23% 18% 1.66% 1.18%
3 78% 17,200 22% 15% 1.58% 1.28%
4 75% 15,170 19% 12% 1.49% 1.12%
5 67% 12,693 14% 9% 1.30% 0.89%
6 52% 11,022 11% 8% 1.24% 0.67%
7 50% 10,135 10% 5% 1.24% 0.63%
8 58% 9,783 10% 4% 1.26% 0.77%
9 55% 10,448 8% 3% 1.30% 0.71%
10 66% 12,466 7% 2% 1.35% 0.92%
Others 68% 13,318 12% 7% 1.64% 1.20%
Total 68% 14,764 15% 100% 1.50% 1.03%
Assistance Type Loss Ratio ACPC Frequency Earned
Proportion
Rate
Realization
Burn Rate
Unassisted 66% 14,742 13% 33% 1.42% 0.97%
Assisted 66% 14,716 16% 66% 1.54% 1.02%
Others 485% 16,079 96% 0% 2.14% 9.79%
Total 68% 14,764 15% 100% 1.50% 1.03%
Talk time
(minutes)
Loss Ratio ACPC Frequency Earned
Proportion
Rate
Realization
Burn Rate
0-3 65% 14,704 13% 30% 1.42% 0.95%
3-5 77% 15,042 15% 3% 1.42% 1.13%
5-7 49% 11,377 13% 3% 1.43% 0.72%
7-10 62% 13,298 15% 4% 1.47% 0.94%
10+ 67% 14,978 16% 59% 1.55% 1.03%
Others 485% 16,079 96% 0% 2.14% 9.79%
Total 68% 14,764 15% 100% 1.50% 1.03%

28 Policybazaar.com
Days to expiry
of current policy
Loss Ratio ACPC Frequency Earned
Proportion
Rate
Realization
Burn Rate
0 79% 17,687 15% 12% 1.54% 1.22%
1 67% 14,845 15% 12% 1.51% 1.01%
2 72% 15,376 15% 8% 1.49% 1.08%
3 65% 14,487 15% 6% 1.49% 0.95%
4 54% 12,421 14% 5% 1.50% 0.78%
5 51% 12,436 13% 4% 1.49% 0.76%
6-10 61% 13,917 14% 14% 1.45% 0.88%
11-15 57% 12,845 14% 13% 1.54% 0.86%
16-20 71% 15,518 15% 7% 1.46% 1.06%
21-30 65% 15,727 13% 6% 1.42% 0.93%
31-45 67% 15,143 14% 3% 1.36% 0.92%
Others 91% 15,092 25% 10% 1.68% 1.69%
Total 68% 14,764 15% 100% 1.50% 1.03%
1.2 Hyundai
Registration state Loss Ratio ACPC Frequency Earned
Proportion
Rate
Realization
Burn Rate
Karnataka 65% 14,902 19% 9% 1.58% 1.02%
Andhra Pradesh 60% 12,706 20% 4% 1.63% 1.06%
Maharashtra 51% 14,232 17% 16% 1.65% 0.84%
Delhi 63% 14,237 17% 19% 1.62% 1.00%
Tamil Nadu 61% 14,982 16% 3% 1.55% 0.98%
Rajasthan 98% 22,195 20% 3% 1.70% 1.66%
Uttar Pradesh 93% 19,673 20% 8% 1.68% 1.60%
Gujarat 64% 17,395 20% 5% 1.74% 1.15%
Haryana 90% 19,265 21% 12% 1.69% 1.53%
Others 81% 15,316 24% 21% 1.60% 1.32%
Total 72% 15,988 20% 100% 1.64% 1.18%

Policybazaar.com 29
Registration City Loss Ratio ACPC Frequency Earned
Proportion
Rate
Realization
Burn Rate
NAVI MUMBAI 27% 7,978 14% 1% 1.62% 0.46%
MUMBAI 38% 10,901 16% 4% 1.58% 0.60%
PUNE 46% 13,853 16% 4% 1.68% 0.77%
SURAT 49% 14,811 17% 1% 1.79% 0.87%
BANGALORE 61% 13,656 20% 8% 1.59% 0.96%
CHENNAI 62% 14,373 16% 2% 1.54% 0.98%
THANE 62% 14,887 20% 2% 1.62% 1.01%
DELHI 63% 14,237 17% 19% 1.62% 1.00%
HYDERABAD 72% 11,296 25% 1% 1.65% 1.33%
GURGAON 75% 18,194 20% 6% 1.67% 1.22%
FARIDABAD 77% 13,398 24% 2% 1.68% 1.35%
GHAZIABAD 78% 15,995 22% 2% 1.71% 1.35%
NOIDA 87% 25,802 16% 2% 1.70% 1.47%
Others 81% 17,419 21% 48% 1.65% 1.35%
Total 72% 15,988 20% 100% 1.64% 1.18%
Vehicle Model Loss Ratio ACPC Frequency Earned
Proportion
Rate
Realization
Burn Rate
ACCENT 58% 15,539 11% 2% 1.45% 0.88%
CRETA 32% 19,422 29% 2% 1.72% 0.57%
ELITE I20 50% 15,331 37% 1% 1.97% 1.00%
EON 86% 14,348 22% 7% 1.63% 1.47%
GRAND I10 68% 16,294 31% 12% 1.82% 1.29%
I 10 67% 12,792 17% 22% 1.48% 1.07%
I 20 88% 20,496 28% 23% 1.74% 1.58%
SANTRO 69% 12,864 12% 13% 1.45% 1.15%
VERNA 67% 21,420 26% 10% 1.64% 1.16%
XCENT 53% 17,763 26% 5% 1.80% 1.00%
Others 95% 15,334 29% 2% 1.69% 1.54%
Total 72% 15,988 20% 100% 1.64% 1.18%

30 Policybazaar.com
NCB Loss Ratio ACPC Frequency Earned
Proportion
Rate
Realization
Burn Rate
0 90% 17,658 35% 28% 2.21% 1.90%
20 63% 16,201 23% 24% 1.76% 1.09%
25 66% 15,830 20% 17% 1.63% 1.06%
35 70% 15,793 17% 10% 1.44% 1.03%
45 71% 15,058 14% 6% 1.24% 0.91%
50 65% 12,815 9% 11% 1.07% 0.72%
Others 58% 13,753 20% 4% 1.96% 1.06%
Total 72% 15,988 20% 100% 1.64% 1.18%
Fuel Type Loss Ratio ACPC Frequency Earned
Proportion
Rate
Realization
Burn Rate
Petrol 66% 14,758 17% 70% 1.58% 1.05%
Diesel 85% 20,721 38% 23% 1.82% 1.55%
CNG 98% 16,444 20% 2% 1.55% 1.63%
Others 83% 13,454 29% 4% 2.00% 2.01%
Total 72% 15,988 20% 100% 1.64% 1.18%
Vehicle Age Loss Ratio ACPC Frequency Earned
Proportion
Rate
Realization
Burn Rate
1 65% 19,350 30% 21% 1.82% 1.16%
2 76% 18,489 29% 19% 1.82% 1.36%
3 75% 17,096 26% 14% 1.74% 1.32%
4 80% 16,741 22% 12% 1.67% 1.32%
5 75% 14,932 17% 8% 1.42% 1.09%
6 72% 12,599 15% 7% 1.30% 0.96%
7 62% 11,648 12% 4% 1.32% 0.82%
8 65% 11,510 11% 3% 1.35% 0.86%
9 60% 10,695 10% 2% 1.37% 0.84%
10 58% 9,363 10% 1% 1.40% 0.80%
Others 72% 14,054 18% 9% 1.73% 1.43%
Total 72% 15,988 20% 100% 1.64% 1.18%

Policybazaar.com 31
Assistance Type Loss Ratio ACPC Frequency Earned
Proportion
Rate
Realization
Burn Rate
Unassisted 60% 14,340 16% 36% 1.55% 0.94%
Assisted 72% 16,859 20% 63% 1.68% 1.22%
Others 717% 16,607 189% 1% 2.07% 13.59%
Total 72% 15,988 20% 100% 1.64% 1.18%
Talk time
(minutes)
Loss Ratio ACPC Frequency Earned
Proportion
Rate
Realization
Burn Rate
0-3 61% 14,609 16% 33% 1.55% 0.60%
3-5 56% 11,936 18% 3% 1.57% 0.49%
5-7 51% 13,370 15% 3% 1.56% 0.35%
7-10 61% 13,528 18% 4% 1.58% 0.38%
10+ 74% 17,253 21% 56% 1.70% 0.72%
Others 717% 16,607 189% 1% 2.07% 3.24%
Total 72% 15,988 20% 100% 1.64% 1.18%
Days to expiry
of current policy
Loss Ratio ACPC Frequency Earned
Proportion
Rate
Realization
Burn Rate
0 82% 18,862 20% 12% 1.68% 1.39%
1 67% 15,617 18% 12% 1.63% 1.09%
2 75% 16,962 19% 8% 1.63% 1.22%
3 73% 17,837 17% 6% 1.63% 1.16%
4 72% 16,961 18% 5% 1.62% 1.15%
5 48% 12,705 16% 4% 1.60% 0.75%
6-10 57% 14,882 16% 13% 1.58% 0.90%
11-15 62% 13,294 19% 15% 1.61% 0.98%
16-20 62% 14,946 18% 7% 1.60% 1.02%
21-30 78% 18,617 18% 5% 1.60% 1.19%
31-45 60% 15,760 17% 3% 1.60% 0.92%
Others 115% 16,499 41% 10% 1.91% 2.33%
Total 72% 15,988 20% 100% 1.64% 1.18%

32 Policybazaar.com
1.3 Honda
Registration state Loss Ratio ACPC Frequency Earned
Proportion
Rate
Realization
Burn Rate
Karnataka 59% 18,964 20% 11% 1.48% 0.86%
Andhra Pradesh 52% 15,384 21% 3% 1.49% 0.84%
Maharashtra 64% 20,723 19% 20% 1.45% 0.92%
Delhi 65% 23,063 18% 22% 1.59% 1.01%
Tamil Nadu 66% 18,098 22% 4% 1.47% 0.94%
Rajasthan 62% 22,657 21% 2% 1.78% 1.08%
Uttar Pradesh 77% 24,707 23% 7% 1.65% 1.28%
Gujarat 58% 16,817 24% 4% 1.51% 0.93%
Haryana 72% 21,849 20% 11% 1.42% 1.02%
Others 92% 24,141 27% 16% 1.56% 1.44%
Total 69% 21,642 21% 100% 1.52% 1.05%
Registration City Loss Ratio ACPC Frequency Earned
Proportion
Rate
Realization
Burn Rate
SURAT 30% 10,724 22% 1% 1.62% 0.57%
HYDERABAD 35% 13,465 15% 1% 1.43% 0.59%
CHENNAI 40% 12,602 19% 2% 1.46% 0.58%
NOIDA 43% 16,077 20% 3% 1.65% 0.70%
THANE 46% 20,450 11% 2% 1.35% 0.61%
PUNE 50% 18,551 18% 4% 1.54% 0.76%
MUMBAI 53% 15,963 18% 8% 1.36% 0.75%
BANGALORE 55% 17,093 21% 11% 1.49% 0.82%
GHAZIABAD 61% 24,949 18% 2% 1.68% 1.06%
GURGAON 65% 21,737 19% 8% 1.36% 0.90%
NAVI MUMBAI 66% 14,880 23% 1% 1.40% 0.95%
DELHI 65% 23,063 18% 22% 1.59% 1.01%
FARIDABAD 70% 20,509 21% 2% 1.45% 1.04%
Others 87% 24,795 25% 34% 1.58% 1.36%
Total 69% 21,642 21% 100% 1.52% 1.05%

Policybazaar.com 33
Vehicle Model Loss Ratio ACPC Frequency Earned
Proportion
Rate
Realization
Burn Rate
ACCORD 78% 28,453 18% 2% 1.11% 1.02%
AMAZE 85% 26,947 27% 24% 1.75% 1.55%
BRIO 59% 16,203 19% 8% 1.64% 1.06%
CITY 77% 18,245 20% 23% 1.39% 1.08%
CIVIC 64% 22,170 14% 7% 1.16% 0.82%
CR-V 41% 30,135 11% 2% 1.24% 0.51%
JAZZ 61% 17,086 26% 6% 1.66% 0.95%
MOBILIO 41% 21,371 23% 4% 1.77% 0.73%
NEW CITY 58% 23,912 19% 24% 1.49% 0.88%
Others 421% 15,758 316% 0% 1.84% 6.22%
Total 69% 21,642 21% 100% 1.52% 1.05%
Fuel Type Loss Ratio ACPC Frequency Earned
Proportion
Rate
Realization
Burn Rate
Petrol 63% 20,015 18% 75% 1.46% 0.91%
Diesel 88% 26,608 35% 23% 1.77% 1.58%
CNG - - - 0% 1.23% -
Others 121% 22,585 31% 2% 2.10% 2.35%
Total 69% 21,642 21% 100% 1.52% 1.05%
Vehicle Age Loss Ratio ACPC Frequency Earned
Proportion
Rate
Realization
Burn Rate
1 69% 26,513 28% 28% 1.71% 1.19%
2 67% 23,374 26% 21% 1.71% 1.12%
3 75% 21,366 24% 10% 1.63% 1.22%
4 69% 19,649 21% 6% 1.48% 1.15%
5 58% 18,591 18% 5% 1.28% 0.88%
6 77% 19,120 19% 5% 1.18% 0.98%
7 67% 17,936 15% 4% 1.02% 0.73%
8 45% 14,699 11% 5% 1.19% 0.56%
9 121% 25,712 15% 4% 1.20% 1.48%
10 47% 10,180 14% 3% 1.24% 0.59%
Others 72% 19,397 19% 9% 1.58% 1.04%
Total 69% 21,642 21% 100% 1.52% 1.05%

34 Policybazaar.com
NCB Loss Ratio ACPC Frequency Earned
Proportion
Rate
Realization
Burn Rate
0 75% 22,302 30% 29% 1.97% 1.45%
20 71% 24,203 24% 29% 1.60% 1.17%
25 61% 22,321 19% 19% 1.51% 0.93%
35 74% 21,510 18% 9% 1.34% 0.99%
45 60% 15,769 15% 4% 0.99% 0.61%
50 55% 14,284 12% 9% 0.94% 0.55%
Others 113% 26,682 24% 2% 1.67% 1.68%
Total 69% 21,642 21% 100% 1.52% 1.05%
Days to expiry
of current policy
Loss Ratio ACPC Frequency Earned
Proportion
Rate
Realization
Burn Rate
0 74% 23,417 21% 12% 1.57% 1.17%
1 79% 22,510 23% 12% 1.54% 1.19%
2 61% 19,210 21% 9% 1.55% 0.94%
3 63% 19,121 21% 6% 1.51% 0.96%
4 41% 14,727 18% 5% 1.50% 0.61%
5 80% 22,361 23% 5% 1.51% 1.19%
6-10 73% 27,472 17% 14% 1.49% 1.09%
11-15 68% 21,053 20% 13% 1.42% 0.95%
16-20 65% 20,066 21% 8% 1.48% 0.95%
21-30 70% 23,439 19% 5% 1.46% 1.00%
31-45 43% 17,591 15% 3% 1.44% 0.63%
Others 81% 19,982 32% 9% 1.81% 1.56%
Total 69% 21,642 21% 100% 1.52% 1.05%
Assistance Type Loss Ratio ACPC Frequency Earned
Proportion
Rate
Realization
Burn Rate
Unassisted 54% 17,706 17% 33% 1.44% 0.79%
Assisted 74% 23,247 22% 66% 1.55% 1.15%
Others 372% 28,517 98% 1% 1.88% 6.57%
Total 69% 21,642 21% 100% 1.52% 1.05%

Policybazaar.com 35
Talk time
(minutes)
Loss Ratio ACPC Frequency Earned
Proportion
Rate
Realization
Burn Rate
0-3 54% 17,440 18% 30% 1.44% 0.78%
3-5 54% 21,028 15% 3% 1.46% 0.80%
5-7 67% 16,493 23% 3% 1.44% 0.95%
7-10 86% 29,484 17% 4% 1.49% 1.25%
10+ 73% 23,315 22% 60% 1.57% 1.15%
Others 372% 28,517 98% 1% 1.88% 6.57%
Total 69% 21,642 21% 100% 1.52% 1.05%
1.4 Mahindra
Registration state Loss Ratio ACPC Frequency Earned
Proportion
Rate
Realization
Burn Rate
Karnataka 45% 33,579 10% 10% 1.22% 0.55%
Andhra Pradesh 51% 34,820 10% 2% 1.31% 0.67%
Maharashtra 58% 34,550 14% 21% 1.37% 0.81%
Delhi 65% 42,709 13% 11% 1.44% 0.93%
Tamil Nadu 60% 27,180 14% 3% 1.23% 0.75%
Rajasthan 46% 32,687 11% 3% 1.48% 0.65%
Uttar Pradesh 97% 48,299 17% 8% 1.47% 1.46%
Gujarat 82% 34,487 21% 4% 1.48% 1.16%
Haryana 59% 27,087 19% 10% 1.43% 0.83%
Others 55% 28,902 16% 26% 1.38% 0.76%
Total 60% 33,695 15% 100% 1.38% 0.83%
NCB Loss Ratio ACPC Frequency Earned
Proportion
Rate
Realization
Burn Rate
0 54% 31,553 22% 26% 1.86% 0.99%
20 71% 39,977 19% 28% 1.47% 1.05%
25 46% 28,778 14% 19% 1.33% 0.61%
35 84% 53,393 11% 12% 1.18% 1.00%
45 58% 26,726 12% 7% 1.05% 0.62%
50 49% 18,797 9% 8% 0.93% 0.44%
Others 46% 18,747 25% 1% 1.59% 0.42%
Total 60% 33,695 15% 100% 1.38% 0.83%

36 Policybazaar.com
Registration City Loss Ratio ACPC Frequency Earned
Proportion
Rate
Realization
Burn Rate
CHENNAI 18% 8,597 15% 1% 1.29% 0.23%
NAVI MUMBAI 20% 22,550 7% 1% 1.38% 0.26%
SURAT 21% 9,962 19% 0% 1.36% 0.33%
MUMBAI 24% 13,514 15% 5% 1.32% 0.32%
PUNE 31% 26,175 10% 3% 1.42% 0.44%
HYDERABAD 32% 14,575 13% 0% 1.15% 0.38%
GURGAON 46% 26,784 17% 7% 1.38% 0.65%
FARIDABAD 54% 14,506 32% 2% 1.42% 0.74%
BANGALORE 55% 35,595 12% 9% 1.23% 0.68%
THANE 65% 32,488 16% 3% 1.29% 0.88%
GHAZIABAD 79% 43,214 19% 1% 1.48% 1.23%
DELHI 65% 42,709 13% 11% 1.44% 0.93%
NOIDA 229% 103,499 26% 1% 1.49% 3.56%
Others 63% 34,569 15% 54% 1.41% 0.87%
Total 60% 33,695 15% 100% 1.38% 0.83%
Fuel Type Loss Ratio ACPC Frequency Earned
Proportion
Rate
Realization
Burn Rate
Petrol 101% 11,514 70% 0% 1.88% 1.87%
Diesel 60% 34,702 14% 98% 1.37% 0.82%
CNG - - - 0% - -
Others 55% 18,123 26% 2% 1.96% 1.34%
Total 60% 33,695 15% 100% 1.38% 0.83%
Talk time
(minutes)
Loss Ratio ACPC Frequency Earned
Proportion
Rate
Realization
Burn Rate
0-3 60% 36,620 12% 29% 1.30% 0.78%
3-5 35% 24,484 10% 3% 1.25% 0.44%
5-7 32% 17,390 13% 3% 1.29% 0.43%
7-10 51% 21,055 20% 4% 1.36% 0.72%
10+ 61% 34,033 16% 61% 1.42% 0.88%
Others 363% 54,225 48% 0% 1.89% 6.00%
Total 60% 33,695 15% 100% 1.38% 0.83%

Policybazaar.com 37
Vehicle Model Loss Ratio ACPC Frequency Earned
Proportion
Rate
Realization
Burn Rate
BOLERO 27% 28,960 5% 8% 1.38% 0.39%
QUANTO 57% 27,509 15% 4% 1.50% 0.96%
SCORPIO 60% 29,260 13% 20% 1.33% 0.79%
THAR 43% 94,421 3% 1% 1.43% 0.61%
TUV 300 74% 34,878 26% 3% 1.71% 1.33%
VERITO 122% 34,812 19% 3% 1.37% 1.89%
XUV 500 62% 41,032 20% 51% 1.35% 0.89%
XYLO 57% 26,074 12% 8% 1.25% 0.78%
Others 90% 12,340 46% 1% 1.73% 1.32%
Total 60% 33,695 15% 100% 1.38% 0.83%
Vehicle Age Loss Ratio ACPC Frequency Earned
Proportion
Rate
Realization
Burn Rate
1 63% 41,085 20% 26% 1.49% 0.98%
2 40% 28,810 15% 21% 1.43% 0.58%
3 65% 35,910 16% 18% 1.33% 0.88%
4 76% 35,148 15% 12% 1.31% 1.03%
5 81% 32,960 12% 5% 1.13% 0.93%
6 62% 25,649 9% 3% 1.10% 0.70%
7 60% 16,589 12% 2% 1.13% 0.70%
8 49% 17,606 8% 1% 1.15% 0.53%
9 52% 23,754 6% 1% 1.07% 0.59%
10 135% 24,704 14% 1% 1.20% 1.52%
Others 55% 35,720 16% 10% 1.50% 0.79%
Total 60% 33,695 15% 100% 1.38% 0.83%
Assistance Type Loss Ratio ACPC Frequency Earned
Proportion
Rate
Realization
Burn Rate
Unassisted 58% 35,655 12% 32% 1.29% 0.75%
Assisted 60% 32,370 16% 68% 1.41% 0.85%
Others 363% 54,225 48% 0% 1.89% 6.00%
Total 60% 33,695 15% 100% 1.38% 0.83%

38 Policybazaar.com
Days to expiry
of current policy
Loss Ratio ACPC Frequency Earned
Proportion
Rate
Realization
Burn Rate
0 52% 24,851 17% 15% 1.40% 0.74%
1 72% 34,901 16% 14% 1.36% 0.97%
2 99% 49,931 16% 9% 1.38% 1.34%
3 83% 52,785 13% 6% 1.40% 1.17%
4 54% 41,716 10% 4% 1.33% 0.67%
5 54% 29,991 15% 4% 1.36% 0.73%
6-10 55% 32,015 14% 13% 1.32% 0.72%
11-15 36% 19,715 15% 11% 1.39% 0.47%
16-20 35% 26,694 11% 6% 1.28% 0.47%
21-30 10% 7,831 10% 4% 1.28% 0.12%
31-45 95% 50,591 15% 3% 1.30% 1.18%
Others 74% 43,175 19% 12% 1.69% 1.27%
Total 60% 33,695 15% 100% 1.38% 0.83%
1.5 Toyota
Registration state Loss Ratio ACPC Frequency Earned
Proportion
Rate
Realization
Burn Rate
Karnataka 44% 28,369 11% 11% 1.33% 0.59%
Andhra Pradesh 39% 14,987 18% 4% 1.49% 0.64%
Maharashtra 68% 26,536 18% 18% 1.39% 0.94%
Delhi 59% 24,535 18% 20% 1.53% 0.90%
Tamil Nadu 92% 28,910 22% 3% 1.55% 1.46%
Rajasthan 72% 23,560 27% 2% 1.84% 1.43%
Uttar Pradesh 85% 26,278 32% 7% 1.86% 1.50%
Gujarat 108% 28,901 28% 3% 1.54% 1.71%
Haryana 78% 25,527 27% 17% 1.61% 1.31%
Others 122% 38,684 26% 15% 1.55% 1.82%
Total 76% 27,856 21% 100% 1.51% 1.15%

Policybazaar.com 39
Registration City Loss Ratio ACPC Frequency Earned
Proportion
Rate
Realization
Burn Rate
HYDERABAD 17% 6,071 17% 1% 1.42% 0.26%
BANGALORE 28% 19,525 10% 10% 1.32% 0.38%
MUMBAI 43% 19,405 15% 8% 1.35% 0.59%
NAVI MUMBAI 47% 21,799 14% 1% 1.19% 0.56%
NOIDA 54% 19,865 27% 2% 1.72% 0.95%
DELHI 59% 24,535 18% 20% 1.53% 0.90%
SURAT 63% 16,800 31% 0% 1.50% 1.00%
GURGAON 69% 26,556 23% 11% 1.55% 1.13%
THANE 89% 51,421 9% 2% 1.23% 1.18%
PUNE 89% 24,309 24% 3% 1.54% 1.32%
CHENNAI 117% 45,998 15% 1% 1.47% 1.71%
FARIDABAD 126% 25,704 41% 3% 1.69% 2.22%
GHAZIABAD 128% 36,483 33% 2% 1.88% 2.22%
Others 96% 31,957 25% 35% 1.59% 1.53%
Total 76% 27,856 21% 100% 1.51% 1.15%
Vehicle Model Loss Ratio ACPC Frequency Earned
Proportion
Rate
Realization
Burn Rate
CAMRY 83% 43,892 17% 1% 1.40% 1.00%
COROLLA 35% 13,273 10% 5% 1.19% 0.42%
COROLLA ALTIS 104% 38,534 24% 12% 1.29% 1.40%
ETIOS 82% 19,518 28% 23% 1.74% 1.49%
ETIOS CROSS 22% 10,149 21% 1% 1.55% 0.38%
ETIOS LIVA 110% 22,890 31% 13% 1.83% 2.14%
FORTUNER 45% 49,146 18% 14% 1.52% 0.69%
INNOVA 67% 44,752 12% 29% 1.46% 0.98%
Others 110% 18,523 23% 1% 1.06% 1.08%
Total 76% 27,856 21% 100% 1.51% 1.15%

40 Policybazaar.com
NCB Loss Ratio ACPC Frequency Earned
Proportion
Rate
Realization
Burn Rate
0 77% 24,335 34% 29% 2.09% 1.57%
20 72% 30,414 23% 23% 1.65% 1.20%
25 74% 24,739 26% 17% 1.56% 1.14%
35 69% 25,199 19% 10% 1.38% 0.96%
45 75% 29,594 13% 7% 1.16% 0.86%
50 61% 32,032 8% 12% 0.95% 0.61%
Others 215% 72,047 23% 2% 1.86% 3.43%
Total 76% 27,856 21% 100% 1.51% 1.15%
Fuel Type Loss Ratio ACPC Frequency Earned
Proportion
Rate
Realization
Burn Rate
Petrol 72% 22,098 19% 31% 1.42% 1.04%
Diesel 72% 29,768 22% 66% 1.56% 1.13%
CNG - - - - - -
Others 227% 59,002 29% 2% 2.33% 4.94%
Total 76% 27,856 21% 100% 1.51% 1.15%
Vehicle Age Loss Ratio ACPC Frequency Earned
Proportion
Rate
Realization
Burn Rate
1 53% 32,055 25% 15% 1.74% 0.90%
2 101% 31,454 38% 16% 1.74% 1.60%
3 79% 26,561 29% 16% 1.75% 1.34%
4 85% 24,621 26% 16% 1.70% 1.31%
5 61% 20,967 18% 11% 1.43% 0.95%
6 43% 21,891 13% 6% 1.15% 0.56%
7 99% 43,713 12% 4% 1.10% 1.09%
8 75% 39,663 8% 3% 1.11% 0.82%
9 68% 37,107 7% 3% 1.10% 0.77%
10 25% 10,460 9% 2% 1.17% 0.29%
Others 94% 32,643 17% 8% 1.45% 1.44%
Total 76% 27,856 21% 100% 1.51% 1.15%

Policybazaar.com 41
Assistance Type Loss Ratio ACPC Frequency Earned
Proportion
Rate
Realization
Burn Rate
Unassisted 55% 23,459 16% 35% 1.37% 0.78%
Assisted 79% 27,847 24% 64% 1.59% 1.27%
Others 675% 85,075 80% 1% 1.92% 14.08%
Total 76% 27,856 21% 100% 1.51% 1.15%
Talk time
(minutes)
Loss Ratio ACPC Frequency Earned
Proportion
Rate
Realization
Burn Rate
0-3 56% 23,680 16% 31% 1.38% 0.79%
3-5 46% 21,258 13% 3% 1.32% 0.64%
5-7 92% 23,613 26% 3% 1.35% 1.37%
7-10 97% 32,327 21% 4% 1.43% 1.49%
10+ 77% 27,830 24% 58% 1.61% 1.24%
Others 675% 85,075 80% 1% 1.92% 14.08%
Total 76% 27,856 21% 100% 1.51% 1.15%
Days to expiry
of current policy
Loss Ratio ACPC Frequency Earned
Proportion
Rate
Realization
Burn Rate
0 77% 28,771 22% 13% 1.60% 1.22%
1 77% 28,282 22% 12% 1.56% 1.21%
2 105% 32,106 25% 9% 1.47% 1.58%
3 68% 23,249 24% 7% 1.54% 1.06%
4 58% 24,253 17% 5% 1.49% 0.85%
5 48% 24,304 15% 4% 1.47% 0.69%
6-10 61% 26,600 18% 14% 1.56% 0.96%
11-15 66% 30,297 15% 13% 1.40% 0.94%
16-20 43% 18,181 16% 7% 1.31% 0.61%
21-30 85% 34,750 17% 4% 1.50% 1.24%
31-45 42% 12,783 22% 2% 1.31% 0.53%
Others 131% 31,622 35% 10% 1.69% 2.32%
Total 76% 27,856 21% 100% 1.51% 1.15%

42 Policybazaar.com
2. LR Model by Geography
2.1 Delhi
Vehicle Make Loss
Ratio
ACPC Frequency Earned
Proportion
Rate
Realization
Burn
Rate
CHEVROLET 38% 12,835 11% 4% 1.54% 0.60%
FORD 77% 28,636 17% 5% 1.68% 1.25%
HONDA 65% 23,063 18% 10% 1.59% 1.01%
HYUNDAI 63% 14,237 17% 23% 1.62% 1.00%
MAHINDRA & MAHINDRA 65% 42,709 13% 3% 1.44% 0.93%
MARUTI 62% 15,729 13% 31% 1.54% 0.95%
SKODA 74% 28,169 22% 3% 1.67% 1.30%
TATA 85% 41,936 7% 2% 1.52% 1.32%
TOYOTA 59% 24,535 18% 6% 1.53% 0.90%
VOLKSWAGEN 85% 26,373 27% 5% 1.90% 1.74%
OTHERS 91% 48,769 17% 7% 1.58% 1.50%
Total 66% 19,371 15% 100% 1.59% 1.04%
Vehicle Age Loss
Ratio
ACPC Frequency Earned
Proportion
Rate
Realization
Burn
Rate
1 76% 27,797 26% 18% 1.81% 1.40%
2 65% 21,146 24% 18% 1.79% 1.14%
3 67% 20,778 20% 14% 1.75% 1.14%
4 71% 19,035 19% 14% 1.67% 1.15%
5 64% 17,516 13% 10% 1.41% 0.90%
6 47% 11,589 12% 8% 1.28% 0.61%
7 99% 22,428 11% 5% 1.26% 1.27%
8 33% 9,468 8% 4% 1.28% 0.44%
9 67% 16,634 8% 3% 1.26% 0.87%
10 63% 12,769 9% 2% 1.29% 0.83%
Others 49% 14,499 9% 5% 1.57% 0.76%
Total 66% 19,371 15% 100% 1.59% 1.04%

Policybazaar.com 43
NCB Loss
Ratio
ACPC Frequency Earned
Proportion
Rate
Realization
Burn
Rate
0 85% 23,647 27% 27% 2.21% 1.79%
20 63% 19,847 20% 24% 1.74% 1.09%
25 59% 18,575 16% 18% 1.60% 0.94%
35 53% 17,348 12% 11% 1.43% 0.74%
45 49% 14,303 11% 7% 1.23% 0.61%
50 64% 15,396 8% 13% 1.04% 0.69%
Others - - - 0% 1.62% -
Total 66% 19,371 15% 100% 1.59% 1.04%
Talk time
(minutes)
Loss
Ratio
ACPC Frequency Earned
Proportion
Rate
Realization
Burn
Rate
0-3 64% 18,766 13% 27% 1.51% 0.96%
3-5 61% 17,349 13% 3% 1.50% 0.91%
5-7 37% 15,946 9% 3% 1.48% 0.55%
7-10 63% 17,588 15% 4% 1.50% 0.98%
10+ 66% 19,793 16% 61% 1.64% 1.07%
Others 236% 22,756 54% 1% 1.88% 4.50%
Total 66% 19,371 15% 100% 1.59% 1.04%
Fuel Type Loss
Ratio
ACPC Frequency Earned
Proportion
Rate
Realization
Burn
Rate
Petrol 59% 15,458 13% 60% 1.53% 0.88%
Diesel 78% 29,330 21% 36% 1.68% 1.32%
CNG 76% 17,279 17% 4% 1.57% 1.28%
Others 58% 15,158 16% 1% 1.79% 1.06%
Total 66% 19,371 15% 100% 1.59% 1.04%

44 Policybazaar.com
Assistance Type Loss
Ratio
ACPC Frequency Earned
Proportion
Rate
Realization
Burn
Rate
Unassisted 64% 18,619 13% 30% 1.51% 0.95%
Assisted 64% 19,536 15% 68% 1.62% 1.04%
Others 236% 22,756 54% 1% 1.88% 4.50%
Total 66% 19,371 15% 100% 1.59% 1.04%
Days to expiry
of current policy
Loss
Ratio
ACPC Frequency Earned
Proportion
Rate
Realization
Burn
Rate
0 68% 19,763 16% 13% 1.62% 1.08%
1 68% 19,910 15% 13% 1.58% 1.07%
2 77% 23,766 14% 9% 1.58% 1.20%
3 108% 33,864 14% 6% 1.58% 1.68%
4 50% 17,299 12% 5% 1.56% 0.75%
5 52% 17,079 13% 4% 1.57% 0.77%
6-10 49% 16,538 13% 14% 1.55% 0.77%
11-15 62% 16,105 16% 13% 1.56% 0.93%
16-20 59% 17,302 14% 6% 1.52% 0.90%
21-30 71% 23,599 13% 5% 1.57% 1.09%
31-45 50% 15,571 14% 3% 1.50% 0.75%
Others 78% 16,774 28% 9% 1.79% 1.50%
Total 66% 19,371 15% 100% 1.59% 1.04%
Policybazaar.com 45
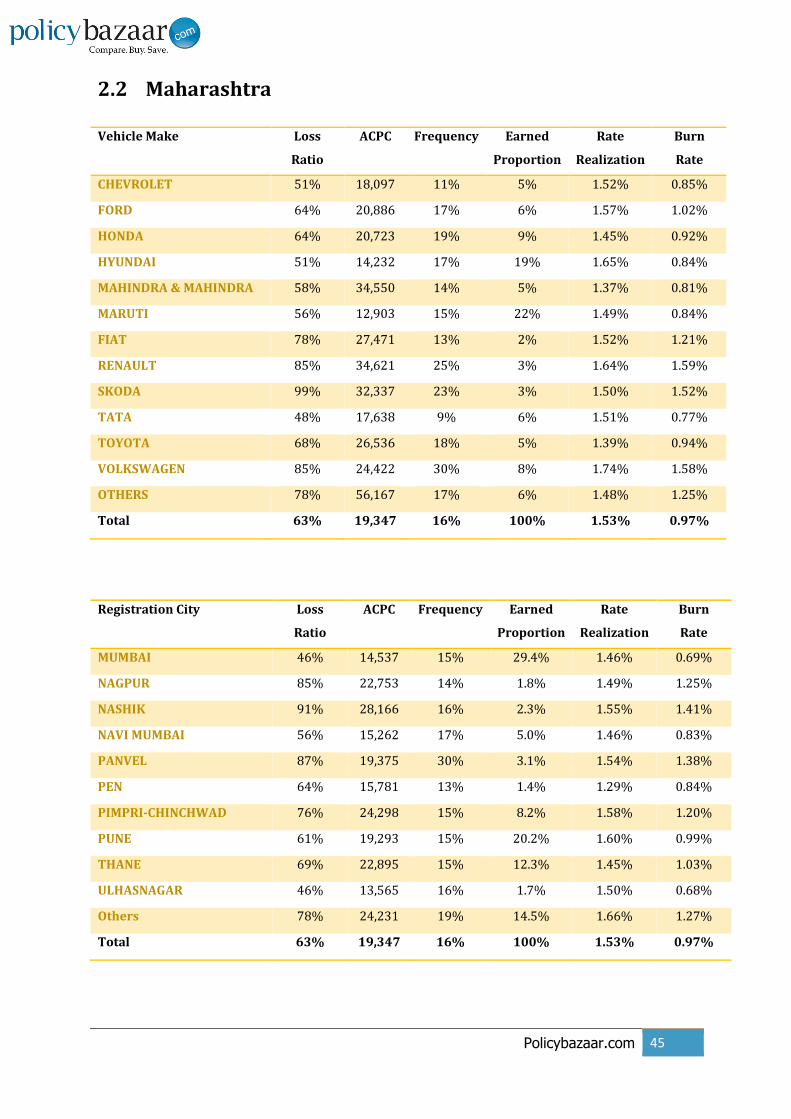
2.2 Maharashtra
Vehicle Make Loss
Ratio
ACPC Frequency Earned
Proportion
Rate
Realization
Burn
Rate
CHEVROLET 51% 18,097 11% 5% 1.52% 0.85%
FORD 64% 20,886 17% 6% 1.57% 1.02%
HONDA 64% 20,723 19% 9% 1.45% 0.92%
HYUNDAI 51% 14,232 17% 19% 1.65% 0.84%
MAHINDRA & MAHINDRA 58% 34,550 14% 5% 1.37% 0.81%
MARUTI 56% 12,903 15% 22% 1.49% 0.84%
FIAT 78% 27,471 13% 2% 1.52% 1.21%
RENAULT 85% 34,621 25% 3% 1.64% 1.59%
SKODA 99% 32,337 23% 3% 1.50% 1.52%
TATA 48% 17,638 9% 6% 1.51% 0.77%
TOYOTA 68% 26,536 18% 5% 1.39% 0.94%
VOLKSWAGEN 85% 24,422 30% 8% 1.74% 1.58%
OTHERS 78% 56,167 17% 6% 1.48% 1.25%
Total 63% 19,347 16% 100% 1.53% 0.97%
Registration City Loss
Ratio
ACPC Frequency Earned
Proportion
Rate
Realization
Burn
Rate
MUMBAI 46% 14,537 15% 29.4% 1.46% 0.69%
NAGPUR 85% 22,753 14% 1.8% 1.49% 1.25%
NASHIK 91% 28,166 16% 2.3% 1.55% 1.41%
NAVI MUMBAI 56% 15,262 17% 5.0% 1.46% 0.83%
PANVEL 87% 19,375 30% 3.1% 1.54% 1.38%
PEN 64% 15,781 13% 1.4% 1.29% 0.84%
PIMPRI-CHINCHWAD 76% 24,298 15% 8.2% 1.58% 1.20%
PUNE 61% 19,293 15% 20.2% 1.60% 0.99%
THANE 69% 22,895 15% 12.3% 1.45% 1.03%
ULHASNAGAR 46% 13,565 16% 1.7% 1.50% 0.68%
Others 78% 24,231 19% 14.5% 1.66% 1.27%
Total 63% 19,347 16% 100% 1.53% 0.97%

46 Policybazaar.com
NCB Loss
Ratio
ACPC Frequency Earned
Proportion
Rate
Realization
Burn
Rate
0 61% 18,978 23% 30% 2.04% 1.23%
20 65% 22,344 19% 25% 1.63% 1.07%
25 63% 20,912 17% 18% 1.52% 0.97%
35 61% 18,202 15% 11% 1.35% 0.86%
45 70% 18,647 13% 6% 1.14% 0.82%
50 57% 14,576 9% 11% 1.00% 0.60%
Others - - - 0% - -
Total 63% 19,347 16% 100% 1.53% 0.97%
Fuel Type Loss
Ratio
ACPC Frequency Earned
Proportion
Rate
Realization
Burn
Rate
Petrol 54% 15,341 14% 54% 1.51% 0.82%
Diesel 73% 26,975 21% 41% 1.55% 1.14%
CNG 75% 14,971 22% 4% 1.60% 1.27%
Others 45% 15,435 12% 1% 1.84% 0.84%
Total 63% 19,347 16% 100% 1.53% 0.97%
Vehicle Age Loss
Ratio
ACPC Frequency Earned
Proportion
Rate
Realization
Burn
Rate
1 55% 23,343 24% 20% 1.70% 0.95%
2 65% 22,332 24% 18% 1.70% 1.11%
3 71% 21,951 21% 15% 1.61% 1.16%
4 77% 20,972 20% 13% 1.57% 1.19%
5 59% 15,276 15% 10% 1.36% 0.82%
6 54% 13,916 12% 7% 1.26% 0.71%
7 56% 14,705 10% 4% 1.25% 0.71%
8 74% 17,293 10% 4% 1.26% 0.97%
9 66% 15,452 9% 3% 1.26% 0.82%
10 54% 12,696 9% 2% 1.30% 0.74%
Others 42% 16,231 10% 6% 1.61% 0.65%
Total 63% 19,347 16% 100% 1.53% 0.97%

Policybazaar.com 47
Assistance Type Loss
Ratio
ACPC Frequency Earned
Proportion
Rate
Realization
Burn
Rate
Unassisted 55% 17,458 14% 35% 1.45% 0.80%
Assisted 65% 20,401 17% 64% 1.57% 1.03%
Others 235% 18,380 66% 1% 2.01% 4.56%
Total 63% 19,347 16% 100% 1.53% 0.97%
Talk time
(minutes)
Loss
Ratio
ACPC Frequency Earned
Proportion
Rate
Realization
Burn
Rate
0-3 53% 16,912 14% 32% 1.45% 0.78%
3-5 71% 23,223 13% 3% 1.45% 1.04%
5-7 56% 16,499 14% 3% 1.47% 0.79%
7-10 81% 22,505 17% 4% 1.51% 1.24%
10+ 64% 20,452 17% 58% 1.58% 1.03%
Others 235% 18,380 66% 1% 2.01% 4.56%
Total 63% 19,347 16% 100% 1.53% 0.97%
Days to expiry
of current policy
Loss
Ratio
ACPC Frequency Earned
Proportion
Rate
Realization
Burn
Rate
0 77% 23,567 16% 12% 1.56% 1.18%
1 64% 19,690 16% 12% 1.53% 1.00%
2 70% 19,878 17% 8% 1.51% 1.05%
3 60% 18,441 16% 6% 1.52% 0.91%
4 47% 15,510 15% 5% 1.54% 0.72%
5 84% 22,716 18% 4% 1.50% 1.28%
6-10 55% 19,465 14% 14% 1.46% 0.82%
11-15 50% 17,221 14% 13% 1.52% 0.73%
16-20 70% 20,685 16% 6% 1.47% 1.03%
21-30 53% 16,528 15% 5% 1.45% 0.77%
31-45 53% 15,889 15% 3% 1.43% 0.74%
Others 67% 18,116 23% 11% 1.81% 1.30%
Total 63% 19,347 16% 100% 1.53% 0.97%

48 Policybazaar.com
2.3 Haryana
Vehicle Make Loss
Ratio
ACPC Frequency Earned
Proportion
Rate
Realization
Burn
Rate
CHEVROLET 48% 16,559 13% 5% 1.52% 0.79%
FORD 66% 24,667 16% 5% 1.62% 1.08%
HONDA 72% 21,849 20% 7% 1.42% 1.02%
HYUNDAI 90% 19,265 21% 22% 1.69% 1.53%
MAHINDRA & MAHINDRA 59% 27,087 19% 4% 1.43% 0.83%
MARUTI 77% 16,759 17% 28% 1.59% 1.23%
RENAULT 79% 35,399 23% 3% 1.68% 1.44%
SKODA 125% 36,765 32% 4% 1.67% 2.23%
TATA 67% 36,128 7% 2% 1.44% 1.05%
TOYOTA 78% 25,527 27% 8% 1.61% 1.31%
VOLKSWAGEN 107% 30,617 33% 7% 1.96% 2.15%
OTHERS 129% 46,000 27% 6% 1.62% 2.09%
Total 84% 22,335 20% 100% 1.61% 1.38%
Registration City Loss
Ratio
ACPC Frequency Earned
Proportion
Rate
Realization
Burn
Rate
AMBALA 61% 14,649 19% 2.1% 1.57% 0.98%
BHIWANI 149% 39,657 22% 1.2% 1.78% 2.73%
FARIDABAD 86% 19,421 22% 20.0% 1.63% 1.43%
GURGAON 74% 22,746 18% 49.8% 1.56% 1.18%
HISAR 121% 24,638 26% 1.7% 1.69% 2.03%
JHAJJAR 112% 23,625 26% 2.1% 1.76% 1.89%
KARNAL 99% 22,701 21% 2.0% 1.62% 1.64%
PALWAL 79% 13,947 28% 1.0% 1.82% 1.36%
PANCHKULA 56% 16,503 15% 2.3% 1.51% 0.88%
PANIPAT 77% 20,789 18% 2.0% 1.57% 1.27%
REWARI 112% 25,993 24% 2.5% 1.74% 2.00%
ROHTAK 88% 21,223 23% 2.9% 1.74% 1.54%
SONEPAT 79% 21,626 18% 2.3% 1.63% 1.26%
Others 122% 29,198 22% 8.1% 1.70% 2.10%
Total 84% 22,335 20% 100% 1.61% 1.38%

Policybazaar.com 49
NCB Loss
Ratio
ACPC Frequency Earned
Proportion
Rate
Realization
Burn
Rate
0 109% 26,298 34% 31% 2.21% 2.36%
20 80% 22,477 24% 23% 1.73% 1.39%
25 72% 20,135 21% 18% 1.62% 1.17%
35 78% 21,161 17% 11% 1.44% 1.14%
45 68% 18,859 13% 7% 1.13% 0.79%
50 57% 15,652 8% 10% 1.03% 0.61%
Others - - - 0% 1.57% -
Total 84% 22,335 20% 100% 1.61% 1.38%
Fuel Type Loss
Ratio
ACPC Frequency Earned
Proportion
Rate
Realization
Burn
Rate
Petrol 65% 15,886 15% 46% 1.51% 0.99%
Diesel 101% 29,472 29% 52% 1.71% 1.75%
CNG 92% 16,360 22% 2% 1.63% 1.60%
Others 39% 21,629 7% 0% 2.03% 0.75%
Total 84% 22,335 20% 100% 1.61% 1.38%
Vehicle Age Loss
Ratio
ACPC Frequency Earned
Proportion
Rate
Realization
Burn
Rate
1 88% 27,316 31% 18% 1.85% 1.62%
2 96% 25,332 31% 20% 1.82% 1.74%
3 98% 24,698 28% 18% 1.77% 1.74%
4 89% 22,389 22% 15% 1.66% 1.46%
5 75% 17,227 17% 10% 1.38% 1.05%
6 55% 16,448 10% 7% 1.25% 0.70%
7 57% 14,956 10% 4% 1.12% 0.65%
8 44% 10,405 9% 3% 1.24% 0.55%
9 52% 12,516 8% 2% 1.24% 0.68%
10 60% 11,562 9% 1% 1.29% 0.78%
Others 75% 25,014 13% 4% 1.72% 1.24%
Total 84% 22,335 20% 100% 1.61% 1.38%

50 Policybazaar.com
Assistance Type Loss
Ratio
ACPC Frequency Earned
Proportion
Rate
Realization
Burn
Rate
Unassisted 67% 18,716 16% 30% 1.52% 1.02%
Assisted 89% 24,020 21% 70% 1.65% 1.51%
Others 2764% 17,730 373% 0% - -
Total 84% 22,335 20% 100% 1.61% 1.38%
Talk time
(minutes)
Loss
Ratio
ACPC Frequency Earned
Proportion
Rate
Realization
Burn
Rate
0-3 64% 18,530 16% 27% 1.53% 0.98%
3-5 87% 19,973 19% 3% 1.45% 1.31%
5-7 63% 17,896 16% 3% 1.47% 0.99%
7-10 87% 22,161 19% 4% 1.57% 1.37%
10+ 90% 24,406 21% 63% 1.67% 1.54%
Others 2764% 17,730 373% 0% - -
Total 84% 22,335 20% 100% 1.61% 1.38%
Days to expiry
of current policy
Loss
Ratio
ACPC Frequency Earned
Proportion
Rate
Realization
Burn
Rate
0 110% 28,843 21% 14% 1.67% 1.94%
1 71% 20,048 18% 13% 1.63% 1.14%
2 87% 22,901 20% 10% 1.59% 1.49%
3 89% 23,565 19% 6% 1.63% 1.46%
4 66% 20,887 16% 5% 1.64% 1.07%
5 52% 16,962 15% 4% 1.60% 0.83%
6-10 88% 24,004 18% 13% 1.59% 1.42%
11-15 68% 21,040 16% 12% 1.49% 1.00%
16-20 66% 16,817 20% 6% 1.51% 1.02%
21-30 82% 20,525 20% 4% 1.54% 1.29%
31-45 108% 26,816 19% 2% 1.46% 1.62%
Others 104% 19,838 35% 9% 1.88% 2.03%
Total 84% 22,335 20% 100% 1.61% 1.38%

Policybazaar.com 51
2.4 Karnataka
Vehicle Make Loss
Ratio
ACPC Frequency Earned
Proportion
Rate
Realization
Burn
Rate
CHEVROLET 50% 19,505 9% 4% 1.46% 0.76%
FORD 45% 21,140 12% 10% 1.50% 0.68%
HONDA 59% 18,964 20% 9% 1.48% 0.86%
HYUNDAI 65% 14,902 19% 20% 1.58% 1.02%
MAHINDRA & MAHINDRA 45% 33,579 10% 5% 1.22% 0.55%
MARUTI 54% 11,916 14% 20% 1.40% 0.76%
FIAT 58% 16,225 19% 3% 1.58% 0.95%
RENAULT 105% 36,299 28% 3% 1.54% 1.71%
SKODA 72% 26,477 21% 4% 1.60% 1.12%
TATA 48% 20,862 7% 5% 1.48% 0.72%
TOYOTA 44% 28,369 11% 6% 1.33% 0.59%
VOLKSWAGEN 55% 22,106 22% 7% 1.77% 1.01%
OTHERS 99% 49,100 19% 4% 1.42% 1.36%
Total 59% 18,140 15% 100% 1.48% 0.86%
Vehicle Age Loss
Ratio
ACPC Frequency Earned
Proportion
Rate
Realization
Burn
Rate
1 55% 22,232 23% 19% 1.62% 0.90%
2 62% 20,454 23% 18% 1.61% 0.98%
3 70% 21,407 20% 14% 1.56% 1.05%
4 64% 19,760 16% 13% 1.49% 0.92%
5 64% 17,794 13% 9% 1.35% 0.84%
6 52% 13,892 11% 7% 1.23% 0.66%
7 58% 11,287 13% 4% 1.22% 0.71%
8 61% 14,174 10% 4% 1.23% 0.79%
9 37% 10,262 8% 3% 1.22% 0.47%
10 65% 12,118 11% 2% 1.30% 0.84%
Others 36% 14,344 10% 7% 1.61% 0.55%
Total 59% 18,140 15% 100% 1.48% 0.86%

52 Policybazaar.com
Registration City Loss
Ratio
ACPC Frequency Earned
Proportion
Rate
Realization
Burn
Rate
BANGALORE 55% 17,058 15% 85.1% 1.49% 0.81%
MANGALORE 76% 25,421 12% 1.1% 1.48% 1.06%
MYSORE 56% 16,567 13% 1.5% 1.44% 0.75%
RAJAJINAGAR 69% 19,219 15% 4.1% 1.47% 0.98%
YELAHANKA 81% 19,763 17% 1.3% 1.37% 1.15%
Others 90% 30,740 13% 6.9% 1.44% 1.31%
Total 59% 18,140 15% 100% 1.48% 0.86%
Fuel Type Loss
Ratio
ACPC Frequency Earned
Proportion
Rate
Realization
Burn
Rate
Petrol 53% 14,063 14% 53% 1.49% 0.76%
Diesel 65% 24,577 18% 46% 1.47% 0.95%
CNG 135% 28,891 12% 1% 1.43% 2.09%
Others 9% 17,095 2% 1% 1.67% 0.17%
Total 59% 18,140 15% 100% 1.48% 0.86%
NCB Loss
Ratio
ACPC Frequency Earned
Proportion
Rate
Realization
Burn
Rate
0 58% 17,751 23% 28% 2.00% 1.10%
20 47% 17,049 18% 22% 1.58% 0.75%
25 60% 20,197 16% 19% 1.49% 0.88%
35 67% 20,136 15% 11% 1.34% 0.89%
45 86% 26,396 11% 7% 1.14% 1.00%
50 55% 13,031 9% 12% 1.00% 0.57%
Others - - - 0% - -
Total 59% 18,140 15% 100% 1.48% 0.86%

Policybazaar.com 53
Assistance Type Loss
Ratio
ACPC Frequency Earned
Proportion
Rate
Realization
Burn
Rate
Unassisted 58% 17,978 14% 42% 1.41% 0.81%
Assisted 57% 18,443 16% 57% 1.54% 0.87%
Others 194% 14,587 59% 1% 2.01% 3.44%
Total 59% 18,140 15% 100% 1.48% 0.86%
Talk time Loss
Ratio
ACPC Frequency Earned
Proportion
Rate
Realization
Burn
Rate
0-3 59% 18,500 13% 39% 1.40% 0.81%
3-5 52% 13,546 16% 4% 1.43% 0.76%
5-7 76% 18,680 17% 3% 1.44% 1.10%
7-10 68% 19,540 16% 4% 1.46% 0.99%
10+ 55% 18,317 16% 50% 1.55% 0.84%
Others 194% 14,587 59% 1% 2.01% 3.44%
Total 59% 18,140 15% 100% 1.48% 0.86%
Days to expiry
of current policy
Loss
Ratio
ACPC Frequency Earned
Proportion
Rate
Realization
Burn Rate
0 80% 22,995 16% 11% 1.51% 1.18%
1 61% 17,485 16% 11% 1.44% 0.85%
2 52% 15,276 16% 8% 1.46% 0.76%
3 54% 19,151 13% 6% 1.46% 0.77%
4 47% 15,095 14% 5% 1.48% 0.67%
5 61% 20,943 14% 4% 1.47% 0.86%
6-10 55% 16,583 15% 14% 1.43% 0.77%
11-15 53% 18,145 13% 13% 1.50% 0.75%
16-20 70% 23,583 13% 7% 1.44% 0.98%
21-30 47% 16,333 13% 5% 1.41% 0.66%
31-45 33% 12,905 12% 4% 1.39% 0.42%
Others 65% 17,153 24% 12% 1.76% 1.22%
Total 59% 18,140 15% 100% 1.48% 0.86%

54 Policybazaar.com
Uttar Pradesh
Vehicle Make Loss
Ratio
ACPC Frequency Earned
Proportion
Rate
Realization
Burn
Rate
CHEVROLET 71% 20,570 13% 4% 1.55% 1.19%
FORD 82% 27,891 18% 8% 1.70% 1.35%
HONDA 77% 24,707 23% 8% 1.65% 1.28%
HYUNDAI 93% 19,673 20% 23% 1.68% 1.60%
MAHINDRA & MAHINDRA 97% 48,299 17% 5% 1.47% 1.46%
MARUTI 67% 15,578 14% 28% 1.54% 1.04%
NISSAN MOTORS 76% 21,119 31% 2% 1.83% 1.42%
RENAULT 113% 32,798 39% 3% 1.79% 2.28%
SKODA 79% 32,142 25% 2% 1.64% 1.46%
TATA 75% 27,729 10% 4% 1.44% 1.09%
TOYOTA 85% 26,278 32% 5% 1.86% 1.50%
VOLKSWAGEN 112% 28,279 36% 5% 1.99% 2.27%
OTHERS 25% 17,355 13% 4% 1.70% 0.44%
Total 80% 21,454 18% 100% 1.63% 1.33%
Vehicle Age Loss
Ratio
ACPC Frequency Earned
Proportion
Rate
Realization
Burn
Rate
1 76% 21,186 34% 22% 1.83% 1.43%
2 84% 24,981 26% 21% 1.78% 1.48%
3 79% 21,559 24% 17% 1.71% 1.36%
4 107% 24,438 22% 13% 1.64% 1.71%
5 72% 17,511 14% 8% 1.36% 1.04%
6 51% 11,920 11% 5% 1.28% 0.66%
7 52% 14,618 7% 4% 1.26% 0.66%
8 81% 21,111 7% 2% 1.26% 1.06%
9 68% 19,771 6% 2% 1.26% 0.91%
10 65% 18,699 5% 1% 1.35% 0.89%
Others 84% 24,692 12% 5% 1.77% 1.27%
Total 80% 21,454 18% 100% 1.63% 1.33%

Policybazaar.com 55
Registration City Loss
Ratio
ACPC Frequency Earned
Proportion
Rate
Realization
Burn
Rate
AGRA 88% 24,855 17% 4.0% 1.65% 1.42%
ALIGARH 98% 21,134 20% 1.1% 1.61% 1.59%
ALLAHABAD 68% 19,204 16% 3.2% 1.59% 1.10%
BAREILLY 88% 19,252 18% 1.7% 1.60% 1.39%
BULANDSHAHR 76% 23,429 15% 1.0% 1.58% 1.33%
GAUTAM BUDH NAGAR 129% 22,075 28% 1.6% 1.51% 2.13%
GHAZIABAD 66% 19,606 16% 23.1% 1.63% 1.12%
GORAKHPUR 89% 17,337 24% 1.7% 1.69% 1.46%
KANPUR 96% 23,098 19% 5.6% 1.66% 1.60%
LUCKNOW 93% 22,035 21% 14.2% 1.64% 1.53%
MATHURA 93% 19,515 21% 1.2% 1.59% 1.46%
MEERUT 69% 14,719 21% 4.7% 1.67% 1.20%
MORADABAD 66% 14,392 22% 1.0% 1.62% 1.17%
NOIDA 81% 25,017 17% 20.7% 1.63% 1.35%
VARANASI 112% 31,753 17% 2.3% 1.52% 1.74%
Others 70% 20,598 16% 12.7% 1.64% 1.14%
Total 80% 21,454 18% 100% 1.63% 1.33%
Assistance Type Loss
Ratio
ACPC Frequency Earned
Proportion
Rate
Realization
Burn
Rate
Unassisted 65% 19,300 14% 28% 1.52% 1.02%
Assisted 83% 22,467 19% 71% 1.67% 1.41%
Others 1004% 16,899 184% 0% 15.08% 141.23%
Total 80% 21,454 18% 100% 1.63% 1.33%
Fuel Type Loss
Ratio
ACPC Frequency Earned
Proportion
Rate
Realization
Burn
Rate
Petrol 70% 16,985 14% 48% 1.55% 1.09%
Diesel 91% 27,595 27% 48% 1.72% 1.57%
CNG 83% 16,362 18% 3% 1.57% 1.40%
Others 22% 14,542 6% 1% 2.12% 0.49%
Total 80% 21,454 18% 100% 1.63% 1.33%

56 Policybazaar.com
NCB Loss
Ratio
ACPC Frequency Earned
Proportion
Rate
Realization
Burn Rate
0 103% 23,107 35% 31% 2.21% 2.20%
20 74% 20,128 24% 25% 1.74% 1.30%
25 57% 19,865 15% 18% 1.60% 0.92%
35 89% 27,793 13% 11% 1.40% 1.25%
45 53% 13,788 11% 6% 1.18% 0.64%
50 69% 19,199 6% 9% 1.03% 0.75%
Others - - - 0% - -
Total 80% 21,454 18% 100% 1.63% 1.33%
Talk time
(minutes)
Loss
Ratio
ACPC Frequency Earned
Proportion
Rate
Realization
Burn
Rate
0-3 68% 19,662 14% 25% 1.53% 1.07%
3-5 40% 15,163 10% 3% 1.46% 0.62%
5-7 78% 22,040 15% 3% 1.53% 1.34%
7-10 68% 19,984 15% 4% 1.58% 1.10%
10+ 84% 22,619 19% 65% 1.68% 1.42%
Others 1004% 16,899 184% 0% 15.08% 141.23%
Total 80% 21,454 18% 100% 1.63% 1.33%
Days to expiry
of current policy
Loss
Ratio
ACPC Frequency Earned
Proportion
Rate
Realization
Burn
Rate
0 75% 20,069 19% 14% 1.66% 1.27%
1 92% 25,630 17% 14% 1.66% 1.51%
2 97% 23,644 19% 10% 1.59% 1.60%
3 66% 19,641 16% 7% 1.59% 1.07%
4 64% 19,426 15% 5% 1.60% 1.03%
5 61% 18,607 16% 4% 1.58% 0.99%
6-10 84% 23,317 16% 14% 1.57% 1.33%
11-15 56% 17,098 16% 11% 1.70% 0.94%
16-20 91% 23,371 18% 5% 1.58% 1.44%
21-30 87% 24,274 17% 4% 1.58% 1.37%
31-45 36% 10,987 13% 2% 1.50% 0.55%
Others 106% 20,357 29% 9% 1.79% 2.11%
Total 80% 21,454 18% 100% 1.63% 1.33%

Policybazaar.com 57
2.5 Gujarat
Vehicle Make Loss
Ratio
ACPC Frequency Earned
Proportion
Rate
Realization
Burn
Rate
CHEVROLET 71% 15,748 18% 6% 1.52% 1.18%
FIAT 72% 20,684 20% 1% 1.54% 1.20%
FORD 103% 32,310 20% 6% 1.68% 1.65%
HONDA 58% 16,817 24% 8% 1.51% 0.93%
HYUNDAI 64% 17,395 20% 25% 1.74% 1.15%
MAHINDRA & MAHINDRA 82% 34,487 21% 5% 1.48% 1.16%
MARUTI 64% 15,052 14% 21% 1.57% 1.01%
NISSAN MOTORS 97% 23,813 32% 2% 1.80% 1.87%
RENAULT 78% 23,734 35% 4% 1.79% 1.48%
SKODA 53% 22,222 19% 2% 1.60% 0.88%
TATA 59% 16,919 12% 5% 1.52% 0.95%
TOYOTA 108% 28,901 28% 4% 1.54% 1.71%
VOLKSWAGEN 161% 47,084 31% 7% 1.86% 3.13%
OTHERS 206% 65,209 37% 3% 1.58% 3.10%
Total 81% 22,021 19% 100% 1.63% 1.34%
Vehicle Age Loss
Ratio
ACPC Frequency Earned
Proportion
Rate
Realization
Burn
Rate
1 69% 26,884 24% 22% 1.74% 1.24%
2 85% 27,093 24% 19% 1.74% 1.48%
3 87% 22,531 25% 15% 1.67% 1.48%
4 77% 18,512 22% 14% 1.70% 1.31%
5 119% 24,647 20% 10% 1.52% 1.96%
6 67% 15,019 14% 6% 1.33% 0.94%
7 58% 10,070 15% 3% 1.31% 0.78%
8 59% 14,676 9% 2% 1.34% 0.83%
9 71% 17,482 8% 2% 1.36% 1.01%
10 74% 12,813 11% 1% 1.46% 1.05%
Others 77% 25,456 11% 5% 1.68% 1.10%
Total 81% 22,021 19% 100% 1.63% 1.34%

58 Policybazaar.com
Registration City Loss
Ratio
ACPC Frequency Earned
Proportion
Rate
Realization
Burn
Rate
AHMEDABAD 72% 17,210 22% 30.7% 1.65% 1.20%
ANAND 52% 16,958 18% 2.6% 1.66% 0.89%
BHARUCH 158% 64,841 12% 3.2% 1.52% 2.34%
BHAVNAGAR 41% 14,259 14% 1.1% 1.60% 0.63%
BHUJ 79% 19,647 21% 3.9% 1.66% 1.23%
GANDHI NAGAR 106% 25,448 20% 4.5% 1.58% 1.70%
JAMNAGAR 55% 22,265 14% 3.8% 1.62% 0.90%
MEHSANA 80% 19,553 22% 1.3% 1.75% 1.51%
NAVSARI 77% 20,131 21% 1.3% 1.61% 1.30%
RAJKOT 109% 28,564 23% 7.6% 1.69% 1.90%
SURAT 70% 18,406 20% 14.1% 1.66% 1.17%
VADODARA 64% 21,617 13% 13.8% 1.53% 1.04%
VALSAD 119% 30,685 23% 4.0% 1.55% 1.96%
Others 98% 31,093 17% 8.1% 1.67% 1.69%
Total 81% 22,021 19% 100% 1.63% 1.34%
NCB Loss
Ratio
ACPC Frequency Earned
Proportion
Rate
Realization
Burn
Rate
0 104% 27,336 29% 33% 2.11% 2.26%
20 71% 20,166 23% 26% 1.70% 1.20%
25 76% 23,074 18% 17% 1.58% 1.20%
35 56% 14,305 17% 10% 1.46% 0.77%
45 66% 19,998 11% 6% 1.24% 0.82%
50 70% 16,239 9% 8% 1.05% 0.78%
Others - - - 0% - -
Total 81% 22,021 19% 100% 1.63% 1.34%
Assistance Type Loss
Ratio
ACPC Frequency Earned
Proportion
Rate
Realization
Burn
Rate
Unassisted 80% 21,761 17% 28% 1.54% 1.23%
Assisted 77% 21,999 19% 72% 1.67% 1.31%
Others 683% 24,586 161% 0% 2.45% 19.25%
Total 81% 22,021 19% 100% 1.63% 1.34%

Policybazaar.com 59
Fuel Type Loss Ratio ACPC Frequency Earned
Proportion
Rate
Realization
Burn
Rate
Petrol 61% 15,726 15% 49% 1.60% 0.98%
Diesel 101% 29,514 27% 49% 1.67% 1.68%
CNG 110% 17,357 19% 1% 1.50% 1.76%
Others - - - 1% 1.92% -
Total 81% 22,021 19% 100% 1.63% 1.34%
Talk time
(minutes)
Loss
Ratio
ACPC Frequency Earned
Proportion
Rate
Realization
Burn
Rate
0-3 83% 22,122 18% 25% 1.54% 1.29%
3-5 43% 16,591 11% 3% 1.53% 0.67%
5-7 56% 13,488 18% 3% 1.51% 0.91%
7-10 46% 16,504 13% 3% 1.59% 0.75%
10+ 80% 22,588 20% 66% 1.68% 1.35%
Others 683% 24,586 161% 0% 2.45% 19.25%
Total 81% 22,021 19% 100% 1.63% 1.34%
Days to expiry
of current policy
Loss Ratio ACPC Frequency Earned
Proportion
Rate
Realization
Burn
Rate
0 72% 17,465 23% 11% 1.66% 1.29%
1 84% 23,961 18% 12% 1.62% 1.42%
2 80% 25,718 15% 9% 1.63% 1.35%
3 74% 17,436 22% 6% 1.62% 1.19%
4 113% 27,175 20% 5% 1.64% 1.70%
5 71% 21,288 18% 5% 1.61% 1.12%
6-10 67% 19,903 17% 15% 1.57% 1.06%
11-15 92% 23,327 20% 13% 1.66% 1.48%
16-20 45% 18,049 13% 7% 1.55% 0.75%
21-30 89% 30,466 15% 6% 1.58% 1.37%
31-45 107% 28,688 18% 3% 1.64% 1.64%
Others 102% 20,804 31% 8% 1.84% 2.03%
Total 81% 22,021 19% 100% 1.63% 1.34%

60 Policybazaar.com
2.6 Tamil Nadu
Vehicle Make Loss
Ratio
ACPC Frequency Earned
Proportion
Rate
Realization
Burn
Rate
CHEVROLET 69% 20,919 11% 4% 1.39% 1.00%
FIAT 126% 31,883 21% 3% 1.52% 1.88%
FORD 83% 25,207 17% 13% 1.50% 1.25%
HONDA 66% 18,098 22% 8% 1.47% 0.94%
HYUNDAI 61% 14,982 16% 19% 1.55% 0.98%
MAHINDRA & MAHINDRA 60% 27,180 14% 4% 1.23% 0.75%
MARUTI 70% 14,872 14% 20% 1.43% 1.00%
NISSAN MOTORS 65% 16,095 32% 3% 1.66% 1.18%
RENAULT 60% 16,125 35% 3% 1.60% 1.10%
SKODA 104% 32,197 27% 4% 1.66% 1.60%
TATA 58% 19,150 9% 5% 1.40% 0.85%
TOYOTA 92% 28,910 22% 5% 1.55% 1.46%
VOLKSWAGEN 50% 21,204 20% 7% 1.76% 0.87%
OTHERS 306% 133,980 18% 2% 1.39% 3.99%
Total 77% 21,069 16% 100% 1.49% 1.15%
Registration City Loss
Ratio
ACPC Frequency Earned
Proportion
Rate
Realization
Burn
Rate
CHENGALPATTU 61% 19,077 16% 1.6% 1.53% 0.92%
CHENNAI 66% 18,456 16% 50.7% 1.51% 0.98%
COIMBATORE 79% 23,378 15% 6.8% 1.51% 1.22%
HOSUR 18% 10,955 9% 1.1% 1.47% 0.28%
KANCHIPURAM 70% 15,807 18% 10.4% 1.46% 1.01%
MADURAI 97% 21,383 19% 1.7% 1.49% 1.38%
POONAMALLEE 61% 16,913 27% 1.6% 1.68% 1.02%
SALEM 112% 36,780 13% 1.0% 1.52% 1.68%
TAMBARAM 70% 16,859 27% 5.3% 1.57% 1.18%
THARAMANGALAM 60% 15,688 14% 3.8% 1.40% 0.86%
TIRUCHIRAPPALLI 28% 13,434 8% 1.1% 1.39% 0.41%
TIRUVALLUR 217% 46,009 19% 4% 1.46% 3.23%
Others 101% 31,647 14% 11% 1.45% 1.53%
Total 77% 21,069 16% 100% 1.49% 1.15%

Policybazaar.com 61
NCB Loss
Ratio
ACPC Frequency Earned
Proportion
Rate
Realization
Burn
Rate
0 87% 23,693 25% 31% 2.03% 1.70%
20 89% 26,330 21% 23% 1.61% 1.40%
25 55% 14,591 20% 16% 1.47% 0.84%
35 80% 21,085 15% 11% 1.31% 1.03%
45 66% 19,902 11% 8% 1.11% 0.76%
50 63% 15,456 8% 12% 1.00% 0.68%
Others - - - 0% - -
Total 77% 21,069 16% 100% 1.49% 1.15%
Assistance Type Loss
Ratio
ACPC Frequency Earned
Proportion
Rate
Realization
Burn
Rate
Unassisted 64% 18,413 14% 46% 1.43% 0.92%
Assisted 87% 22,887 19% 54% 1.55% 1.34%
Others 215% 32,764 26% 1% 2.23% 4.91%
Total 77% 21,069 16% 100% 1.49% 1.15%
Days to expiry
of current policy
Loss
Ratio
ACPC Frequency Earned
Proportion
Rate
Realization
Burn
Rate
0 121% 26,913 20% 12% 1.51% 1.83%
1 70% 22,248 15% 13% 1.51% 1.09%
2 49% 16,931 13% 8% 1.49% 0.75%
3 155% 44,631 15% 6% 1.52% 2.38%
4 55% 16,940 14% 5% 1.53% 0.78%
5 69% 18,318 17% 4% 1.48% 0.96%
6-10 44% 14,307 13% 14% 1.44% 0.62%
11-15 60% 17,977 14% 13% 1.52% 0.89%
16-20 83% 15,060 23% 6% 1.41% 1.16%
21-30 59% 14,947 17% 6% 1.43% 0.79%
31-45 39% 18,400 10% 3% 1.45% 0.58%
Others 115% 24,285 26% 9% 1.62% 2.14%
Total 77% 21,069 16% 100% 1.49% 1.15%

62 Policybazaar.com
Talk time
(minutes)
Loss
Ratio
ACPC Frequency Earned
Proportion
Rate
Realization
Burn
Rate
0-3 62% 18,179 14% 42% 1.43% 0.90%
3-5 81% 20,903 15% 4% 1.42% 1.18%
5-7 48% 11,721 15% 3% 1.39% 0.67%
7-10 82% 17,185 20% 4% 1.51% 1.21%
10+ 89% 24,351 19% 47% 1.57% 1.39%
Others 215% 32,764 26% 1% 2.23% 4.91%
Total 77% 21,069 16% 100% 1.49% 1.15%
2.7 Andhra Pradesh
Vehicle Make Loss
Ratio
ACPC Frequency Earned
Proportion
Rate
Realization
Burn
Rate
CHEVROLET 98% 26,125 15% 5% 1.47% 1.61%
FORD 47% 16,450 15% 8% 1.58% 0.79%
HONDA 52% 15,384 21% 7% 1.49% 0.84%
HYUNDAI 60% 12,706 20% 23% 1.63% 1.06%
MAHINDRA & MAHINDRA 51% 34,820 10% 3% 1.31% 0.67%
MARUTI 50% 11,041 13% 21% 1.46% 0.75%
NISSAN MOTORS 63% 20,504 22% 3% 1.69% 1.17%
RENAULT 35% 21,101 15% 3% 1.61% 0.61%
SKODA 135% 40,165 31% 6% 1.64% 2.41%
TATA 45% 15,642 10% 5% 1.44% 0.69%
TOYOTA 39% 14,987 18% 5% 1.49% 0.64%
VOLKSWAGEN 64% 19,289 29% 6% 1.84% 1.24%
OTHERS 21% 8,746 14% 4% 1.40% 0.31%
Total 59% 15,938 17% 100% 1.54% 0.96%

Policybazaar.com 63
Fuel Type Loss
Ratio
ACPC Frequency Earned
Proportion
Rate
Realization
Burn
Rate
Petrol 48% 11,911 13% 44% 1.48% 0.75%
Diesel 67% 20,058 22% 54% 1.59% 1.13%
CNG 62% 14,018 13% 2% 1.52% 0.99%
Others 28% 10,888 9% 1% 2.26% 0.65%
Total 59% 15,938 17% 100% 1.54% 0.96%
NCB Loss
Ratio
ACPC Frequency Earned
Proportion
Rate
Realization
Burn
Rate
0 57% 16,919 23% 31% 2.10% 1.28%
20 48% 14,833 19% 19% 1.70% 0.82%
25 64% 15,260 22% 17% 1.56% 1.03%
35 78% 20,413 17% 13% 1.38% 1.13%
45 46% 13,701 12% 8% 1.20% 0.59%
50 60% 13,390 10% 12% 1.07% 0.68%
Others - 6,001 - 0% - -
Total 59% 15,938 17% 100% 1.54% 0.96%
Vehicle Age Loss
Ratio
ACPC Frequency Earned
Proportion
Rate
Realization
Burn
Rate
1 63% 22,482 27% 9% 1.79% 1.20%
2 64% 18,438 28% 16% 1.62% 1.06%
3 58% 16,738 24% 20% 1.66% 0.99%
4 56% 14,317 21% 18% 1.64% 0.91%
5 61% 15,058 15% 11% 1.42% 0.88%
6 46% 11,500 12% 7% 1.32% 0.62%
7 44% 10,966 10% 4% 1.28% 0.58%
8 113% 26,869 9% 4% 1.31% 1.49%
9 57% 10,681 11% 3% 1.34% 0.75%
10 30% 11,526 5% 2% 1.34% 0.42%
Others 44% 12,247 11% 5% 1.70% 0.69%
Total 59% 15,938 17% 100% 1.54% 0.96%

64 Policybazaar.com
Registration City Loss
Ratio
ACPC Frequency Earned
Proportion
Rate
Realization
Burn
Rate
CHITTOOR 77% 21,201 22% 1.0% 1.61% 1.27%
HYDERABAD 57% 14,327 18% 26.7% 1.51% 0.97%
KAKINADA 81% 28,318 13% 1.2% 1.50% 1.31%
MEDAK 92% 22,198 22% 2.2% 1.62% 1.47%
NARASARAOPETA 70% 12,858 29% 1.2% 1.52% 1.01%
RANGA REDDY 49% 13,189 16% 37.4% 1.52% 0.81%
SECUNDERABAD 74% 17,636 19% 9.7% 1.53% 1.19%
VIJAYAWADA 51% 19,102 14% 2.4% 1.59% 0.85%
VISHAKHAPATNAM 81% 29,924 12% 6.5% 1.59% 1.27%
WARANGAL 55% 14,440 16% 1.0% 1.72% 0.82%
Others 60% 19,588 16% 10.7% 1.61% 0.96%
Total 59% 15,938 17% 100% 1.54% 0.96%
Assistance Type Loss
Ratio
ACPC Frequency Earned
Proportion
Rate
Realization
Burn
Rate
Unassisted 57% 14,853 16% 40% 1.47% 0.89%
Assisted 59% 16,901 17% 59% 1.58% 0.99%
Others 210% 11,663 66% 0% 8.97% 18.62%
Total 59% 15,938 17% 100% 1.54% 0.96%
Talk time
(minutes)
Loss
Ratio
ACPC Frequency Earned
Proportion
Rate
Realization
Burn
Rate
0-3 57% 14,802 16% 37% 1.47% 0.88%
3-5 63% 15,356 16% 4% 1.48% 0.95%
5-7 103% 26,917 17% 3% 1.46% 1.62%
7-10 55% 17,752 12% 4% 1.52% 0.85%
10+ 56% 16,154 17% 52% 1.60% 0.96%
Others 210% 11,663 66% 0% 8.97% 18.62%
Total 59% 15,938 17% 100% 1.54% 0.96%

Policybazaar.com 65
Days to expiry
of current policy
Loss
Ratio
ACPC Frequency Earned
Proportion
Rate
Realization
Burn
Rate
0 47% 14,936 14% 12% 1.56% 0.80%
1 54% 12,748 18% 11% 1.50% 0.85%
2 55% 17,200 14% 8% 1.51% 0.80%
3 84% 21,045 18% 6% 1.57% 1.35%
4 67% 15,647 19% 6% 1.57% 1.04%
5 41% 11,428 16% 4% 1.54% 0.66%
6-10 69% 22,360 13% 14% 1.47% 1.08%
11-15 45% 14,424 13% 13% 1.59% 0.74%
16-20 90% 21,658 19% 6% 1.52% 1.38%
21-30 52% 15,006 15% 4% 1.44% 0.77%
31-45 49% 14,233 15% 2% 1.30% 0.75%
Others 60% 12,676 26% 14% 1.72% 1.22%
Total 59% 15,938 17% 100% 1.54% 0.96%
2.8 Rajasthan
Vehicle Make Loss
Ratio
ACPC Frequency Earned
Proportion
Rate
Realization
Burn
Rate
CHEVROLET 62% 30,720 7% 5% 1.53% 1.00%
FORD 89% 27,862 19% 9% 1.69% 1.48%
HONDA 62% 22,657 21% 7% 1.78% 1.08%
HYUNDAI 98% 22,195 20% 25% 1.70% 1.66%
MAHINDRA & MAHINDRA 46% 32,687 11% 5% 1.48% 0.65%
MARUTI 65% 16,872 12% 25% 1.54% 1.00%
RENAULT 82% 22,945 38% 4% 1.96% 1.79%
SKODA 80% 20,947 34% 3% 1.95% 1.42%
TATA 70% 26,701 9% 3% 1.50% 1.03%
TOYOTA 72% 23,560 27% 4% 1.84% 1.43%
VOLKSWAGEN 143% 43,092 34% 5% 2.08% 3.09%
OTHERS 47% 18,574 22% 5% 1.85% 0.79%
Total 78% 22,696 16% 100% 1.68% 1.29%

66 Policybazaar.com
NCB Loss
Ratio
ACPC Frequency Earned
Proportion
Rate
Realization
Burn
Rate
0 75% 21,040 27% 30% 2.23% 1.56%
20 81% 25,621 20% 29% 1.76% 1.40%
25 71% 20,444 18% 18% 1.64% 1.15%
35 56% 19,606 10% 9% 1.39% 0.76%
45 113% 26,350 12% 5% 1.23% 1.31%
50 103% 23,923 7% 8% 1.05% 1.12%
Others - - - 0% - -
Total 78% 22,696 16% 100% 1.68% 1.29%
Fuel Type Loss
Ratio
ACPC Frequency Earned
Proportion
Rate
Realization
Burn
Rate
Petrol 69% 19,358 12% 47% 1.59% 1.08%
Diesel 87% 26,702 25% 51% 1.76% 1.50%
CNG 95% 12,256 22% 1% 1.48% 1.57%
Others 13% 12,566 5% 1% 1.78% 0.22%
Total 78% 22,696 16% 100% 1.68% 1.29%
Vehicle Age Loss
Ratio
ACPC Frequency Earned
Proportion
Rate
Realization
Burn
Rate
1 67% 25,062 24% 24% 1.86% 1.22%
2 94% 24,023 29% 21% 1.84% 1.73%
3 66% 20,930 19% 16% 1.75% 1.12%
4 109% 27,255 19% 12% 1.66% 1.72%
5 57% 16,162 12% 9% 1.45% 0.82%
6 108% 29,218 10% 5% 1.29% 1.43%
7 56% 16,245 7% 3% 1.25% 0.75%
8 87% 16,147 10% 2% 1.28% 1.17%
9 52% 9,519 9% 2% 1.31% 0.71%
10 59% 19,077 5% 1% 1.41% 0.82%
Others 65% 20,006 10% 4% 1.80% 0.95%
Total 78% 22,696 16% 100% 1.68% 1.29%

Policybazaar.com 67
Registration City Loss
Ratio
ACPC Frequency Earned
Proportion
Rate
Realization
Burn
Rate
AJMER 62% 24,738 11% 3.5% 1.69% 0.97%
ALWAR 68% 20,372 14% 5.3% 1.65% 1.13%
BHARATPUR 67% 13,551 24% 1.5% 1.70% 1.14%
BHILWARA 36% 16,650 11% 1.6% 1.80% 0.62%
BIKANER 67% 26,415 11% 2.3% 1.59% 1.12%
CHITTORGARH 33% 10,545 12% 1.1% 1.49% 0.50%
GANGANAGAR 111% 16,409 37% 1.6% 1.78% 1.81%
JAIPUR 68% 19,792 16% 47.6% 1.67% 1.12%
JHUNJHUNU 43% 17,416 11% 2.8% 1.59% 0.69%
JODHPUR 159% 36,010 21% 6.4% 1.63% 2.71%
KOTA 106% 25,224 18% 4.5% 1.61% 1.69%
KOTPUTLI 106% 50,891 8% 1.4% 1.68% 1.70%
SIKAR 169% 29,542 31% 1.8% 1.73% 2.62%
UDAIPUR 77% 29,389 13% 5.9% 1.68% 1.28%
Others 77% 23,541 19% 12.8% 1.75% 1.33%
Total 78% 22,696 16% 100% 1.68% 1.29%
Assistance Type Loss
Ratio
ACPC Frequency Earned
Proportion
Rate
Realization
Burn
Rate
Unassisted 85% 23,382 15% 26% 1.60% 1.36%
Assisted 72% 22,222 16% 74% 1.70% 1.20%
Others 1338% 26,853 199% 0% 2.43% 28.06%
Total 78% 22,696 16% 100% 1.68% 1.29%
Talk time
(minutes)
Loss
Ratio
ACPC Frequency Earned
Proportion
Rate
Realization
Burn
Rate
0-3 79% 22,230 14% 22% 1.61% 1.25%
3-5 128% 29,695 19% 3% 1.56% 2.20%
5-7 50% 14,784 13% 2% 1.45% 0.82%
7-10 194% 39,136 20% 3% 1.63% 3.05%
10+ 67% 21,242 16% 69% 1.71% 1.11%
Others 1338% 26,853 199% 0% 2.43% 28.06%
Total 78% 22,696 16% 100% 1.68% 1.29%

68 Policybazaar.com
Days to expiry
of current policy
Loss
Ratio
ACPC Frequency Earned
Proportion
Rate
Realization
Burn
Rate
0 91% 28,099 17% 16% 1.71% 1.62%
1 72% 23,942 14% 14% 1.68% 1.18%
2 100% 23,882 19% 9% 1.65% 1.62%
3 53% 15,412 18% 8% 1.72% 0.84%
4 55% 16,345 16% 6% 1.66% 0.89%
5 105% 28,718 16% 4% 1.62% 1.63%
6-10 67% 19,223 16% 14% 1.60% 1.06%
11-15 54% 18,780 13% 11% 1.72% 0.88%
16-20 40% 16,266 10% 5% 1.64% 0.63%
21-30 82% 26,710 14% 5% 1.62% 1.31%
31-45 130% 50,025 11% 2% 1.64% 1.89%
Others 140% 22,912 35% 7% 1.83% 2.70%
Total 78% 22,696 16% 100% 1.68% 1.29%

Policybazaar.com 69
3. LR Model by Assistance Type
3.1 Assisted
Registration state Loss Ratio ACPC Frequency Earned
Proportion
Rate
Realization
Burn Rate
Karnataka 57% 18,443 16% 9% 1.54% 0.87%
Andhra Pradesh 59% 16,901 17% 3% 1.58% 0.99%
Maharashtra 65% 20,401 17% 18% 1.57% 1.03%
Delhi 64% 19,536 15% 19% 1.62% 1.04%
Tamil Nadu 87% 22,887 19% 3% 1.55% 1.34%
Rajasthan 72% 22,222 16% 3% 1.70% 1.20%
Uttar Pradesh 83% 22,467 19% 9% 1.67% 1.41%
Gujarat 77% 21,999 19% 4% 1.67% 1.31%
Haryana 89% 24,020 21% 13% 1.65% 1.51%
Others 93% 20,389 23% 19% 1.58% 1.49%
Total 75% 20,861 18% 100% 1.60% 1.22%
Vehicle Make Loss
Ratio
ACPC Frequency Earned
Proportion
Rate
Realization
Burn
Rate
CHEVROLET 65% 18,723 14% 5% 1.53% 1.08%
FORD 78% 25,100 19% 7% 1.62% 1.25%
HONDA 74% 23,247 22% 9% 1.55% 1.15%
HYUNDAI 72% 16,859 20% 21% 1.68% 1.22%
MAHINDRA & MAHINDRA 60% 32,370 16% 5% 1.41% 0.85%
MARUTI 66% 14,716 16% 25% 1.54% 1.02%
RENAULT 82% 31,041 28% 3% 1.73% 1.63%
SKODA 114% 35,654 29% 3% 1.67% 2.01%
TATA 74% 22,591 12% 4% 1.48% 1.15%
TOYOTA 79% 27,847 24% 5% 1.59% 1.27%
VOLKSWAGEN 109% 27,978 36% 6% 1.88% 2.14%
OTHERS 83% 39,614 17% 7% 1.68% 1.42%
Total 75% 20,861 18% 100% 1.60% 1.22%

70 Policybazaar.com
Vehicle Age Loss Ratio ACPC Frequency Earned
Proportion
Rate
Realization
Burn Rate
1 71% 25,030 27% 23% 1.76% 1.27%
2 80% 23,910 26% 19% 1.75% 1.39%
3 85% 22,526 25% 15% 1.69% 1.43%
4 91% 22,224 22% 13% 1.64% 1.47%
5 73% 17,201 16% 9% 1.40% 1.06%
6 59% 14,053 12% 6% 1.28% 0.78%
7 61% 13,936 11% 3% 1.23% 0.76%
8 75% 16,843 10% 3% 1.28% 0.99%
9 68% 16,290 8% 2% 1.29% 0.89%
10 51% 11,675 8% 1% 1.31% 0.69%
Others 58% 17,318 14% 7% 1.71% 0.93%
Total 75% 20,861 18% 100% 1.60% 1.22%
NCB Loss Ratio ACPC Frequency Earned
Proportion
Rate
Realization
Burn Rate
0 88% 22,721 30% 33% 2.11% 1.85%
20 70% 21,409 21% 27% 1.67% 1.16%
25 70% 19,891 19% 17% 1.55% 1.07%
35 70% 20,358 14% 9% 1.37% 0.97%
45 72% 18,785 12% 5% 1.13% 0.83%
50 69% 16,238 8% 8% 0.99% 0.70%
Others 39% 14,765 15% 1% 2.03% 0.72%
Total 75% 20,861 18% 100% 1.60% 1.22%
Fuel Type Loss Ratio ACPC Frequency Earned
Proportion
Rate
Realization
Burn Rate
Petrol 63% 15,991 15% 49% 1.55% 0.96%
Diesel 90% 28,010 26% 46% 1.65% 1.51%
CNG 82% 15,606 21% 2% 1.60% 1.40%
Others 42% 13,977 16% 2% 1.89% 0.83%
Total 75% 20,861 18% 100% 1.60% 1.22%

Policybazaar.com 71
Vehicle Model Loss Ratio ACPC Frequency Earned
Proportion
Rate
Realization
Burn Rate
ALTO 73% 13,323 12% 4% 1.43% 1.08%
AMAZE 96% 29,187 29% 2% 1.78% 1.76%
BEAT 79% 19,376 17% 2% 1.55% 1.31%
CITY 85% 19,287 21% 2% 1.39% 1.19%
CRETA 16% 12,664 23% 1% 1.74% 0.29%
DUSTER 83% 38,687 26% 2% 1.67% 1.41%
ECOSPORT 77% 34,570 23% 3% 1.56% 1.23%
EON 93% 15,561 23% 2% 1.66% 1.63%
ERTIGA 50% 19,563 23% 1% 1.62% 0.85%
ETIOS 90% 20,065 33% 1% 1.84% 1.74%
FIGO 77% 20,483 19% 3% 1.69% 1.35%
GRAND I10 64% 17,137 28% 3% 1.86% 1.23%
I 10 67% 13,010 18% 4% 1.51% 1.11%
I 20 94% 22,141 30% 5% 1.80% 1.77%
INDIGO 79% 21,497 13% 1% 1.34% 1.19%
INNOVA 59% 34,139 14% 2% 1.52% 0.89%
NEW CITY 53% 23,282 20% 2% 1.51% 0.84%
POLO 108% 24,678 35% 3% 2.00% 2.20%
RAPID 143% 39,093 43% 2% 1.94% 2.90%
RITZ 57% 13,853 16% 1% 1.49% 0.89%
SANTRO 73% 13,339 12% 2% 1.46% 1.17%
SWIFT 74% 15,159 22% 5% 1.63% 1.21%
SWIFT DZIRE 74% 18,256 23% 5% 1.61% 1.21%
VENTO 96% 27,050 36% 3% 1.81% 1.81%
VERNA 64% 22,310 26% 2% 1.69% 1.16%
WAGON R 57% 12,094 14% 4% 1.47% 0.88%
XCENT 52% 17,765 26% 1% 1.84% 0.99%
XUV 500 53% 36,448 20% 2% 1.39% 0.78%
OTHERS 74% 25,675 15% 30% 1.58% 1.15%
Total 75% 20,861 18% 100% 1.60% 1.22%

72 Policybazaar.com
Talk time
(minutes)
Loss
Ratio
ACPC Frequency Earned
Proportion
Rate
Realization
Burn
Rate
5-7 58% 16,960 15% 5% 1.49% 0.89%
7-10 73% 19,853 16% 6% 1.53% 1.14%
10+ 76% 21,123 19% 89% 1.62% 1.24%
Total 75% 20,861 18% 100% 1.60% 1.22%
Days to expiry
of current policy
Loss Ratio ACPC Frequency Earned
Proportion
Rate
Realization
Burn Rate
0 90% 23,102 20% 13% 1.63% 1.49%
1 85% 22,704 19% 13% 1.60% 1.36%
2 84% 22,239 19% 9% 1.59% 1.34%
3 80% 22,000 18% 7% 1.60% 1.27%
4 71% 20,495 17% 5% 1.59% 1.10%
5 76% 21,259 18% 4% 1.55% 1.16%
6-10 71% 20,454 17% 14% 1.55% 1.11%
11-15 64% 18,674 17% 12% 1.63% 1.02%
16-20 69% 19,851 17% 7% 1.58% 1.10%
21-30 70% 19,438 18% 5% 1.54% 1.07%
31-45 60% 16,904 17% 3% 1.50% 0.89%
Others 66% 18,695 25% 9% 1.87% 1.36%
Total 75% 20,861 18% 100% 1.60% 1.22%

Policybazaar.com 73
3.2 Unassisted
Registration state Loss Ratio ACPC Frequency Earned
Proportion
Rate
Realization
Burn Rate
Karnataka 58% 17,978 14% 12% 1.41% 0.81%
Andhra Pradesh 57% 14,853 16% 4% 1.47% 0.89%
Maharashtra 55% 17,458 14% 18% 1.45% 0.80%
Delhi 64% 18,619 13% 15% 1.51% 0.95%
Tamil Nadu 64% 18,413 14% 5% 1.43% 0.92%
Rajasthan 85% 23,382 15% 2% 1.60% 1.36%
Uttar Pradesh 65% 19,300 14% 6% 1.52% 1.02%
Gujarat 80% 21,761 17% 3% 1.54% 1.23%
Haryana 67% 18,716 16% 10% 1.52% 1.02%
Others 65% 17,068 17% 24% 1.57% 1.04%
Total 63% 18,015 15% 100% 1.50% 0.95%
NCB Loss Ratio ACPC Frequency Earned
Proportion
Rate
Realization
Burn Rate
0 70% 19,416 23% 24% 2.03% 1.34%
20 65% 19,778 20% 17% 1.66% 1.09%
25 57% 18,213 17% 18% 1.54% 0.89%
35 68% 18,612 16% 12% 1.36% 0.94%
45 71% 18,161 13% 8% 1.19% 0.88%
50 63% 14,875 9% 15% 1.04% 0.69%
Others 31% 14,312 11% 7% 1.98% 0.56%
Total 63% 18,015 15% 100% 1.50% 0.95%
Fuel Type Loss Ratio ACPC Frequency Earned
Proportion
Rate
Realization
Burn Rate
Petrol 59% 15,070 13% 49% 1.44% 0.85%
Diesel 74% 24,473 20% 38% 1.51% 1.12%
CNG 85% 17,414 16% 2% 1.48% 1.34%
Others 38% 13,004 15% 11% 1.89% 0.71%
Total 63% 18,015 15% 100% 1.50% 0.95%

74 Policybazaar.com
Vehicle Model Loss Ratio ACPC Frequency Earned
Proportion
Rate
Realization
Burn Rate
ALTO 58% 11,744 9% 3% 1.34% 0.82%
AMAZE 56% 20,340 22% 2% 1.67% 0.99%
BEAT 60% 16,500 13% 2% 1.42% 0.92%
CITY 57% 14,530 17% 2% 1.37% 0.80%
CRETA 65% 33,282 33% 0% 1.66% 1.14%
DUSTER 108% 45,518 24% 2% 1.54% 1.68%
ECOSPORT 63% 23,853 25% 2% 1.49% 0.99%
EON 64% 11,549 19% 1% 1.55% 1.06%
ERTIGA 48% 19,557 19% 1% 1.48% 0.76%
ETIOS 66% 18,636 21% 1% 1.59% 1.07%
FIGO 70% 18,565 17% 3% 1.57% 1.18%
GRAND I10 57% 14,304 27% 2% 1.73% 1.02%
I 10 60% 12,717 15% 5% 1.43% 0.93%
I 20 63% 17,028 21% 5% 1.63% 1.07%
INDIGO 54% 16,966 11% 1% 1.33% 0.79%
INNOVA 40% 40,442 7% 2% 1.35% 0.54%
NEW CITY 63% 24,689 18% 2% 1.42% 0.88%
POLO 85% 21,159 28% 2% 1.84% 1.63%
RAPID 69% 22,924 30% 1% 1.72% 1.23%
RITZ 49% 11,701 14% 1% 1.37% 0.73%
SANTRO 59% 11,936 11% 4% 1.42% 1.03%
SWIFT 84% 15,967 19% 5% 1.48% 1.29%
SWIFT DZIRE 78% 19,586 19% 4% 1.46% 1.18%
VENTO 81% 26,696 27% 2% 1.60% 1.42%
VERNA 58% 19,185 23% 3% 1.55% 0.96%
WAGON R 56% 11,818 11% 4% 1.37% 0.81%
XCENT 28% 14,292 16% 1% 1.71% 0.50%
XUV 500 75% 47,002 18% 2% 1.27% 1.01%
OTHERS 58% 20,197 13% 34% 1.50% 0.86%
Total 63% 18,015 15% 100% 1.50% 0.95%

Policybazaar.com 75
Vehicle Age Loss Ratio ACPC Frequency Earned
Proportion
Rate
Realization
Burn Rate
1 56% 22,399 22% 13% 1.66% 0.95%
2 65% 20,998 23% 16% 1.64% 1.07%
3 77% 21,903 21% 14% 1.55% 1.20%
4 73% 18,990 18% 13% 1.49% 1.08%
5 67% 17,244 13% 9% 1.31% 0.88%
6 55% 13,532 11% 7% 1.23% 0.69%
7 74% 17,561 10% 4% 1.23% 0.92%
8 59% 12,958 10% 4% 1.25% 0.76%
9 60% 12,417 9% 3% 1.23% 0.76%
10 66% 13,086 9% 2% 1.32% 0.87%
Others 44% 14,310 13% 15% 1.74% 0.78%
Total 63% 18,015 15% 100% 1.50% 0.95%
Vehicle Make Loss Ratio ACPC Frequency Earned
Proportion
Rate
Realization
Burn
Rate
CHEVROLET 57% 16,507 12% 4% 1.41% 0.83%
FORD 67% 19,258 18% 7% 1.51% 1.03%
HONDA 54% 17,706 17% 8% 1.44% 0.79%
HYUNDAI 60% 14,340 16% 22% 1.55% 0.94%
MAHINDRA & MAHINDRA 58% 35,655 12% 4% 1.29% 0.75%
MARUTI 66% 14,742 13% 23% 1.42% 0.97%
RENAULT 94% 35,781 25% 2% 1.59% 1.59%
SKODA 75% 25,320 22% 3% 1.52% 1.16%
TATA 71% 21,327 11% 4% 1.41% 1.05%
TOYOTA 55% 23,459 16% 5% 1.37% 0.78%
VOLKSWAGEN 84% 24,664 27% 5% 1.69% 1.52%
OTHERS 51% 24,581 12% 12% 1.69% 0.86%
Total 63% 18,015 15% 100% 1.50% 0.95%

76 Policybazaar.com
Talk time Loss Ratio ACPC Frequency Earned
Proportion
Rate
Realization
Burn Rate
0-3 63% 17,968 15% 90% 1.50% 0.94%
3-5 67% 18,449 15% 10% 1.47% 1.00%
Total 63% 18,015 15% 100% 1.50% 0.95%
Days to expiry
of current policy
Loss Ratio ACPC Frequency Earned
Proportion
Rate
Realization
Burn Rate
0 78% 22,185 15% 12% 1.52% 1.19%
1 63% 17,231 15% 11% 1.47% 0.94%
2 65% 17,394 16% 8% 1.46% 0.97%
3 83% 24,902 14% 5% 1.46% 1.23%
4 59% 16,766 14% 4% 1.46% 0.86%
5 57% 17,163 13% 4% 1.47% 0.84%
6-10 58% 17,353 13% 12% 1.42% 0.84%
11-15 52% 16,876 13% 20% 1.57% 0.80%
16-20 51% 15,914 14% 9% 1.52% 0.78%
21-30 56% 17,715 12% 4% 1.42% 0.77%
31-45 64% 19,995 12% 2% 1.35% 0.83%
Others 79% 16,466 24% 9% 1.64% 1.32%
Total 63% 18,015 15% 100% 1.50% 0.95%

Policybazaar.com 77
About the Team
Ankit Mittal heads the actuarial functions
Tarun Mathur is the Director of Unassisted Business
email: [email protected] email: [email protected]
Vaidyanathan Ramani is the Head of Products & Innovation Center
Sajja Praveen Chowdary heads the Motor Business
email: [email protected] email: [email protected]
Gaurav Surana manages client relationships in the General Insurance space
email: [email protected]
At Policybazaar, the authors would like to thank and acknowledge the support of Sachitanand
Bhardwaj, Rahul Mandiratta and Shilpa Bansal who have toiled hard to get this report in shape.
Special thanks to Lalit Sharma for his inputs on design of the report.

78 Policybazaar.com
This page is intentionally left blank

Policybazaar.com 79
©Policybazaar Insurance Web Aggregator Private Limited. All rights reserved.
This document is intended for general information purposes only and should not be construed
as advice or opinions on any specific facts or circumstances. It does not purport to provide
comprehensive full legal or other advice. The contents of this document are based upon
Policybazaar Insurance Web Aggregator Private Limited’s (Policybazaar) preliminary analysis
and publicly available information. The content of this document is made available on an “as is”
basis, without any warranties. Policybazaar disclaims any legal liability to any person or
organization for loss or damage caused by or resulting from any reliance placed on that content.
Without prejudice to the generality of the foregoing paragraph, Policybazaar do not represent,
warrant, undertake or guarantee that the use of guidance in the report/journal will lead to any
particular outcome or result. Policybazaar shall not be liable to you in respect of any business
losses, including without limitation loss of or damage to profits, income, revenue, use,
production, anticipated savings, business, contracts, commercial opportunities or goodwill.
Policybazaar reserves all legal and common law rights to the content of this document.
This document and its contents are subject to copyright under the laws of India and, through
international treaties, other countries. The copyright is owned by Policybazaar. The contents of
this document cannot be reproduced, transmitted (including broadcasts), adaptation or
otherwise exercised in whole or any part of this document for any purpose except as expressly
permitted by Policybazaar prior written consent.