Driving growth and value
56
Driving growth and value 1 August 2021
Transcript of Driving growth and value

Driving growth and value
1
August 2021
Disclaimer
2
ALL RIGHTS ARE RESERVED
© REPSOL, S.A. 2021
This document contains statements that Repsol believes constitute forward-looking statements which may include statements regarding the intent, belief, or current expectations of Repsol and its management, including statements with respect to
trends affecting Repsol’s financial condition, financial ratios, results of operations, business, strategy, geographic concentration, production volume and reserves, capital expenditures, costs savings, investments and dividend payout policies. These
forward-looking statements may also include assumptions regarding future economic and other conditions, such as future crude oil and other prices, refining and marketing margins and exchange rates and are generally identified by the words
“expects”, “anticipates”, “forecasts”, “believes”, estimates”, “notices” and similar expressions. These statements are not guarantees of future performance, prices, margins, exchange rates or other events and are subject to material risks,
uncertainties, changes and other factors which may be beyond Repsol’s control or may be difficult to predict. Within those risks are those factors described in the filings made by Repsol and its affiliates with the “Comisión Nacional del Mercado de
Valores” in Spain and with any other supervisory authority of those markets where the securities issued by Repsol and/or its affiliates are listed.
Repsol does not undertake to publicly update or revise these forward-looking statements even if experience or future changes make it clear that the projected performance, conditions or events expressed or implied therein will not be realized.
This document mentions resources which do not constitute proved reserves and will be recognized as such when they comply with the formal conditions required by the system “SPE/WPC/AAPG/SPEE/SEG/SPWLA/EAGE Petroleum Resources
Management System” (SPE-PRMS) (SPE – Society of Petroleum Engineers).
In October 2015, the European Securities Markets Authority (ESMA) published its Guidelines on Alternative Performance Measures (APMs). The guidelines apply to regulated information published on or after 3 July 2016. The information and
breakdowns relative to the APMs used in this presentation are updated quarterly on Repsol´s website.
This document does not constitute an offer or invitation to purchase or subscribe securities, pursuant to the provisions of the Royal Legislative Decree 4/2015 of the 23rd of October approving the recast text of the Spanish Securities Market Law and
its implementing regulations. In addition, this document does not constitute an offer to purchase, sell, or exchange, neither a request for an offer of purchase, sale or exchange of securities in any other jurisdiction.
The information contained in the document has not been verified or revised by the External Auditors of Repsol.
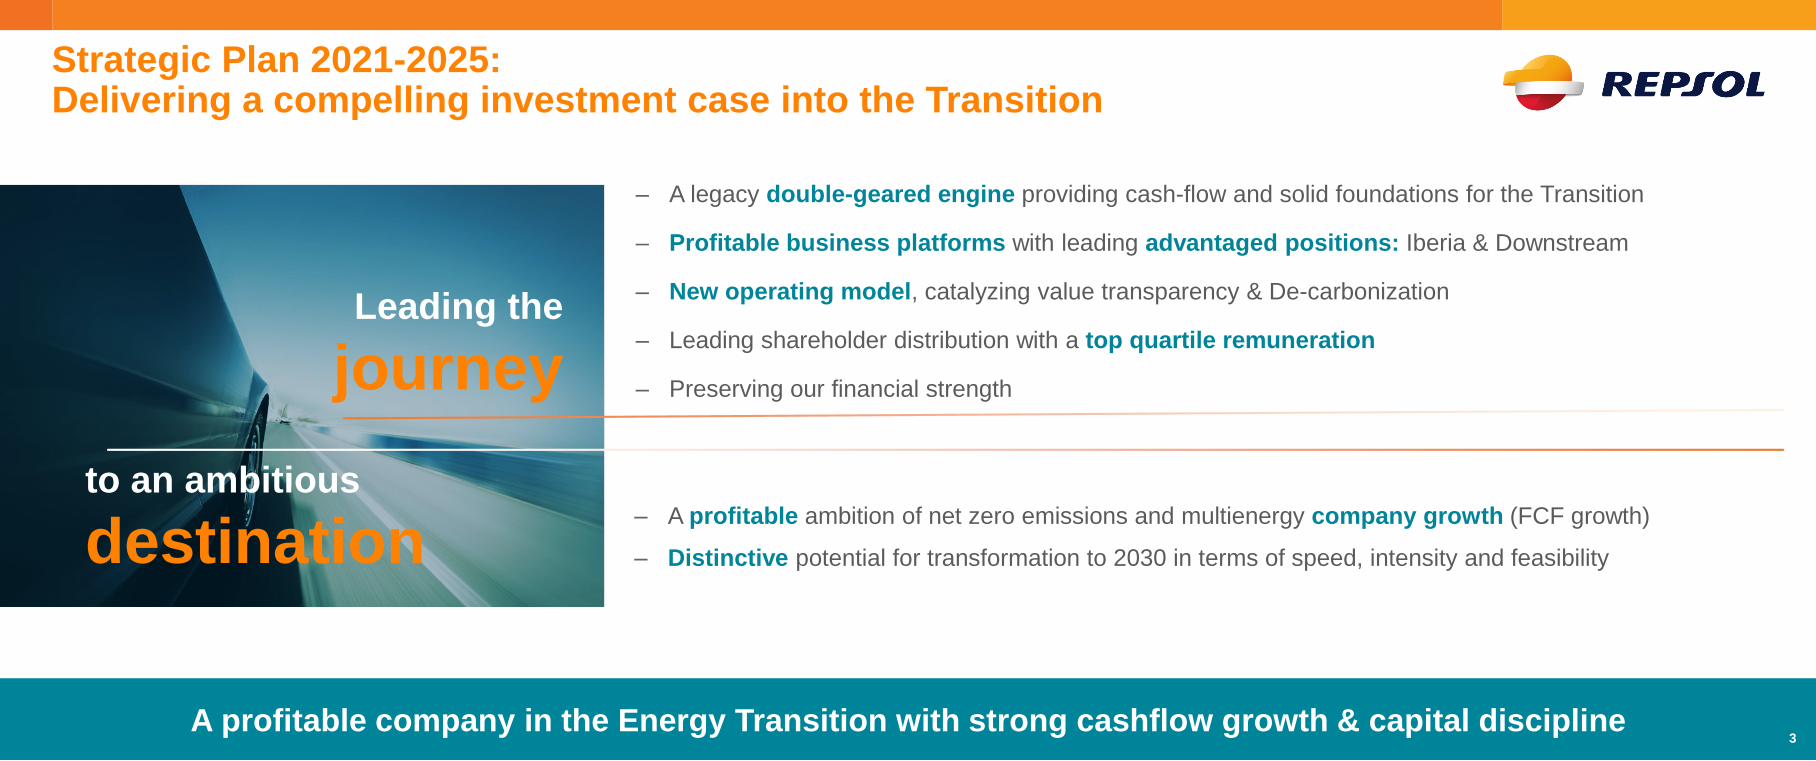
A profitable company in the Energy Transition with strong cashflow growth & capital discipline
Strategic Plan 2021-2025: Delivering a compelling investment case into the Transition
Leading the
journey
to an ambitious
destination
‒ A legacy double-geared engine providing cash-flow and solid foundations for the Transition
‒ Profitable business platforms with leading advantaged positions: Iberia & Downstream
‒ New operating model, catalyzing value transparency & De-carbonization
‒ Leading shareholder distribution with a top quartile remuneration
‒ Preserving our financial strength
‒ A profitable ambition of net zero emissions and multienergy company growth (FCF growth)
‒ Distinctive potential for transformation to 2030 in terms of speed, intensity and feasibility
3
Index
01. Repsol: New corporate model
02. Path to 2030
03. Strategy 2021-2025
04. Business strategies
05. Stepping up energy transition
06. SP summary
07. Delivery 1Q21
01.
Repsol: New corporate model

Low-carbon generationRenewablesConventional low-carbon generationEnergy Management
Customer-centricMobilityLPGE-Mobility
P&G RetailEnergy slutionsLAS2
IndustrialRefining1
TradingWholesale & Gas Trading
Group Global Services (Efficiency and Scale)
Group Corporate Center (Governance, Financial and Strategic Management and Integration synergies)
REPSOL Group
1. Refining Spain and Peru R&M 2. Lubricants, Asphalts and Specialties
Early movement: New Repsol corporate model for increased
accountability and value transparency
BiofuelsChemicals
EBITDA €0.04 B
CAPEX €0.2 B
Capacity: 3.3 GW
Of which RES (inc. hydro) 1.1 GW
EQUITY PARTNERs
or IPO
New corporate model enabling value crystallization
2019 2019 2019
2020
6
Yield and New Platforms Yield and Transformation Business BuildYield and Focus

Clear logic for Repsol new corporate model
Clear differentiation of businesses profiles and equity stories within the Group
Alignment of cost of capital with business profile for each business
Ability to develop appropriate partnerships for each business
Value crystallization and transparency
Acceleration of new ways of working7
Path to 2030
02.

Ambitious transformation journey to thrive in Energy Transition
Path to
2030
De-carbonizethe portfolio
Towards Net Zero emissions Leading investor proposition
Profitable Four verticals
New operating model
FCF growth
Advantaged
transformationValue
crystallization
New partnerships
9

Repsol 2030: A more sustainable, balanced and profitable company
CE 2019 CE 2030
2030 Ambition
Transforming the company's portfolio
FCF (B€)
Strong cash-flow growth
2030 Repsol's Low Carbon business: ~40% of CE
5 % Low Carbon Retail
10 % Low Carbon Industrial
CE 2025
2030 Repsol's Low Carbon business: ~40% of CE Growing 2030 FCF well above 2025
% Low Carbon Businesses40%1
Customer Centric Business Low Carbon Generation Industrial Upstream
1. Increase in low carbon CE through investments in low carbon generation, new industrial low carbon platforms (circularity, H2 & e-fuels, etc.), decarbonization through efficiency initiatives, e-mobility, and value-added services, among others2. In homogeneous price basis @$50/bbl & $2.5 HH Note: CE of RES considering consolidation by the proportional method. Capital employed figures not including Corporation (€2 B in 2019)
1.3
20192 25
Industrial transformation(circularity, H2 & e-fuels)
Renewables
Customer centric business
Upstream flexibility
10
EBITDA B€)
Strategy 2021-25:
03.

Accelerating transformation and delivering
growth
Ensuring strong
performance and financial strengthIn an uncertain economic and commodities environment
‒ Efficiency & capital discipline
‒ Capex reduction
‒ Prudent financial policy and commitment with current credit rating
2021 - 2022 2023 - 2025
Self-financed plan @$50/bbl & $2.5 HH
Ensuring shareholder value maximization
‒ Portfolio optimization & new business platforms
‒ Metrics growth & high Capex intensity
‒ ROCE and gearing
Delivering financial targets while transforming the companyAmbition 21-25
12
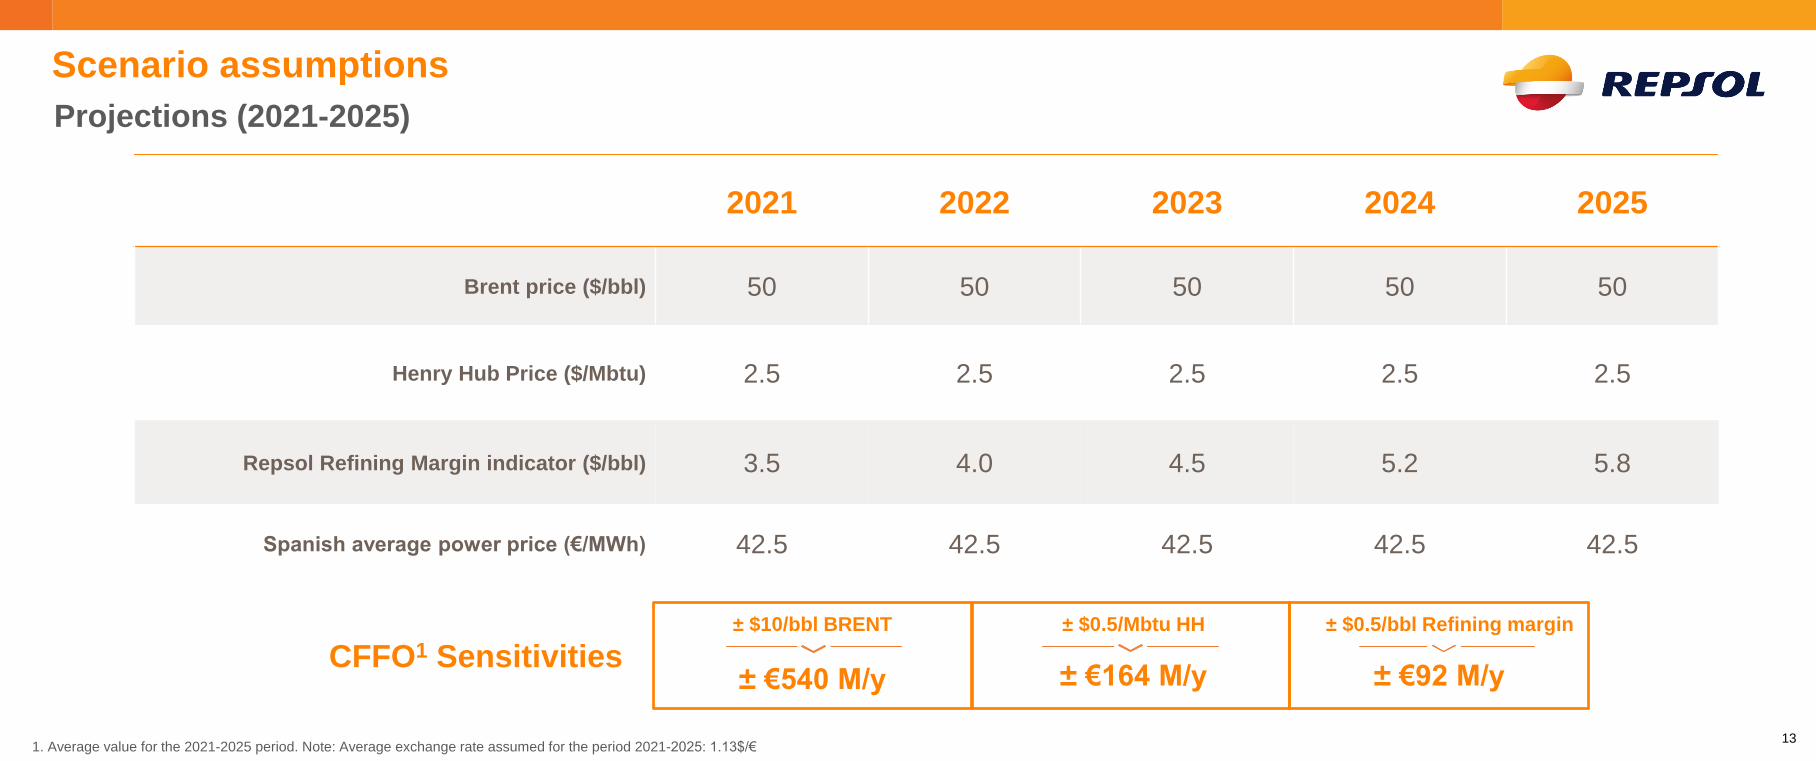
Projections (2021-2025)
Scenario assumptions
CFFO1 Sensitivities
2021 2022 2023 2024 2025
Brent price ($/bbl) 50 50 50 50 50
Henry Hub Price ($/Mbtu) 2.5 2.5 2.5 2.5 2.5
Repsol Refining Margin indicator ($/bbl) 3.5 4.0 4.5 5.2 5.8
Spanish average power price (€/MWh) 42.5 42.5 42.5 42.5 42.5
1. Average value for the 2021-2025 period. Note: Average exchange rate assumed for the period 2021-2025: 1.13$/€
± $10/bbl BRENT ± $0.5/Mbtu HH ± $0.5/bbl Refining margin
± €540 M/y ± €164 M/y ± €92 M/y
13

Adjusted1 2019
0.8
2025 2025Adjusted1 2019Adjusted1 2019 2025
2.2
Strong growth in per share metrics driving valuation upsides
+10%CAGR
Adjusted Net Income per share
141. 2019 @$50/bbl & $2.5 HH
Note: Base scenario @$50/bbl & $2.5 HH; Nº of shares in 2019 (1,527) vs 2025 (1,327, subject to Base Case price deck)
High scenario @$60/bbl Brent & $3/Mbtu HHAcid scenario @$40/bbl Brent & $2.5/Mbtu HH

2021-2025 B-even post-dividends ($/bbl)
Corporate Low carbon gen. UpstreamCCB Industrial
Self-financed plan Cash generation
1. Includes RES portfolio divestments. Other potential inorganic transactions driven by new corporate model, are not included in this Sources and Uses of cash. 2. Includes interests and others as dividend to minority shareholders and hybrid bond interests3. Debt B-even is 10$/Bbl lower, considering debt deconsolidation of the Equity part in the international RES roadmap, and excess-cash from Optionalities
$50/bblFCF BE(inc. SBB)
12.6
Sources
18.3
Uses
15
< $45/bbl
FCF BE
pre-SBB
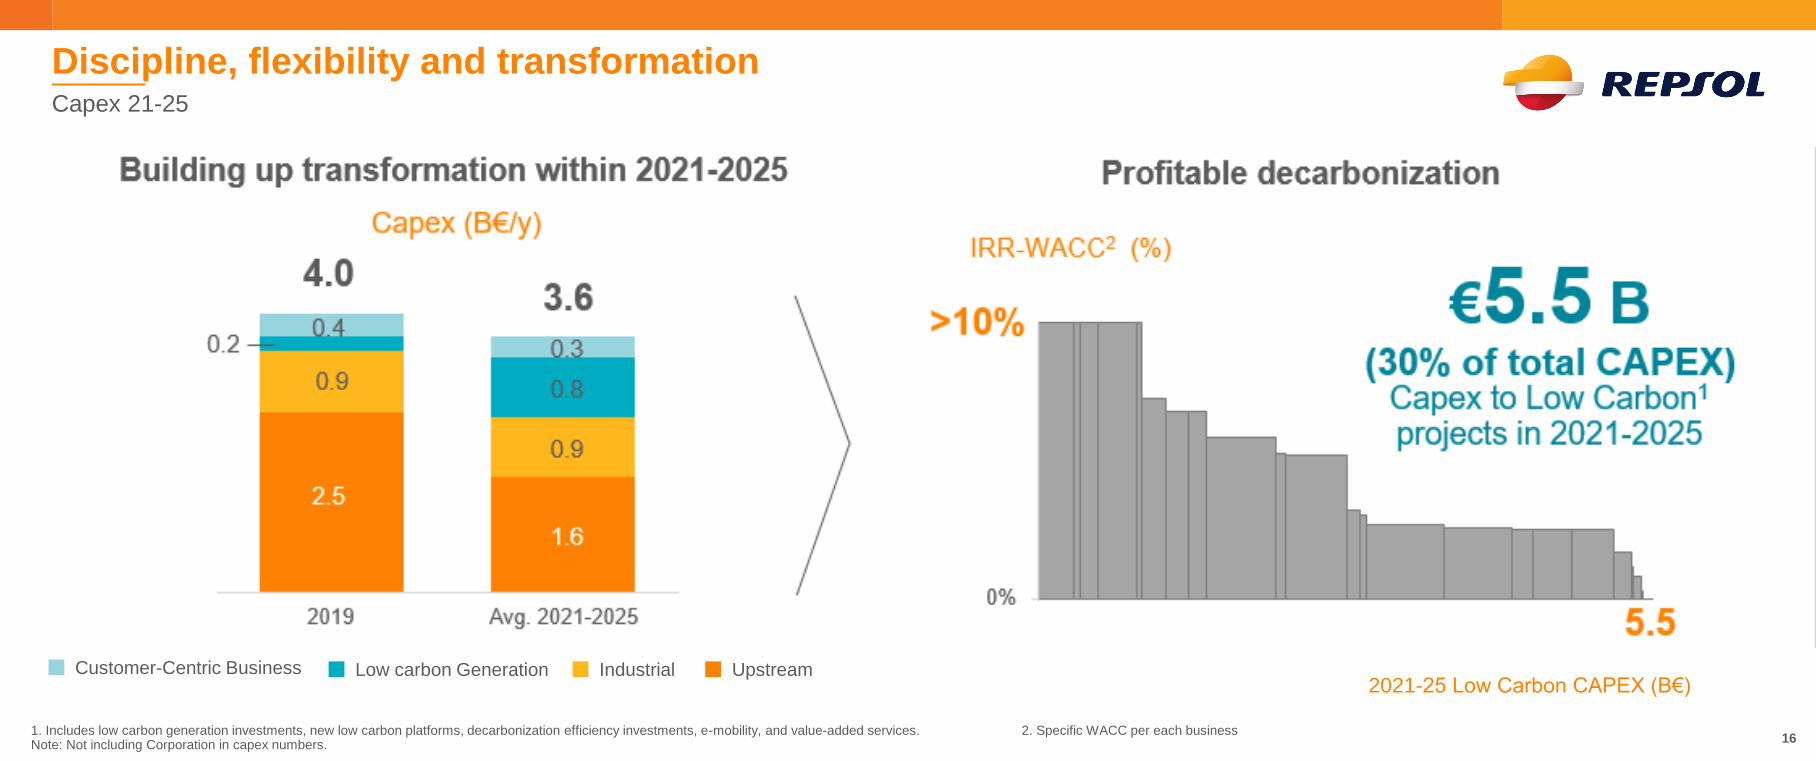
Building up transformation within 2021-2025
2019 Avg. 2021-2025
UpstreamIndustrialCustomer-Centric Business Low carbon Generation
1. Includes low carbon generation investments, new low carbon platforms, decarbonization efficiency investments, e-mobility, and value-added services. 2. Specific WACC per each businessNote: Not including Corporation in capex numbers.
Discipline, flexibility and transformationCapex 21-25
€5.5 B(30% of total CAPEX)
Capex to Low Carbon1
projects in 2021-2025
Profitable decarbonization
2021-25 Low Carbon CAPEX (B€)
5.5
16

17
Legacy and new businesses driving portfolio performance along the Transition
Contribution to portfolio financial profile 21-25
Capital Employed 2025 21-25 Capital Investment
1. Industrial includes Refining Spain and Peru R&M, Chemicals, Trading & Wholesale Gas businessesNote: Corporate values not considered
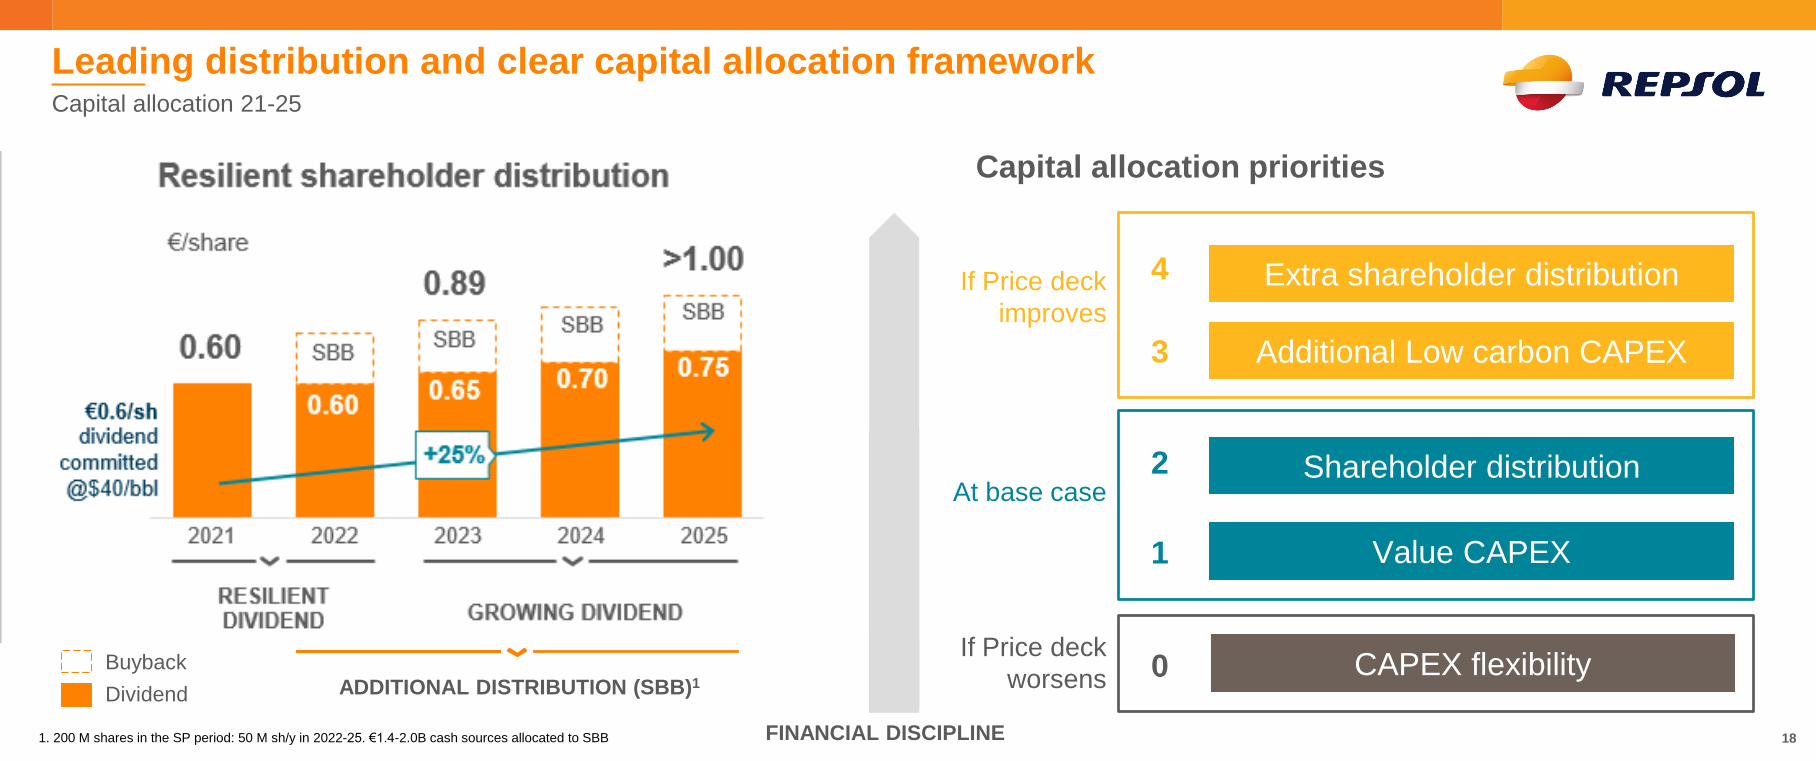
4 Extra shareholder distribution
3 Additional Low carbon CAPEX
If Price deck
improves
2 Shareholder distribution
1 Value CAPEX
At base case
RESILIENT
DIVIDEND GROWING DIVIDEND
ADDITIONAL DISTRIBUTION (SBB)1
Capital allocation priorities
0 CAPEX flexibilityIf Price deck
worsensBuyback
Dividend
Leading distribution and clear capital allocation frameworkCapital allocation 21-25
18FINANCIAL DISCIPLINE
€0.6/sh
dividend
committed
@$40/bbl
1. 200 M shares in the SP period: 50 M sh/y in 2022-25. €1.4-2.0B cash sources allocated to SBB
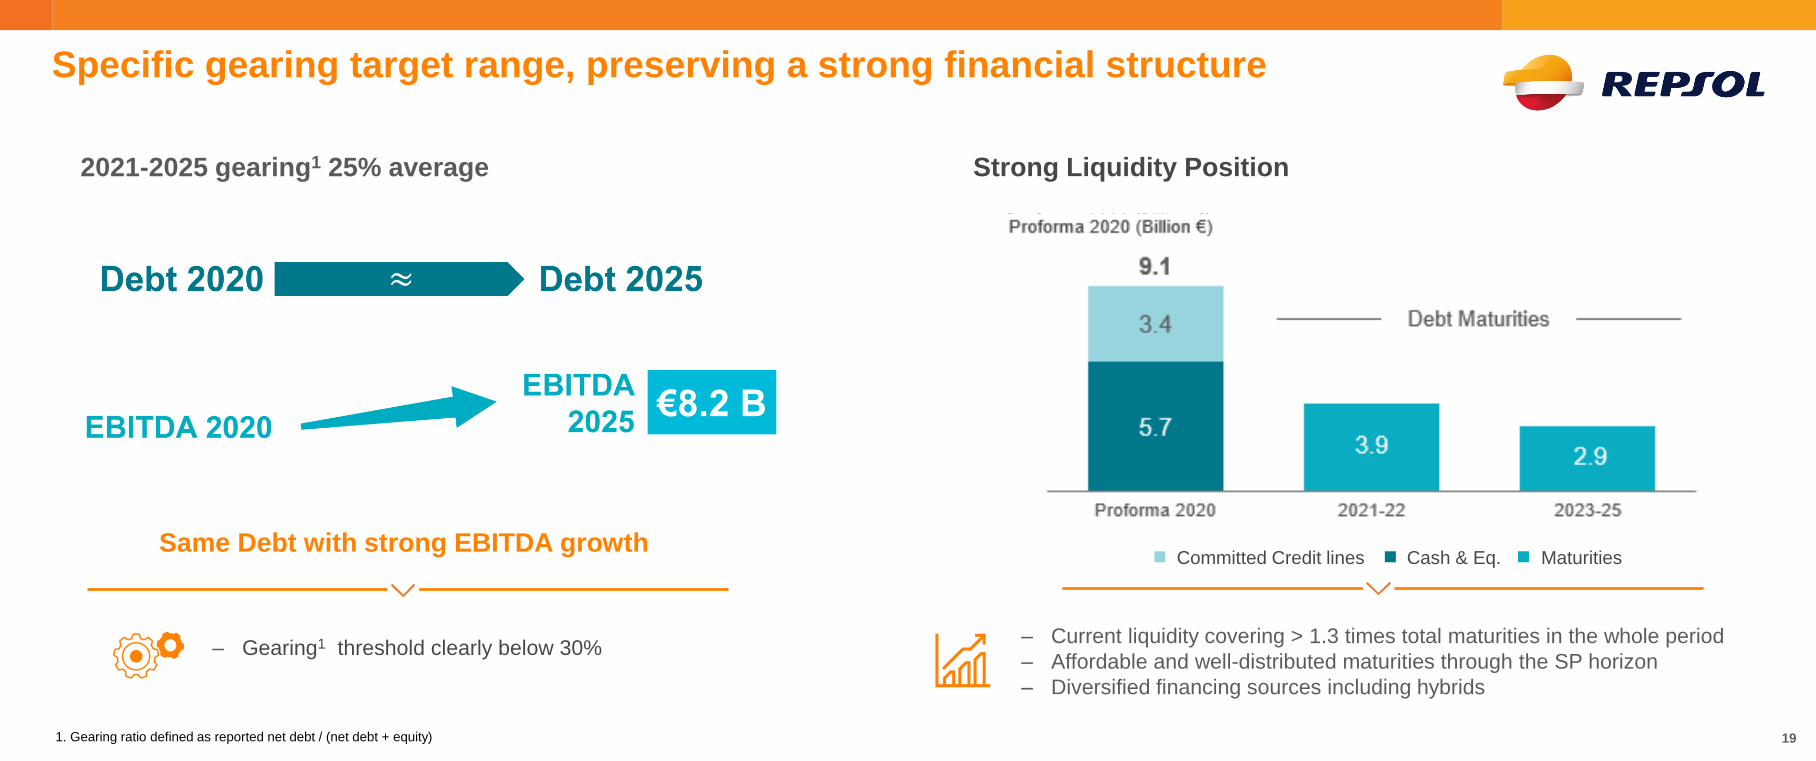
Proforma 2020 2021-22 2023-25
1. Gearing ratio defined as reported net debt / (net debt + equity)
Strong Liquidity Position
Proforma 2020 (Billion €)
‒ Gearing1 threshold clearly below 30%‒ Current liquidity covering > 1.3 times total maturities in the whole period
‒ Affordable and well-distributed maturities through the SP horizon
‒ Diversified financing sources including hybrids
2021-2025 gearing1 25% average
Committed Credit lines Cash & Eq. Maturities
Specific gearing target range, preserving a strong financial structure
Same Debt with strong EBITDA growth
19
€8.2 B
Business strategies
04.
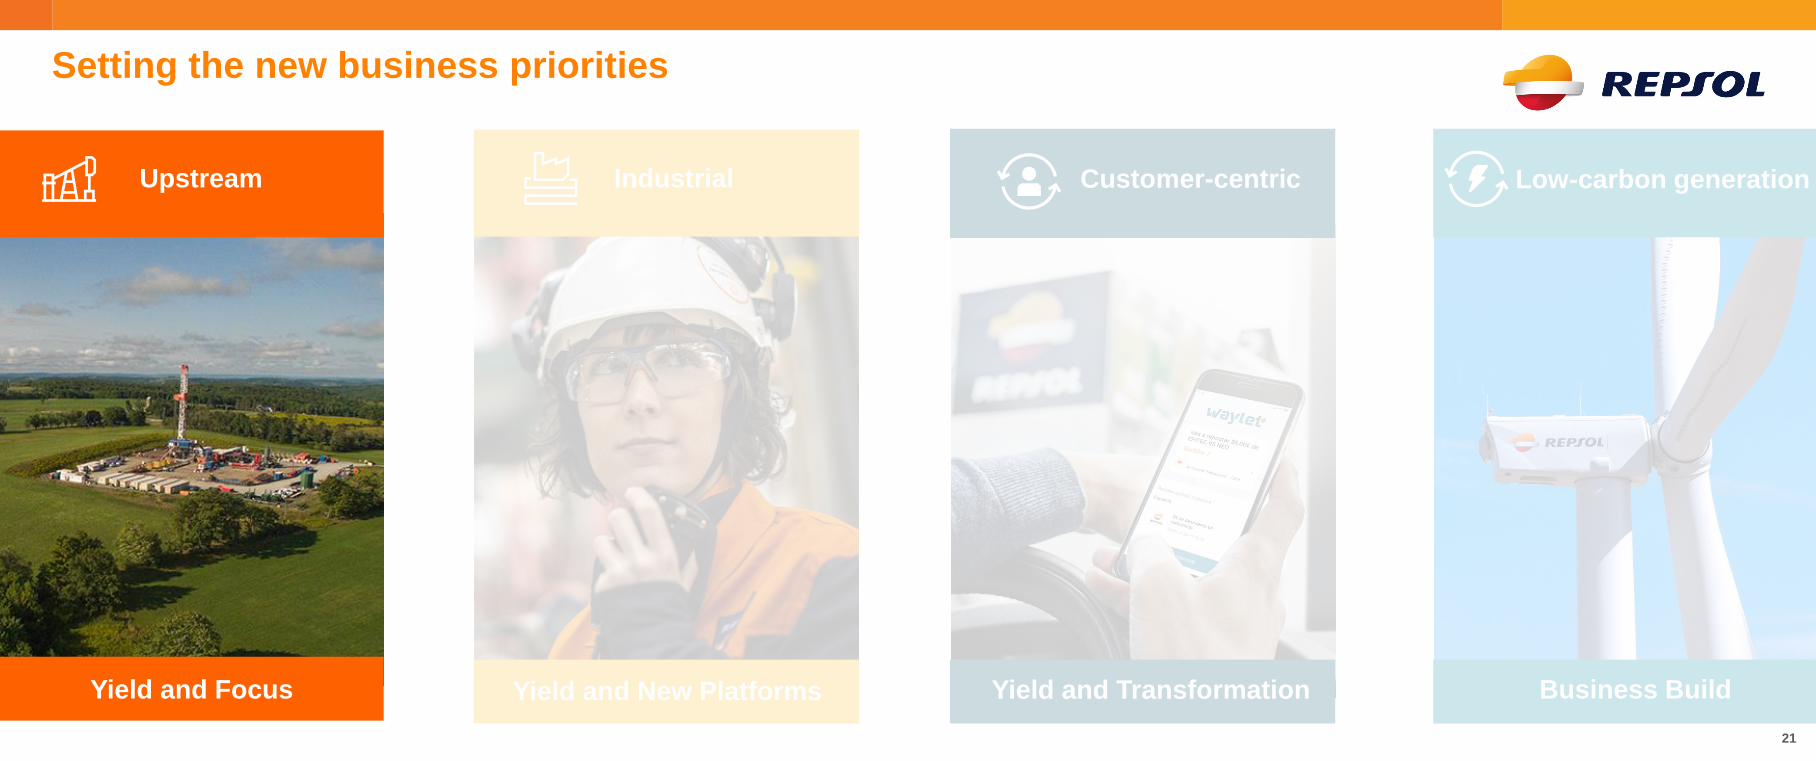
Setting the new business priorities
21
Upstream
Yield and New Platforms Yield and TransformationYield and Focus
Customer-centricIndustrial
Business Build
Low-carbon generation
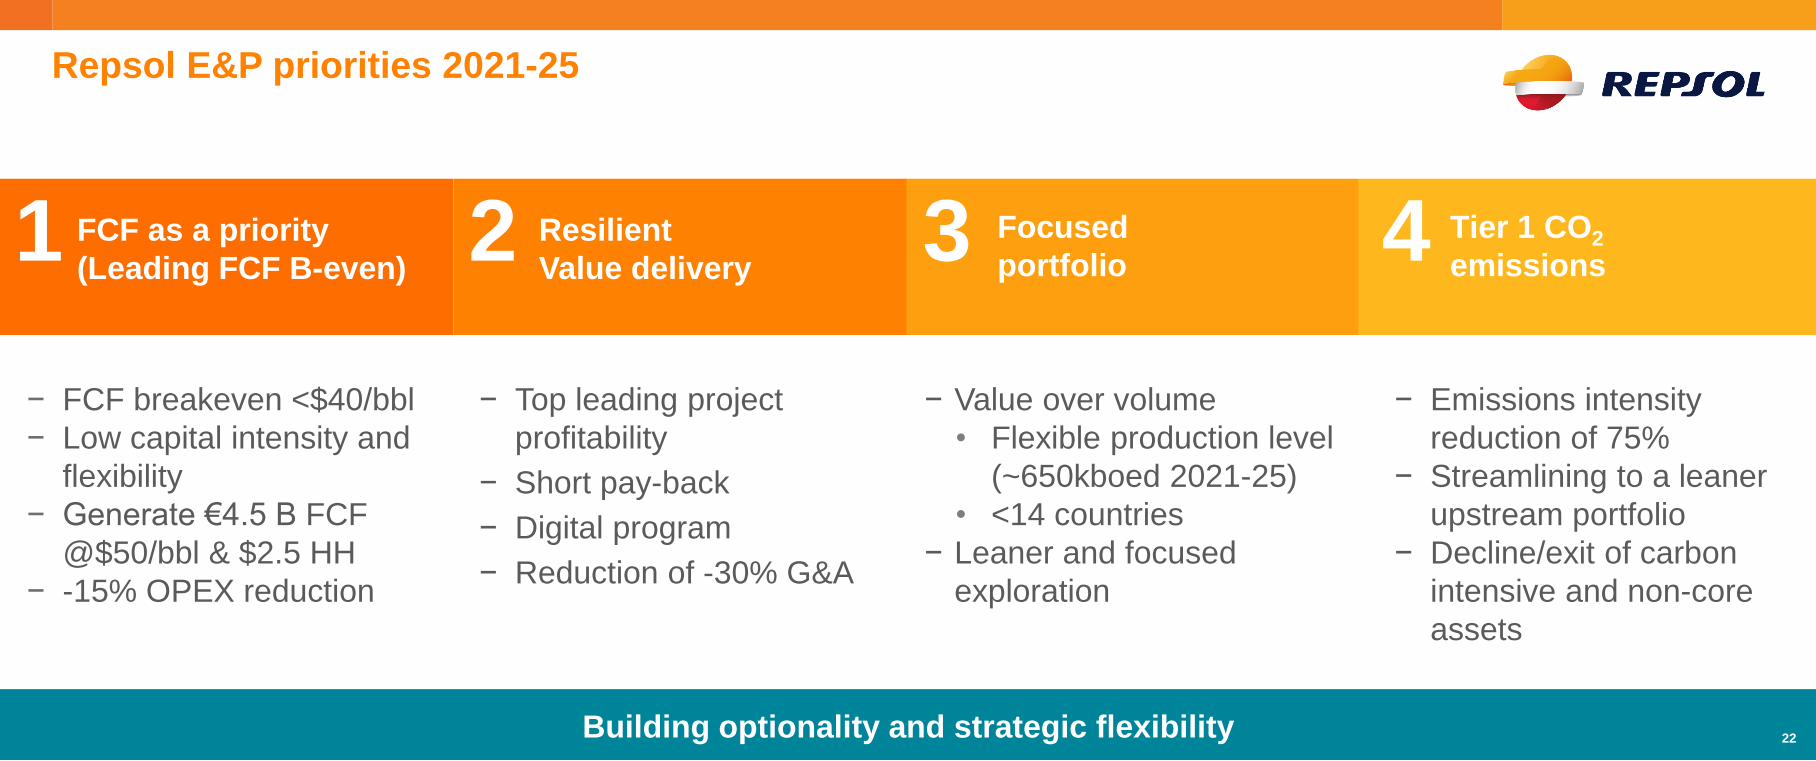
Repsol E&P priorities 2021-25
− FCF breakeven <$40/bbl
− Low capital intensity and
flexibility
− Generate €4.5 B FCF
@$50/bbl & $2.5 HH
− -15% OPEX reduction
Resilient
Value delivery
− Top leading project
profitability
− Short pay-back
− Digital program
− Reduction of -30% G&A
Focused
portfolio
− Value over volume
• Flexible production level
(~650kboed 2021-25)
• <14 countries
− Leaner and focused
exploration
Tier 1 CO2
emissions
− Emissions intensity
reduction of 75%
− Streamlining to a leaner
upstream portfolio
− Decline/exit of carbon
intensive and non-core
assets
FCF as a priority
(Leading FCF B-even)
Building optionality and strategic flexibility
1 2 3 4
22

1. In our operated assets, vs. 2018 2. In our operated assets, vs. 2017
FCF (B€) @50/2.5 FCF BE, Brent ($/bbl) OPEX reduction (B€) Emissions reduction (Mt CO2)
Focus on capital efficiency and cash generationUpstream
23
24
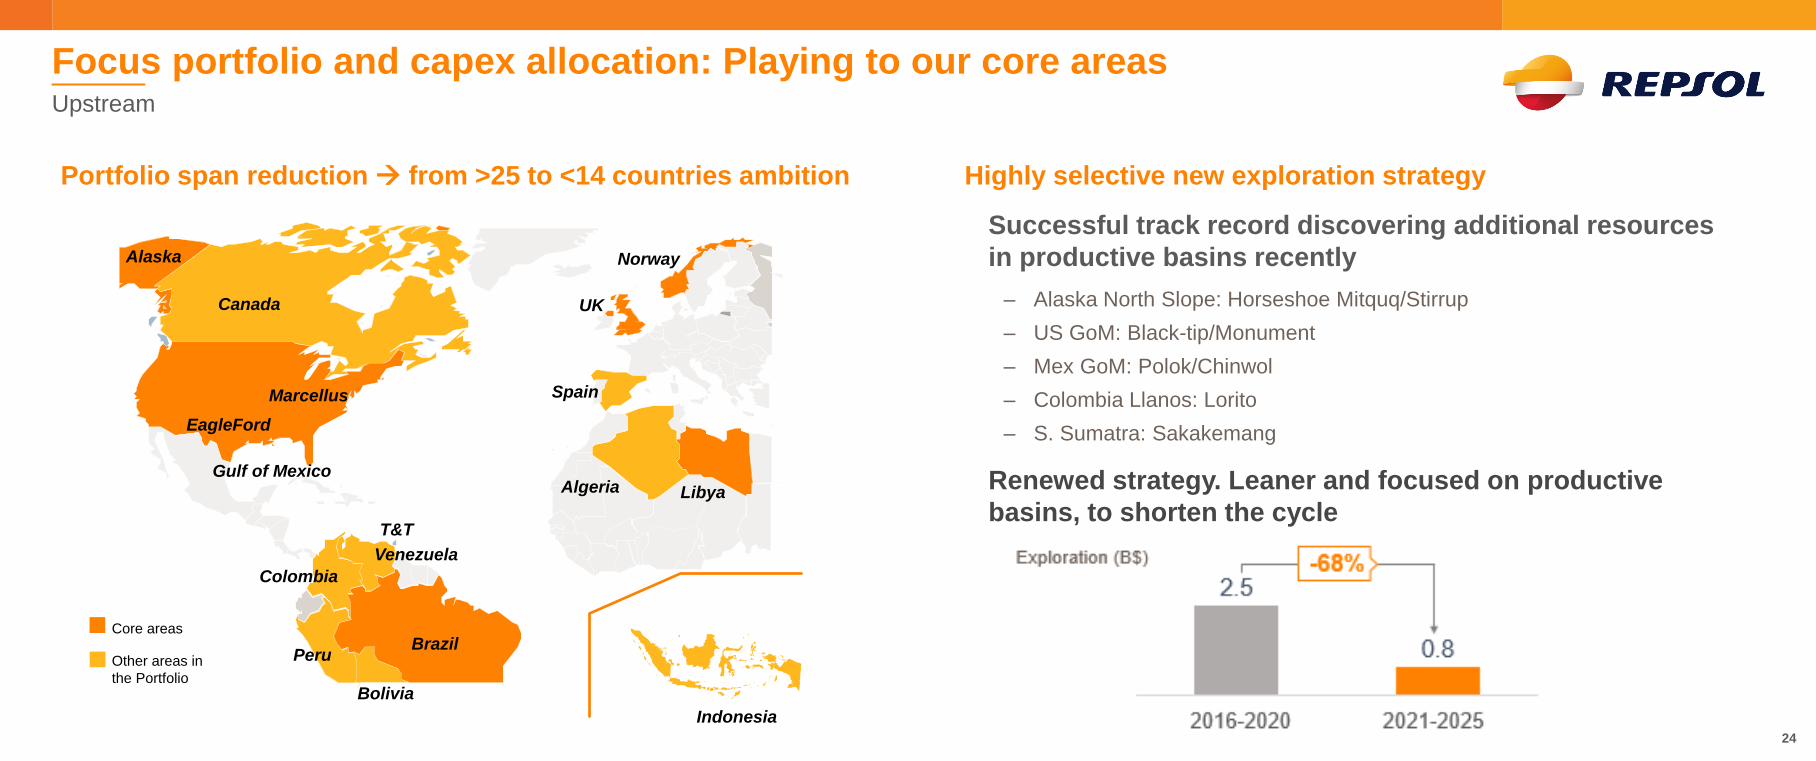
Focus portfolio and capex allocation: Playing to our core areasUpstream
Portfolio span reduction → from >25 to <14 countries ambition Highly selective new exploration strategy
Successful track record discovering additional resources
in productive basins recently
‒ Alaska North Slope: Horseshoe Mitquq/Stirrup
‒ US GoM: Black-tip/Monument
‒ Mex GoM: Polok/Chinwol
‒ Colombia Llanos: Lorito
‒ S. Sumatra: Sakakemang
Renewed strategy. Leaner and focused on productive
basins, to shorten the cycle
Other areas in
the Portfolio
Core areas
UK
Norway
LibyaAlgeria
SpainMarcellus
EagleFord
Gulf of Mexico
Venezuela
T&T
Canada
Peru
Bolivia
Brazil
Indonesia
Alaska
Colombia
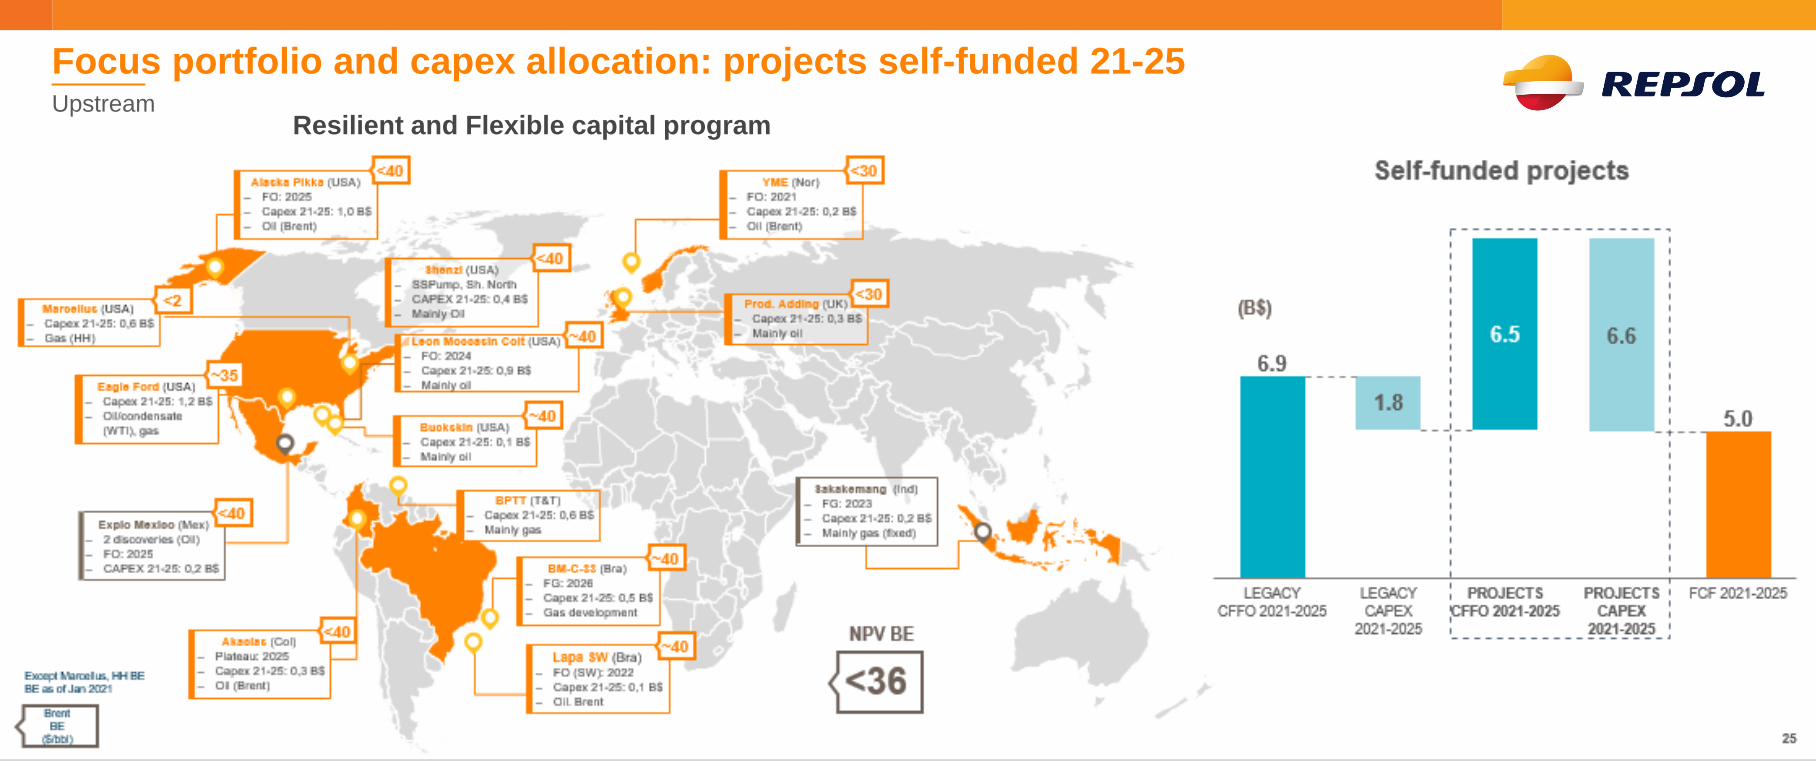
Focus portfolio and capex allocation: projects self-funded 21-25Upstream
Resilient and Flexible capital program
Self-funded projects
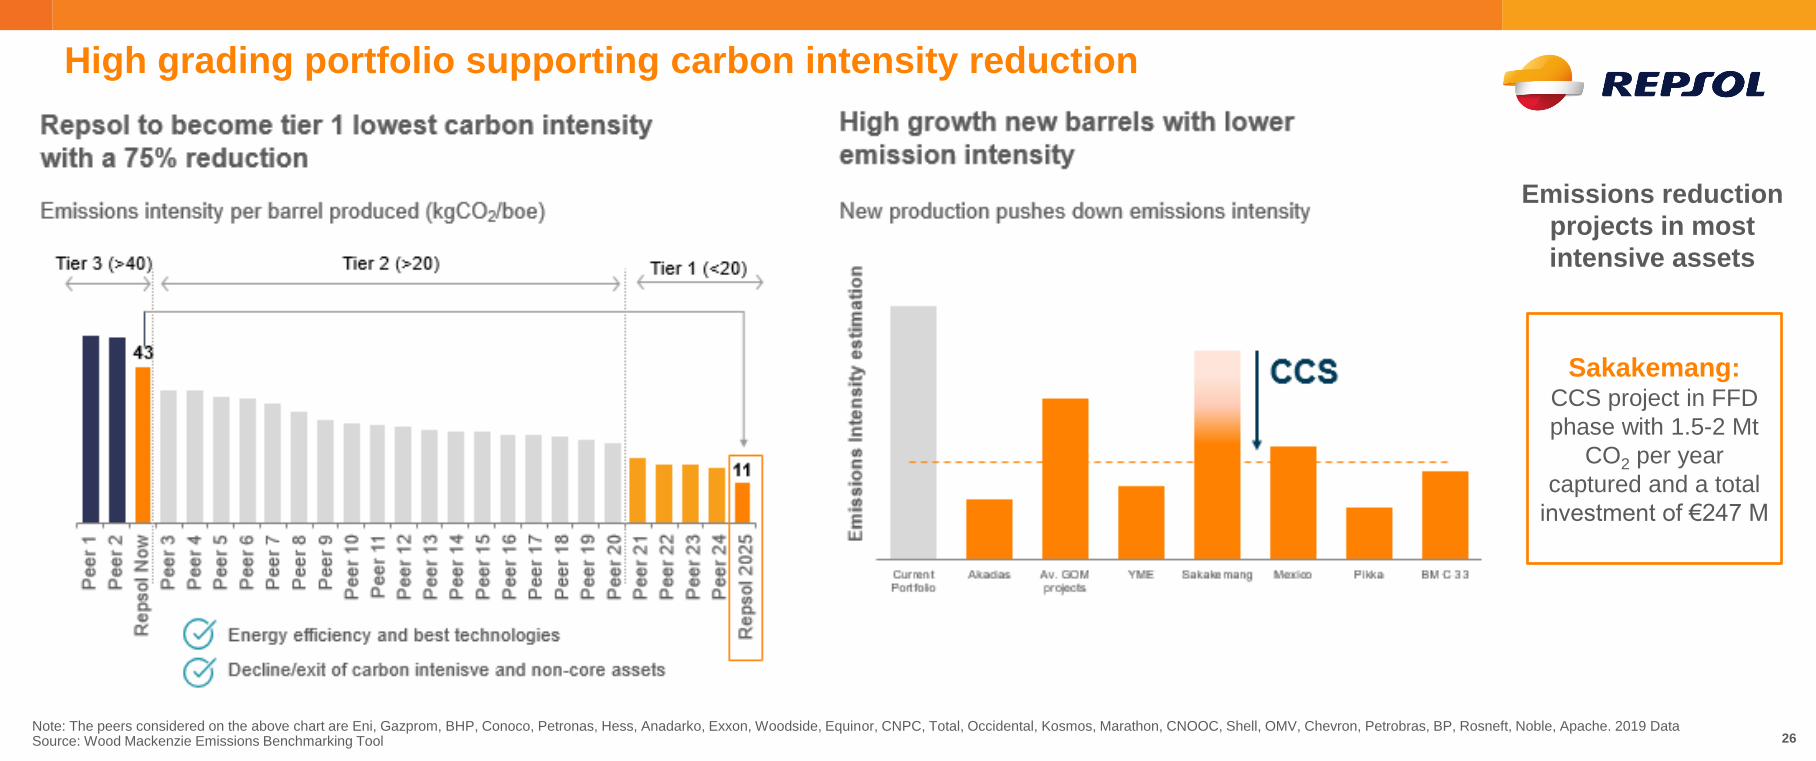
High growth new barrels with lower
emission intensity
Note: The peers considered on the above chart are Eni, Gazprom, BHP, Conoco, Petronas, Hess, Anadarko, Exxon, Woodside, Equinor, CNPC, Total, Occidental, Kosmos, Marathon, CNOOC, Shell, OMV, Chevron, Petrobras, BP, Rosneft, Noble, Apache. 2019 DataSource: Wood Mackenzie Emissions Benchmarking Tool
Repsol to become tier 1 lowest carbon intensity
with a 75% reduction
Sakakemang:CCS project in FFD
phase with 1.5-2 Mt
CO2 per year
captured and a total
investment of €247 M
Emissions reduction
projects in most
intensive assets
High grading portfolio supporting carbon intensity reduction
26

Upstream
Yield and New Platforms Yield and TransformationYield and Focus
Customer-centricIndustrial
Business Build
Low-carbon generation
Setting the new business priorities
27
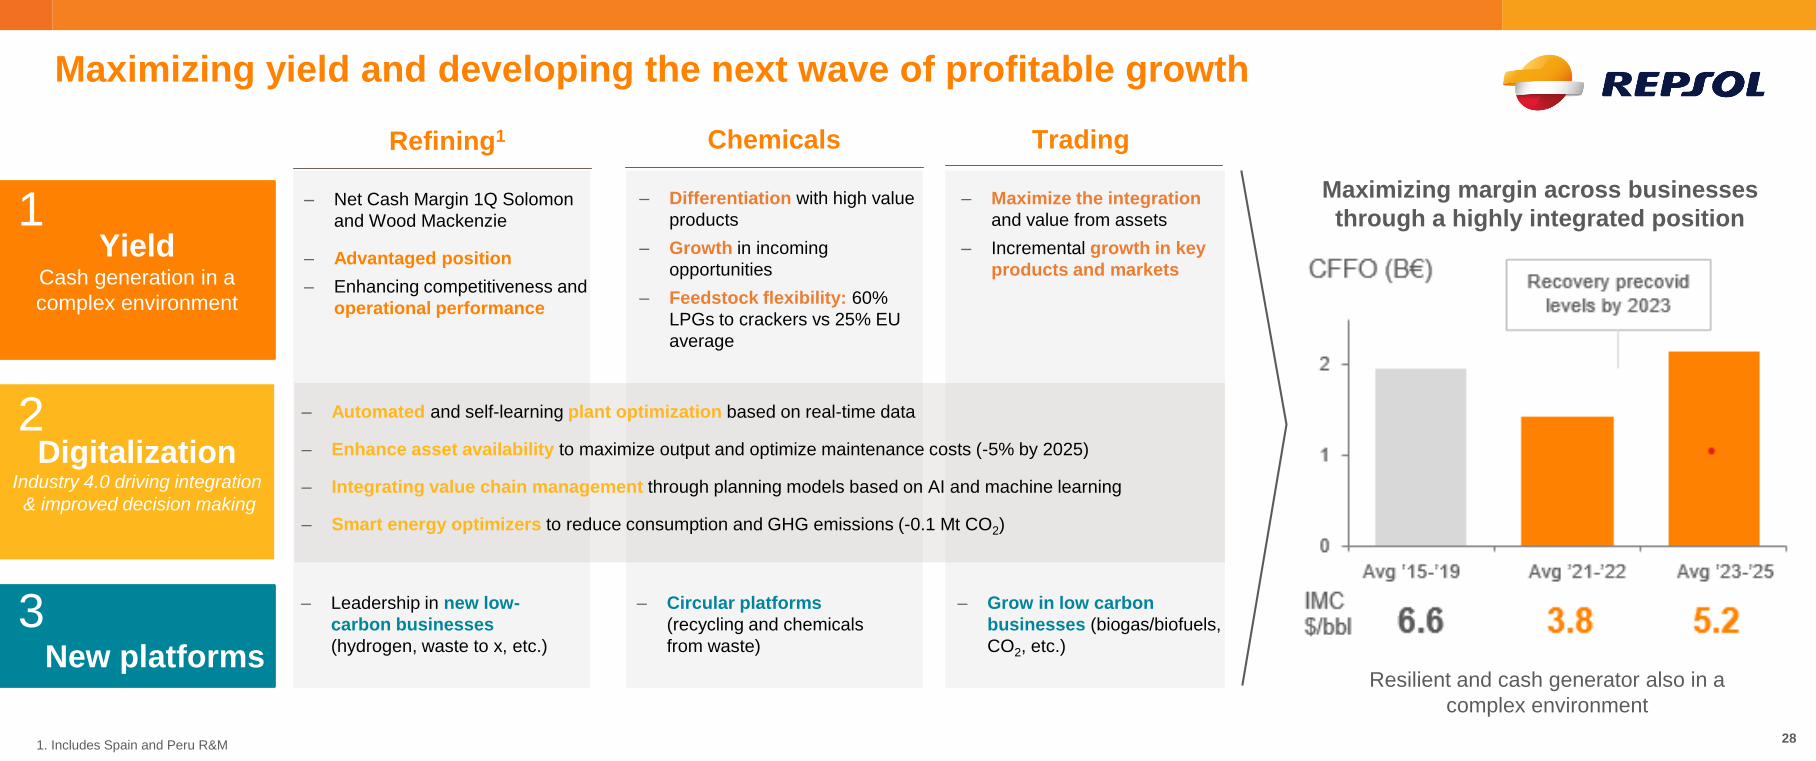
Maximizing yield and developing the next wave of profitable growth
Resilient and cash generator also in a
complex environment
Maximizing margin across businesses
through a highly integrated position
1. Includes Spain and Peru R&M
YieldCash generation in a
complex environment
DigitalizationIndustry 4.0 driving integration
& improved decision making
Refining1 Chemicals Trading
‒ Net Cash Margin 1Q Solomon
and Wood Mackenzie
‒ Advantaged position
‒ Enhancing competitiveness and
operational performance
‒ Maximize the integration
and value from assets
‒ Incremental growth in key
products and markets
‒ Differentiation with high value
products
‒ Growth in incoming
opportunities
‒ Feedstock flexibility: 60%
LPGs to crackers vs 25% EU
average
‒ Automated and self-learning plant optimization based on real-time data
‒ Enhance asset availability to maximize output and optimize maintenance costs (-5% by 2025)
‒ Integrating value chain management through planning models based on AI and machine learning
‒ Smart energy optimizers to reduce consumption and GHG emissions (-0.1 Mt CO2)
‒ Leadership in new low-
carbon businesses
(hydrogen, waste to x, etc.)
‒ Circular platforms
(recycling and chemicals
from waste)
‒ Grow in low carbon
businesses (biogas/biofuels,
CO2, etc.)
1
2
3New platforms
28

CAPEX (B€)FCF (B€)
Low carbon
2025 BE1 reduction
>$1.5/bbl
1. For Refining business 2. Scope 1+2+3 emissions
Solid cashflow generation and new businesses build upIndustrial
29
CO2 reduction2 by 2025
> 2 Mt CO2
2021 2025
1.4
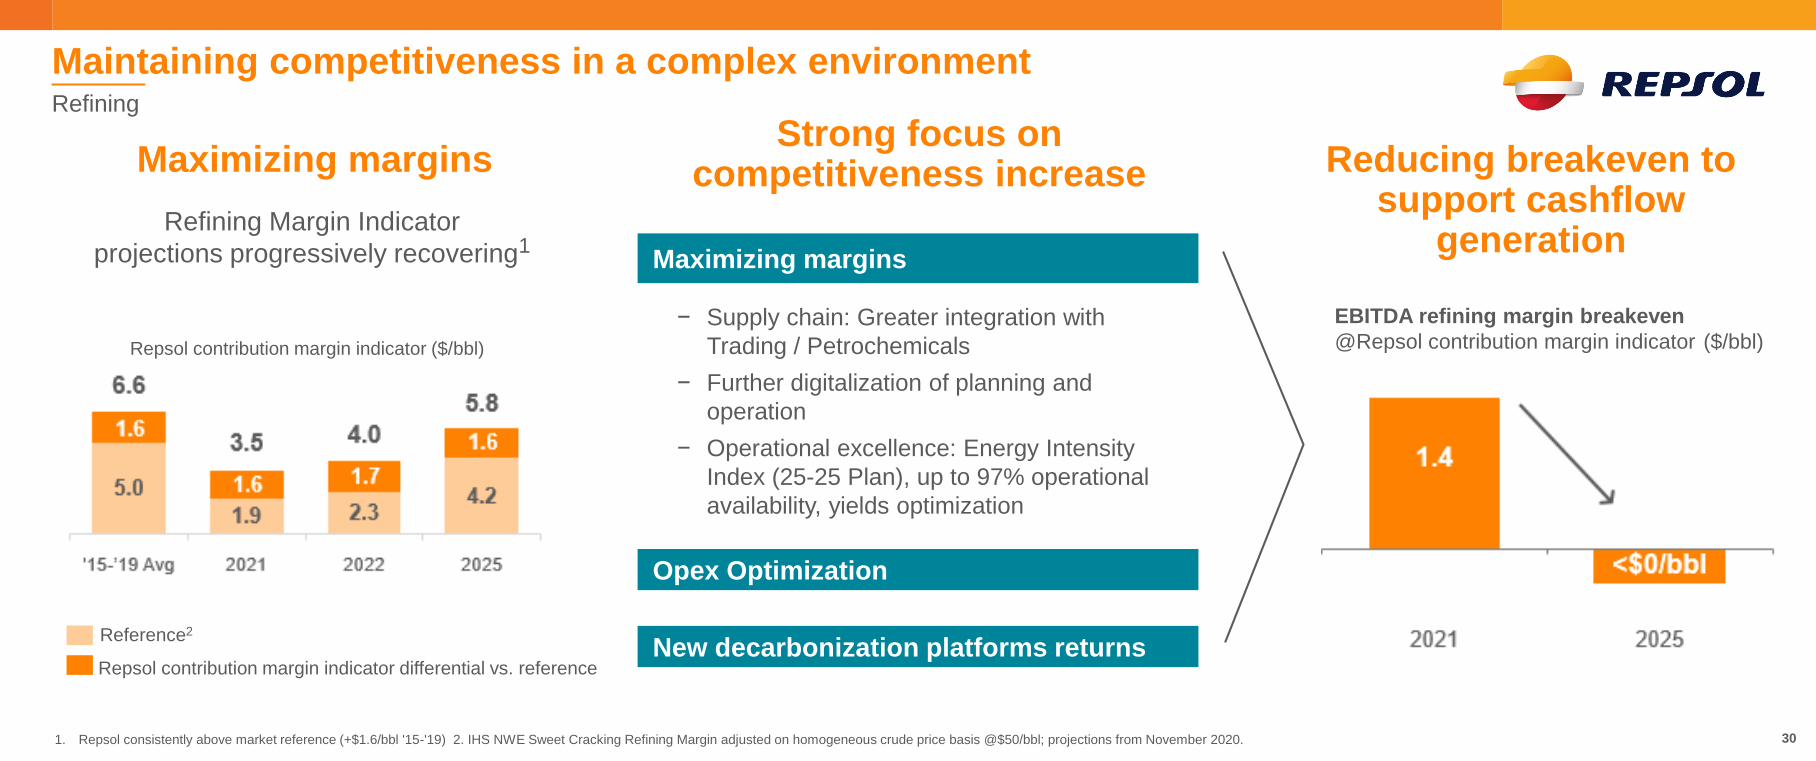
Refining Margin Indicator
projections progressively recovering1
1. Repsol consistently above market reference (+$1.6/bbl '15-'19) 2. IHS NWE Sweet Cracking Refining Margin adjusted on homogeneous crude price basis @$50/bbl; projections from November 2020.
Maximizing margins
− Supply chain: Greater integration with
Trading / Petrochemicals
− Further digitalization of planning and
operation
− Operational excellence: Energy Intensity
Index (25-25 Plan), up to 97% operational
availability, yields optimization
/ Maximizing margins
EBITDA refining margin breakeven
@Repsol contribution margin indicator ($/bbl)Repsol contribution margin indicator ($/bbl)
Strong focus on competitiveness increase Reducing breakeven to
support cashflow generation
2022'15-’19 Avg 2021 2025
Reference2
Repsol contribution margin indicator differential vs. reference
Maximizing margins
Opex Optimization
New decarbonization platforms returns
Maintaining competitiveness in a complex environmentRefining
30

25/25 decarbonization program with strong contribution to margin improvement and CO2 reduction
>20% estimated IRR
€0.4 B Total
Capex
>200Initiatives identified
Industrial energy efficiency
2021-2025
• Adopting best-in-class
technologies
• Exploration of energy
use opportunities and
utilities optimization
• Digitalization of
operations and
integration with AI
Maximizing energy efficiency with attractive returns New low carbon business selected projects
-0.8 Mt CO2 reduction1
C43: Waste & UCOs treatment plant
Advanced HVO plant - Reducing 900 kt/y CO2 emissions
Biogas generation plant from urban waste
Biogas to substitute traditional fuel consumption
Investment Capacity
Investment Capacity
€188 M250 kta
300 kta
Sustainable biofuels
From waste per year
10 kta€20 M Urban waste
Cartagena
Chemicals circularity‒ Zero project: chemical recycling of
used plastics
‒ Reciclex project: mechanical
recycling of polyolefins
Investment Capacity
74 kta€70 M Circular polyolefins2
Petronor
Net zero emissions fuel plant
E-fuel production from renewable hydrogen (electrolysis) and CO2
Investment Capacity
€60 M 10 MW Electrolyzer
Petronor
Puertollano
1. Scope 1+2 emissions 2. Recycle 20% equivalent of our polyolefins production by 2030, target to which other technologies will also contribute (e.g. gasification)31

Upstream
Yield and New Platforms Yield and TransformationYield and Focus
Customer-centricIndustrial
Business Build
Low-carbon generation
Setting the new business priorities
32

Strategic drivers
in Energy
Transition
Key
foundations
More autonomous management, strengthening entrepreneurship cultureWays of
working
Longstanding Iberian
Energy Leader
Mobility leader in
continuous
transformation
High-growth power
customer business
World-class digital
Expand digit platforms for customer engagement (Waylet & Vivit apps), with AI based personalization and advanced pricing
Customer centricity
Roll out the new transversal loyalty program, developing engagement with end customers
Multi-energy
Cross-sell to current customers and channels, adding new services (E-Mobility, Energy Services & Advanced mobility services)
Strong and growing profits and cash generationCustomer-Centric Businesses Strategy 2021-25
33
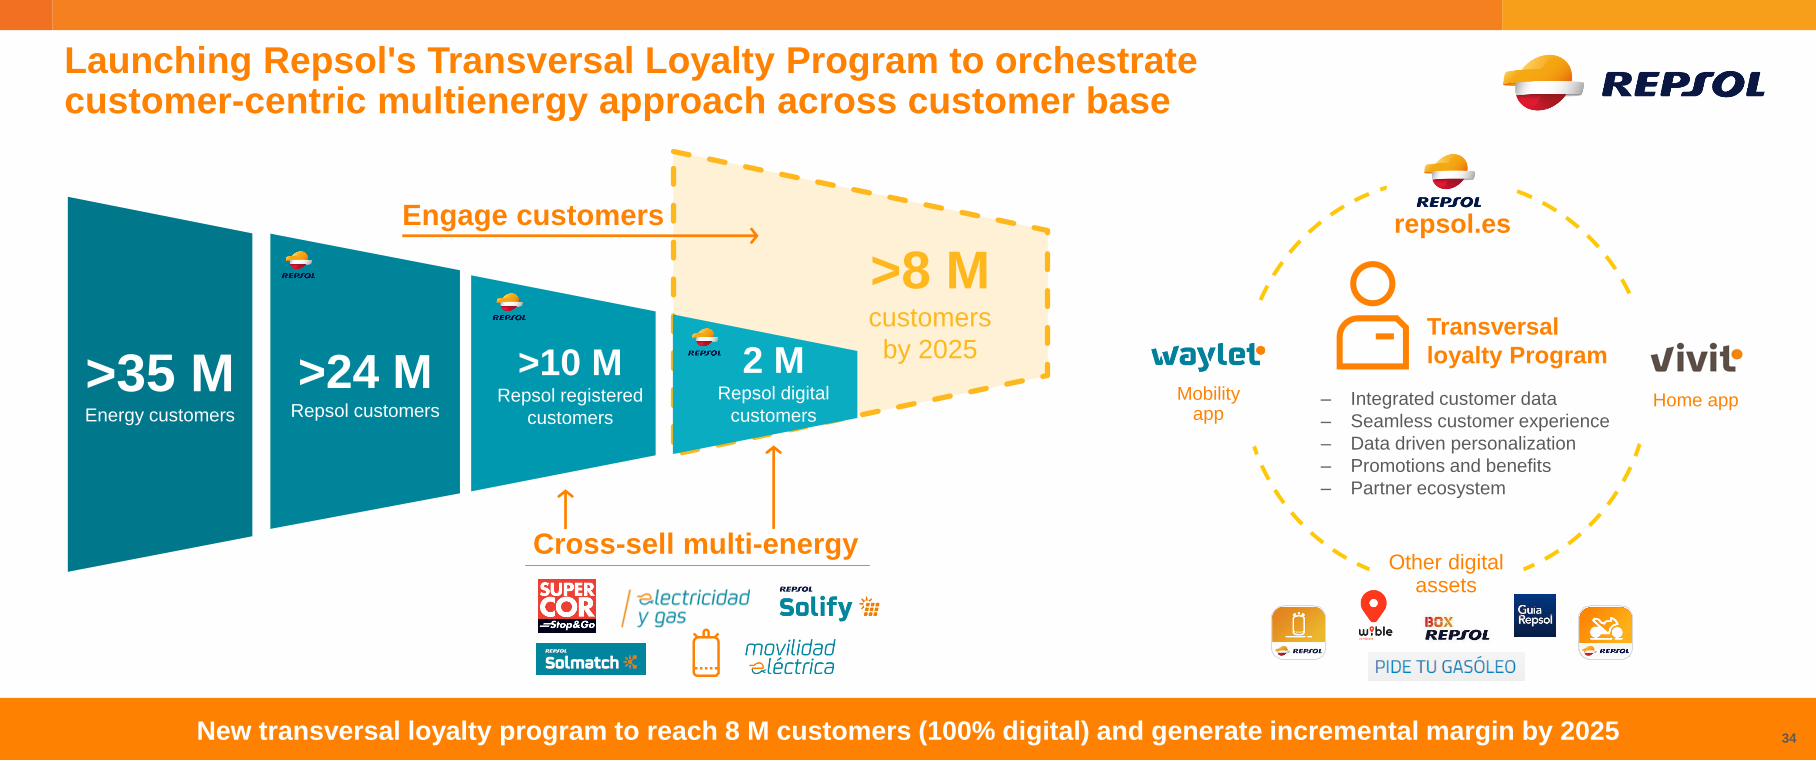
New transversal loyalty program to reach 8 M customers (100% digital) and generate incremental margin by 2025
Launching Repsol's Transversal Loyalty Program to orchestrate customer-centric multienergy approach across customer base
Transversal
loyalty Program
repsol.es
Other digital assets
‒ Integrated customer data
‒ Seamless customer experience
‒ Data driven personalization
‒ Promotions and benefits
‒ Partner ecosystem
Mobility app
Home app
34
>10 MRepsol registered
customers
2 MRepsol digital
customers
>24 MRepsol customers
>35 MEnergy customers
Engage customers
Cross-sell multi-energy
>8 M customers
by 2025

2020 2025
Digital customers ('000)
P&G +
E-Mobility
customers
2019 2020 2025
Mobility contribution margin (M€)
Non-oil contribution margin (M€)
EBITDA (B€)
202520202019
FCF (B€)
x 1.151,100 k 2,000 k
Growth ambition with strong FCF generationCustomer Centric Business
x 1.2535

Upstream
Yield and New Platforms Yield and TransformationYield and Focus
Customer-centricIndustrial
Business Build
Low-carbon generation
Setting the new business priorities
36

1. RES: Considering 100% in Spain and International (excl. Chile) and 50% JV stake in Chile 2. Excludes structure costs. 2025 EBITDA estimated assuming 2025 consolidated capacity is operating during the whole year for comparative reasons. Figure considering only estimated operating capacity of 7.4 GW is €321 M 3. Low Carbon generation objective to 2025 increased from 7.5 to 8.3 GW in July 2021. Note: Gross Capex, capacity, and gross EBITDA considers 50% WI in Chile and 100% WI in Spain and rest of the world. EBITDA and Capex figures do not include cogenerations)
Phase I2019
− Launch organic growth – development
of Ready to Build and earlier stage
assets
− Develop RES capabilities and project
pipeline
Estimated low carbon operating capacity (GW)1
− Build and put in operation pipeline, with
more than 500 MW per year in early-
stage assets
− Create international platforms
Phase II2020-2025
− Accelerate organic development to
more than 1 GW per year
− Optimize portfolio with an opportunistic
approach
Phase III2026-2030
Developing a competitive RES player with international platforms
3.0 Gw
7.5 Gw 3
15 Gw
37
0.2
20202019 2025
0.6
Capex (B€)
2019 2025
40
Gross EBITDA2 (M€)
Spanish average power price
42,5 €/MWh

1. Greenfield projects with interconnection rights, including solar hybridization projects in wind portfolio2. COD: Commercial Operation Date 3. Estimated figures average for wind and solar projects without selling down equity stakes Note: Considering 50% JV stake in Chile4. Not including other conventional generation as Cogeneration (622 MW) and CCGTs (1,648 MW)
Strong portfolio of advanced stage projects with short term material growth and robust profitability
Boosting project returns through management excellence and scale
+3-4%IRR3
Aguayo project (Cantabria),
pumped storage of 1,000 MW,
to start construction in 2022/23
Spain
175 MW
2021/2022
PI
Castilla y León
335 MW
2020
DELTA
Aragón
860 MW
2021/2023
DELTA II
Aragón
126 MW
2021
Kappa
Castilla la
Mancha
204 MW
2022
SIGMA
Andalucía
Operating capacity
@ End 2020Capacity
COD2
‒ Reduced development costs
‒ Best-in-class construction and operations
‒ Energy management
‒ Optimized financing structure
Under
constructionHigh visibility
pipeline
264 MW
2021
Valdesolar
Extremadura
5 MW
2020Windfloat
385 MW
2023
Antofagasta
PE
275 MW
2021 (137.5 MW)
2022 (137.5 MW)
Elena
Chile
39 MW
2020
Cabo
Leonés
III
90 MW
2022Atacama
55 MW
2021
Cabo
Leonés
III
Add. pipeline
482MW1
38
International0.7 GW
3.1 GW
1.3 GW
3.6 GW
2025
2030
Spain4
1.0 GW
2.0 GW
0.7 GW
1.7 GW
1.4 GW
2.3 GW
2025
2030

39
Repsol RES project portfolio in Spain and Chile with attractive economicsLow carbon generation
1. Note 1: Repsol COD 2020-23 projects Levelized Cost of Energy vs. BNEF1 Spain LCOE references. Note 2: Repsol COD 2021-23 projects Levelized Cost of Energy vs. BNEF1 Chile LCOE references. Note 3: BloombergNEF models estimate LCOEs range for each technology and geography in a given period. Repsol projects’ LCOEs are calculated with the same methodology used by BNEF. Comparable LCOEs from BNEF used for each set of projects. Average case from BNEF taken. Note: 1.15 $/€ exchange rate used in LCOEs figures for Chilean assets.
SPAIN
CHILE
Wind
(3 projects)
Solar
(3 projects)
Levered
IRR
10% - 12%
12% - 18%

05.
Stepping up energy transition

Decarbonization is an opportunity to build business platforms
as technology evolves
Industrial transformation
1. Forestry JV
Customer-centric businesses
Carbon sinks
Renewable generation
Advanced biofuels,
biogas and recycling
Renewable hydrogen Synthetic fuels (e-fuels)
Dual-platform advanced mobility
Low carbon power retail
+ Energy Solutions
Hybrid plants
Stationary energy storage
Natural Climate Solutions1
Carbon Capture Utilization & Storage
41
2020-20252025-2030 +2030

Ambition to become a leader in the Iberian PeninsulaRenewable Hydrogen
42
Multi-technology
approachproviding flexibility,
and optimizing production Electrolysis Biomethanein existing SMRs1
Photoelectrocatalysisproprietary technology
Largest H2 consumer(72%) and producer in SpainPrivileged integrated position allowing
arbitrage between self-consumption
and other final uses
Transportation
and e-fuelleveraging SSs
Gas network injectionblended with gas for
residential and industrial use
Industrial
feedstockto other players
Electricity storagefor flexible power
generation
Clear ambition2 to become Iberian leader
Repsol to become an active H2 playeracross uses, and a strategic partner to develop the
Government ambition
1. Steam reformer 2. Repsol's hydrogen ambition conditioned to access to regulatory changes and availability of EU recovery funds Plan, H2 ambition increased in July 2021 to 0.55 GW eq. in 2025 and 1.9 GW eq. in 2030. 3. Considering a ratio of 0.02 t/h per MW and 8,000 hours of operation per year based on Repsol's past projects
64 kt/yH2
production3 192 kt/y

Repsol's with an advantageous position resulting in tier#1 LCOH1 ~30%
lower vs. a local renewable H2 producer
− Renewable H2 production from biomethane to become competitive in the short term
− Integration in current sites and with own renewable power generation
Repsol best positioned to lead H2 development and cost competitiveness as the main consumer in Spain
(vs. non-consuming players interested in high prices to drive production)
+35% production cost
Renewable H2 production cost for an av. player in Spain (€/kg) Production cost via electrolysis in 20302 (€/kg)
Competitiveness of electrolytic vs.
fossil fuel H2, expected by 2030,
could be brought forward by
‒ Technology cost reduction
(massive adoption)
‒ Higher carbon price
‒ Regulatory mechanisms, as/if
needed
Spain, the best EU location to produce hydrogen with
electrolyzers
‒ Lower production costs due to better renewable resource
‒ Spain reaching renewable H2 (with electrolyzers)
competitiveness five years before Germany
Repsol with clear advantages in renewable hydrogen productionRenewable Hydrogen
43
1. Levelized Cost of Hydrogen assuming 50% of the renewable H2 production made with biomethane and the remaining 50% with electrolyzers. 2. Spain with an average LCOE of €33.2/MWh and Germany with an av. LCOE of €48.3/MWh in 2030

Leveraging our tier one industrial sites to
produce biofuels in own facilities through
modifications of current units
− Lower Capex: <€500/t in existing plants
(vs. >€1000/t of peer's new plants)
Positioning, scale and relevance of our
industrial hubs key to secure feedstock
Already a leading biofuels producer, and
first biofuels marketer in Spain
(66% share)
1.3
Current Capacity
0.7
2030 planTotal 2025 capacity2
> 2.0
Sustainable biofuels gross production (Mta)
Updated ambition: from 600kt of HVO
to >2 Mt of sustainable biofuels
‒ > 65% of biofuels produced from waste by 2030 (up to
100% potentially to satisfy market or regulation demands)
‒ Large availability of required feedstock with flexibility
between alternatives
‒ ~4 Mt of waste3 to be used as raw materials by 2030Repsol with a leading sustainable biofuels ambition
Average projects IRR >15%
Use of wastes as feedstock
Biomass
Refused Derived Fuel
Lipid wastes
Organic wastes
Repsol best positioned for sustainable
biofuels production
Reaching > 2 Mta of sustainable
biofuels in 20301
With a multi-technology and raw
material approach
1. Gross volumes 2. Expected capacity of sustainable biofuels by 2025 includes: 700 kt/y from current existing capacity, 250 kt/y capacity from the advanced biofuels plant in Cartagena, 130 kt/y capacity from a gasification plant to produce methanol and ~300 kt/y capacity through modifications in existing units. 3. Gross volume. It includes Repsol’s whole circular strategy: biofuels, circular chemical products and plastics and biogas production
Repsol becoming an advantaged producerSustainable biofuels
X 3
44

CII reduction breakdown by decarbonization lever
CII evolution: Repsol speeds up the transformation by increasing its carbon reduction targets from 20% to 25% by 2030
Further Technology
evolution and
offsetting initiatives
supporting Net zero
A clear decarbonization pathway towards net zero in 2050
45

SP summary
06.

Leading the
journey
to an ambitious
destination
Delivering a compelling investment case into the TransitionStrategic Plan 2021-2025. Driving growth and value with capital discipline
Profitable and achievable Net Zero12% CII reduction by 2025
ROACE 25 +2 p.p.
Profitable business platforms
‒ 2021-22: Resilience and Strength
‒ 2023-25: Accelerate transformation
FCF 21-25: €2.2 B/y
EPS 25: €1.8/share
CFFO/share +7% CAGR 19-25
RES partner or IPO
DPS: €0.6/sh 2021 ; €0.75/sh 2025
• SBB: 50 M share/y from 2022
New Operating model
Distinctive ambition for transformation
47
30% low carbon CAPEX 21-25
FCF generation
Top quartile distribution
Note: Targets at Strategic Plan price deck ($50/bbl and $2.5/Mbtu)
Prudent financial policy Gearing 21-25: ~25%

1. 2016 baseline 2. Corporate Human Rights benchmark. 3. WHT&G included 4. Lubricants, Asphalts and Specialties Note: 2019 @$50/bbl & $2.5 HH
FCF (B€) 2021-25 @50/2.5 FCF (B€ EBITDA (B€)
Digital
customers
in 2025
Low-carbon capacity (GW)
+4.5 GW of RES
capacity increase in
2019-2025
1st quartile in CHRB2
At least 40% of LTI for
CEO and senior
management linked to
sustainability goals
12% IIC reduction1
2025
Low-carbongeneration
Customer-centricIndustrialUpstream ESG
Main business value growth and ESG KPIs and commitments
5.1
48

Delivery 2Q21
07.

50
Value-over-volume and better prices compensate lower production
Operational highlights – Upstream
Progress on 14 key projects in SP
Eagle Ford
Marcellus US
YME
Norway• Start-up in 3Q21. 17 kboed net in 2022
Progress on portfolio rationalization
(Kboe/d)
Production 2Q21 vs. 1Q21
• 2Q21 vs. 1Q21: -12% production +7% adjusted net income
• Lower than budget production mainly due to operational issues in
Peru LNG and delays in T&T projects
• 1H21 vs. 1H20: Higher realization prices and higher % of oil in
production mix
• Re-initiating drilling activity in 2H21
• 2 rigs in EF and 2 rigs in Marcellus
Spain Cessation of oil production
Russia Disposal of producing assets following sale
of 49% in AROG JV
Malaysia and Vietnam Divested position in Malaysia
and stake in Block 46 CN in Vietnam
New FIDs expected before year end
Shenzi North US GoM
Leon-Moccasin US GoM
Lapa SW Brazil
Akacias Colombia
Algeria Completed transfer of participation in TFT
51
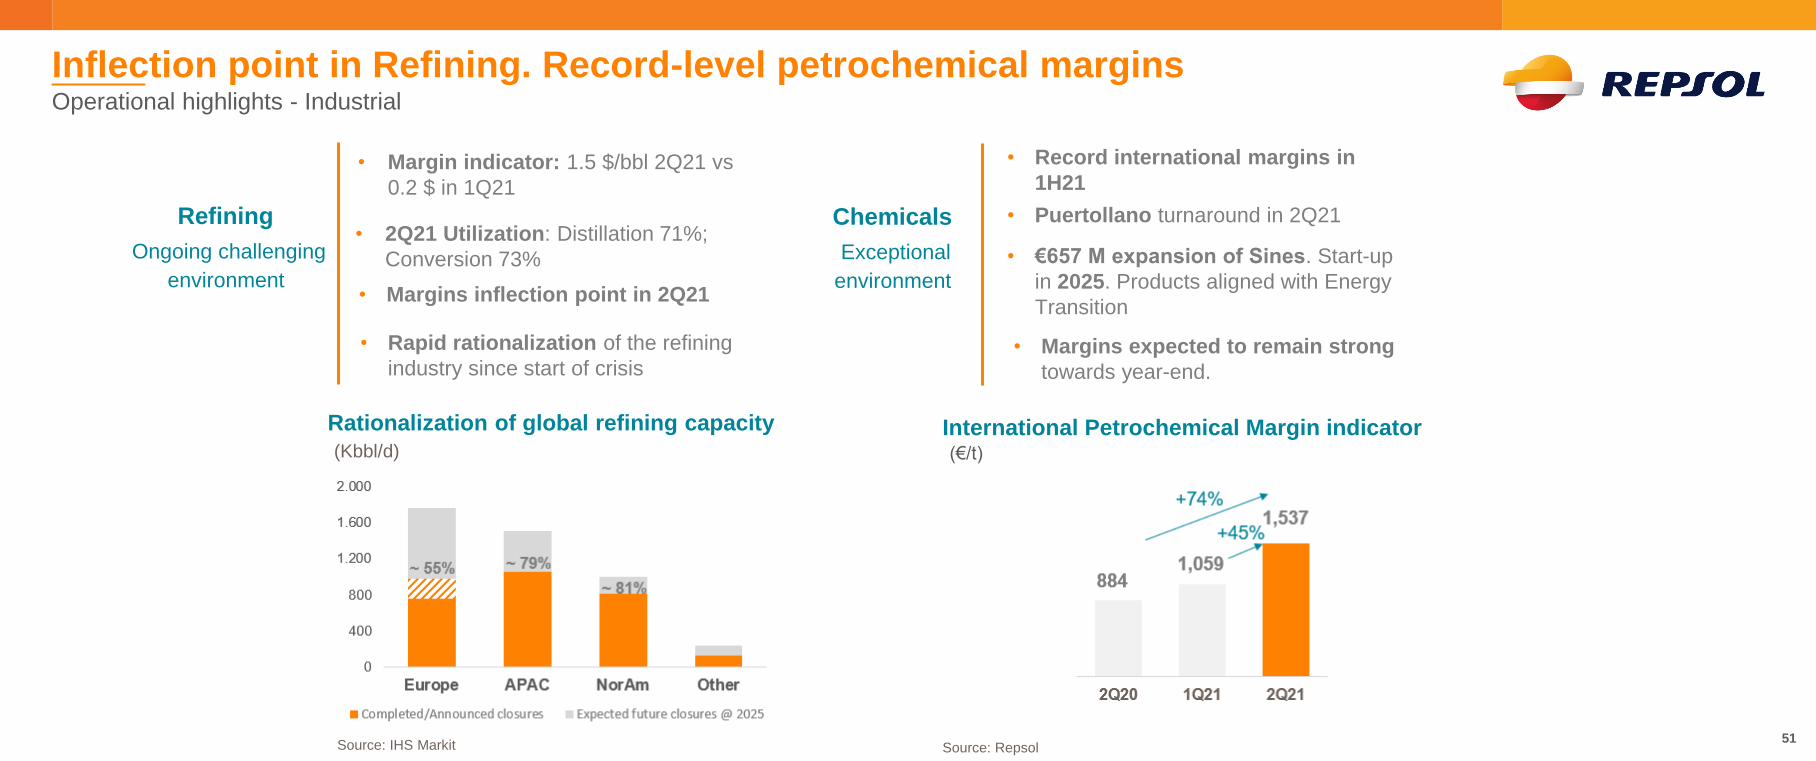
Inflection point in Refining. Record-level petrochemical marginsOperational highlights - Industrial
• Record international margins in
1H21
Ongoing challenging
environment
Refining
• Margins inflection point in 2Q21
International Petrochemical Margin indicator
• Rapid rationalization of the refining
industry since start of crisis
(€/t)
• Puertollano turnaround in 2Q21
Rationalization of global refining capacity
(Kbbl/d)
• Margin indicator: 1.5 $/bbl 2Q21 vs
0.2 $ in 1Q21
Exceptional
environment
Chemicals• 2Q21 Utilization: Distillation 71%;
Conversion 73% • €657 M expansion of Sines. Start-up
in 2025. Products aligned with Energy
Transition
• Margins expected to remain strong
towards year-end.
Source: IHS Markit Source: Repsol
52
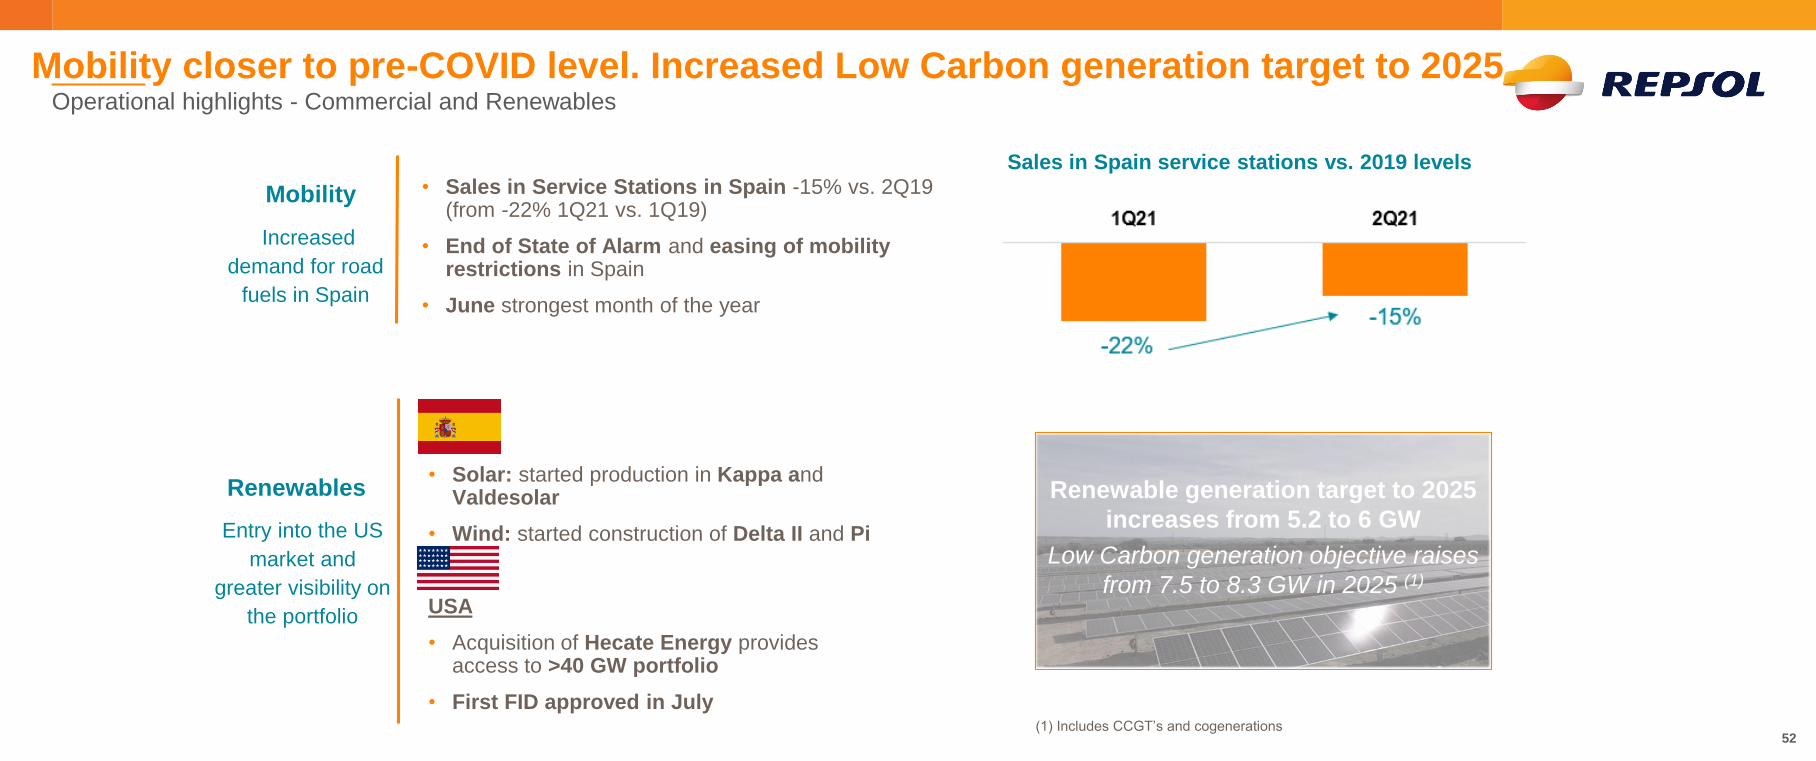
Mobility closer to pre-COVID level. Increased Low Carbon generation target to 2025Operational highlights - Commercial and Renewables
Mobility • Sales in Service Stations in Spain -15% vs. 2Q19 (from -22% 1Q21 vs. 1Q19)
• End of State of Alarm and easing of mobility restrictions in Spain
• June strongest month of the year
Sales in Spain service stations vs. 2019 levels
Renewables
Spain
• Solar: started production in Kappa and Valdesolar
• Wind: started construction of Delta II and Pi
USA
• Acquisition of Hecate Energy provides access to >40 GW portfolio
• First FID approved in July
Renewable generation target to 2025
increases from 5.2 to 6 GW
Low Carbon generation objective raises
from 7.5 to 8.3 GW in 2025 (1)
(1) Includes CCGT’s and cogenerations
Increased
demand for road
fuels in Spain
Entry into the US
market and
greater visibility on
the portfolio
53
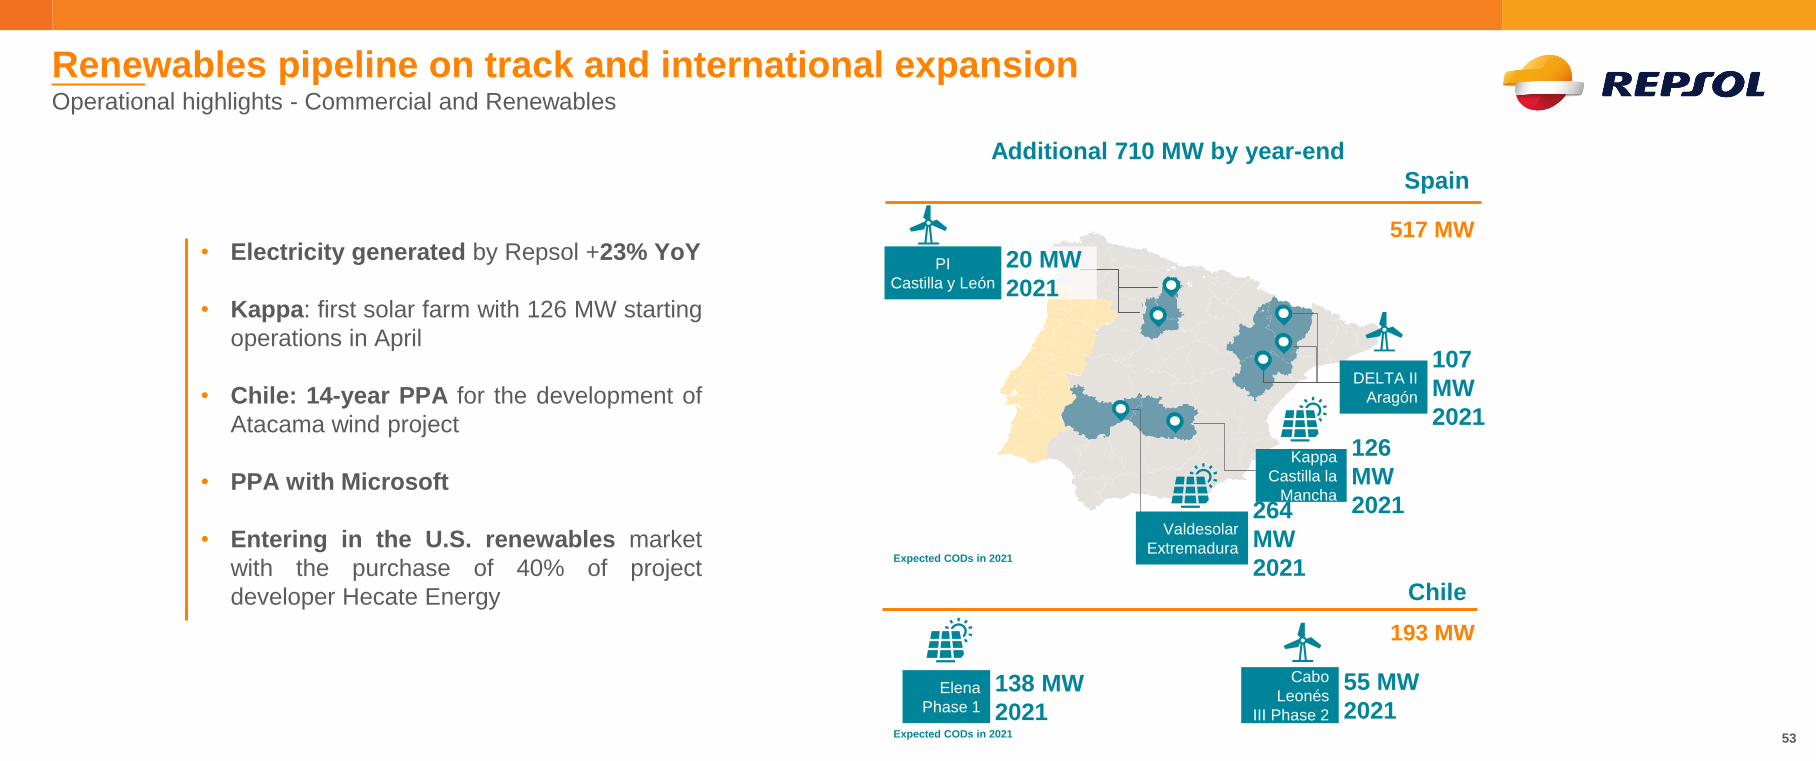
Renewables pipeline on track and international expansionOperational highlights - Commercial and Renewables
Expected CODs in 2021
• Electricity generated by Repsol +23% YoY
• Kappa: first solar farm with 126 MW starting
operations in April
• Chile: 14-year PPA for the development of
Atacama wind project
• PPA with Microsoft
• Entering in the U.S. renewables market
with the purchase of 40% of project
developer Hecate Energy
Additional 710 MW by year-end
20 MW
2021PI
Castilla y León
107
MW
2021
DELTA II
Aragón
126
MW
2021
Kappa
Castilla la
Mancha264
MW
2021
Valdesolar
Extremadura
138 MW
2021Elena
Phase 1
Chile
55 MW
2021
Cabo
Leonés
III Phase 2
Spain
517 MW
193 MW
Expected CODs in 2021

54
Improved outlook to the end of 2021 Outlook 2021
Net debt* ~ €6.1 Bn • 2020 closing net debt €6.8 B (hybrids transactions in 2021 €0.3 B)
Refining Margin Indicator
$2 /bbl
Production 590-600 kboed
EBITDA CCS ~ €6.1 Bn• + €0.3 B vs previous guidance
• ~ 50% higher than in 2020
Capex ~ €2.9 Bn• + €0.3 B (Low Carbon Platforms) vs. previous guidance
• Expected €0.3 B Upstream divestments
Dividend €0.6 /share • Dividend only in cash starting in July’21
Better macro environment supports higher EBITDA and lower Net Debt• Brent 65 $/bbl, HH 3.0 $/Mbtu
• Note: This outlook only considers agreed inorganic operations
• - 5% vs. previous guidance

55
Strong strategic delivery in improving macroeconomic scenarioConclusions
Increased renewable
generation ambition to 2025
Capital allocation options in
higher price scenario
• Accelerated investments in the Energy Transition
• Possibility to anticipate shareholder remuneration commitments
Progress in the transformation
of Industrial assets
• Expansion of Sines aligned with Energy Transition
• H2 ambition increased to 0.55 GW eq. in 2025 and 1.9 GW eq. in 2030 (2)
Repsol’s Low Carbon Day to be held on October 5th
2Q21 results at pre-pandemic
levels
• Adj. Net Income of €488 M 2Q21 vs. €497 M 2Q19
• Short term focus on capital discipline and cost efficiency
• Long term strategy driven by the Energy Transition
• Low Carbon generation objective increases from 7.5 to 8.3 GW (1)
• Higher visibility on the renewable portfolio following Hecate transaction
(1) Includes CCGT’s and cogenerations. Renewable generation target to 2025 increases from 5.2 to 6 GW (2) From 0.4 GW eq. in 2025 and 1.2 GW eq. in 2030 in SP
Driving growth and value
56
August 2021