
Embracing change, driving growth
92
Embracing change, driving growth home.kpmg/cn Hong Kong Banking Report 2021
Transcript of Embracing change, driving growth
Embracing change, driving growthhome.kpmg/cn
Hong Kong Banking Report 2021
2 | Hong Kong Banking Report 2021
ContentsIntroduction
Overview
ESG
Strengthening climate resilience and capacity building the next steps for green and sustainable banking
Greater alignment between financial crime compliance and ESG is the way forward
Transformation
More banks in Hong Kong will seek to adopt Regtech solutions as part of their regulatory-driven transformation journey
Facing revenue and cost pressure, banks are accelerating their transformation initiatives to adapt and grow
Wealth
Wealth Management Connect should be integral to banks’ overall digital and GBA strategies
Hong Kong’s status continues to grow as a key connector and international wealth management centre
Hong Kong as an IFC and connector
The increasing connectivity with mainland China provides a significant opportunity for banks in Hong Kong to expand onshore
4
6
17
18
21
23
24
26
29
30
32
34
35
© 2021 KPMG, a Hong Kong partnership and a member firm of the KPMG global organisation of independent member firms affiliated with KPMG International Limited, a private English company limited by guarantee. All rights reserved.

Hong Kong Banking Report 2021 | 3
Hong Kong remains a key springboard for mainland Chinese banks to achieve their global ambitions
With the growth opportunities clear, international banks are turning their GBA plans into reality
Regulation
Managing conduct in the digital sales world – a new challenge for banks
Regulatory areas of focus are shifting to combat new and emerging risks for banks in the new reality
Ongoing economic uncertainty and the increasing use of artificial intelligence calls for more robust model governance
With the end of LIBOR on the horizon, banks should accelerate their efforts to ready themselves for the transition
Imminent changes to operational taxes provide a significant opportunity for the industry to digitise, modernise and simplify processes
With Basel III reforms on the horizon, banks should accelerate their preparation for implementation
Financial highlights
About KPMG
Contact us
38
40
42
43
46
50
52
55
58
61
90
91
© 2021 KPMG, a Hong Kong partnership and a member firm of the KPMG global organisation of independent member firms affiliated with KPMG International Limited, a private English company limited by guarantee. All rights reserved. © 2021 KPMG, a Hong Kong partnership and a member firm of the KPMG global organisation of independent member firms affiliated with KPMG International Limited, a private English company limited by guarantee. All rights reserved.
4 | Hong Kong Banking Report 2021
In this year’s annual Banking Report, we review the financial results of banks in Hong Kong in 2020 and provide our outlook for the industry.
It is hard to assess the performance of banks in Hong Kong in 2020 without talking about the impact of Covid-19. While the pandemic has undoubtedly had a negative impact on Hong Kong’s economy, it has not caused a significant financial crisis. The banking sector in particular has emerged from the worst of the pandemic reasonably well. Regulatory measures over the last few years to improve capital strength and liquidity, as well as the general strength of banks’ balance sheets, have shown that the banking sector in Hong Kong remains resilient. We did not see a significant increase in credit losses, and there have not been any challenges around falling asset prices giving rise to misconduct claims. However, the banking sector saw a drop in revenue in 2020, which is largely attributed to decreasing net interest margins. This has had a notable impact on overall profitability, and we expect this trend to continue throughout the rest of 2021 and probably into 2022.
Notably, for the first time in 33 editions of our annual Hong Kong Banking Report we are delighted to feature a new category: virtual banks. This report analyses the results and key financial metrics of the eight virtual banks in Hong Kong and discusses their growth prospects. It is still too early to say who the market leaders might be, but the next 12 months will be critical for these new players to evolve and expand their offering to attract customers and start to show they have a sustainable future.
Our report also explores four key themes that we believe are going to have a significant impact on Hong Kong’s banking sector in the year ahead.
ESG: We continue to see a lot more industry focus on environmental, social and governance (ESG) issues in banking, and the Hong Kong Monetary Authority is becoming increasingly active in encouraging and mandating banks to incorporate ESG into their risk management frameworks. We are starting to see some banks commit to placing ESG at the core of their business, and offer more products and services that are ESG friendly. While there are still some challenges to overcome – such as setting a single global ESG standard – the increasing importance of ESG in banking and financial services more broadly is a trend that will be talked about for years to come.
Transformation: While many banks have spent years focussing on transformation in order to reduce costs, enhance customer experience and improve risk management and compliance, Covid-19 has really accelerated the pace of development and execution. The pandemic has dramatically increased awareness among banks of using operating costs as a key lever to maintain profitability, especially in an environment where interest revenue growth is likely to be subdued for the foreseeable future.
Introduction
Paul McSheaffreyPartner, Financial ServicesKPMG China
© 2021 KPMG, a Hong Kong partnership and a member firm of the KPMG global organisation of independent member firms affiliated with KPMG International Limited, a private English company limited by guarantee. All rights reserved.
Hong Kong Banking Report 2021 | 5
Furthermore, corporate and individual customers alike are demanding better and speedier services, more straight through processing and less manual intervention, all of which require transformation to systems and processes.
Wealth: Amid a prolonged low interest rate environment, many banks are exploring how to shift their reliance on interest income to a greater focus on fee-earning activities. There is an increasing focus on wealth management opportunities in Asia, which is unsurprising given the surge in new wealth and a burgeoning middle class in the region, especially in mainland China. Hong Kong has a key role to play as an international financial and asset management centre, as outlined in the 14th Five-Year Plan and the Development Plan for the Greater Bay Area (GBA). We are seeing a number of developments in this space, with international private banks and wealth managers seeking to use Hong Kong as a springboard to expand onshore in mainland China, Chinese banks setting up wealth management arms in Hong Kong, and emerging virtual bank and wealthtech players seeking to service retail investors. Furthermore, the imminent launch of the GBA Wealth Management Connect is a key opportunity for the banking sector. While the scheme will initially provide simple investment products aimed at mass affluent clients, a successful rollout could signal further opportunities in the future that could benefit wealthier segments.
Hong Kong as an international financial centre and connector: Tied to the wealth opportunity is a reaffirmation of Hong Kong’s role as a key connector and conduit for capital flowing into and out of mainland China. We continue to see both international and Chinese banks seeking to set up operations in Hong Kong to benefit from the city’s deep talent pool, diverse business community and investor base, and fair and transparent regulatory regime. Many of these banks also continue to use Hong Kong as a launchpad to set up an onshore mainland China business.
Overall, despite ongoing pressure on revenue and profitability, Hong Kong’s banking sector remains resilient and is showing signs of recovery from the effects of the pandemic. Investment is on the rise, with a number of banks announcing plans to increase headcount in client facing areas in Hong Kong, particularly in wealth management and private banking. However, the growth of the banking sector is reliant on the growth of overall economic activity in Hong Kong, which will ultimately be dependent on the success of its vaccine rollout and how quickly the city can open up its borders to mainland China and the rest of the world.
I hope you enjoy our perspective on the sector in 2021, and would welcome the opportunity to discuss the banking results and the current industry landscape.
© 2021 KPMG, a Hong Kong partnership and a member firm of the KPMG global organisation of independent member firms affiliated with KPMG International Limited, a private English company limited by guarantee. All rights reserved. © 2021 KPMG, a Hong Kong partnership and a member firm of the KPMG global organisation of independent member firms affiliated with KPMG International Limited, a private English company limited by guarantee. All rights reserved.
1 2020 Economic Background and 2021 Prospects, p.23 https://www.hkeconomy.gov.hk/en/pdf/er_20q4.pdf2 HKMA Annual Report, p.5, https://www.hkma.gov.hk/media/eng/publication-and-research/annual-report/2020/AR2020_E.pdf
6 | Hong Kong Banking Report 2021
Overview
Hong Kong’s banking sector showed its resilience in 2020 despite a challenging year for the overall economy. The global economic slowdown triggered by the Covid-19 pandemic contributed to a weakening of Hong Kong’s economy, which contracted by 6.1 percent from 20201 (compared to a 1.2 percent contraction in 2019).
Despite this, Hong Kong’s banking sector continued to see growth in its overall balance sheet in 2020. Deposits grew and the total assets of all licensed banks expanded by 8.8 percent to HK$22.9 trillion, with growth of 3.4 percent in loans and advances. However, it was not all positive news. Consistent with our prediction in our 2020 Hong Kong Banking Report, operating profit before impairment charges for all licensed banks decreased by 19.3 percent from HK$287 billion in 2019 to HK$232 billion in 2020. We anticipate that the combination of a prolonged low interest rate environment and economic uncertainty, principally due to the pandemic, will continue to negatively impact the profitability of the banking sector in 2021.
After the US Federal Reserve (the Fed) cut rates to 0.25 percent on 15 March 2020, the Federal Funds Rate remained low throughout 2020. This impacted the net interest margin (NIM) for all licensed banks, which decreased by 41 basis points in 2020.
All of the eight virtual banks which have been granted a licence by the Hong Kong Monetary Authority (HKMA) have now commenced operations in Hong Kong.2 Although they were all loss-making in 2020, they have invested a significant amount in their proposition to consumers in Hong Kong. It is too early to say which of the virtual banks will be successful in the short term – we expect that the virtual banks will continue to introduce new products and services to customers and in twelve months’ time we may have a clearer view of the winners from this exciting new segment. It will not be easy for these new entrants as traditional banks have responded with enhanced digital offerings for their customers, which indicates that competition in retail banking in Hong Kong is only going to get fiercer.
Paul McSheaffreyPartner, Financial ServicesKPMG China
Terence FongPartner, Head of Chinese Banks, Hong KongKPMG China
© 2021 KPMG, a Hong Kong partnership and a member firm of the KPMG global organisation of independent member firms affiliated with KPMG International Limited, a private English company limited by guarantee. All rights reserved.
3 The analysis is based on financial institutions registered with the Hong Kong Monetary Authority.
4 The top 10 locally incorporated licensed banks mentioned in this article are the 10 banks with highest total assets among all locally incorporated licensed banks as at 31 December 2020.
5 NIM is either quoted from public announcements of financial statements, or calculated based on annualised net interest income and interest-bearing assets or total assets, depending on the availability of information.
6 Hang Seng Annual Report 2020, p.17 https://vpr.hkma.gov.hk/statics/assets/doc/100057/ar_20/ar_20_eng.pdf
7 Nanyang Annual Report 2020, p.245 https://vpr.hkma.gov.hk/statics/assets/doc/100060/ar_20/ar_20.pdf
Hong Kong Banking Report 2021 | 7
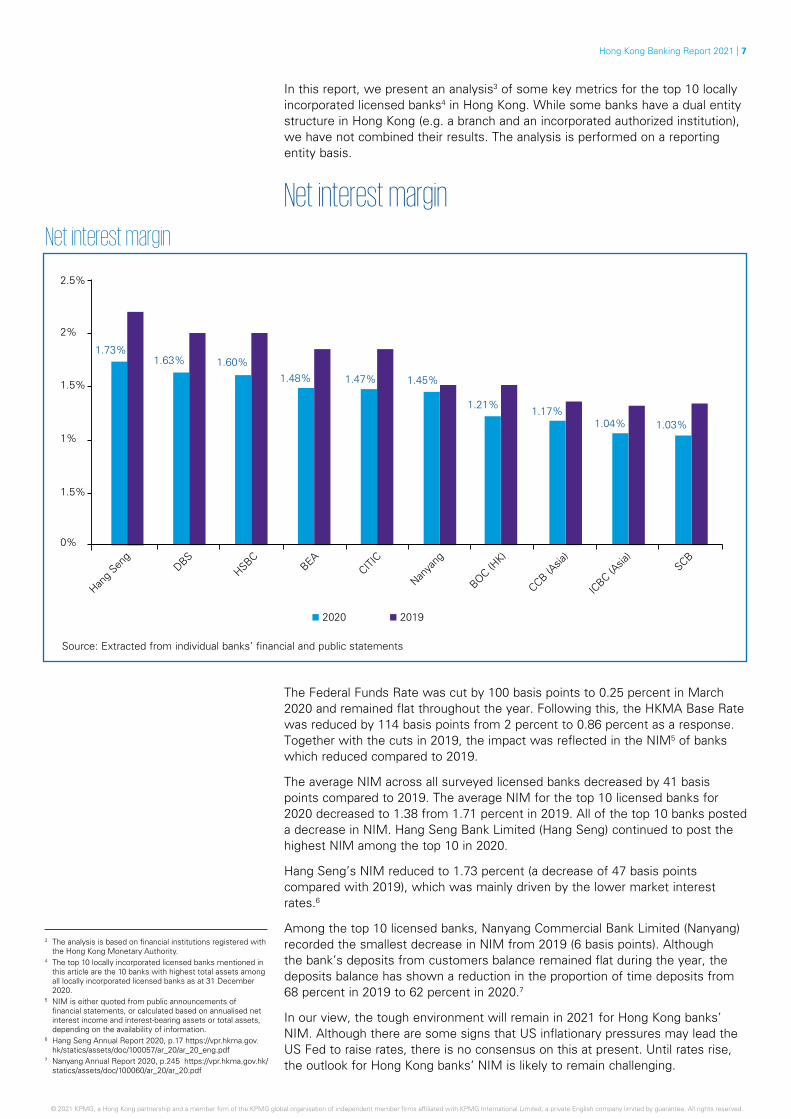
In this report, we present an analysis3 of some key metrics for the top 10 locally incorporated licensed banks4 in Hong Kong. While some banks have a dual entity structure in Hong Kong (e.g. a branch and an incorporated authorized institution), we have not combined their results. The analysis is performed on a reporting entity basis.
Net interest margin
0%
1%
2%
1.5%
1.5%
2.5%
1.73%1.63% 1.60%
1.48% 1.47% 1.45%
1.21%1.17%
1.03%1.04%
Hang
Seng
DBSHSBC
BEA
Nanya
ngCITI
C
BOC (HK)
ICBC (A
sia)
CCB (Asia
)SCB
2020 2019
Source: Extracted from individual banks’ financial and public statements
The Federal Funds Rate was cut by 100 basis points to 0.25 percent in March 2020 and remained flat throughout the year. Following this, the HKMA Base Rate was reduced by 114 basis points from 2 percent to 0.86 percent as a response. Together with the cuts in 2019, the impact was reflected in the NIM5 of banks which reduced compared to 2019.
The average NIM across all surveyed licensed banks decreased by 41 basis points compared to 2019. The average NIM for the top 10 licensed banks for 2020 decreased to 1.38 from 1.71 percent in 2019. All of the top 10 banks posted a decrease in NIM. Hang Seng Bank Limited (Hang Seng) continued to post the highest NIM among the top 10 in 2020.
Hang Seng’s NIM reduced to 1.73 percent (a decrease of 47 basis points compared with 2019), which was mainly driven by the lower market interest rates.6
Among the top 10 licensed banks, Nanyang Commercial Bank Limited (Nanyang) recorded the smallest decrease in NIM from 2019 (6 basis points). Although the bank’s deposits from customers balance remained flat during the year, the deposits balance has shown a reduction in the proportion of time deposits from 68 percent in 2019 to 62 percent in 2020.7
In our view, the tough environment will remain in 2021 for Hong Kong banks’ NIM. Although there are some signs that US inflationary pressures may lead the US Fed to raise rates, there is no consensus on this at present. Until rates rise, the outlook for Hong Kong banks’ NIM is likely to remain challenging.
Net interest margin
© 2021 KPMG, a Hong Kong partnership and a member firm of the KPMG global organisation of independent member firms affiliated with KPMG International Limited, a private English company limited by guarantee. All rights reserved. © 2021 KPMG, a Hong Kong partnership and a member firm of the KPMG global organisation of independent member firms affiliated with KPMG International Limited, a private English company limited by guarantee. All rights reserved.
8 | Hong Kong Banking Report 2021
CostsCost-to-income ratios
0%
10%
20%
30%
40%
50%
60%
70%
28.04% 29.91%
36.30% 36.61%40.62%
44.23%
49.78% 50.61%
65.47%
51.78%
ICBC (A
sia)
BOC (HK)
Nanya
ng
Hang
Seng
DBS
CCB (Asia
)
CITIC
BEAHSBC
SCB
2020 2019
Source: Extracted from individual banks’ financial and public statements
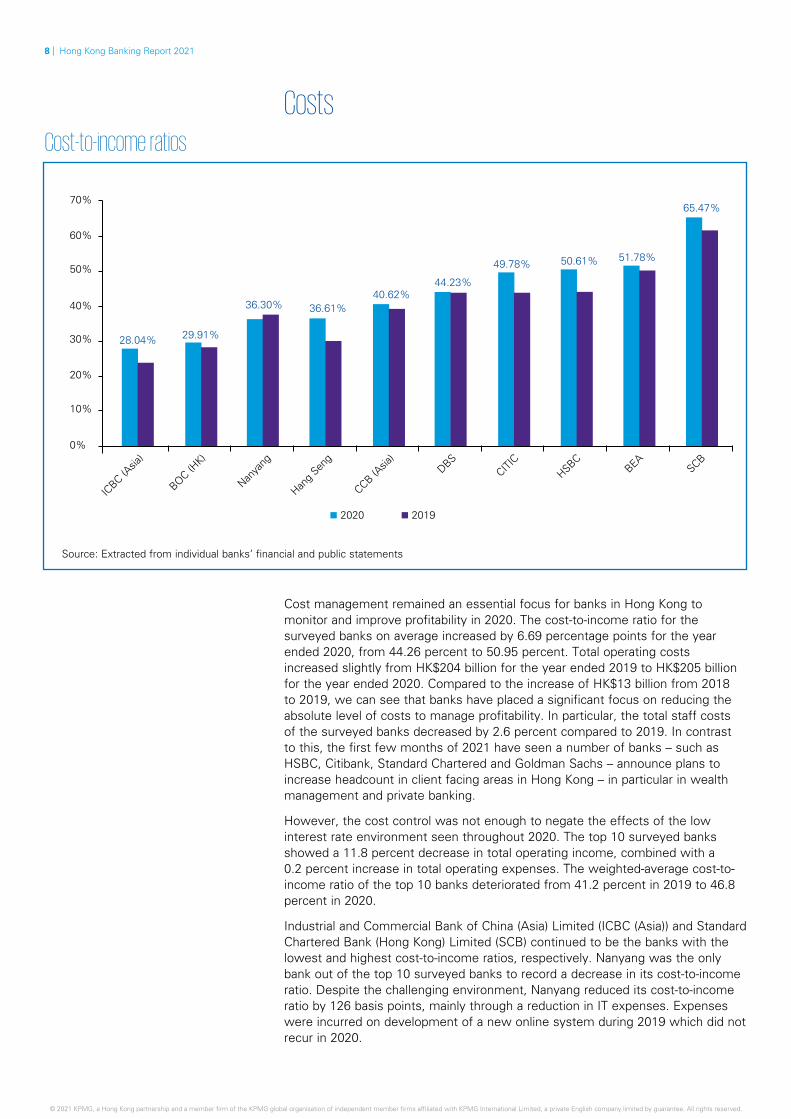
Cost management remained an essential focus for banks in Hong Kong to monitor and improve profitability in 2020. The cost-to-income ratio for the surveyed banks on average increased by 6.69 percentage points for the year ended 2020, from 44.26 percent to 50.95 percent. Total operating costs increased slightly from HK$204 billion for the year ended 2019 to HK$205 billion for the year ended 2020. Compared to the increase of HK$13 billion from 2018 to 2019, we can see that banks have placed a significant focus on reducing the absolute level of costs to manage profitability. In particular, the total staff costs of the surveyed banks decreased by 2.6 percent compared to 2019. In contrast to this, the first few months of 2021 have seen a number of banks – such as HSBC, Citibank, Standard Chartered and Goldman Sachs – announce plans to increase headcount in client facing areas in Hong Kong – in particular in wealth management and private banking.
However, the cost control was not enough to negate the effects of the low interest rate environment seen throughout 2020. The top 10 surveyed banks showed a 11.8 percent decrease in total operating income, combined with a 0.2 percent increase in total operating expenses. The weighted-average cost-to-income ratio of the top 10 banks deteriorated from 41.2 percent in 2019 to 46.8 percent in 2020.
Industrial and Commercial Bank of China (Asia) Limited (ICBC (Asia)) and Standard Chartered Bank (Hong Kong) Limited (SCB) continued to be the banks with the lowest and highest cost-to-income ratios, respectively. Nanyang was the only bank out of the top 10 surveyed banks to record a decrease in its cost-to-income ratio. Despite the challenging environment, Nanyang reduced its cost-to-income ratio by 126 basis points, mainly through a reduction in IT expenses. Expenses were incurred on development of a new online system during 2019 which did not recur in 2020.
© 2021 KPMG, a Hong Kong partnership and a member firm of the KPMG global organisation of independent member firms affiliated with KPMG International Limited, a private English company limited by guarantee. All rights reserved.
8 HSBC Annual Report and Accounts 2020, p.11 9 HSBC Annual Report and Accounts 2020, p.8910 SCB Directors’ Report and Consolidated Financial
Statements, p.52 https://vpr.hkma.gov.hk/statics/assets/doc/100269/ar_20/ar_20_eng.pdf
Hong Kong Banking Report 2021 | 9
Hongkong and Shanghai Banking Corporation Limited (HSBC) recorded the largest increase in cost-to-income ratio among the top 10 banks – from 42.62 percent in 2019 to 50.61 percent in 2020. The increase was attributed to lower total operating income. Total operating income was driven by a decrease in net interest income in Hong Kong due to narrower customer deposit spreads and lower reinvestment yields as market interest rates decreased.8 In addition to the adverse movement in net interest income, the drop in other operating income was also a contributing factor, which was driven by the less favourable movement in the present value of in-force long-term insurance business, and from the unfavourable revaluation on investment properties.9
SCB remains the only bank with a cost-to-income ratio exceeding 60 percent. While most of the operating expenses were invested in Retail Banking, Private Banking is the client segment with the highest cost-to-income ratio, at 78 percent, although it showed a slight drop from 79 percent in 2019. Corporate & Institutional Banking performed the best in this area with the ratio at 48.96 percent, an improvement from 50.63 percent in 2019.10
Loans and advancesLoans
0
1,000
500
1,500
2,000
2,500
3,000
3,500
4,000 3,698
1,507
1,097950
514 470284 280 198220
HSBC
BOC (HK)
SCB
Hang
Seng
ICBC (A
sia)
BEA
CCB (Asia
)
CITIC
Nanya
ngDBS
2020 2019
Source: Extracted from individual banks’ financial and public statements
HK$ bn
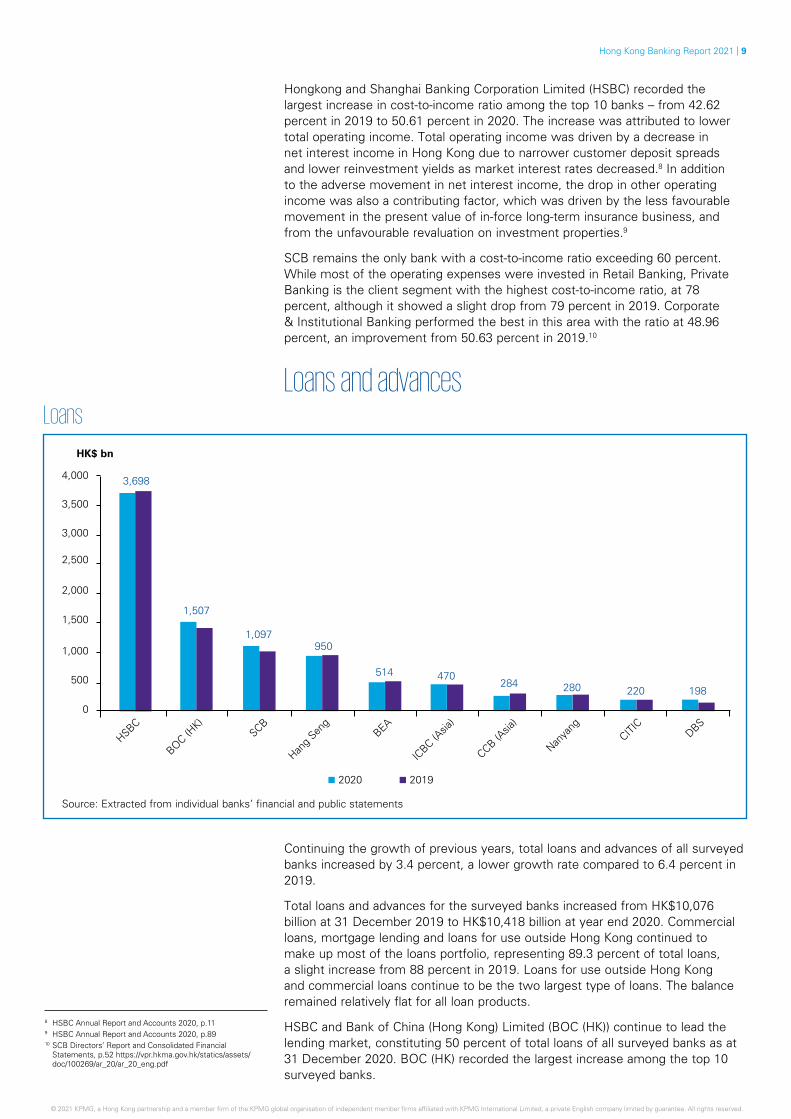
Continuing the growth of previous years, total loans and advances of all surveyed banks increased by 3.4 percent, a lower growth rate compared to 6.4 percent in 2019.
Total loans and advances for the surveyed banks increased from HK$10,076 billion at 31 December 2019 to HK$10,418 billion at year end 2020. Commercial loans, mortgage lending and loans for use outside Hong Kong continued to make up most of the loans portfolio, representing 89.3 percent of total loans, a slight increase from 88 percent in 2019. Loans for use outside Hong Kong and commercial loans continue to be the two largest type of loans. The balance remained relatively flat for all loan products.
HSBC and Bank of China (Hong Kong) Limited (BOC (HK)) continue to lead the lending market, constituting 50 percent of total loans of all surveyed banks as at 31 December 2020. BOC (HK) recorded the largest increase among the top 10 surveyed banks.
© 2021 KPMG, a Hong Kong partnership and a member firm of the KPMG global organisation of independent member firms affiliated with KPMG International Limited, a private English company limited by guarantee. All rights reserved. © 2021 KPMG, a Hong Kong partnership and a member firm of the KPMG global organisation of independent member firms affiliated with KPMG International Limited, a private English company limited by guarantee. All rights reserved.
11 DBS Annual Report 2020, p.41 https://vpr.hkma.gov.hk/statics/assets/doc/100034/ar_20/ar_20_eng.pdf12 HSBC Annual Report and Accounts 2020, p.13 13 BOC Hong Kong (Holdings) Limited Annual Report 2020, p.28 https://www.bochk.com/dam/bochk/desktop/top/aboutus/ir/docs/
finreport/bochkholdings/2020ar/e101_Fullset.pdf14 CCBA Annual Report 2020, p.96 https://vpr.hkma.gov.hk/statics/assets/doc/100015/ar_20/ar_20_eng.pdf
10 | Hong Kong Banking Report 2021
Among the top 10 surveyed banks, gross loans and advances increased from HK$8,982 billion to HK$9,218 billion. This growth of 2.6 percent has slowed down compared to 5.7 percent in 2019. Eight out of the top 10 surveyed banks recorded an expansion in their loan portfolio.
After experiencing loan contraction in 2019, DBS Bank (Hong Kong) Limited (DBS) showed the largest percentage growth in 2020. The gross loans of DBS increased by 25.2 percent, from HK$158 billion to HK$198 billion. The increase was mainly from building and construction loan usage.11
HSBC’s gross loans and advances decreased by 1.1 percent to HK$3,698 billion.12 The overall loan balances for HSBC’s Hong Kong operations remained stable with a decrease in commercial lending offset by an increase in residential mortgages. BOC (HK)’s gross loans and advances increased by 6.4 percent to HK$1,507 billion, with the increase mainly from lending to individuals driven by growth in residential mortgage loans.13
China Construction Bank (Asia) Corporation Limited (CCB (Asia)) also experienced a contraction in loan balances in 2020. The decrease was largely driven by the contraction of loans to corporate customers.14
Covid-19 has clearly affected underlying economic activity. However, with the introduction and continued rollout of vaccines, we expect that economic activity could increase in the second half of 2021 compared to 2020. Increased economic activity will ultimately be dependent on how quickly Hong Kong can open its borders to mainland China and the rest of the world.
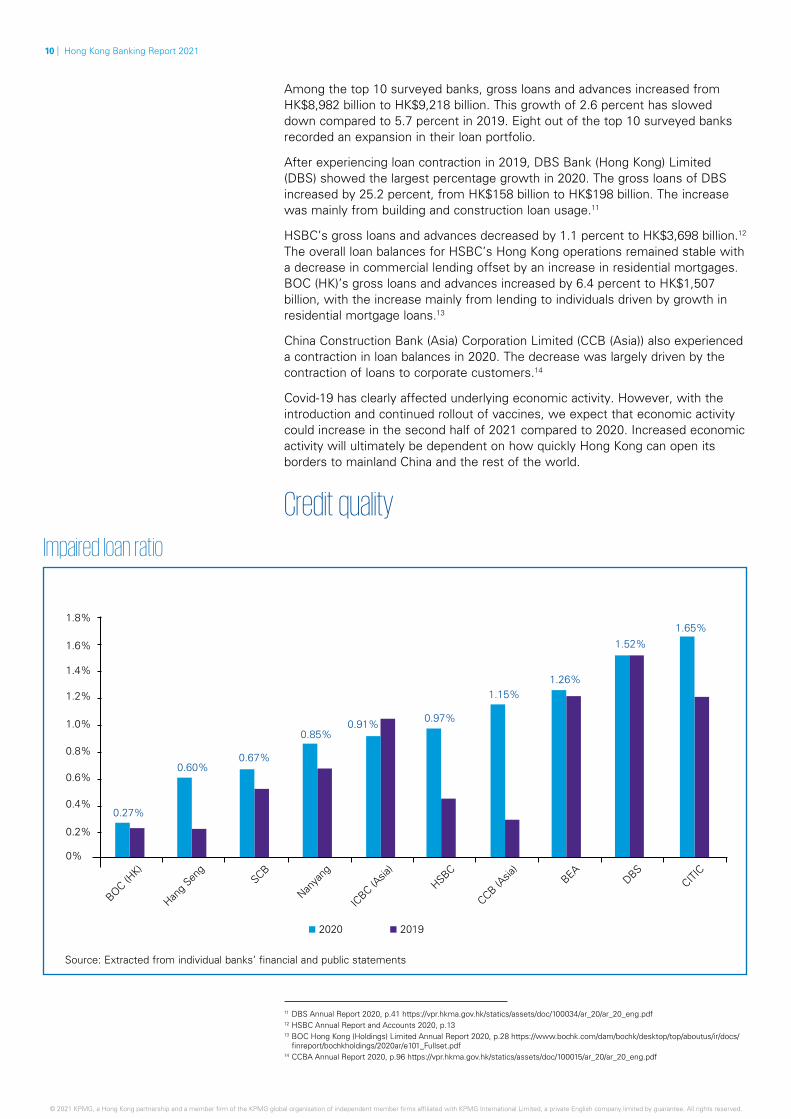
Credit quality
Impaired loan ratio
0%
0.2%
0.4%
0.6%
0.8%
1.0%
1.2%
1.4%
1.6%
1.8%
BOC (HK)
Hang
Seng
SCB
Nanya
ngHSBC
ICBC (A
sia)
CCB (Asia
)DBS
BEACITI
C
2020 2019
0.27%
0.60%
0.85%
1.52%
0.67%
0.91% 0.97%
1.15%1.26%
1.65%
Source: Extracted from individual banks’ financial and public statements
© 2021 KPMG, a Hong Kong partnership and a member firm of the KPMG global organisation of independent member firms affiliated with KPMG International Limited, a private English company limited by guarantee. All rights reserved.
15 Impaired loan ratio is calculated as impaired loans and advances divided by gross loans and advances to customers.16 BOC Hong Kong (Holdings) Limited Annual Report 2020, p.4117 ICBC (Asia) Annual Report 2020, p.34 https://vpr.hkma.gov.hk/statics/assets/doc/100077/ar_20/ar_20.pdf18 CITIC Annual Report 2020, p.14 https://vpr.hkma.gov.hk/statics/assets/doc/100040/ar_20/ar_20.pdf19 HSBC Annual Report and Accounts 2020, p.4020 2020 Economic Background and 2021 Prospects, p.23 https://www.hkeconomy.gov.hk/en/pdf/er_20q4.pdf
Hong Kong Banking Report 2021 | 11
Amid global economic uncertainty, credit quality deteriorated significantly in 2020 among the surveyed licensed banks. The impaired loan ratio15 for Hong Kong’s banks worsened by 21 basis points from 0.5 percent to 0.71 percent.
For the top 10 surveyed banks, China CITIC Bank International Ltd (CITIC) and BOC (HK) recorded the highest and lowest impaired loan ratio in 2020, respectively. The impaired loan ratio of CITIC was 1.65% as at the end of 2020, up from 1.2 percent in 2019.
BOC (HK) had the lowest impaired loan ratio in 2020 among the top 10 surveyed banks. Asset quality remained benign through enhancement of the bank’s risk monitoring and alert mechanisms to reduce risks in key industries, customers and businesses to reduce new non-performing loans.16 Hang Seng downgraded several corporate loans which resulted in the ratio increasing by 38 basis points.
ICBC (Asia) was the only one of the top 10 surveyed banks to show improvement, with its impaired loan ratio reducing by 13 basis points. Its credit quality reflected a large improvement from 2019. Credit quality remained stable as the bank focused on creditworthiness of borrowers.17
CITIC, CCB (Asia) and HSBC all recorded an increase in their impaired loan ratio of more than 40 basis points. For CITIC, the impaired loan balances increased due to the downgrading of isolated large-size loan exposures.18 For CCB (Asia), the deterioration in credit quality was mainly due to an increase in impaired loan balances, leading to an increase of its impaired loan ratio from 0.29 percent to 1.15 percent. For HSBC, the impaired loan balance increase was mainly from loans to the corporate and commercial sector.19
While there is still uncertainty arising from the Covid-19 pandemic, we remain cautious about the credit quality of Hong Kong banks’ loan portfolio. The introduction of the Pre-approved Principal Payment Holiday Scheme in April 2020 provided immediate relief to corporate borrowers with participating banks pre-approving the deferment of loan principal repayments for up to 6 months and trade loans repayment by 90 days. The scheme was extended for a further year to October 2021.
The HKMA has forecast the Hong Kong economy to grow by 3.5 percent to 5.5 percent in 2021, compared with the record contraction of 6.1% in 2020. The consumer price inflation is forecast to be 1% in 2021, dropping from 1.3% in 2020.20 We expect that banks will focus on closely monitoring their loans’ credit quality to avoid any further impact from macroeconomic changes.
In our view, while the pandemic weighed heavily on the economy, the banking sector remained resilient. There could be a negative impact on impaired loans when customers resume normal repayment after the expiry of the Pre-approved Principal Payment Holiday Scheme which may not impact impaired loan figures until later in 2021 or early 2022. However, anecdotal discussions with banks indicate that the volume of loans taking advantage of the scheme is modest and so the impact is not likely to bring significant stress to the sector. In addition, if there is good news on the opening of borders in 2021, this will bring a favourable impact to the local economy as business returns to normal. We can expect the global economy to grow in 2021, especially in China where the economy grew in the first quarter of 2021 compared to last year.
© 2021 KPMG, a Hong Kong partnership and a member firm of the KPMG global organisation of independent member firms affiliated with KPMG International Limited, a private English company limited by guarantee. All rights reserved. © 2021 KPMG, a Hong Kong partnership and a member firm of the KPMG global organisation of independent member firms affiliated with KPMG International Limited, a private English company limited by guarantee. All rights reserved.
21 See Page 88 for the full Virtual Bank Financial Highlights22 https://mox.com/media/introducing-the-mox-card-with-credit-
to-existing-customers/ 23 https://www.airstarbank.com/corporate/en-hk/
12 | Hong Kong Banking Report 2021
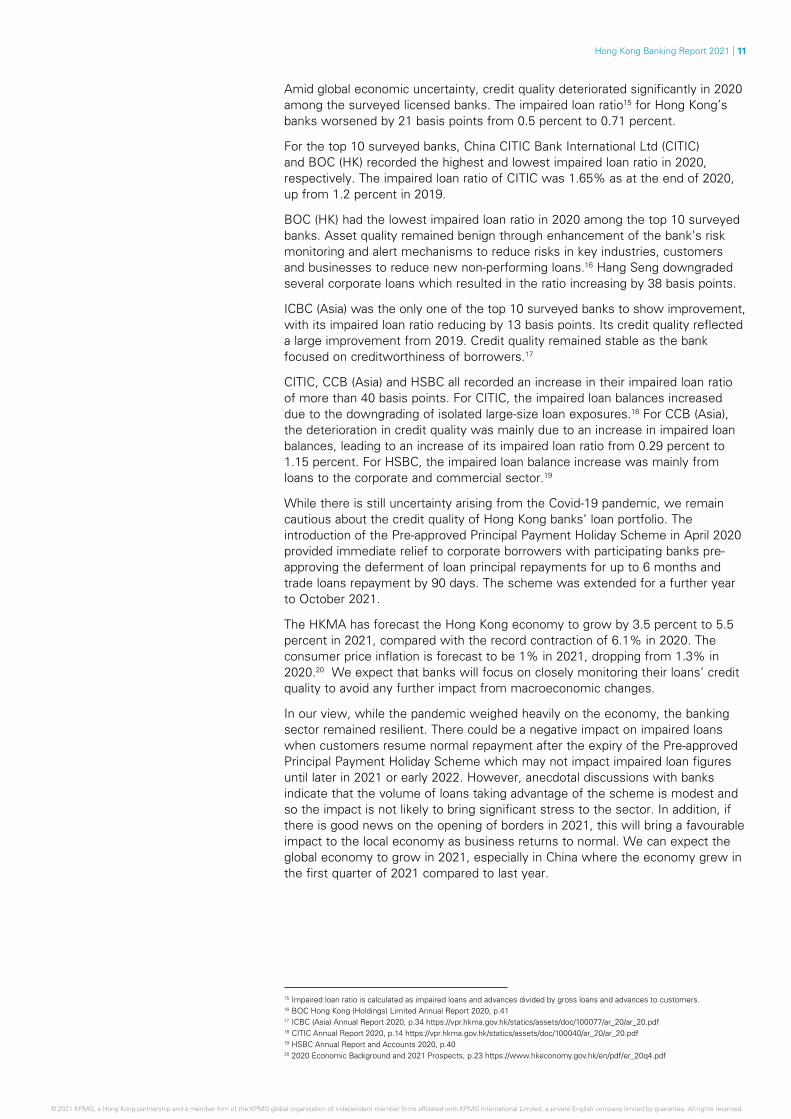
Assessing the initial impact and growth prospects of virtual banksAfter receiving their licences in 2019, Hong Kong’s eight virtual banks began operations in 2020 amid somewhat muted fanfare due to the Covid-19 pandemic. While most of these banks have been operating for less than a year, their latest financial results provide an indication of their initial progress and growth prospects going forward.
Steve CheungPartner, Financial ServicesKPMG China
Figure 1: Hong Kong’s virtual banks Virtual bank Launch date
ZA Bank March 2020Airstar Bank June 2020WeLab Bank July 2020
Livi VB August 2020Mox Bank September 2020Ant Bank September 2020
Ping An OneConnect Bank September 2020Fusion Bank December 2020
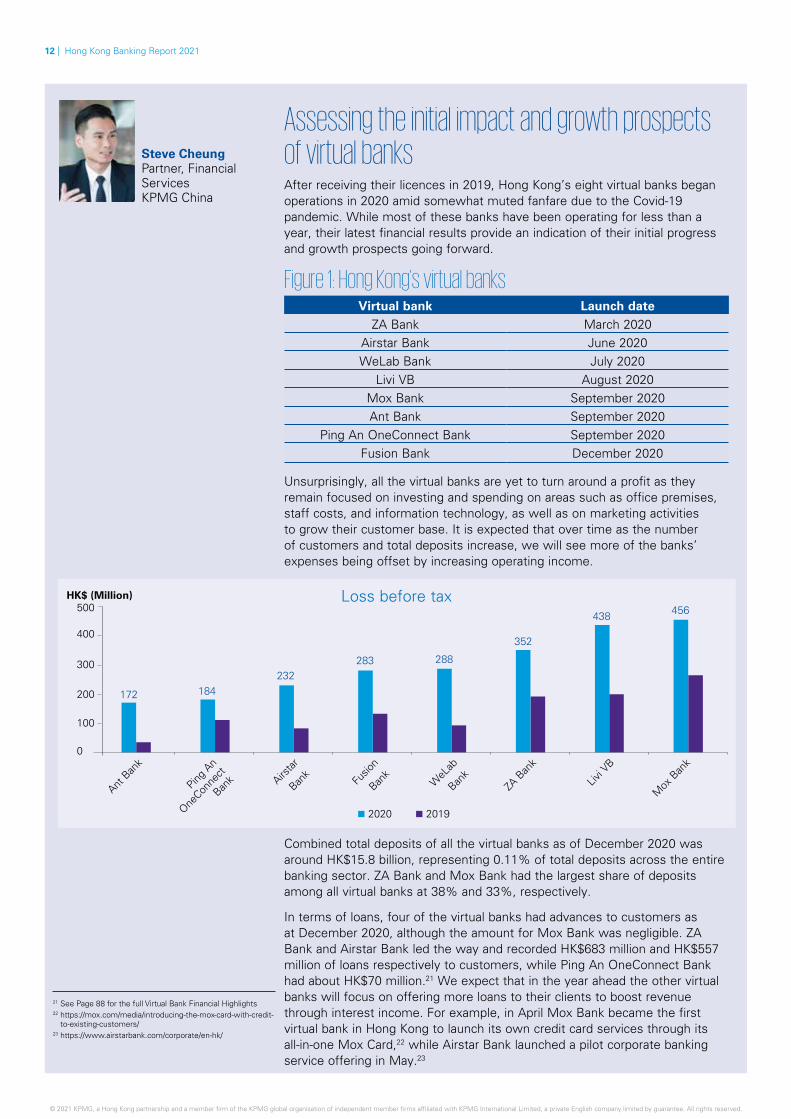
Unsurprisingly, all the virtual banks are yet to turn around a profit as they remain focused on investing and spending on areas such as office premises, staff costs, and information technology, as well as on marketing activities to grow their customer base. It is expected that over time as the number of customers and total deposits increase, we will see more of the banks’ expenses being offset by increasing operating income.
Loss before tax
0
100
200
300
400
500
Ant B
ank
Ping A
n
OneCon
nect
Bank Airs
tar
Bank
Fusio
n
Bank
ZA B
ank
WeL
ab
Bank
Livi V
B
Mox
Ban
k
2020 2019
184232
283 288
352
438 456
172
HK$ (Million)
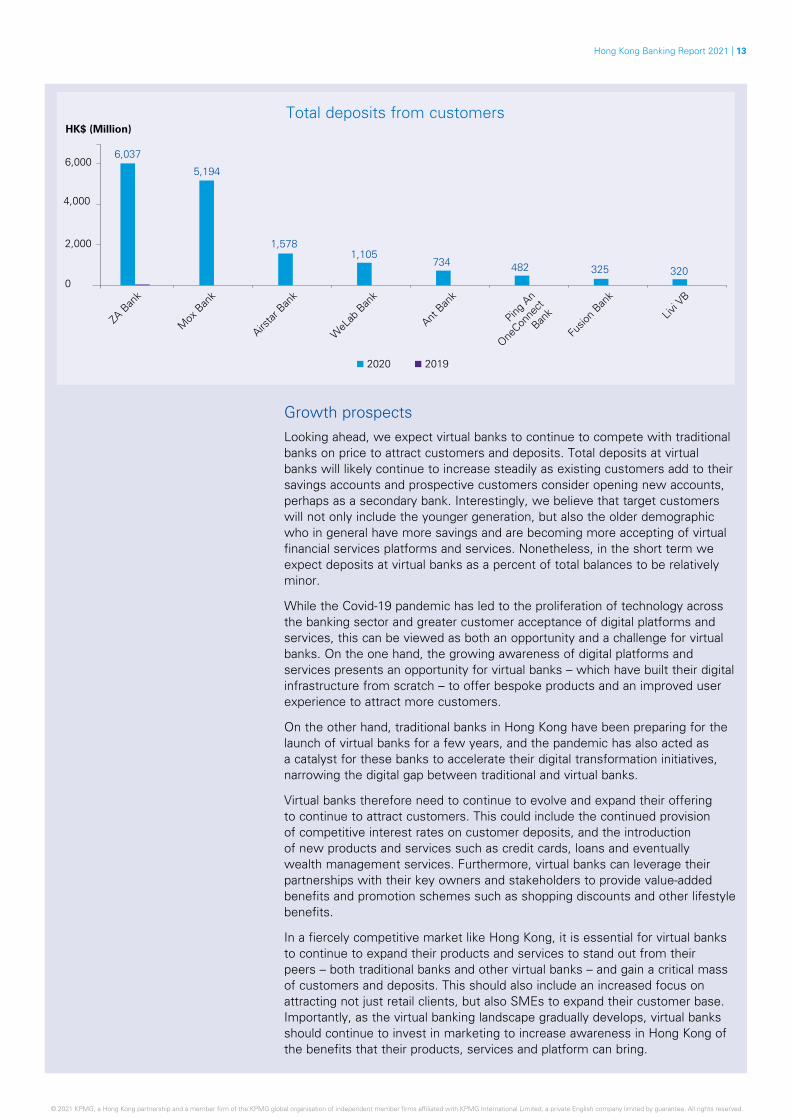
Combined total deposits of all the virtual banks as of December 2020 was around HK$15.8 billion, representing 0.11% of total deposits across the entire banking sector. ZA Bank and Mox Bank had the largest share of deposits among all virtual banks at 38% and 33%, respectively.
In terms of loans, four of the virtual banks had advances to customers as at December 2020, although the amount for Mox Bank was negligible. ZA Bank and Airstar Bank led the way and recorded HK$683 million and HK$557 million of loans respectively to customers, while Ping An OneConnect Bank had about HK$70 million.21 We expect that in the year ahead the other virtual banks will focus on offering more loans to their clients to boost revenue through interest income. For example, in April Mox Bank became the first virtual bank in Hong Kong to launch its own credit card services through its all-in-one Mox Card,22 while Airstar Bank launched a pilot corporate banking service offering in May.23
© 2021 KPMG, a Hong Kong partnership and a member firm of the KPMG global organisation of independent member firms affiliated with KPMG International Limited, a private English company limited by guarantee. All rights reserved.
Hong Kong Banking Report 2021 | 13
Total deposits from customers
0
2,000
4,000
6,000
ZA B
ank
Mox
Ban
k
Airstar
Ban
k
WeL
ab B
ank
Ping A
n
OneCon
nect
Bank
Ant B
ank
Fusio
n Ban
k
Livi V
B
2020 2019
5,194
1,5781,105
734 482 325 320
6,037
HK$ (Million)
Growth prospectsLooking ahead, we expect virtual banks to continue to compete with traditional banks on price to attract customers and deposits. Total deposits at virtual banks will likely continue to increase steadily as existing customers add to their savings accounts and prospective customers consider opening new accounts, perhaps as a secondary bank. Interestingly, we believe that target customers will not only include the younger generation, but also the older demographic who in general have more savings and are becoming more accepting of virtual financial services platforms and services. Nonetheless, in the short term we expect deposits at virtual banks as a percent of total balances to be relatively minor.
While the Covid-19 pandemic has led to the proliferation of technology across the banking sector and greater customer acceptance of digital platforms and services, this can be viewed as both an opportunity and a challenge for virtual banks. On the one hand, the growing awareness of digital platforms and services presents an opportunity for virtual banks – which have built their digital infrastructure from scratch – to offer bespoke products and an improved user experience to attract more customers.
On the other hand, traditional banks in Hong Kong have been preparing for the launch of virtual banks for a few years, and the pandemic has also acted as a catalyst for these banks to accelerate their digital transformation initiatives, narrowing the digital gap between traditional and virtual banks.
Virtual banks therefore need to continue to evolve and expand their offering to continue to attract customers. This could include the continued provision of competitive interest rates on customer deposits, and the introduction of new products and services such as credit cards, loans and eventually wealth management services. Furthermore, virtual banks can leverage their partnerships with their key owners and stakeholders to provide value-added benefits and promotion schemes such as shopping discounts and other lifestyle benefits.
In a fiercely competitive market like Hong Kong, it is essential for virtual banks to continue to expand their products and services to stand out from their peers – both traditional banks and other virtual banks – and gain a critical mass of customers and deposits. This should also include an increased focus on attracting not just retail clients, but also SMEs to expand their customer base. Importantly, as the virtual banking landscape gradually develops, virtual banks should continue to invest in marketing to increase awareness in Hong Kong of the benefits that their products, services and platform can bring.
© 2021 KPMG, a Hong Kong partnership and a member firm of the KPMG global organisation of independent member firms affiliated with KPMG International Limited, a private English company limited by guarantee. All rights reserved. © 2021 KPMG, a Hong Kong partnership and a member firm of the KPMG global organisation of independent member firms affiliated with KPMG International Limited, a private English company limited by guarantee. All rights reserved.
14 | Hong Kong Banking Report 2021
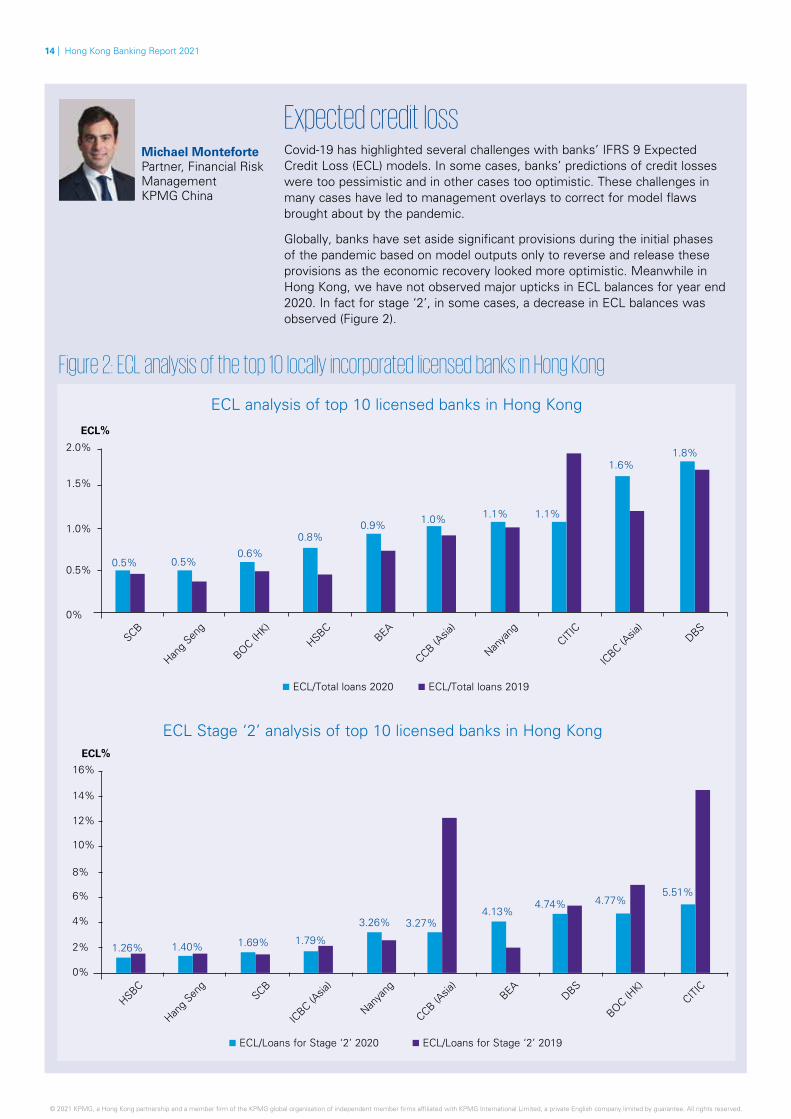
Expected credit lossCovid-19 has highlighted several challenges with banks’ IFRS 9 Expected Credit Loss (ECL) models. In some cases, banks’ predictions of credit losses were too pessimistic and in other cases too optimistic. These challenges in many cases have led to management overlays to correct for model flaws brought about by the pandemic.
Globally, banks have set aside significant provisions during the initial phases of the pandemic based on model outputs only to reverse and release these provisions as the economic recovery looked more optimistic. Meanwhile in Hong Kong, we have not observed major upticks in ECL balances for year end 2020. In fact for stage ‘2’, in some cases, a decrease in ECL balances was observed (Figure 2).
Figure 2: ECL analysis of the top 10 locally incorporated licensed banks in Hong Kong
ECL/Loans for Stage ‘2’ 2020 ECL/Loans for Stage ‘2’ 2019
ECL Stage ‘2’ analysis of top 10 licensed banks in Hong Kong
0%
2%
4%
6%
8%
10%
12%
14%
16%
HSBC
Hang
Seng
SCB
ICBC (A
sia)
CCB (Asia
)
Nanya
ng BEA
BOC (HK)
DBSCITI
C
1.40%1.26%1.79%
4.77%
1.69%
3.26% 3.27%
4.74%4.13%
5.51%
ECL%
ECL analysis of top 10 licensed banks in Hong Kong
0%
0.5%
1.0%
1.5%
2.0%
SCB
Hang
Seng
BOC (HK)
HSBC
CCB (Asia
)BEA
Nanya
ng
ICBC (A
sia)
CITIC
DBS
ECL/Total loans 2020 ECL/Total loans 2019
0.5%0.5%
0.8%
1.6%
0.6%
0.9% 1.0% 1.1%1.1%
1.8%
ECL%
Michael MontefortePartner, Financial Risk ManagementKPMG China
© 2021 KPMG, a Hong Kong partnership and a member firm of the KPMG global organisation of independent member firms affiliated with KPMG International Limited, a private English company limited by guarantee. All rights reserved.
Hong Kong Banking Report 2021 | 15
The uncertainty around recurring waves of the pandemic, additional government support measures and the economic impact on certain sectors, combined with staggered regional vaccination rollouts has presented ECL modelling challenges for banks.
We have observed that ECL processes and models have had issues in three main areas. In the beginning of the crisis, models failed to allocate borrowers to stage ‘2’ due to the lack of timely information related to Covid-19 financial impacts and debt servicing ability. Second, the fluid nature of the crisis and constantly changing economic forecasts have led to models overreacting and under/over-estimating losses. Finally, the crisis has increased the need for more frequent model validations and model recalibrations to reflect the latest risk and economic data in the models. Given the challenges mentioned, specific considerations for banks include the following:
• Appropriateness of all ECL risk parameters given the fast-changing nature of the economic and credit risk environment;
• Appropriateness of the financial instrument staging, which reflects the increase in credit risk, which may be masked by government policy measures, and an assessment on borrowers/counterparties’ repayment abilities given the impacts of the pandemic (particularly if any are subject to the removal of government and/or regulatory relief measures);
• Assessment on the appropriateness of any security/collateral (if applicable) valuations given the potential impacts of Covid-19;
• Assessment on timeliness, applicability and reasonableness of macroeconomic forecasts applied to the IFRS 9 ECL; and
• Sector-specific analysis to identify risk sectors and industries that are at risk due to the pandemic.
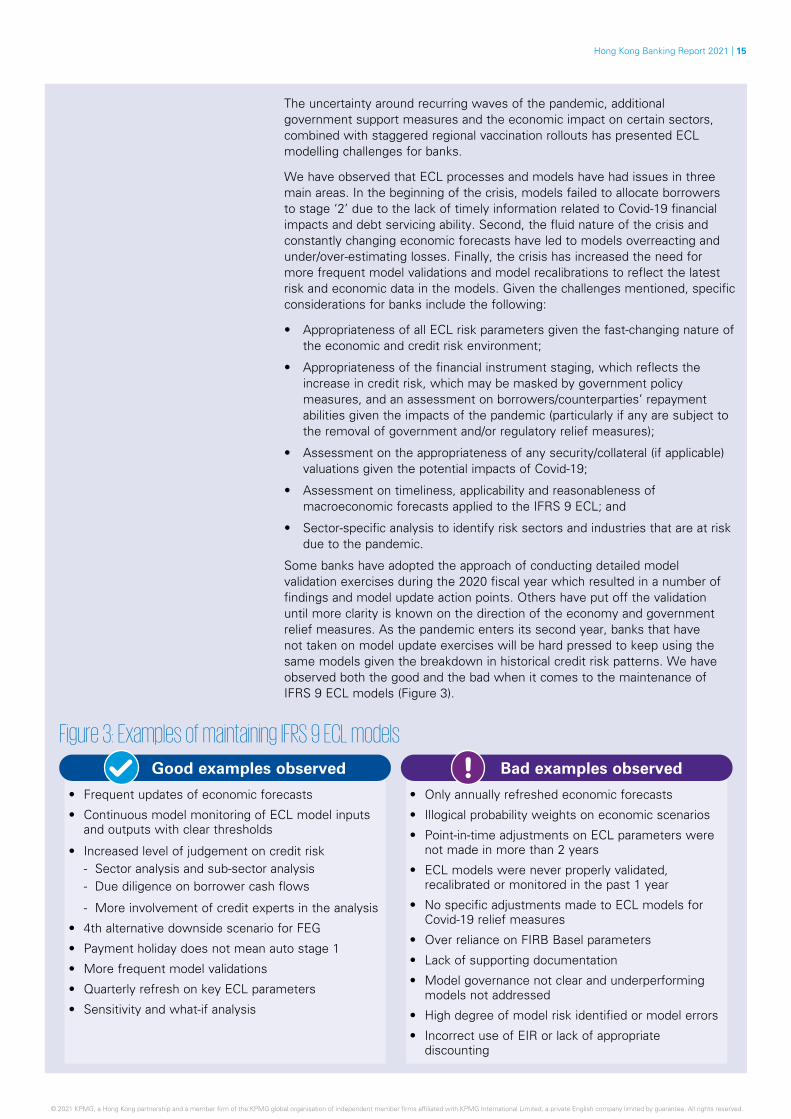
Some banks have adopted the approach of conducting detailed model validation exercises during the 2020 fiscal year which resulted in a number of findings and model update action points. Others have put off the validation until more clarity is known on the direction of the economy and government relief measures. As the pandemic enters its second year, banks that have not taken on model update exercises will be hard pressed to keep using the same models given the breakdown in historical credit risk patterns. We have observed both the good and the bad when it comes to the maintenance of IFRS 9 ECL models (Figure 3).
• Frequent updates of economic forecasts
• Continuous model monitoring of ECL model inputs and outputs with clear thresholds
• Increased level of judgement on credit risk- Sector analysis and sub-sector analysis- Due diligence on borrower cash flows
- More involvement of credit experts in the analysis
• 4th alternative downside scenario for FEG
• Payment holiday does not mean auto stage 1
• More frequent model validations
• Quarterly refresh on key ECL parameters
• Sensitivity and what-if analysis
• Only annually refreshed economic forecasts
• Illogical probability weights on economic scenarios
• Point-in-time adjustments on ECL parameters were not made in more than 2 years
• ECL models were never properly validated, recalibrated or monitored in the past 1 year
• No specific adjustments made to ECL models for Covid-19 relief measures
• Over reliance on FIRB Basel parameters
• Lack of supporting documentation
• Model governance not clear and underperforming models not addressed
• High degree of model risk identified or model errors
• Incorrect use of EIR or lack of appropriate discounting
Good examples observed Bad examples observed
Figure 3: Examples of maintaining IFRS 9 ECL models
© 2021 KPMG, a Hong Kong partnership and a member firm of the KPMG global organisation of independent member firms affiliated with KPMG International Limited, a private English company limited by guarantee. All rights reserved. © 2021 KPMG, a Hong Kong partnership and a member firm of the KPMG global organisation of independent member firms affiliated with KPMG International Limited, a private English company limited by guarantee. All rights reserved.

16 | Hong Kong Banking Report 2021
What should banks be doing?The Covid-19 experience will certainly provide an adequate number of data points on which banks can redevelop or recalibrate their ECL models. We would suggest in the short term that banks consider the following actions:
• Undertake robust model review and model validation exercises to identify underperforming models;
• Stronger governance frameworks and supporting documentation for key judgements and overlays;
• More frequent estimations on input parameters and ECL estimates;
• “Alternative” macroeconomic scenario analysis to incorporate additional forecasts on the pandemic and recovery;
• Form an expectation on the time taken for “mean reversion” to a normal economic state;
• Sensitivity and what-if analysis to understand business impacts, model errors, and identify areas where overlays may be required; and
• Implement more automated model validation and model monitoring processes which can be run using readily available tools and algorithms.
© 2021 KPMG, a Hong Kong partnership and a member firm of the KPMG global organisation of independent member firms affiliated with KPMG International Limited, a private English company limited by guarantee. All rights reserved.

Hong Kong Banking Report 2021 | 17
ESG
© 2021 KPMG, a Hong Kong partnership and a member firm of the KPMG global organisation of independent member firms affiliated with KPMG International Limited, a private English company limited by guarantee. All rights reserved. © 2021 KPMG, a Hong Kong partnership and a member firm of the KPMG global organisation of independent member firms affiliated with KPMG International Limited, a private English company limited by guarantee. All rights reserved.
24 ‘White Paper on Green and Sustainable Banking’, HKMA, June 2020, https://www.hkma.gov.hk/media/eng/doc/key-information/guidelines-and-circular/2020/20200630e1a1.pdf
18 | Hong Kong Banking Report 2021
Strengthening climate resilience and capacity building the next steps for green and sustainable banking Amid a challenging year, environmental, social and governance (ESG) issues and sustainable finance continue to be key areas of focus for both regulators and the banking industry in Hong Kong. While initial steps have been taken toward preparing banks to assess and manage climate risks, more needs to be done to integrate ESG into all aspects of the business and to nurture the right talent for the future.
In May 2019, the Hong Kong Monetary Authority (HKMA) introduced a three-phased approach to support the implementation of green and sustainable banking in Hong Kong. The first phase was completed in 2020, with around 50 banks conducting self-assessments as part of the HKMA’s Common Assessment Framework, which measures an institution’s readiness to manage climate and environmental-related risks. The HKMA found in its initial assessment that most banks are at an early stage of adoption for green and sustainable banking, and that climate risk scenario analysis and stress testing remain a major area for development.
Assessing climate resilienceThe HKMA’s next step this year is to consult the industry and other relevant stakeholders on developing supervisory requirements for green and sustainable banking to enhance climate risk management and increase industry awareness of climate risks and sustainability issues.
In its June 2020 White Paper on Green and Sustainable Banking,24 the HKMA set out its views on supervisory expectations around how banks should address climate risks, covering governance, strategy, risk management and disclosure. One of the nine guiding principles laid out in the White Paper is that banks should build up their capability to measure climate-related risks using a range of methodologies and tools, including scenario analysis. On the back of this, in January 2021, the HKMA invited banks to participate in a pilot climate risk stress test exercise to assess the climate resilience of the banking sector.
Pat WooPartner, Head of Sustainable Finance, Hong Kong, KPMG China, and Global Co-Chair, Sustainable Finance, KPMG IMPACT
Gemini YangPartner, Financial Risk ManagementKPMG China
ESG
© 2021 KPMG, a Hong Kong partnership and a member firm of the KPMG global organisation of independent member firms affiliated with KPMG International Limited, a private English company limited by guarantee. All rights reserved.
25 ‘Guideline on the Green and Sustainable Finance Grant Scheme’, HKMA, May 2021, https://www.hkma.gov.hk/media/eng/doc/key-information/press-release/2021/20210504e4a1.pdf
Hong Kong Banking Report 2021 | 19
Banks will need to carefully assess the impact of physical and transition risk scenarios on other risks such as credit, market and operational risk, and apply the results of the stress test to their overall enterprise risk management (ERM) framework and strategic plans for climate risk and ESG management.
The stress test exercise requires participating banks to focus on both physical risk and transition risk. Physical risk refers to the financial impact of a changing climate – including more frequent extreme weather events and environmental degradation – which can result in property damage, reduced productivity or disruption to supply chains. Transition risk refers to an institution’s financial loss that can result from adjusting to a lower-carbon and more environmentally sustainable economy. For example, an abrupt adoption of climate and environmental policies, technological progress or changes in market sentiment and preferences could have an impact on transition risk.
Banks will need to carefully assess the impact of physical and transition risk scenarios on other risks such as credit, market and operational risk, and apply the results of the stress test to their overall enterprise risk management (ERM) framework and strategic plans for climate risk and ESG management. For example, banks might need to consider enhancing or updating their existing credit approval policies for high-carbon sectors as an application of the stress test result, which could increase funding costs for corporate customers operating in these sectors.
Increasing appetite for green productsFrom a product perspective, we continue to see increasing appetite for green and sustainability-linked bonds and loans in Hong Kong. For example, Hang Lung Properties secured its first green loan from OCBC Bank in December 2019, while in January 2021 New World Development Company became the first real estate developer to issue USD and HKD-denominated sustainability-linked bonds, worth US$200 million and HK$1.5 billion, respectively.
In January this year, the Hong Kong Government also issued its second batch of government green bonds totalling US$2.5 billion. The Government plans to expand the scale of the Government Green Bond Programme and issue retail green bonds for the general public. Furthermore, in May, the Government issued a guideline consolidating the Pilot Bond Grant Scheme and Green Bond Grant Scheme into a Green and Sustainable Finance Grant Scheme, which aims to subsidise eligible bond issuers and loan borrowers’ general bond issuance costs and external review costs.25 On the back of these positive developments, we expect to see an increase in green and sustainability-linked bonds being issued in the market in the year ahead, as well as other new product offerings that meet ESG standards.
We also continue to see significant opportunities in the transition finance space as companies in higher-carbon sectors seek to move toward a more environmentally sustainable business model. For example, in February this year Castle Peak Power Company, whose parent company is CLP Holdings, issued a US$300 million Energy Transition Bond in support of Hong Kong’s transition to a low-carbon economy. We expect to see more of these types of issuances in the year ahead.
© 2021 KPMG, a Hong Kong partnership and a member firm of the KPMG global organisation of independent member firms affiliated with KPMG International Limited, a private English company limited by guarantee. All rights reserved. © 2021 KPMG, a Hong Kong partnership and a member firm of the KPMG global organisation of independent member firms affiliated with KPMG International Limited, a private English company limited by guarantee. All rights reserved.
20 | Hong Kong Banking Report 2021
Nurturing and training talentUltimately, the initial focus on climate risk and the results of the stress test exercise should form part of a bank’s overall ESG roadmap. This entails setting a firm-wide ESG strategy covering all aspects of governance and planning through to disclosure and communication, and embedding this strategy across the organisation. Understanding the importance of aligning tax strategy with the broader ESG agenda is also key. In our view, the banks that get this right will be the ones that ensure responsibility and ownership of the ESG agenda at the board level in order to effectively implement the ESG strategy across the organisation and encourage collaboration across functions.
Importantly, the successful development of a comprehensive ESG strategy and integration across the organisation hinges on the banking industry’s ability to nurture new talent and upskill the existing workforce. This is an area that Hong Kong’s regulatory and industries bodies are acutely aware of. For example, the newly formed Green and Sustainable Finance Cross-Agency Steering Group, co-chaired by the HKMA and the Securities and Futures Commission, issued its Strategic Plan in December 2020 to pave the way forward for Hong Kong. The Strategic Plan outlines a key goal of expanding and strengthening Hong Kong’s overall green and sustainable finance capabilities through greater capacity building of local expertise to fill skill gaps and build up market knowledge.
There is certainly a greater need for capacity building in the banking sector, especially as ESG becomes increasingly integrated throughout organisations. Addressing this challenge does not just mean increasing investment in risk management teams, but also on training relationship managers in both corporate and private banking on what ESG and sustainable finance means to their day-to-day practice, and how to effectively communicate with and educate their clients accordingly.
While the increasing regulatory focus to promote green and sustainable banking is a positive step, banks still have significant room to develop in this space. In fact, there are a number of opportunities for banks that get this right, such as new and innovative products and services, access to new markets and clients, and overall climate resilience. Leading banks will also understand that ESG is no longer just a thematic item, it is an integral part of banking that needs to be comprehensively integrated throughout the business.
The initial focus on climate risk and the results of the stress test exercise should form part of a bank’s overall ESG roadmap. This entails setting a firm-wide ESG strategy covering all aspects of governance and planning through to disclosure and communication, and embedding this strategy across the organisation.
ESG
© 2021 KPMG, a Hong Kong partnership and a member firm of the KPMG global organisation of independent member firms affiliated with KPMG International Limited, a private English company limited by guarantee. All rights reserved.
Hong Kong Banking Report 2021 | 21
Greater alignment between financial crime compliance and ESG is the way forwardThe Covid-19 pandemic has transformed the banking industry, with institutions rethinking their business and operating models and ways of working. As the pandemic drags on into its second year, the pursuit of innovation and acceleration of digitalisation are expected to stay at the top of banks’ agendas. Banks in Hong Kong are expected to increase their technology adoption in the area of financial crime, where although the adoption of technology such as Regtech is deemed the most mature,26 institutions still face practical challenges that could be solved with more advanced technology solutions. Our discussions with banks tell us that delivering excellent customer experience, reducing operational costs and strengthening effectiveness in managing financial crime risk are the key desired outcomes in the financial crime space to remain competitive and to succeed in the long-term.
The fact that banks view customer experience as a key component of the financial crime agenda is positive, and indicates a recognition that the hard-earned trust that banks gain from customers and the public can be lost in an instant if banks are perceived not to be acting in the best interest of their customers. For example, one area under close scrutiny from customers and investors alike is how banks respond to issues like fraud – including those that take place in cyberspace – to ensure their customers’ money and data are protected and demonstrate that they are taking the issue seriously.
In thinking about their strategy to succeed in the long-term, banks cannot ignore the pivotal role they can play in rewiring the economy to deliver sustainable outcomes with environmental, social and governance (ESG) factors in mind. But how does the topic of financial crime relate to ESG?
Financial crime and ESG: a logical connection?Sustainability risks, also referred to as ESG risks, urge banks to view risk not only from the impact on the institution itself, but also the impact the bank is having on its stakeholders, the environment and its communities due to its business activities.27 As a lender of capital to businesses, banks are best positioned to steer capital toward economic activities that support the future that we want, and away from activities that we do not.28 Know Your Customer (KYC) procedures were designed to understand a customer, their business intent, purpose, strategy and business activities. Armed with that information, banks assess the potential for financial crime risks that society and the bank itself could be exposed to from the relationship. The process could be leveraged to understand the business activities and the financing needs of the business. Unfortunately, without proper governance, KYC has become a tick-box compliance exercise without the desired depth of understanding of a customer.
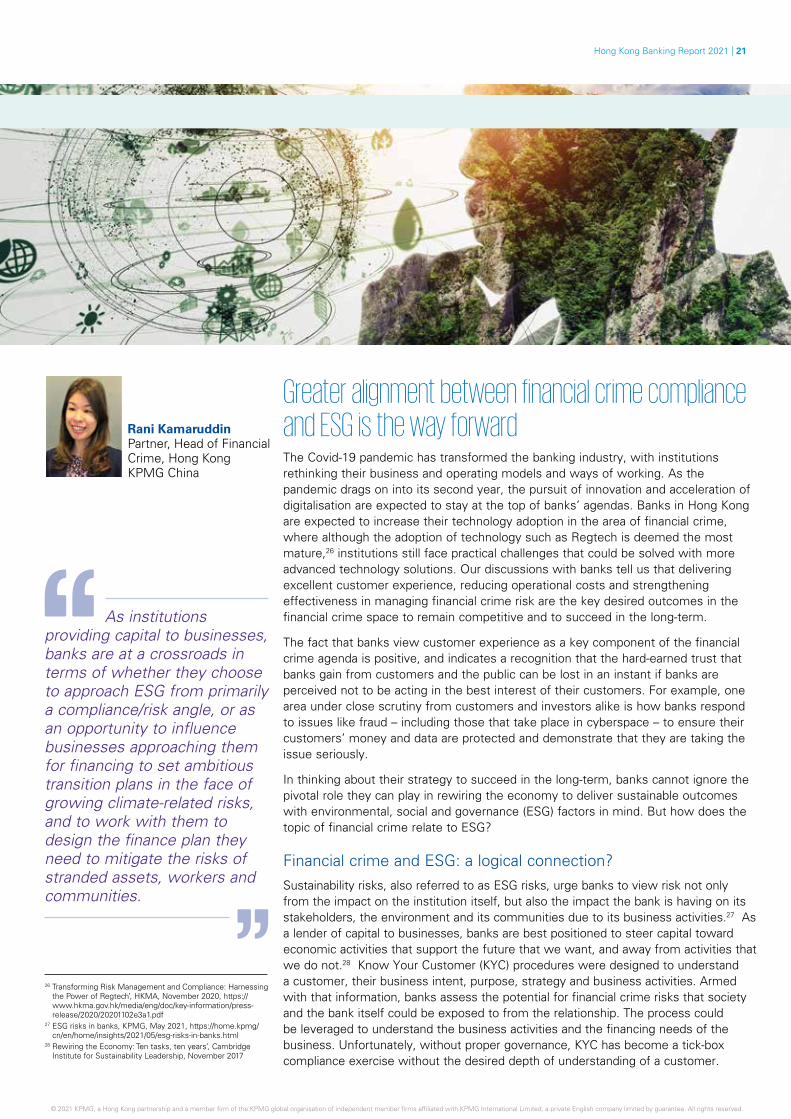
Rani KamaruddinPartner, Head of Financial Crime, Hong Kong KPMG China
As institutions providing capital to businesses, banks are at a crossroads in terms of whether they choose to approach ESG from primarily a compliance/risk angle, or as an opportunity to influence businesses approaching them for financing to set ambitious transition plans in the face of growing climate-related risks, and to work with them to design the finance plan they need to mitigate the risks of stranded assets, workers and communities.
26 Transforming Risk Management and Compliance: Harnessing the Power of Regtech’, HKMA, November 2020, https://www.hkma.gov.hk/media/eng/doc/key-information/press-release/2020/20201102e3a1.pdf
27 ESG risks in banks, KPMG, May 2021, https://home.kpmg/cn/en/home/insights/2021/05/esg-risks-in-banks.html
28 Rewiring the Economy: Ten tasks, ten years’, Cambridge Institute for Sustainability Leadership, November 2017
© 2021 KPMG, a Hong Kong partnership and a member firm of the KPMG global organisation of independent member firms affiliated with KPMG International Limited, a private English company limited by guarantee. All rights reserved. © 2021 KPMG, a Hong Kong partnership and a member firm of the KPMG global organisation of independent member firms affiliated with KPMG International Limited, a private English company limited by guarantee. All rights reserved.
22 | Hong Kong Banking Report 2021
The growing importance of ESG calls for leadership from banks and businesses alike to consider the long-term impact of their activities on all of their stakeholders, including investors, customers, employees, business partners and the environment. As institutions providing capital to businesses, banks are at a crossroads in terms of whether they choose to approach ESG from primarily a compliance/risk angle, or as an opportunity to influence businesses approaching them for financing to set ambitious transition plans in the face of growing climate-related risks, and to work with them to design the finance plan they need to mitigate the risks of stranded assets, workers and communities. The latter paves the way toward a sustainable future and requires banks to break conventional compliance boxes and risk siloes to achieve a purpose of financing initiatives and proposals that truly deliver long-term value for the societies, environment and economies that businesses operate in and rely upon. Customer due diligence against this backdrop cannot be a tick-box exercise as it requires the consciousness of impact – the cause-effect relationships of decisions.
Banks play a gatekeeping role in the detection, investigation and reporting of financial crime, including criminal offences related to unjust enrichment from unethical practices such as fraud, bribery and corruption. While not yet codified in national regulations, financial institutions that are ahead on ESG have already integrated ESG into their KYC processes. An ESG lens asks banks to up their game and requires that banks understand their customers’ business activities within the context of their impact on the environment or society, or whether business practices undermine transparency, integrity and financial stability. We believe that the review of a customer’s sources of funds and/or wealth that is expanded to cover the dimension as to the extent that business activities have played a role in garnering wealth at the expense of the environment and/or society is not too far away.
Banks should also seek to harness data to enable better decision-making, including when screening customers not only for sanctions and involvement in white collar crime, but also for business practices that could be indicative of environmental crime, non-compliance with labour-standards, violations of human rights (e.g. modern slavery, human trafficking) and sector-specific damaging practices, e.g. waste pollution, illegal logging or mining, wildlife trafficking and other criminal offences.
Furthermore, the monitoring of transactions should be expanded to look beyond the immediate customer to better understand the network of financial relationships their customer has to assess if these align with the bank’s understanding of the customer’s ESG plans. Directing financing to a business whose activities have adversely impacted local communities and/or the environment in the supply chain can arguably outweigh the implications of making the press for having to pay a regulatory fine for failures in controls to mitigate financial crime risks. This is not to downplay the seriousness of failing financial crime-related controls, but rather to point out that the radius of impact from providing financing to such businesses is much larger as it affects the environment and communities.
Embarking on the journeyAs banks continue to formalise their ESG strategy as an institution, they should consider the appropriate strategies they need to support their stakeholders (including their customers, employees, investors and business partners) in the transition toward a sustainable future. At present, ESG is often assigned to a dedicated team or unit. However, the scale of environmental and social challenges exceeds the capacity of one team and requires mobilisation of the bank as a whole. As part of this rethinking, we believe it is essential for ESG to become mainstream. Externally, banks should collaborate with the public and private sectors to achieve targets that deliver the most impact. Internally, banks should embed ESG across their businesses and functions, which includes financial crime compliance and risk management, to effectively execute their ESG strategy.
This does not mean that banks should lose sight of their focus on their role as gatekeeper in guarding the financial system against financial crime. But the ability to apply a broader ESG perspective can help banks do right by their customers, the environment and their community, safeguard trust, and ultimately gain a long-term competitive edge.
ESG
Directing financing to a business whose activities have adversely impacted local communities and/or the environment in the supply chain can arguably outweigh the implications of making the press for having to pay a regulatory fine for failures in controls to mitigate financial crime risks.
© 2021 KPMG, a Hong Kong partnership and a member firm of the KPMG global organisation of independent member firms affiliated with KPMG International Limited, a private English company limited by guarantee. All rights reserved.

Hong Kong Banking Report 2021 | 23
Transformation
© 2021 KPMG, a Hong Kong partnership and a member firm of the KPMG global organisation of independent member firms affiliated with KPMG International Limited, a private English company limited by guarantee. All rights reserved. © 2021 KPMG, a Hong Kong partnership and a member firm of the KPMG global organisation of independent member firms affiliated with KPMG International Limited, a private English company limited by guarantee. All rights reserved.
29 ‘Transforming Risk Management and Compliance: Harnessing the Power of Regtech’, HKMA, November 2020, https://www.hkma.gov.hk/media/eng/doc/ key-information/press-release/2020/20201102e3a1.pdf
24 | Hong Kong Banking Report 2021
More banks in Hong Kong will seek to adopt Regtech solutions as part of their regulatory-driven transformation journeyAs banks seek to keep pace with a rapidly changing external environment, many are turning to Regtech to transform their risk management and compliance functions and gain a competitive edge.
Regtech-related investment expected to increaseBanks are becoming more aware of the wide range of benefits that Regtech can bring, such as cost-effectiveness, increased operational efficiency, greater coverage of compliance and the potential to enhance customer experience and drive growth.
The intention to harness technology in the risk and compliance space is further emphasised by the Hong Kong Monetary Authority’s (HKMA) support and focus on the adoption of Regtech and its underpinning technologies. The HKMA’s White Paper on Regtech29 – which KPMG was commissioned to help develop – finds that there is room for greater Regtech adoption in Hong Kong. While we have observed that many banks are currently allocating a limited amount of investment and headcount to Regtech, this is likely to pick up in the coming year as they focus on recruiting and training experts who can explore Regtech use cases and how to best apply them across the organisation.
The direction of travel toward greater Regtech adoption in Hong Kong is clear, underpinned by strong regulatory support. The regulators themselves are on their own Suptech development journey as well, as they continue to explore how they can better use technology and importantly the data they receive from banks to enhance their supervisory capabilities.
In the year ahead we expect to see more proofs of concept (POCs) and trialling of Regtech solutions as part of the banking industry’s broader transformation agenda. This will be followed by more aggressive implementation as banks prove that they can automate a lot of their processes, activities and controls in the risk and compliance space. Banks that have already adopted solutions will also expand their use cases across more application areas.
James O’CallaghanPartner, Head of Technology Consulting, Hong Kong KPMG China
In the year ahead we expect to see more proofs of concept and trialling of Regtech solutions as part of the banking industry’s broader transformation agenda. This will be followed by more aggressive implementation as banks prove that they can automate a lot of their processes, activities and controls in the risk and compliance space.
Transformation
© 2021 KPMG, a Hong Kong partnership and a member firm of the KPMG global organisation of independent member firms affiliated with KPMG International Limited, a private English company limited by guarantee. All rights reserved.
Hong Kong Banking Report 2021 | 25
There will be increasing depth in the application of Regtech in the Financial Crime space, while the breadth of Regtech adoption will also increase as more banks deploy solutions across other areas such as Regulatory Compliance Obligations and Governance and Accountability. These areas have historically been more challenging for banks as they are much more manual and interpretation-based, and use cases may take more time to identify. As regulators start to disseminate their obligations to the market in a more digital way, we are starting to see services emerging that centralise all compliance obligations, and technology that allows banks to better understand the impact of those obligations on their operations.
Overcoming barriers to adoptionChallenges do remain for banks that want to adopt Regtech. In the HKMA’s White Paper, budgetary or resource constraints and the lack of available solutions/maturity of solutions were viewed as the top two adoption barriers for banks in Hong Kong. While this finding is in line with what we are seeing in the market, we believe that as banks explore Regtech solutions in more detail, they will find that there is actually a wide range of potentially suitable solutions in the market. We have seen that banks with higher levels of Regtech adoption are more active within the Regtech ecosystem and are more open to partnerships and collaboration. This may be obvious, but we believe that this openness to Regtech and participation in the ecosystem can lead to the realisation of greater benefits such as efficiency, better monitoring coverage and in some cases an enhanced customer experience.
Banks that are more likely to successfully adopt Regtech solutions also demonstrate an openness to technology, foster a culture of innovation and have strong support from senior management. Importantly, we believe that banks can only truly drive innovation if they are prepared for their Regtech POCs and trials to potentially fail. The key here is to build success stories in order to build momentum. One way is to break a pain point down into detailed story points or components, which can then be automated in a controlled way. It also shows how the adoption of technology can be applied using a practical approach. Nonetheless, it is essential that banks at least embark on the journey in order to demonstrate initial success and then build momentum.
Overall, it is encouraging to see that banks are starting to realise that Regtech is the way of the future for cost-effective regulatory compliance. In order to build on this momentum and maintain a strategic advantage in the long run, banks should increase their awareness of the available Regtech solutions in the market and their potential benefits, get more involved in the Regtech ecosystem, invest in Regtech-focused employees and related training, establish a culture of innovation and support, and put suitable systems, data and infrastructure in place to be able to deploy new solutions seamlessly.
Banks that are more likely to successfully adopt Regtech solutions demonstrate an openness to technology, foster a culture of innovation and have strong support from senior management. Importantly, we believe that banks can only truly drive innovation if they are prepared for their Regtech POCs and trials to potentially fail.
© 2021 KPMG, a Hong Kong partnership and a member firm of the KPMG global organisation of independent member firms affiliated with KPMG International Limited, a private English company limited by guarantee. All rights reserved. © 2021 KPMG, a Hong Kong partnership and a member firm of the KPMG global organisation of independent member firms affiliated with KPMG International Limited, a private English company limited by guarantee. All rights reserved.
26 | Hong Kong Banking Report 2021
Sean RenAssociate Director, Strategy and Performance, Financial ServicesKPMG China
30 ‘Impact of COVID-19 on Hong Kong Consumers’ Behaviours’, KPMG and gini, November 2020, https://home.kpmg/cn/en/home/insights/2020/11/impact-of-covid-19-on-hong-kong-consumers-behaviours.html
31 ‘Hong Kong Private Wealth Management Report 2020’, KPMG China and the Private Wealth Management Association, November 2020, https://home.kpmg/cn/en/home/insights/2020/11/hong-kong-private-wealth-management-report-2020.html
Facing revenue and cost pressure, banks are accelerating their transformation initiatives to adapt and growWith revenue and cost pressure mounting, banks are seeking to accelerate their transformation efforts to enhance customer and employee experience, reduce costs and adapt to new ways of working.
Key drivers Apart from regulatory-led factors, there are a number of key themes that are driving transformation in the banking sector. First and foremost is the significant impact that Covid-19 is having on operating models and ways of working. Many banks are committed to offering some form of hybrid working model for both their clients and staff on a longer-term basis, and will therefore need to make appropriate investments and take the necessary transformation steps to enable this.
In addition, banks continue to focus on managing costs as a key lever to maintain profitability. The last year has seen greater pressure on revenue and profit margins, which are acting as catalysts to pursue transformation to do things better, faster and more efficiently.
Enhancing the customer experience, supported by digital initiatives and innovation, remains a key driver of transformation. In particular, as the pandemic leads to new – and potentially permanent – ways of working, it is essential for banks to rethink their value propositions and accelerate their digital initiatives to keep pace with fast-evolving client expectations. KPMG’s analysis of the impact of Covid-19 on Hong Kong consumers’ behaviours finds that banking customers are expected to increasingly use digital channels for standard daily activities, and view quality of products and services (49% of survey respondents) and customer experience (45%) as the most important factors when purchasing banking products.30 There is also increasing demand among private wealth management clients in Hong Kong for digital channels across the whole advisory process, especially in investment research (73% of survey respondents), portfolio reporting (61%) and anti-money laundering transaction reporting.31
Isabel ZisselsbergerPartner, Strategy and Performance, Financial Services KPMG China
Transformation
© 2021 KPMG, a Hong Kong partnership and a member firm of the KPMG global organisation of independent member firms affiliated with KPMG International Limited, a private English company limited by guarantee. All rights reserved.
Hong Kong Banking Report 2021 | 27
Lastly, there is a need to transform to improve the employee experience. Banks want to ensure that they offer an enhanced working experience in order to hire and retain top talent, and transforming ways of working and thinking can help to achieve this. These changes include a renewed focus on more lifestyle integration, health and well-being, and embedding these ways of working into the overall transformation roadmap. This is particularly necessary in view of the increasingly active recruitment market where many banks are competing to attract wealth management talent.
Key considerations for a successful transformationBanks are aware that they need to transform to keep pace with the rapidly changing business environment. However, the practical aspects of executing a transformation programme almost always has its challenges. In our view, there are several key factors that banks should consider to set themselves up for success.
The first is the level of commitment that banks are actually putting into their transformation programme. For the larger international banks in Hong Kong, they should ensure that there is alignment globally and address any issues relating to local regulatory or cross-border complexity, budgetary approvals and scalability.
The second key factor is the actual level of commitment of people and resources to the transformation programme in Hong Kong. Transformation can often lead to significant changes to the future operating model, and banks need to ensure they have the right level of involvement from the business side. While transformation is not new, given that banks are experiencing change at a larger scale than before, greater business involvement is essential. Agile delivery of transformation programmes is now part of the new normal, and with that comes the expectation of internal stakeholders that impactful change and iterative improvements will be continuous.
Lastly, it is essential for banks to understand and demonstrate how their customers will ultimately benefit from the transformation. This can sometimes be hard to measure when base data is scarce and regular customer metrics are not part of the organisation’s metrics and measures. As such, there is a need for robust programme management to ensure that the vision is tied to the reality on the ground. This should be supported by clear objectives and metrics to measure success and achieve the desired results. These metrics need to be evaluated in a frequent and timely manner to ensure that leadership and the business are able to experience continuous impactful change. Implementing a framework for collecting and analysing customer feedback is an important component. Getting all this right, however, can be challenging from a practical perspective. Banks should therefore consider exploring opportunities to work with external experts and solutions that can leverage their experience and best practice across different industries, organisations and markets.
Enhancing the customer experience, supported by digital initiatives and innovation, remains a key driver of transformation. In particular, as the pandemic leads to new – and potentially permanent – ways of working, it is essential for banks to rethink their value propositions and accelerate their digital initiatives to keep pace with fast-evolving client expectations.
© 2021 KPMG, a Hong Kong partnership and a member firm of the KPMG global organisation of independent member firms affiliated with KPMG International Limited, a private English company limited by guarantee. All rights reserved. © 2021 KPMG, a Hong Kong partnership and a member firm of the KPMG global organisation of independent member firms affiliated with KPMG International Limited, a private English company limited by guarantee. All rights reserved.
28 | Hong Kong Banking Report 2021
More partnerships between banks and third parties Partnerships between banks and fintech or technology players are also becoming more common as part of the transformation journey. Compared to a few years ago, we have observed that there is a greater acceptance among banks of adopting third-party solutions to solve their problems. However, many banks still need to address ongoing constraints around legacy architecture and security concerns (especially related to cloud-based solutions), which can slow down their transformation efforts. Furthermore, banks should have adapted their third party management processes to allow them to proceed with these types of partnerships with fintech and technology players in an efficient manner. This involves ensuring that there is a clear path for onboarding, risk assessment and management, or risk slowing down the pace of transformation.
Importantly, any successful digital transformation is built on strong data foundations. Ensuring that data is accurate, maintained and secure will help banks to enable and power the digital initiatives and solutions being adopted.
Overall, while the underlying drivers for transformation might differ among banks, there is not a single institution that is not undergoing some form of change. While there are a number of key aspects of transformation that banks need to consider, we believe that clear communication and ownership of the programme is a critical factor in determining long-term success, especially since the people who start the transformation are often not the ones who finish it. It is therefore crucial that banks articulate their vision clearly across the organisation, bring their clients and teams along on the journey and tie it to clear metrics and measures of success that are evaluated on an ongoing basis.
One crucial consideration is for banks to understand and demonstrate how their customers will ultimately benefit from the transformation. This can sometimes be hard to measure when base data is scarce and regular customer metrics are not part of the organisation’s metrics and measures. As such, there is a need for robust programme management to ensure that the vision is tied to the reality on the ground.
Transformation
© 2021 KPMG, a Hong Kong partnership and a member firm of the KPMG global organisation of independent member firms affiliated with KPMG International Limited, a private English company limited by guarantee. All rights reserved.

Hong Kong Banking Report 2021 | 29
Wealth
© 2021 KPMG, a Hong Kong partnership and a member firm of the KPMG global organisation of independent member firms affiliated with KPMG International Limited, a private English company limited by guarantee. All rights reserved. © 2021 KPMG, a Hong Kong partnership and a member firm of the KPMG global organisation of independent member firms affiliated with KPMG International Limited, a private English company limited by guarantee. All rights reserved.
30 | Hong Kong Banking Report 2021
Wealth Management Connect should be integral to banks’ overall digital and GBA strategiesSeeking new avenues for growth, a number of banks in Hong Kong are gearing up for the imminent launch of the Greater Bay Area (GBA) Wealth Management Connect to expand their wealth management business and attract new clients.
In a landmark development as part of the overall GBA initiative, the Wealth Management Connect scheme was jointly announced by the People’s Bank of China, the Hong Kong Monetary Authority (HKMA) and the Monetary Authority of Macao in June 2020. Additional details, including amendments to the draft rules, were recently released in May this year, another key step toward the scheme’s launch. The scheme would allow residents of the mainland Chinese cities in the GBA to invest in eligible investment products distributed by banks in Hong Kong and Macau, and vice versa.
While the scheme will initially permit only simple low-risk investment products with cross-boundary fund flows subject to aggregate and individual investor quotas, it has been positively received by the financial services industry.
Many banks in Hong Kong are eager to be the first to join the Wealth Management Connect scheme, and are actively preparing for the launch by conducting health checks in order to be ready to submit self-assessments to meet HKMA requirements once the scheme goes live. The recently released amendments to the draft rules have also helped to provide more clarity around the requirements. We also continue to see banks actively looking for suitable partners in mainland China, as the arrangement currently allows more flexible partnership arrangements between banks in Hong Kong and mainland China.
Integrating the scheme into a broader planWith a prolonged low interest rate environment putting pressure on NIM as a key source of revenue for banks, many are seeking to generate income from other avenues such as fee-based wealth management activities. This is another reason why many banks in Hong Kong view the Wealth Management Connect scheme as an integral part of their overall growth strategy. Indeed, Wealth Management Connect can be viewed as the first step toward bigger opportunities – the successful launch of the scheme could lead to further enhancements in the future such as allowing a wider scope of products, a relaxation on quotas, or more flexibility around customer onboarding.
Edna WongPartner, Financial ServicesKPMG China
Wealth Management Connect can be viewed as the first step toward bigger opportunities. The successful launch of the scheme could lead to further enhancements in the future such as allowing a wider scope of products, a relaxation on quotas, or more flexibility around customer onboarding.
Wealth
© 2021 KPMG, a Hong Kong partnership and a member firm of the KPMG global organisation of independent member firms affiliated with KPMG International Limited, a private English company limited by guarantee. All rights reserved.

Hong Kong Banking Report 2021 | 31
Furthermore, banks’ plans for Wealth Management Connect should fit nicely into their overall digital strategy as it is expected that banks will leverage digital channels to distribute qualified products under the scheme. In our view, banks can use the launch of the scheme as a trigger point to secure more budget for their digital strategy, such as for their digital wealth management or broader e-banking propositions as Wealth Management Connect allows them to reach a wider audience.
Planning for the Wealth Management Connect scheme has also been a catalyst for many banks to proactively think about their broader strategy for the GBA. Our recent industry surveys and discussions with banks in Hong Kong have found that previously many banks had no concrete plan or strategy for the GBA. However, the announcement of the Wealth Management Connect scheme has spurred a lot of banks into action to devise a roadmap for their development in the GBA.
Interestingly, for compliance teams at banks, many of the components of the Wealth Management Connect scheme are not new as areas relating to products and onboarding remain business as usual. However, the business side is in a different position and may need additional guidance and support from an operational standpoint and training frontline staff.
As official guidance is released, banks will need to rapidly assess their readiness against the final requirements and ensure that their technology and operational setups are both efficient and compliant. We believe that the banks that are the best prepared and first to market will be able to enjoy a competitive advantage from a business development perspective, given the pent-up market demand for wealth management products and services. The banks that are likely to succeed will view Wealth Management Connect as not just a standalone opportunity, but instead as part of their overall wealth management and GBA strategies which are core to their future growth in an ongoing challenging environment.
Planning for the Wealth Management Connect scheme has also been a catalyst for many banks to proactively think about their broader strategy for the GBA.
© 2021 KPMG, a Hong Kong partnership and a member firm of the KPMG global organisation of independent member firms affiliated with KPMG International Limited, a private English company limited by guarantee. All rights reserved. © 2021 KPMG, a Hong Kong partnership and a member firm of the KPMG global organisation of independent member firms affiliated with KPMG International Limited, a private English company limited by guarantee. All rights reserved.
32 ‘Asset and Wealth Management Activities Survey 2019’, SFC, August 2020, https://www.sfc.hk/web/files/ER/Reports/AWMAS_2019_EN.pdf
32 | Hong Kong Banking Report 2021
Hong Kong’s status continues to grow as a key connector and international wealth management centre Hong Kong’s private banking and wealth management industry remained resilient in the face of a number of challenges over the past few years. It has weathered US-China trade tensions, social unrest in Hong Kong, and even managed to thrive in the midst of Covid-19. According to the Securities and Futures Commission’s (SFC) latest Asset and Wealth Management Securities Survey,32 industry assets under management (AUM) increased significantly by 19% to HK$9.1 trillion (US$1.2 trillion) in 2019, up from HK$7.6 trillion (US$ 1 trillion) in 2018.
While these figures pre-date the onset of Covid-19, wealth managers’ financial results for 2020 have also shown significant growth. Furthermore, despite recent perceptions or predictions of capital outflows from Hong Kong, the city has experienced continuous inflows.
International private banks and wealth managers continue to seek out new opportunities for growth in the region, using Hong Kong as a key pillar to achieve their ambitions. Many have also recently announced major hiring plans in the city to scale up their wealth operations. In particular, the rapid increase in wealth generation in mainland China and the country’s sharp economic rebound from the pandemic, coupled with increasing international investor appetite for RMB-denominated assets, further highlight the vital role that Hong Kong has as an international wealth management centre in facilitating investment flows to and from the Mainland.
Hong Kong as a springboard into mainland ChinaMainland China remains the biggest growth opportunity for most international private banks and wealth managers in Hong Kong, with the Greater Bay Area (GBA) a key driver. The imminent launch of the GBA Wealth Management Connect scheme is a particularly significant opportunity. While the scheme will initially provide simple investment products aimed at mass affluent clients, a successful rollout could signal further opportunities in the future that could benefit wealthier segments, and therefore private banks. Furthermore, as mainland China’s financial services sector continues to open up to foreign investment, more international wealth managers are seeking to capitalise on this growth opportunity and establish an onshore presence, using Hong Kong as a springboard.
A number of international and regional private banks and wealth managers have moved to enter the mainland China market or expand their existing onshore operations, including Credit Suisse, HSBC, DBS Bank and UBS. International banks looking to expand onshore are likely to leverage and apply global best practices to their onshore operations, while ensuring that their offerings are suitably tailored for the local market – one that is unique, competitive, more digitally aware, and very different to other markets.
Isabel ZisselsbergerPartner, Strategy and Performance, Financial Services KPMG China
The rapid increase in wealth generation in mainland China and the country’s sharp economic rebound from the pandemic, coupled with increasing international investor appetite for RMB-denominated assets, further highlight the vital role that Hong Kong has as an international wealth management centre in facilitating investment flows to and from the Mainland.
Larry CampbellPartner, Head of Financial Services Strategy KPMG Asia Pacific
Wealth
© 2021 KPMG, a Hong Kong partnership and a member firm of the KPMG global organisation of independent member firms affiliated with KPMG International Limited, a private English company limited by guarantee. All rights reserved.
33 ‘Hong Kong Private Wealth Management Report 2020’, KPMG China and the Private Wealth Management Association, November 2020, https://home.kpmg/cn/en/home/insights/2020/11/hong-kong-private-wealth-management-report-2020.html
Hong Kong Banking Report 2021 | 33
Hong Kong as a centre for mainland Chinese wealthOn the flip side, Hong Kong remains an attractive jurisdiction for mainland Chinese investors to access international markets. This is a result of increasing demand from high-net-worth individuals and other mass affluent investors in mainland China seeking to diversify their investments across a wider range of products and markets, and work with professionals who have in-depth experience in this space. The growing demand for wealth management products and services stems from both the intergenerational transfer of wealth, as well as new wealth being created by the next generation of entrepreneurs.
Hong Kong is well positioned to attract the wealth being created across the border, boasting a transparent and tested regulatory environment, a deep local and international talent pool, and world-class capabilities in professional services across law, accounting, tax, risk management and compliance. In addition, Hong Kong’s diverse product suite and broad coverage across all asset classes leaves it well placed to serve mainland Chinese clients.
According to the Hong Kong Private Wealth Management Report 2020, which was jointly developed by the Private Wealth Management Association and KPMG China, surveyed private wealth managers indicated that on average 40% of their AUM is currently sourced from mainland China, up from 35% in 2019.33 This figure is expected to increase to 54% by 2025, indicating the growing significance of mainland China to Hong Kong’s wealth management industry.
We continue to see more interest from Chinese banks in exploring opportunities in Hong Kong as a suitable market for them to expand their offshore business. One recent example in January this year, Beijing-headquartered Puhui Wealth Investment Management announced the launch of its international development strategy by entering the Hong Kong market.
An increasingly competitive landscapeThe wealth management landscape in Hong Kong continues to become even more competitive as traditional retail banks compete for market share not just with their peers, but also with the newly launched virtual banks and the emerging Wealthtech firms that are developing advanced B2B and B2C digital solutions.
When it comes to tackling the new competition, if the traditional banks can overcome their legacy issues and increase the pace of their own digital transformation, they will continue to be a force to be reckoned with in the market. Overall success will depend on the ability of private banks and wealth managers to build on their trusted brand status with comprehensive and seamless digital propositions and offerings that are tailored to the needs and expectations of the younger generation of clients, as well as to the increasingly digitally savvy overall client base.
We are also seeing banks increasingly seeking to partner with Wealthtech players in Hong Kong to leverage their advanced solutions and provide more personalised offerings to clients.
Ultimately, the increasingly competitive landscape in Hong Kong underscores the city’s allure and standing as an international wealth centre. With Hong Kong remaining a connector between mainland China and the rest of the world, the city will continue to attract top talent and investment, and international banks will continue to seek to strengthen their presence to tap into the significant wealth opportunities in mainland China and the broader region.
When it comes to tackling the new competition, if the traditional banks can overcome their legacy issues and increase the pace of their own digital transformation, they will continue to be a force to be reckoned with in the market.
© 2021 KPMG, a Hong Kong partnership and a member firm of the KPMG global organisation of independent member firms affiliated with KPMG International Limited, a private English company limited by guarantee. All rights reserved. © 2021 KPMG, a Hong Kong partnership and a member firm of the KPMG global organisation of independent member firms affiliated with KPMG International Limited, a private English company limited by guarantee. All rights reserved.

34 | Hong Kong Banking Report 2021
Hong Kong as an IFC and connector
© 2021 KPMG, a Hong Kong partnership and a member firm of the KPMG global organisation of independent member firms affiliated with KPMG International Limited, a private English company limited by guarantee. All rights reserved.
Hong Kong Banking Report 2021 | 35
The increasing connectivity with mainland China provides a significant opportunity for banks in Hong Kong to expand onshoreWith China continuing to open up its financial services sector to foreign investment, international banks are increasingly eyeing the opportunity to expand their presence onshore. Institutions across retail, commercial and investment banking continue to use Hong Kong as an essential base to pursue growth opportunities in mainland China, be it to tap into the Greater Bay Area (GBA) Wealth Management Connect, to connect their clients to the digital ecosystem onshore, or to provide access to domestic capital markets for their international clients.
Retail banking and wealth management The key opportunity for retail banks and wealth managers is the GBA Wealth Management Connect scheme, which will allow mainland Chinese residents in the GBA to invest in eligible investment products in Hong Kong and Macau, and vice versa. Wealth Management Connect has been well received by international banks based in Hong Kong, which consider the scheme a vital part of their growth strategy both for the GBA and mainland China as a whole. Additional details about the scheme, which was first mentioned in a blueprint for the GBA’s development in February 2019, were released in May 2021. The scheme is expected to facilitate a total fund flow of RMB300 billion in terms of investment product sales.
While China still has capital controls, it has in recent years introduced various cross-border trading schemes to gradually open up its markets, allowing mainland investors to diversify their investments. Wealth Management Connect is the latest development to increase financial services connectivity between mainland China and Hong Kong, and is the first cross-border scheme focused solely on the GBA.
Retail banks in the GBA will also continue to enhance connectivity by creating a more seamless banking experience across the region, including through cross-boundary remote account opening, payments and mortgage lending where regulations permit. As authorities in mainland China and Hong Kong continue to drive regulatory reforms with cross-boundary connectivity in mind, we believe that this provides an ever-increasing opportunity for international banks in Hong Kong seeking to expand onshore.
Dickson LeePartnerKPMG China
Edmond TanPartnerKPMG China
As authorities in mainland China and Hong Kong continue to drive regulatory reforms with cross-boundary connectivity in mind, we believe that this provides an ever-increasing opportunity for international banks in Hong Kong seeking to expand onshore.
Hong Kong as an IFC and connector
© 2021 KPMG, a Hong Kong partnership and a member firm of the KPMG global organisation of independent member firms affiliated with KPMG International Limited, a private English company limited by guarantee. All rights reserved. © 2021 KPMG, a Hong Kong partnership and a member firm of the KPMG global organisation of independent member firms affiliated with KPMG International Limited, a private English company limited by guarantee. All rights reserved.
36 | Hong Kong Banking Report 2021
We are seeing increasing interest and activity among banks and financial institutions in Hong Kong in expanding their retail and wealth management presence in mainland China. For example, Amundi’s wealth management joint venture (JV) with BOC was launched in October 2020, marking the first foreign majority-owned company in China allowed to develop and offer wealth management products. Meanwhile, JPMorgan Asset Management announced in March this year that it would take a 10 percent stake – worth RMB 2.7 billion (US$415 million) – in China Merchants Bank’s (CMB) wealth management unit. Goldman Sachs received regulatory approval to set up a majority-owned wealth management JV with ICBC in May, while BlackRock has been given the green light to launch its majority-owned wealth management JV with China Construction Bank and Temasek.
Furthermore, in 2020 HSBC launched HSBC Pinnacle, a new digital platform for wealth planning and insurance services in mainland China, which is currently serving customers in Shanghai, Guangzhou, Shenzhen and Hangzhou. These developments also indicate that foreign institutions are moving beyond institutional clients to serve retail customers as they seek to target the growing number of high-net-worth and mass affluent individuals in mainland China, many of whom are seeking greater product and geographical diversity for asset allocation purposes.
Commercial banking We have observed that many international companies still struggle to connect to the vast digital ecosystem in mainland China in order to effectively serve their customers. The opportunity for international commercial banks lies in their ability to help these companies to plug into the digital ecosystem onshore, and to provide comprehensive transaction banking services and more seamless payments. The international banks that are able to navigate the competitive digital landscape to offer these services to their corporate clients will be best placed for success in mainland China.
In order to better serve their corporate clients onshore, international banks can consider forging partnerships and alliances with domestic financial institutions, fintech firms and other technology players. We have also seen some banks seek to develop their own fintech arm to drive growth and innovation, enhance their service offerings to clients, and ultimately grow their footprint in the market. International banks will also need to bring something to the table in order to successfully partner with other established players in the ecosystem. The setup and growth in China of SC Ventures, a business unit of Standard Chartered, to foster innovation, invest in disruptive fintech and explore alternative business models is one example of an international bank plugging into the digital ecosystem.
In addition to connecting international corporate customers to the digital ecosystem onshore, another opportunity for international commercial banks is to service the mainland Chinese companies that are seeking to establish a presence in Hong Kong as part of their overseas expansion plans. Arguably, some international banks in Hong Kong could do more to support and effectively capitalise on these two-way commercial banking opportunities. In our view, banks should do more on building up their capabilities across a number of areas such as agility, decision-making, as well as business strategy, risk management capabilities, overall investment and resources – in particular around data sharing and data security issues related to plugging into the ecosystem – to effectively capitalise on the commercial banking opportunities on offer.
Hong Kong as an IFC and connector
© 2021 KPMG, a Hong Kong partnership and a member firm of the KPMG global organisation of independent member firms affiliated with KPMG International Limited, a private English company limited by guarantee. All rights reserved.
Hong Kong Banking Report 2021 | 37
Banks that are looking to expand onshore need to fully understand the depth of the competition in the market, and must be clear of their strategy and competitive advantage to be able to service a different type of clientele in a different regulatory and business environment.
Investment bankingHong Kong has long been an attractive centre for fundraising, with a large number of banks competing to service companies seeking to raise capital in the city. There are significant opportunities for banks in Hong Kong to leverage their experience and expertise to help their international clients raise capital in mainland China as part of their onshore expansion plans. Indeed, these companies would ideally want to raise funds onshore in RMB, and therefore the ability to provide this service effectively could provide a significant competitive advantage for international banks.
International investment banks, upon obtaining relevant licences, can really provide a more comprehensive service offering for large companies that are looking to expand and access the capital markets in mainland China. These offerings could include advisory on A-share listings, follow-on listings, fund management, brokerage, bond underwriting and other services offered by a typical investment banking business.
Keys to successUltimately, mainland China – and the GBA in particular – is an increasingly lucrative market for banks in Hong Kong, but it is also a fiercely competitive one. Banks that are looking to expand onshore need to fully understand the depth of the competition in the market, and must be clear of their strategy and competitive advantage to be able to attract local talent and service a different type of clientele in a different regulatory and business environment. As part of this, they should also seek to leverage their international connectivity to fulfil their global clientele’s transaction/funding needs.
The past 12 to 18 months have seen a number of international banks take action to obtain various financial services licences in mainland China. For example, in addition to its 10% investment in CMB’s wealth management arm, JPMorgan agreed to pay RMB 7 billion to acquire full ownership of its fund management company joint venture in China, and launched its majority-owned securities company in March last year. These moves have essentially provided them with access to different licences so that they can offer a wide range of products and services. After they have obtained licences either through new setups or brownfield acquisitions, international banks can start promoting synergies to customers across their product and service offerings. We continue to see several international banks with a sizeable presence in Hong Kong adopt this approach.
The keys to success for international banks in mainland China differ for each institution. But having a clear strategy and exploring all licensing opportunities can certainly place banks on solid footing to target a range of products, channels and customer segments. Forging the right partnerships and alliances in mainland China should also be a key consideration. In addition, the ability of international banks to effectively leverage their brand recognition in Hong Kong, as well as their product, operational, and risk management expertise, will be crucial in helping them to succeed onshore.
Geographical footprint should also be considered – for example, some banks may choose to focus on just Beijing, Shanghai or the GBA, while others may plan to expand nationwide. Whatever the strategy may be, it is vital for banks to ensure that they have the right talent on the ground, combining international best practice expertise from Hong Kong, and local talent in mainland China who have sufficient knowledge of the digital and fintech landscape, strong regulatory relationships and understanding of the regulatory environment, and who fully understand the client and how to do business in China.
© 2021 KPMG, a Hong Kong partnership and a member firm of the KPMG global organisation of independent member firms affiliated with KPMG International Limited, a private English company limited by guarantee. All rights reserved. © 2021 KPMG, a Hong Kong partnership and a member firm of the KPMG global organisation of independent member firms affiliated with KPMG International Limited, a private English company limited by guarantee. All rights reserved.

38 | Hong Kong Banking Report 2021
Hong Kong remains a key springboard for mainland Chinese banks to achieve their global ambitionsAs Chinese companies continue to grow and increase their influence overseas, Chinese banks are seeking to follow their clients and expand their reach abroad, with setting up operations in Hong Kong seen as an important first step.
Looking back five or ten years, Hong Kong had witnessed a flurry of mainland Chinese banks setting up operations in the city as a means to increase their international presence and tap into Hong Kong’s diverse talent pool, access to international companies and investors, and fair and transparent regulatory regime.
While this trend has slowed down somewhat in recent years – partially due to factors such as the onset of Covid-19 and social unrest which deterred or delayed expansion plans – there is still a strong desire among Chinese banks to set up operations in Hong Kong as a first step in expanding their global network and presence. Over the last two years, we have seen banks such as China Bohai Bank, Bank of Dongguan, China Guangfa Bank, Hua Xia Bank and Ping An Bank obtain licences to operate in Hong Kong.
Shifting focus toward Southeast AsiaWhile Chinese banks’ expansion plans had historically focused largely on Europe and Africa, we continue to see a significant shift in strategy and investment towards Southeast Asia. ASEAN overtook the European Union as China’s top trading partner in 2020, with trade volumes hitting RMB 4.74 trillion (US$732 billion). As an increasing number of Chinese companies make a foray into the region – both in sales and manufacturing – Chinese banks hope to follow suit in order to effectively serve their corporate clients.
As an international financial centre, Hong Kong remains both a practical and attractive place for mainland Chinese banks to set up shop as the first step in expanding abroad, including to Southeast Asia. The city’s legal and regulatory system, deep and diverse talent pool, international experience and status as a risk management hub further add to the appeal. Importantly, Chinese banks can also use Hong Kong as a centre to train their employees to familiarise them with international practice and equip them with a global mindset, before taking these learnings abroad to different jurisdictions.
Terence FongPartner, Head of Chinese Banks, Hong Kong KPMG China
While Chinese banks’ expansion plans had historically focused largely on Europe and Africa, we continue to see a significant shift in strategy and investment towards Southeast Asia.
Hong Kong as an IFC and connector
© 2021 KPMG, a Hong Kong partnership and a member firm of the KPMG global organisation of independent member firms affiliated with KPMG International Limited, a private English company limited by guarantee. All rights reserved.
Hong Kong Banking Report 2021 | 39
Evaluating the reasons for expansionMainland China’s banking landscape comprises a wide variety of banking institutions, and their reasons to expand abroad may vary. For example, growth plans for the large state-owned banks may be more government-led or tied to national priorities, while the joint-stock banks might evaluate potential expansion into Hong Kong based on the potential profitability of the venture and the ability to meet the needs of existing customers. After expanding into Hong Kong, they will need to consider whether they can expand into other markets depending on the business needs of their clients. Lastly, the Chinese policy banks may pursue overseas ambitions with the responsibility of providing funding and facilitating the ongoing development of the Belt and Road Initiative.
As the global economy recovers – especially in China and the ASEAN region – we expect a number of these banks that are already operating in Hong Kong to invest more resources to further build up their international capabilities in Hong Kong. These investments may come in the form of additional headcount or a larger physical footprint in Hong Kong, as well as in workforce training and development.
Overall, despite a period of sluggish growth globally, many Asian economies are slowly but surely starting to emerge from the crisis. For Chinese companies, ASEAN is expected to continue to be the primary trading partner and key growth opportunity, with ongoing tensions between the US and China further indirectly driving this trend.
We expect Chinese banks to therefore seek to follow their clients to serve them in the ASEAN market, with the first step involving the setup of new operations – or the expansion of existing operations – in Hong Kong before branching out. The continued expansion overseas in the years to come could see some China banks follow in the footsteps of major players such as Bank of China in expanding their global reach to successfully develop into a regional bank.
As an international financial centre, Hong Kong remains both a practical and attractive place for mainland Chinese banks to set up shop. The city’s legal and regulatory system, deep and diverse talent pool, international experience and status as a risk management hub further add to the appeal.
© 2021 KPMG, a Hong Kong partnership and a member firm of the KPMG global organisation of independent member firms affiliated with KPMG International Limited, a private English company limited by guarantee. All rights reserved. © 2021 KPMG, a Hong Kong partnership and a member firm of the KPMG global organisation of independent member firms affiliated with KPMG International Limited, a private English company limited by guarantee. All rights reserved.
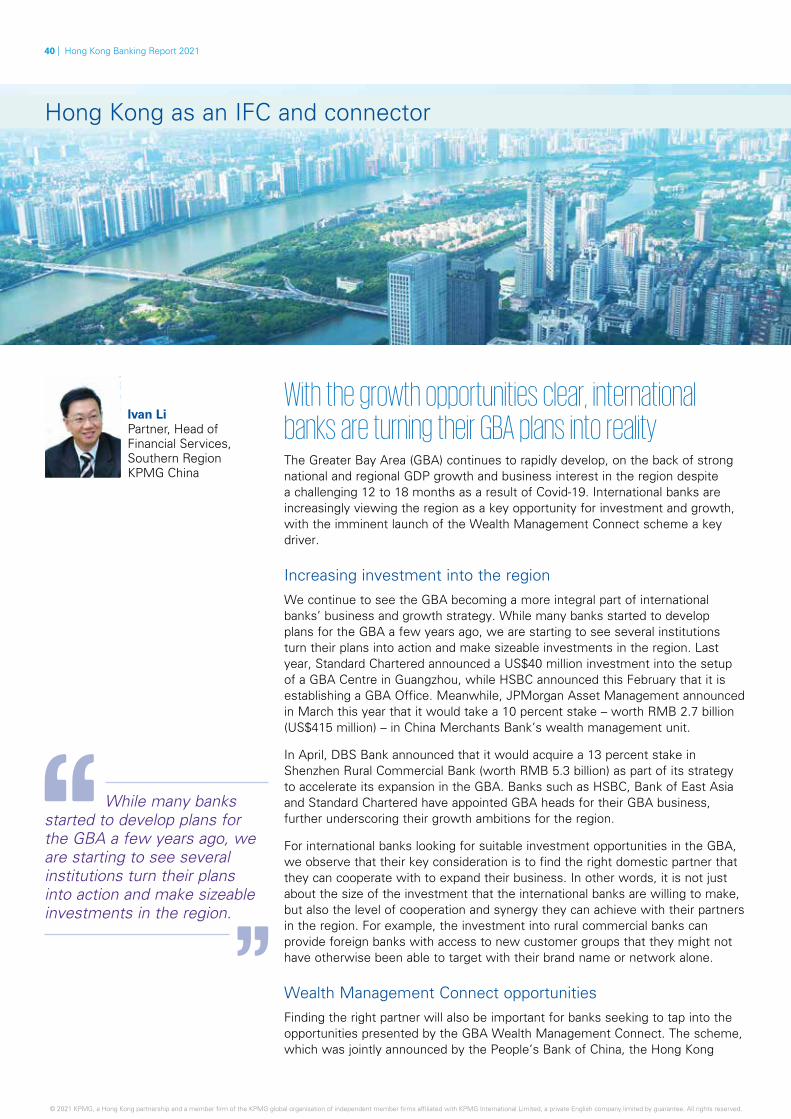
40 | Hong Kong Banking Report 2021
With the growth opportunities clear, international banks are turning their GBA plans into realityThe Greater Bay Area (GBA) continues to rapidly develop, on the back of strong national and regional GDP growth and business interest in the region despite a challenging 12 to 18 months as a result of Covid-19. International banks are increasingly viewing the region as a key opportunity for investment and growth, with the imminent launch of the Wealth Management Connect scheme a key driver.
Increasing investment into the regionWe continue to see the GBA becoming a more integral part of international banks’ business and growth strategy. While many banks started to develop plans for the GBA a few years ago, we are starting to see several institutions turn their plans into action and make sizeable investments in the region. Last year, Standard Chartered announced a US$40 million investment into the setup of a GBA Centre in Guangzhou, while HSBC announced this February that it is establishing a GBA Office. Meanwhile, JPMorgan Asset Management announced in March this year that it would take a 10 percent stake – worth RMB 2.7 billion (US$415 million) – in China Merchants Bank’s wealth management unit.
In April, DBS Bank announced that it would acquire a 13 percent stake in Shenzhen Rural Commercial Bank (worth RMB 5.3 billion) as part of its strategy to accelerate its expansion in the GBA. Banks such as HSBC, Bank of East Asia and Standard Chartered have appointed GBA heads for their GBA business, further underscoring their growth ambitions for the region.
For international banks looking for suitable investment opportunities in the GBA, we observe that their key consideration is to find the right domestic partner that they can cooperate with to expand their business. In other words, it is not just about the size of the investment that the international banks are willing to make, but also the level of cooperation and synergy they can achieve with their partners in the region. For example, the investment into rural commercial banks can provide foreign banks with access to new customer groups that they might not have otherwise been able to target with their brand name or network alone.
Wealth Management Connect opportunitiesFinding the right partner will also be important for banks seeking to tap into the opportunities presented by the GBA Wealth Management Connect. The scheme, which was jointly announced by the People’s Bank of China, the Hong Kong
Ivan LiPartner, Head of Financial Services, Southern Region KPMG China
While many banks started to develop plans for the GBA a few years ago, we are starting to see several institutions turn their plans into action and make sizeable investments in the region.
Hong Kong as an IFC and connector
© 2021 KPMG, a Hong Kong partnership and a member firm of the KPMG global organisation of independent member firms affiliated with KPMG International Limited, a private English company limited by guarantee. All rights reserved.
Hong Kong Banking Report 2021 | 41
Monetary Authority and the Monetary Authority of Macao in June 2020, will enable residents of the mainland Chinese cities in the GBA to invest in eligible investment products in Hong Kong and Macau, and vice versa.
In May, the People’s Bank of China, the Hong Kong Monetary Authority and the Monetary Authority of Macao circulated draft implementation rules for the GBA Wealth Management Connect for comments, and the major mainland China and Hong Kong banks have been actively responding. Hang Seng Bank, Standard Chartered and ICBC have started to prepare for system implementation, product design and risk control, while China Guangfa Bank, China CITIC Bank and Nanyang Commercial Bank have worked with system vendors on IT systems for the scheme.
With the successful launch of Wealth Management Connect potentially leading to further enhancements and relaxations, the scheme offers longer-term growth opportunities for banks in the region. This is particularly important as wealth management activities can help banks to generate new sources of income amid a prolonged low interest rate environment.
Exploring partnerships with fintech firmsWe expect to see increasing investment and more partnerships between international banks and fintech players in the GBA, leveraging Shenzhen’s status as a key innovation and technology hub. For example, last January Standard Chartered made a strategic investment in Shenzhen-headquartered supply chain finance fintech firm Linklogis, which then launched an IPO in Hong Kong in April this year.
Investment in fintech is another option for international banks looking to expand in the GBA. The need to implement a comprehensive digital strategy should be a key consideration for international banks given their lack of a significant physical footprint in mainland China, the high costs of acquiring a physical presence, as well as customers’ strong preference for advanced digital capabilities. In fact, we believe that alliances between international banks and fintech firms could be pivotal in determining banks’ success, especially as many of the Chinese banks have already invested heavily in their digital transformation and technology solutions.
The competition for talentWith expansion plans for the region becoming a reality, international banks are also seeking to recruit and relocate talent to support their growth strategy. Several banks in Hong Kong have announced their intent to scale up their headcount in the GBA, as well as offering graduates work experience opportunities in the region as part of the Hong Kong Government’s Greater Bay Area Youth Employment Scheme. With a key goal of the GBA initiative to facilitate the free movement of people, living and working in the region will become both easier and more attractive for talent.
Demand is high and talent shortages remain, however, as banks compete to find the right people who truly understand the regulatory and business environment to help their businesses thrive.
With the GBA continuing to develop and offer more tangible growth opportunities for the banking industry, we expect more international banks to use the year ahead to invest heavily in their capabilities in the region to set themselves up for long-term success.
We expect to see increasing investment and more partnerships between international banks and fintech players in the GBA, leveraging Shenzhen’s status as a key innovation and technology hub.
© 2021 KPMG, a Hong Kong partnership and a member firm of the KPMG global organisation of independent member firms affiliated with KPMG International Limited, a private English company limited by guarantee. All rights reserved. © 2021 KPMG, a Hong Kong partnership and a member firm of the KPMG global organisation of independent member firms affiliated with KPMG International Limited, a private English company limited by guarantee. All rights reserved.

42 | Hong Kong Banking Report 2021
Regulation
© 2021 KPMG, a Hong Kong partnership and a member firm of the KPMG global organisation of independent member firms affiliated with KPMG International Limited, a private English company limited by guarantee. All rights reserved.
Hong Kong Banking Report 2021 | 43
Managing conduct in the digital sales world – a new challenge for banksThere is little doubt that the Covid-19 pandemic has led to the proliferation of online platforms among traditional banks – which is also making them more competitive against virtual banks on the digital front – evidenced by the significant trading volumes experienced in 2020. However, the rapid adoption and consumption of banking products and services digitally has created new risks and heightened existing risks, such as conduct risk.
Conduct has long been a key area of regulatory focus. In recent history, the Global Financial Crisis was a turning point that spurred the introduction of robust investor protection measures and heightened regulatory scrutiny worldwide and in Hong Kong. The increasing importance of conduct was further highlighted in the Final Report of the Australian Royal Commission into Misconduct in the Banking, Superannuation and Financial Services Industry, which identified dishonesty and greed as the two main drivers behind misconduct. Banking regulations on the fair treatment of customers – such as the Treat Customers Fairly Charter in Hong Kong – have also served to reinforce the regulatory focus on conduct to customers.
The shift to digitalThe shift from offline to online continues to rapidly evolve, with conduct risk in the digital space becoming a fast-increasing area of focus. For example, one of the four strategic priorities in the Financial Conduct Authority’s business plan for 2020/21 is to deliver fair value in a digital age. The intended outcomes are to enable consumers to choose from products that meet their needs at a suitable quality and price, for digital innovation and competition to support greater value for consumers, and to ensure that vulnerable consumers are not exploited or targeted with poor value products and services, and access to key products and services is fair.
In Hong Kong, regulators have also sought to keep up with the pace of change over the past few years, with the Securities and Futures Commission (SFC) issuing its Guidelines on Online Distribution and Advisory Platforms in July 2019. The Guidelines identify six core principles which platform operators should comply with in the operation of their online platforms, and reiterate the importance of compliance with all conduct requirements. Hong Kong’s regulators have also reiterated their focus on individual accountability and ensuring that managers-in-charge are actively involved in promoting the right culture throughout the organisation to manage conduct risk.
Jeffrey HauPartner, Risk ConsultingKPMG China
Regulation
© 2021 KPMG, a Hong Kong partnership and a member firm of the KPMG global organisation of independent member firms affiliated with KPMG International Limited, a private English company limited by guarantee. All rights reserved. © 2021 KPMG, a Hong Kong partnership and a member firm of the KPMG global organisation of independent member firms affiliated with KPMG International Limited, a private English company limited by guarantee. All rights reserved.
44 | Hong Kong Banking Report 2021
Part of the regulators’ focus on conduct and overall supervisory activities includes their ambition to develop and deploy more Suptech solutions. We believe the future of managing conduct risk for regulators will be through the use of Suptech and other technologies. This will have implications for banks around how they manage their data – and the skill sets they look for in their workforce – to ensure that they can prepare more real-time and granular information and reporting for regulators.
Striking the right balanceWhile the increasing regulatory focus has helped to shine a spotlight on conduct and has enhanced compliance, one outcome of these increased requirements is that the actual provision of products could become narrower. This is primarily due to banks’ drive to strike the right balance between maintaining compliance and driving business. From a digital perspective, providing suitability via a digital methodology – without any human judgement or input – could actually have the effect of limiting the number of suitable products, which may not ultimately be beneficial to customers and the banks themselves.
We believe that there is therefore an increased need for financial institutions to find the right balance to offer the right products to customers while meeting compliance obligations. Banks could also seek to offer products that provide smarter robo-advisory. This is an area where we have seen relatively low take-up among banks in Hong Kong. While there are advanced robo-advisory firms in the market, there may be some hesitation from banks’ compliance departments to go down that path, or customers might not be fully ready to accept robo-advice. Other reasons could be that there seems to be some resistance to moving into more portfolio-based suitability – which is best suited to robo-advisory – either because regulations are largely principle-based, more technology is needed to better manage clients’ portfolios, or because Hong Kong has traditionally charged on a trade commission basis rather than a portfolio basis. It is therefore possible that the slower movement to portfolio-based suitability in Hong Kong may be a reason for the slower take-up in robo-advisory compared to other financial centres.
The future of managing conduct risk for regulators will be through the use of Suptech and other technologies. This will have implications for banks around how they manage their data – and the skill sets they look for in their workforce – to ensure that they can prepare more real-time and granular information and reporting for regulators.
Regulation
© 2021 KPMG, a Hong Kong partnership and a member firm of the KPMG global organisation of independent member firms affiliated with KPMG International Limited, a private English company limited by guarantee. All rights reserved.
Hong Kong Banking Report 2021 | 45
Banks can better serve their clients and minimise conduct risk by innovating their approach to investment selling through the digitalisation and automation of suitability.
Suitability 2.0 and managing regulatory obligationsWe also firmly believe that banks can better serve their clients and minimise conduct risk by innovating their approach to investment selling through the digitalisation and automation of suitability. This approach – which we define as ‘Suitability 2.0’ – can help increase efficiency, strengthen compliance and enable enhanced monitoring and reduction of mis-selling activities. Suitability 2.0 can also help to drive sales and improve profitability, shorten the lead time for product due diligence, improve execution speed, and provide greater accuracy over suitability assessments.
Taking a more digitalised and automated approach to suitability and implementing a robust sales suitability framework can help banks to reduce mis-selling, minimise conduct risk, manage conflicts of interest, and gain an overall competitive edge in the market.
Another key challenge for banks is not knowing the full extent of all their regulatory obligations. While conduct is one obligation, a lack of a comprehensive understanding of all requirements banks are subject to can also lead to lapses in conduct. Conduct traditionally comprised both human conduct (largely related to culture) and controls (whether banks have the ability to control the right conduct). But with the proliferation of online platforms and technology-enabled solutions, banks now have to understand obligations in a digital context. Banks need to pay careful attention to issues such as biases in artificial intelligence algorithms and data privacy, and the resulting impact these could have on conduct risk.
Looking ahead, the effects of the Covid-19 pandemic will continue to reshape ways of working and investing – online sales activity is expected to continue to increase, and we expect to see more use of robo-advisors, online platforms and discretionary portfolios. Given this trend, it is important that regulations keep up with the rapid pace of change. Conduct in the digital sales world will continue to be a key area of focus for regulators, and banks should ensure that they strike the right balance between selling the right products to customers and managing their regulatory and compliance obligations, which includes conduct risk. Getting this right for banks will not only help them manage risk, but it can also ultimately lead to better client outcomes and enable them to gain a competitive edge.
© 2021 KPMG, a Hong Kong partnership and a member firm of the KPMG global organisation of independent member firms affiliated with KPMG International Limited, a private English company limited by guarantee. All rights reserved. © 2021 KPMG, a Hong Kong partnership and a member firm of the KPMG global organisation of independent member firms affiliated with KPMG International Limited, a private English company limited by guarantee. All rights reserved.
46 | Hong Kong Banking Report 2021
Regulatory areas of focus are shifting to combat new and emerging risks for banks in the new reality The onset of Covid-19 and the global economy’s prolonged path to recovery have changed the nature of work and transformed business and operating models across industries and markets. The pandemic has also exacerbated certain existing risks and given rise to new risks, leading to heightened regulatory focus on a number of areas as authorities around the world strive to keep pace with the rapidly changing environment. Some regulatory developments are global or regional in nature, while others are more specific to Hong Kong, but all will have a significant impact on the future of banking.
In this article, we highlight key regulatory areas that banks in Hong Kong should focus on in the coming years. Many other important themes are covered in other sections of this report, including environmental, social and governance (ESG) and climate risk, model governance, LIBOR, financial crime and tax.
Managing Covid-related risksThe pandemic has exposed banks to increased risks as a majority of the workforce shifted to remote working, and operations and shared service centres were disrupted. The socioeconomic impact of Covid-19 has also opened the door to increased conduct risk and fraud.
An International Organization of Securities Commissions (IOSCO) paper on its priorities for 2021-2022 echoes this trend of an increasing focus on Covid-related risks relating to misconduct, operational resilience and fraud.34 It also notes that the rapid growth in digitalisation, especially via social media, has radically changed how financial products are marketed and distributed, providing new opportunities for domestic and cross-border offerings. Indeed, we continue to see the boundaries becoming blurred as people increasingly obtain access to financial products across jurisdictions. Addressing and mitigating the risks posed by online cross-border marketing and distribution of financial products will be a key area of focus for regulators, especially as the world continues to become more digitally connected.
Notably, there has been a boom in online activity as a result of the shift toward work from home and remote working arrangements, which has opened the door to increased cyber risk and data privacy issues.
34 ‘IOSCO Board Priorities – Work Program 2021-2022’, IOSCO, February 2021, https://www.iosco.org/library/pubdocs/pdf/IOSCOPD673.pdf
Jianing Song Partner, Head of Banking Advisory Hong Kong KPMG China
Tom JenkinsPartner, Head of Financial Risk ManagementKPMG China
Regulation
© 2021 KPMG, a Hong Kong partnership and a member firm of the KPMG global organisation of independent member firms affiliated with KPMG International Limited, a private English company limited by guarantee. All rights reserved.
Hong Kong Banking Report 2021 | 47
The more time spent at home and online, coupled with individuals seeking to invest their excess disposable income and capitalise on market volatility, have also led to increased levels of trading activity. This surge in retail investing activity has also in some instances resulted in some unexpected outcomes, evidenced by GameStop’s recent share price spike in the US. These types of market incidents are causing regulators worldwide – including in Hong Kong – to pay more attention to issues around market manipulation and misconduct. These incidents are also putting issues related to client transparency, best execution and conflicts of interest firmly under the microscope with regard to the business models of commission-free stock trading apps that many retail investors have been using. While the apps were offered to retail investors free of charge, they might not have been transparent as to how they make their money – which is often from the churning of transactions – which may not be in the best interest of the customer.
There are also concerns around what happened in the aftermath of the GameStop incident, where brokerage platforms experienced service disruptions and placed restrictions on trading, leading to lawsuits that allege that the apps deprived investors of gains, manipulated the market and acted in bad faith.
Strengthening operational resilienceWe will continue to see a significant focus on operational resilience going forward. Covid-19, ongoing market volatility and evolving client expectations and ways of working highlight the need to be prepared for the possibility of multiple scenarios and their potential implications on banks’ operational resilience. For example, lockdowns imposed in certain service centre jurisdictions due to the pandemic are likely to have impacted banks’ ability to provide undisrupted core services for periods of time.
While there have been some principles for operational resilience recently issued by the Basel Committee on Banking Supervision in March 2021, we expect the regulators in Hong Kong to start to introduce their own requirements around the measurement of operational resilience-related risks and how to manage those risks. Regulators will undoubtedly expect improved operational resiliency capabilities and for operational resilience to be embedded across all management decisions and business activities.
Reassessing the effectiveness of OTC derivatives regulationOTC derivatives regulations were introduced after the Global Financial Crisis to address some of the systemic risks arising from these instruments. Key measures that have been introduced by many jurisdictions include mandatory reporting regulations to provide regulators with greater transparency on the OTC derivative-related exposures taken by market participants, and mandatory clearing regulations which require certain categories of standard contracts to be cleared through a Central Counterparty thereby reducing the risk of default. Measures also include margin requirements for non-centrally cleared OTC derivatives, which also seek to address the credit risk arising from OTC derivatives through requiring market participants to exchange initial and variation margin. Finalisation and implementation of these regulations has been a complex multi-year endeavour, with a number of requirements phased in to provide market participants with sufficient time to prepare for the changes required to systems, processes and internal controls. Further delays resulted from the Covid-19 pandemic as timelines were adjusted to account for the additional operational challenges faced by financial institutions.
We expect the regulators in Hong Kong to start to introduce their own requirements around the measurement of operational resilience-related risks and how to manage those risks. Regulators will undoubtedly expect improved operational resiliency capabilities and for operational resilience to be embedded across all management decisions and business activities.
© 2021 KPMG, a Hong Kong partnership and a member firm of the KPMG global organisation of independent member firms affiliated with KPMG International Limited, a private English company limited by guarantee. All rights reserved. © 2021 KPMG, a Hong Kong partnership and a member firm of the KPMG global organisation of independent member firms affiliated with KPMG International Limited, a private English company limited by guarantee. All rights reserved.
48 | Hong Kong Banking Report 2021
The recent losses incurred by a number of financial institutions arising from total return swap positions taken by Archegos have prompted regulators to reassess the scope and effectiveness of the OTC derivative regulations. Questions are being asked about the effectiveness of the margin requirements for non-centrally cleared OTC derivatives, including their ability to address risks posed by market participants such as family offices which may fall outside the scope of the existing requirements. The Archegos case is also likely to cause regulators to further examine how they use the data collected by trade repositories through the mandatory reporting obligation. Greater emphasis on the investigation of early warning signals and red flags may be one outcome of this case, and this may require some changes to the existing reporting requirements. Overall, these recent events have put the spotlight once again on the OTC derivatives market and dispelled any notion that the risks inherent in this product class had been fully addressed by the post-crisis reforms.
Evolving cyber threat landscapeThe proliferation of digital platforms, including online banking and rapid fintech and third party adoption and cloud deployment, is also exacerbating cyber threats. As people worldwide continue to plug in to the latest technologies for both work and leisure, this is creating more vulnerabilities for cyber criminals to exploit. Recent events such as the SolarWinds cyber attack and the Microsoft Exchange server hack further underscore how cyber risks continue to grow and the profound impact cyber incidents can have in an increasingly digital world.
The growing number of potential points of attack for cyber criminals and the damage that can be caused will continue to be a key focus area for regulators in Hong Kong, and should prompt banks to rethink and bolster their cyber risk management and fully integrate this into their overall enterprise risk management framework. The ability to strengthen cyber resilience to keep pace with the increased regulatory focus and fast evolving cyber threat landscape will be key to banks’ long-term success.
Conduct risk and Hong Kong’s investor identification regimeThere has been a focussed effort on the part of the regulators in Hong Kong to preserve market integrity and prevent market abuse and misconduct. For example, in December last year, the Securities and Futures Commission (SFC) issued a consultation paper on the introduction of an investor identification (ID) regime to help the regulator detect suspicious trading activities and potential market misconduct in a more timely and efficient manner.
The investor ID regime, which would be in line with developments in jurisdictions such as the US, Europe, Australia, Singapore and mainland China, would enable the SFC to quickly obtain information about investors who place orders, and improve the regulator’s market surveillance activities.
The investor ID regime, which is expected to be introduced in early 2022, also forms part of a broader trend of Hong Kong’s regulators applying supervisory technology (Suptech) to generate more information and supporting analytics to enhance their supervisory activities.
Recent events have put the spotlight once again on the OTC derivatives market and dispelled any notion that the risks inherent in this product class had been fully addressed by the post-crisis reforms.
Regulation
© 2021 KPMG, a Hong Kong partnership and a member firm of the KPMG global organisation of independent member firms affiliated with KPMG International Limited, a private English company limited by guarantee. All rights reserved.
Hong Kong Banking Report 2021 | 49
The emergence of virtual assets and central bank digital currenciesMarket interest in virtual assets continues to increase, with more banks and other regulated financial institutions looking to tap into this space. This is also a growing area of interest for Hong Kong’s regulators, with the SFC introducing new licensing requirements for virtual asset trading platforms and taking steps to include virtual assets under its regulatory purview.
Another key trend is the significant interest among governments and central banks around the world in exploring central bank digital currencies (CBDC). At the beginning of 2020, only 20 to 30 governments around the world were seriously considering developing a CBDC. Today, more than 70 jurisdictions across both emerging and established economies are engaged in CBDC research projects or pilot programmes.35
In September 2019, the Hong Kong Monetary Authority and the Bank of Thailand launched a joint initiative – known as Project Inthanon-LionRock – to explore how CBDC can be applied to facilitate cross-border HKD-THB payments between banks in Hong Kong and Thailand. The second phase of the project was launched in February this year to include the Digital Currency Institute of the People’s Bank of China and the Central Bank of the United Arab Emirates.
We expect to see more developments and activity in the CBDC space in Hong Kong and the rest of Asia in the year ahead. The goal of using CBDC is to enable real-time cross-border transactions and provide policymakers with more real-time and granular visibility into monetary flows in the economy. Central banks and regulatory authorities will also need to strike the right balance between generating more granular and real-time data, and appropriately managing data privacy and data transfer considerations.
Implications of global relationshipsRelations between the US and China, as well as new regulatory developments for technology companies in mainland China are going to continue to have ramifications for Hong Kong’s economy and banking industry.
Furthermore, in March this year, the US Securities and Exchange Commission enacted a law which could increase the auditing requirements for Chinese companies, and allows the regulator to delist companies that fail to comply with the rules. This is likely to have a significant impact on some US-listed Chinese companies in the coming years, and could have knock-on implications for the Hong Kong bourse as firms seek out other markets outside of the US to raise capital.
Separately, there has been increased regulatory scrutiny of large technology firms operating in financial services, or ‘TechFins’, in mainland China. This clampdown on monopolistic practices is expected to continue, and will likely alter the market landscape in mainland China and Hong Kong as the TechFins amend their business models and reassess the links between their payment arms and financial products to comply with the regulations.
The investor ID regime forms part of a broader trend of Hong Kong’s regulators applying Suptech to generate more information and supporting analytics to enhance their supervisory activities.
35 ‘Banking blueprint for the crypto world’, KPMG, 2021, https://advisory.kpmg.us/articles/2021/banking-blueprint-for-crypto-world.html
© 2021 KPMG, a Hong Kong partnership and a member firm of the KPMG global organisation of independent member firms affiliated with KPMG International Limited, a private English company limited by guarantee. All rights reserved. © 2021 KPMG, a Hong Kong partnership and a member firm of the KPMG global organisation of independent member firms affiliated with KPMG International Limited, a private English company limited by guarantee. All rights reserved.
50 | Hong Kong Banking Report 2021
Ongoing economic uncertainty and the increasing use of artificial intelligence calls for more robust model governanceThe unpredicted economic impacts of Covid-19 and the increasing use of artificial intelligence (AI) models are highlighting the importance of robust model governance to banks in Hong Kong.
The fallout from Covid-19Model governance is not a new topic – it has been an area of focus for many banks for some time. However, the onset of Covid-19 and the economic disruption it has wrought has re-emphasised the importance of strong model governance.
For many banks, their existing models have been calibrated according to economic data that was based on pre-pandemic conditions. Then in a very short period of time, Covid-19 caused significant and unpredicted movements in areas such as unemployment, government relief measures and overall economic activity.
These rapidly changing economic circumstances mean that many of the underlying assumptions on which the models were based on are no longer valid. This has impacted a whole range of models, such as liquidity risk models, as assumptions around outflows and inflows were challenged by the economic conditions, market risk models as the pandemic impacted market liquidity, and credit risk models as government relief measures and other relief schemes potentially masked underlying credit risk.
With many models operating in economic and market conditions which are very different to those for which they were calibrated, it is therefore crucial that banks have a control framework that can address the resulting impact on the reliability of the model results.
Banks should ensure that they have an established model risk management framework with clearly defined roles and responsibilities across all three lines of defence. It is also important for the framework to have appropriate escalation mechanisms, and that decisions that are made around adjustments to the model output are subject to the right degree of challenge and review.
Tom JenkinsPartner, Head of Financial Risk ManagementKPMG China
For many banks, their existing models have been calibrated according to economic data that was based on pre-pandemic conditions. Then in a very short period of time, rapidly changing economic circumstances mean that many of the underlying assumptions on which the models were based on are no longer valid.
Regulation
© 2021 KPMG, a Hong Kong partnership and a member firm of the KPMG global organisation of independent member firms affiliated with KPMG International Limited, a private English company limited by guarantee. All rights reserved.
Hong Kong Banking Report 2021 | 51
The increasing use of AI modelsWe are also seeing more use of AI models to help banks respond faster to and better predict Covid-19 impacts and other economic changes with more certainty. However, the emergence of AI solutions also raises a number of challenges for banks around model governance.
There have been instances where issues in AI models produced outcomes that have created risks for institutions. For example, an AI model that exhibits a bias towards credit decision-making and favours certain sections of the population over others can create unwanted reputational risk and conduct risk for banks. This calls for a thorough examination into the integrity of AI algorithms and the validity of the data that is going into the models.
There is also a challenge around the ‘explainability’ of AI models. There needs to be transparency, and those who are responsible for the governance of the model need to be able to understand the algorithmic decision-making process and explain the output of the model.
Banks that are increasingly deploying AI need to closely examine their model governance arrangements and make sure they are fit for purpose to address the specific challenges around the use of AI models. This involves ensuring that the AI models are fair, ethical and free from bias or prejudice, and that they are resilient in terms of technical robustness and compliance.
Ensuring accountabilityAccountability for AI is also a key focus area for Hong Kong’s regulators. For example, in 2019 the Hong Kong Monetary Authority issued guidance on the use of AI models and reminded institutions that their board of directors is still ultimately accountable for any decisions they make based on AI models. Furthermore, in the Securities and Futures Commission’s (SFC) latest annual report the regulator highlighted that a key focus area is the use of mathematical models in business decision-making. This is a clear signal to financial institutions that the SFC is going to be more focused on AI model governance.
Ultimately, increasing regulatory scrutiny and the heightened risks arising from outdated models and the increased use of AI mean that it is essential for banks to refocus their efforts in ensuring robust model governance. Importantly, trust is imperative in enabling AI models to really take flight. Getting the key principles of integrity, explainability, fairness and resilience right – enabled through governance – can help banks increase operational efficiency, minimise risk, gain a competitive advantage and safeguard trust among key stakeholders.
Banks that are increasingly deploying AI need to closely examine their model governance arrangements and make sure they are fit for purpose to address the specific challenges around the use of AI models. This involves ensuring that the AI models are fair, ethical and free from bias or prejudice, and that they are resilient in terms of technical robustness and compliance.
© 2021 KPMG, a Hong Kong partnership and a member firm of the KPMG global organisation of independent member firms affiliated with KPMG International Limited, a private English company limited by guarantee. All rights reserved. © 2021 KPMG, a Hong Kong partnership and a member firm of the KPMG global organisation of independent member firms affiliated with KPMG International Limited, a private English company limited by guarantee. All rights reserved.
52 | Hong Kong Banking Report 2021
With the end of LIBOR on the horizon, banks should accelerate their efforts to ready themselves for the transitionWith less than one year remaining before LIBOR is due to end (except for certain USD Libor tenors), banks have made good progress on the transition to the new rate regime. But, despite receiving a slight reprieve on the timeline for the phasing out of LIBOR-linked products, banks in Hong Kong still need to accelerate their preparations to implement a comprehensive programme for the transition toward alternative reference rates (ARRs).
Industry developmentsIn March this year, the UK Financial Conduct Authority (FCA) confirmed the cessation of LIBOR settings for all sterling, euro, Swiss franc, Japanese yen and the 1-week and 2-month US dollar settings. The remaining US dollar LIBOR settings will continue to be published for an additional 18 months until 30 June 2023. But market participants should not look at this as a greenlight to execute new trades or deals referenced to LIBOR out until June 2023.
Michael MontefortePartner, Financial Risk ManagementKPMG China
Updates to LIBOR timelines:
• 1 January 2022: All existing GBP, EUR, CHF, JPY and USD 1-week and 2-month LIBOR tenor rates expected to cease publication.
- All new products should be changed to ARR-referenced
- Migration for all legacy products referencing to LIBOR currencies apart from the selected USD LIBOR tenors should be completed.
• 30 June 2023: Proposed extension of overnight, 1-month, 3-month, 6-month and 12-month USD LIBOR tenor rates to be published until 30 June 2023.
- The potential extension for the selected USD LIBOR tenors may relieve some stress for the industry to migrate tough legacy contracts. However, it should not affect the overall transition timeline for new product development.
Regulation
© 2021 KPMG, a Hong Kong partnership and a member firm of the KPMG global organisation of independent member firms affiliated with KPMG International Limited, a private English company limited by guarantee. All rights reserved.
Hong Kong Banking Report 2021 | 53
According to the Hong Kong Monetary Authority (HKMA), as of December 2020 there were HK$4.5 trillion of assets and HK$1.4 trillion of liabilities referencing LIBOR in the Hong Kong banking system, representing about 28% and 9% respectively of the industry’s foreign currency denominated assets and liabilities.36 The banking industry also had derivatives contracts totalling HK$30.7 trillion in notional value referencing LIBOR. 27% of these LIBOR-linked assets and liabilities, and 9% of these derivatives contracts would mature after the phasing out of LIBOR and did not have adequate fallback provisions.
These figures have decreased significantly in the last quarter of 2020, indicating that banks in Hong Kong are making progress in positioning themselves to offer ARR products, and in including adequate fall-back provisions to all newly issued LIBOR-linked contracts that will mature after 2021.
A third transition milestone developed by the HKMA and the Treasury Markets Association (TMA) last July – that by the end of June 2021 banks should cease to issue new LIBOR-linked products that will mature after 2021 – was deemed no longer appropriate in light of the updated LIBOR cessation timeline. The HKMA and TMA have pushed back this deadline to the end of 2021, allowing an additional 6-month period for banks to switch to offering relevant ARR products by the end of 2021.
Hong Kong banks’ readinessWe have observed that several banks in Hong Kong are in a position to offer products referencing the new ARRs in terms of their contract preparation and system readiness. New contract templates referencing ARRs have been finalised and adequate fallback provisions have been drafted and are starting to be included in newly issued LIBOR contracts.
Banks have engaged in bank-wide internal training in recent months for front, middle and back office staff, covering the overall transition background, interest calculation, system upgrades and contract amendments. There has also been some movement in establishing a bank-wide communication plan to increase awareness among clients and the public.
What should banks do?The adjusted timeline until the end of 2021 allows more time for banks to structure and refine their ARR products in terms of contract readiness, pricing models, operational and system upgrades and risk management aspects. However, as suggested by the HKMA, banks should not slow down their preparations around legacy LIBOR contract migration, renegotiation and new ARR product issuances, and should continue to proactively reach out to existing customers to ensure a timely and smooth transition.
We believe that a key focus for the months ahead should be on increasing staff and client awareness of the LIBOR changes. It is likely that not all staff have the same level of awareness about the transition – for example, many banks have not provided adequate training to frontline staff, which may expose their organisations to increased conduct risk. For example, a lack of awareness and training of frontline staff could lead to issues around transparency and treating customers fairly during the contract amendment process if staff are not equipped or encouraged to ensure that their clients understand the process, the different pricing options and contract amendment approaches, and their potential impacts.
We have observed that several banks in Hong Kong are in a position to offer products referencing the new ARRs in terms of their contract preparation and system readiness. New contract templates referencing ARRs have been finalised and adequate fallback provisions have been drafted and are starting to be included in newly issued LIBOR contracts.
36 HKMA, https://www.hkma.gov.hk/eng/key-functions/banking/banking-regulatory-and-supervisory-regime/reform-of-interest-rate-benchmarks/
© 2021 KPMG, a Hong Kong partnership and a member firm of the KPMG global organisation of independent member firms affiliated with KPMG International Limited, a private English company limited by guarantee. All rights reserved. © 2021 KPMG, a Hong Kong partnership and a member firm of the KPMG global organisation of independent member firms affiliated with KPMG International Limited, a private English company limited by guarantee. All rights reserved.
54 | Hong Kong Banking Report 2021
Banks should therefore act quickly to implement a comprehensive bank-wide communication plan and relevant training activities for each of the main stakeholder groups to mobilise the organisation and to minimise operational, conduct and reputational risk. This includes increasing internal awareness and education to key front, middle and back office employees around the latest market updates and industry standards, and training frontline relationship managers on suitable client outreach and contract negotiation procedures. Externally, banks should seek to assess their conduct risk framework with regard to the LIBOR transition, develop a client outreach strategy, and respond quickly to regulator queries on their communication plan and corresponding action items. Importantly, active senior management support and involvement is crucial in order to effectively cascade the strategy across the organisation.
How should institutions be approaching client outreach?
• It starts with executive communication from senior management
• Create internal awareness and education material and provide training to key front, middle and back office stakeholders regarding market updates and industry standards
• Dynamic revision of LIBOR transition plans based on regulatory and market changes
• Analyse training needs, content refresh, infrastructure needs and updated communication strategies
• Provide continuous training for frontline relationship managers on client outreach and contract negotiation
• Communication letters/websites for customers, FAQs and playbooks
• Establish a hotline for client queries
Ultimately, banks should not be deterred by the adjusted timeline and instead push ahead with their preparations for the LIBOR transition. Those that are fully prepared for the transition by the end of this year will be best placed to offer their clients a wider range of ARR products while managing related conduct, operational, risk management and reputational risk, thus gaining a competitive edge in the market.
As suggested by the HKMA, banks should not slow down their preparations around legacy LIBOR contract migration, renegotiation and new ARR product issuances, and should continue to proactively reach out to existing customers to ensure a timely and smooth transition.
Regulation
© 2021 KPMG, a Hong Kong partnership and a member firm of the KPMG global organisation of independent member firms affiliated with KPMG International Limited, a private English company limited by guarantee. All rights reserved.

Hong Kong Banking Report 2021 | 55
Imminent changes to operational taxes provide a significant opportunity for the industry to digitise, modernise and simplify processesWith a number of new developments relating to operational taxes expected in Hong Kong this year, there is a significant opportunity for the market participants to modernise processes, improve efficiency and make headway in discussions to further develop the securities market and broader financial services industry.
Foreign withholding tax and stamp duty changes on the horizonIn the operational tax space, withholding taxes remain a key focus area in Hong Kong. While Hong Kong generally does not impose withholding taxes on interest, dividends or capital gains, banks in the city often bear the brunt of foreign withholding taxes both on their own account and on behalf of customers.
We have also seen challenges resulting from the change in the Inland Revenue Department’s assessing practice related to the claiming of tax credits for foreign withholding taxes, or at least receiving a deduction for those taxes suffered. This has created unnecessary uncertainty for the banking sector, although at the time of writing, legislation is expected to come into effect. This should provide greater clarity, and more explicitly should move Hong Kong back to a position whereby at the very least banks can claim a deduction for the foreign withholding taxes that they face where that income is subject to tax in Hong Kong.
Nonetheless, banks should seek to optimise their withholding tax position, and can achieve this by first identifying which withholding taxes they are subject to, then ensuring that they suffer the minimum leakage offshore and receive the maximum benefit for the tax suffered in Hong Kong. Key to this is often ensuring that the administrative requirements in order to benefit from reduced withholding tax rates are complied with, often through the provision of a tax residency certificate and completing other forms for the payer jurisdiction.
John TimpanyPartner, Head of Tax, Hong KongKPMG China
Matthew FenwickPartner, Corporate Tax Advisory KPMG China
© 2021 KPMG, a Hong Kong partnership and a member firm of the KPMG global organisation of independent member firms affiliated with KPMG International Limited, a private English company limited by guarantee. All rights reserved. © 2021 KPMG, a Hong Kong partnership and a member firm of the KPMG global organisation of independent member firms affiliated with KPMG International Limited, a private English company limited by guarantee. All rights reserved.
56 | Hong Kong Banking Report 2021
Regulation
By revisiting the calculations that banks adopt in their Hong Kong tax computation, they can seek to maximise tax credits or deductions for foreign withholding tax. Banks can also leverage relevant technologies and solutions to enable them to better identify tax preferred products, understand their position, mitigate the downside and maximise the upside.
Another key area of operational tax that is very relevant in Hong Kong – and where we have seen new developments – is around stamp duty. Initially proposed in the Hong Kong Budget for 2021-2022, the Government has gazetted a bill to increase the rate of Stamp Duty on Stock Transfers from 0.1 percent to 0.13 percent of the value of each transaction. The bill is expected to take effect from 1 August this year.
While the rate increase may not seem significant for banks, the intermediary role they play involves taking principal positions in many trades, which will therefore lead to an increase in their costs. In fact, we continue to observe that many banks are facing challenges in dealing with all of their stamp duty obligations, which in some cases has led to the imposition of significant unanticipated stamp duty costs and material penalty exposure. Sometimes this is simply from an administrative point of view, but other times it is due to a more substantive failing. Regardless, in a scenario where penalties amounting to 10 times the amount of stamp duty are potentially applicable where there is a failure to appropriately comply with obligations, an increase in the stamp duty rate from 0.1 percent to 0.13 percent is going to magnify costs materially.
Banks should seek to optimise their withholding tax position, and can achieve this by first identifying which withholding taxes they are subject to, then ensuring that they suffer the minimum leakage offshore and receive the maximum benefit for the tax suffered in Hong Kong.
© 2021 KPMG, a Hong Kong partnership and a member firm of the KPMG global organisation of independent member firms affiliated with KPMG International Limited, a private English company limited by guarantee. All rights reserved.
Hong Kong Banking Report 2021 | 57
Opportunity to digitise and modernise processesOn the other side of the coin, in anticipation of the uplift in the stamp duty rate, there is a view that some of the burdensome and manual administrative requirements that are imposed upon the banks that manage the collection of tax on behalf of the Exchange and Stamp Office could be simplified. Indeed, a lot of the administrative processes are from a less digitised era. Original forms are often required in many cases, as are wet signatures, original certified copies of documentation and payments by cheque. We continue to see significant exposures emerge due to relatively simple administrative errors or failings, which in our view is not in line with the spirit of the legislative relief.
We believe there is a significant opportunity for the government to modernise, simplify and digitise a lot of the administrative processes, particularly given many of these procedures give rise to some sort of exemption or relief intended to facilitate market activity.
Incentives and concessions to further facilitate the financial services industryThere continues to be industry discussion on further incentives or concessions that could be put to the Government to further facilitate the development of the banking sector. With the key market facilitation role that banks have, an increase in the stamp duty rate may have a negative impact on banks’ ability to provide those facilitation services. Given that the Financial Secretary has indicated strong government support for the financial services industry, we believe there is a significant opportunity to engage in discussions with the Government around where reliefs and exemptions might be appropriate, particularly where this is facilitating capital markets activity in Hong Kong. Transforming these discussions into meaningful actions will help banks and the broader financial services industry further develop and grow.
In anticipation of the uplift in the stamp duty rate, there is a view that some of the burdensome and manual administrative requirements that are imposed upon the banks that manage the collection of tax on behalf of the Exchange and Stamp Office could be simplified.
© 2021 KPMG, a Hong Kong partnership and a member firm of the KPMG global organisation of independent member firms affiliated with KPMG International Limited, a private English company limited by guarantee. All rights reserved. © 2021 KPMG, a Hong Kong partnership and a member firm of the KPMG global organisation of independent member firms affiliated with KPMG International Limited, a private English company limited by guarantee. All rights reserved.
58 | Hong Kong Banking Report 2021
With Basel III reforms on the horizon, banks should accelerate their preparation for implementation With the significant Basel III reforms looming on the horizon, banks in Hong Kong need to accelerate their preparatory work to ensure they are ready for implementation.
Following the Global Financial Crisis, the Basel Committee on Banking Supervision (BCBS) has remained focused on strengthening banking capital requirements. In December 2017, the BCBS published a revised set of minimum standards for the capital treatment of credit risk, operational risk and credit valuation adjustment risk, and for a new output floor to limit the extent to which banks will be able to use internal models for credit and market risk to drive down capital requirements.
Part of the overall reforms involve changes to the Fundamental Review of the Trading Book (FRTB), which is a comprehensive suite of capital rules that will be applied to banks’ wholesale trading activities. The BCBS issued its final ‘minimum standards for market risk capital requirements’ in January 2019, which propose material changes to the way in which banks determine the capital required to support their trading activities.
The Basel III revised capital standards were due to be implemented in January 2022, but the onset of the Covid-19 pandemic has caused this timeline to be deferred both locally by the Hong Kong Monetary Authority (HKMA) and internationally by other major regulators. On 10 June, the HKMA announced that it would further extend the timeline to July 2023 in order to provide the industry with additional time to prepare for implementation.
Addressing challengesWhile the timeline has been deferred, banks should not ease off on their preparations for the new rules. While it is encouraging to see that most banks have started their preparatory work for the implementation, there are a number of key considerations that need to be addressed in order for them to successfully navigate this change.
First and foremost is to ensure compliance in a complex regulatory environment across multiple jurisdictions. The new rules themselves are very intricate, and international banks with a large global footprint in particular may find regional implementation challenging.
Connie KangDirector, Financial Risk ManagementKPMG China
Regulation
© 2021 KPMG, a Hong Kong partnership and a member firm of the KPMG global organisation of independent member firms affiliated with KPMG International Limited, a private English company limited by guarantee. All rights reserved.
Hong Kong Banking Report 2021 | 59
Second, banks need to ensure that their data and models are robust as the new rules will require a wider range of data with more granularity. Enhancing data and modelling will help banks ensure that their capital requirement calculations – for Capital Adequacy Ratios and risk-weighted assets for example – are accurate and credible.
In addition, banks need to carefully consider their implementation strategy and ensure that they engage all departments across the organisation, not just risk management, and include the business function too. Banks should also focus on organisation-wide training and use any quantitative analysis that comes out of this overall exercise to update their strategy to make a stronger business impact.
Key implications and actions for banks The Basel III reforms are expected to lead to changes in banks’ business and operating models. For example, the new FRTB framework is more risk sensitive and will have a significant impact on areas such as FX trading, so banks need to consider how best to structure their FX portfolios and optimise their trading desk structures in order to save capital. Banks should also enhance their data capabilities as these new desk-level calculations will require more granular data.
The Basel III reforms will also have an impact on credit risk. For example, the new rules split out real estate as a separate category and introduce a new metric to link risk weighting to Loan-to-Value ratio (LTV). There will be lower capital requirements for banks that have a lower LTV, and therefore a higher quality, for mortgages. This will have an impact on the business in terms of credit approvals and the types of lending that banks want to focus on. If banks shift their lending portfolio to better quality mortgages, they can potentially help the banks to save capital under the new rules.
There are a number of actions that banks can take to address key challenges and set themselves up for a successful implementation. First, it is essential to focus on comprehensive programme management and bank-wide training to drive the initiative. The Basel III reforms will have a significant impact across the organisation, and robust programme management will enable banks to better manage external parties and system vendors, and improve coordination among the internal departments across different entities and jurisdictions.
In order to drive successful implementation across jurisdictions, international banks may also seek to work with advisors and third parties that have an established global network and therefore more expertise and knowledge of the Basel III rules across regions. Subject matter expertise around data modelling for the various types of credit, operational and market risk can also be valuable for banks to fully understand the changes and impact from the reforms.
From a data and systems perspective, banks will need to update or build new systems to ensure that they are able to collect, analyse and report the necessary data on borrowers and other counterparties. For credit and market risk, banks using internal models will also have to calculate their risk-weighted exposures using the new standardised approaches in order to apply the output floor.
Banks need to ensure that their data and models are robust as the new rules will require a wider range of data and more granularity. Enhancing data and modelling will help banks ensure that their capital requirement calculations – for Capital Adequacy Ratios and risk-weighted assets for example – are accurate and credible.
© 2021 KPMG, a Hong Kong partnership and a member firm of the KPMG global organisation of independent member firms affiliated with KPMG International Limited, a private English company limited by guarantee. All rights reserved. © 2021 KPMG, a Hong Kong partnership and a member firm of the KPMG global organisation of independent member firms affiliated with KPMG International Limited, a private English company limited by guarantee. All rights reserved.
60 | Hong Kong Banking Report 2021
Furthermore, banks moving from the current to the revised standardised approach for credit risk will face higher capital requirements for some types of lending, including buy-to-let and similar exposures to property where repayment relies on income from the property. Within the new standardised approach for credit risk, banks should conduct due diligence to review the accuracy of external credit ratings and to assess whether borrowers are materially dependent on the cash flows generated by a property securing an exposure.
In general, the implementation of the Basel III reforms will change banks’ risk measurement and risk models significantly, and therefore banks with legacy IT, data and reporting systems will need to make necessary investments to upgrade their IT infrastructure and systems.
Setting milestones Perhaps most importantly, with the implementation date of the revised standards deferred until July 2023, banks should still actively seek to work toward key milestones leading up to implementation. In our view, by the first quarter of 2022, banks should be able to produce preliminary results according to the new rules, which means that they need to complete their system implementation in the next six to nine months. Achieving this milestone by the first quarter of 2022 would give banks the rest of the year to prepare for validation and reporting.
We firmly believe that the banks that accelerate their preparatory work for the Basel III reforms in the months ahead and address the key challenges around ensuring compliance, enhancing data and models, and developing a firm-wide strategy will be best placed for implementation success.
The Basel III reforms will have a significant impact across the organisation, and robust programme management will enable banks to better manage external parties and system vendors, and improve coordination among the internal departments across different entities and jurisdictions.
Regulation
© 2021 KPMG, a Hong Kong partnership and a member firm of the KPMG global organisation of independent member firms affiliated with KPMG International Limited, a private English company limited by guarantee. All rights reserved.
Hong Kong Banking Report 2021 | 61
Performance rankings:• Licensed banks
• Virtual banks
• Restricted licence banks
• Deposit-taking companies
• Foreign bank branches
Financial highlights
© 2021 KPMG, a Hong Kong partnership and a member firm of the KPMG global organisation of independent member firms affiliated with KPMG International Limited, a private English company limited by guarantee. All rights reserved. © 2021 KPMG, a Hong Kong partnership and a member firm of the KPMG global organisation of independent member firms affiliated with KPMG International Limited, a private English company limited by guarantee. All rights reserved.
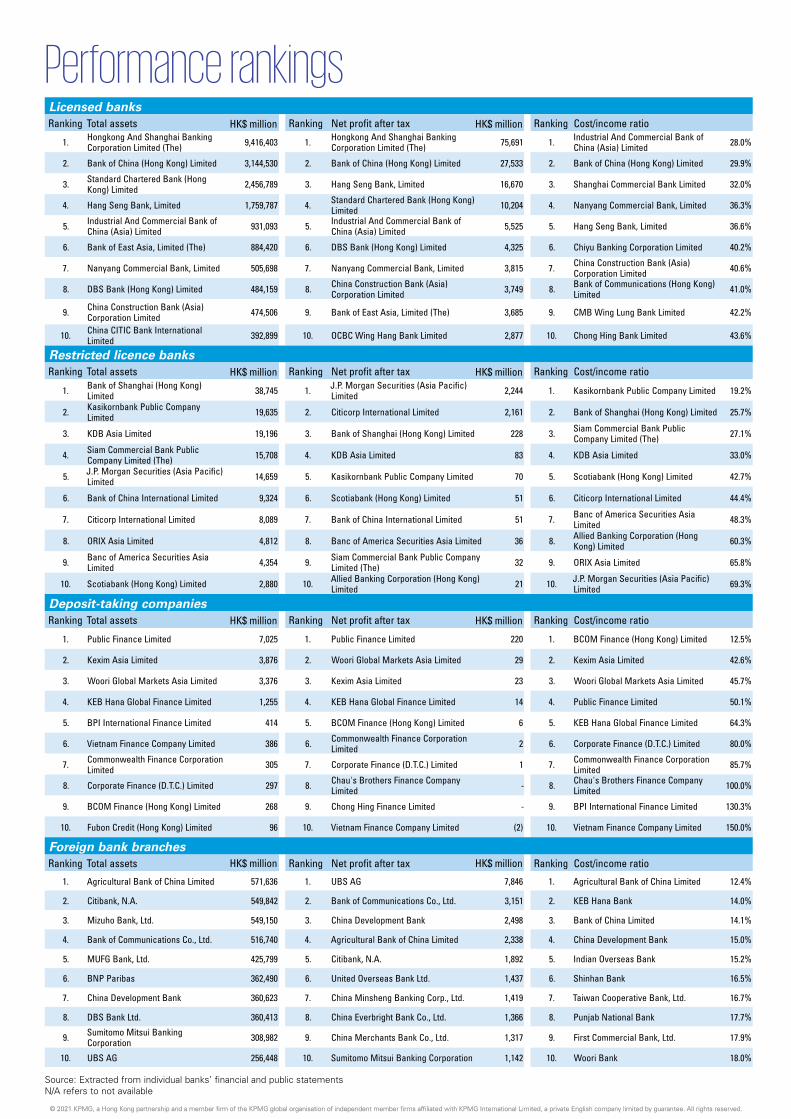
62 | Hong Kong Banking Report 2021
HKD million
HKD million
HKD million
Licensed banksRanking Total assets Ranking Net profit after tax Ranking Cost/income ratio
1. Hongkong And Shanghai Banking Corporation Limited (The) 9,416,403 1. Hongkong And Shanghai Banking
Corporation Limited (The) 75,691 1. Industrial And Commercial Bank of China (Asia) Limited 28.0%
2. Bank of China (Hong Kong) Limited 3,144,530 2. Bank of China (Hong Kong) Limited 27,533 2. Bank of China (Hong Kong) Limited 29.9%
3. Standard Chartered Bank (Hong Kong) Limited 2,456,789 3. Hang Seng Bank, Limited 16,670 3. Shanghai Commercial Bank Limited 32.0%
4. Hang Seng Bank, Limited 1,759,787 4. Standard Chartered Bank (Hong Kong) Limited 10,204 4. Nanyang Commercial Bank, Limited 36.3%
5. Industrial And Commercial Bank of China (Asia) Limited 931,093 5. Industrial And Commercial Bank of
China (Asia) Limited 5,525 5. Hang Seng Bank, Limited 36.6%
6. Bank of East Asia, Limited (The) 884,420 6. DBS Bank (Hong Kong) Limited 4,325 6. Chiyu Banking Corporation Limited 40.2%
7. Nanyang Commercial Bank, Limited 505,698 7. Nanyang Commercial Bank, Limited 3,815 7. China Construction Bank (Asia) Corporation Limited 40.6%
8. DBS Bank (Hong Kong) Limited 484,159 8. China Construction Bank (Asia) Corporation Limited 3,749 8. Bank of Communications (Hong Kong)
Limited 41.0%
9. China Construction Bank (Asia) Corporation Limited 474,506 9. Bank of East Asia, Limited (The) 3,685 9. CMB Wing Lung Bank Limited 42.2%
10. China CITIC Bank International Limited 392,899 10. OCBC Wing Hang Bank Limited 2,877 10. Chong Hing Bank Limited 43.6%
Restricted licence banksRanking Total assets Ranking Net profit after tax Ranking Cost/income ratio
1. Bank of Shanghai (Hong Kong) Limited 38,745 1. J.P. Morgan Securities (Asia Pacific)
Limited 2,244 1. Kasikornbank Public Company Limited 19.2%
2. Kasikornbank Public Company Limited 19,635 2. Citicorp International Limited 2,161 2. Bank of Shanghai (Hong Kong) Limited 25.7%
3. KDB Asia Limited 19,196 3. Bank of Shanghai (Hong Kong) Limited 228 3. Siam Commercial Bank Public Company Limited (The) 27.1%
4. Siam Commercial Bank Public Company Limited (The) 15,708 4. KDB Asia Limited 83 4. KDB Asia Limited 33.0%
5. J.P. Morgan Securities (Asia Pacific) Limited 14,659 5. Kasikornbank Public Company Limited 70 5. Scotiabank (Hong Kong) Limited 42.7%
6. Bank of China International Limited 9,324 6. Scotiabank (Hong Kong) Limited 51 6. Citicorp International Limited 44.4%
7. Citicorp International Limited 8,089 7. Bank of China International Limited 51 7. Banc of America Securities Asia Limited 48.3%
8. ORIX Asia Limited 4,812 8. Banc of America Securities Asia Limited 36 8. Allied Banking Corporation (Hong Kong) Limited 60.3%
9. Banc of America Securities Asia Limited 4,354 9. Siam Commercial Bank Public Company
Limited (The) 32 9. ORIX Asia Limited 65.8%
10. Scotiabank (Hong Kong) Limited 2,880 10. Allied Banking Corporation (Hong Kong) Limited 21 10. J.P. Morgan Securities (Asia Pacific)
Limited 69.3%
Deposit-taking companiesRanking Total assets Ranking Net profit after tax Ranking Cost/income ratio
1. Public Finance Limited 7,025 1. Public Finance Limited 220 1. BCOM Finance (Hong Kong) Limited 12.5%
2. Kexim Asia Limited 3,876 2. Woori Global Markets Asia Limited 29 2. Kexim Asia Limited 42.6%
3. Woori Global Markets Asia Limited 3,376 3. Kexim Asia Limited 23 3. Woori Global Markets Asia Limited 45.7%
4. KEB Hana Global Finance Limited 1,255 4. KEB Hana Global Finance Limited 14 4. Public Finance Limited 50.1%
5. BPI International Finance Limited 414 5. BCOM Finance (Hong Kong) Limited 6 5. KEB Hana Global Finance Limited 64.3%
6. Vietnam Finance Company Limited 386 6. Commonwealth Finance Corporation Limited 2 6. Corporate Finance (D.T.C.) Limited 80.0%
7. Commonwealth Finance Corporation Limited 305 7. Corporate Finance (D.T.C.) Limited 1 7. Commonwealth Finance Corporation
Limited 85.7%
8. Corporate Finance (D.T.C.) Limited 297 8. Chau's Brothers Finance Company Limited - 8. Chau's Brothers Finance Company
Limited 100.0%
9. BCOM Finance (Hong Kong) Limited 268 9. Chong Hing Finance Limited - 9. BPI International Finance Limited 130.3%
10. Fubon Credit (Hong Kong) Limited 96 10. Vietnam Finance Company Limited (2) 10. Vietnam Finance Company Limited 150.0%
Foreign bank branchesRanking Total assets Ranking Net profit after tax Ranking Cost/income ratio
1. Agricultural Bank of China Limited 571,636 1. UBS AG 7,846 1. Agricultural Bank of China Limited 12.4%
2. Citibank, N.A. 549,842 2. Bank of Communications Co., Ltd. 3,151 2. KEB Hana Bank 14.0%
3. Mizuho Bank, Ltd. 549,150 3. China Development Bank 2,498 3. Bank of China Limited 14.1%
4. Bank of Communications Co., Ltd. 516,740 4. Agricultural Bank of China Limited 2,338 4. China Development Bank 15.0%
5. MUFG Bank, Ltd. 425,799 5. Citibank, N.A. 1,892 5. Indian Overseas Bank 15.2%
6. BNP Paribas 362,490 6. United Overseas Bank Ltd. 1,437 6. Shinhan Bank 16.5%
7. China Development Bank 360,623 7. China Minsheng Banking Corp., Ltd. 1,419 7. Taiwan Cooperative Bank, Ltd. 16.7%
8. DBS Bank Ltd. 360,413 8. China Everbright Bank Co., Ltd. 1,366 8. Punjab National Bank 17.7%
9. Sumitomo Mitsui Banking Corporation 308,982 9. China Merchants Bank Co., Ltd. 1,317 9. First Commercial Bank, Ltd. 17.9%
10. UBS AG 256,448 10. Sumitomo Mitsui Banking Corporation 1,142 10. Woori Bank 18.0%
Source: Extracted from individual banks’ financial and public statementsN/A refers to not available
HK$ million
HK$ million
HK$ million
HK$ million
HK$ million
HK$ million
HK$ million
HK$ million
Performance rankings
© 2021 KPMG, a Hong Kong partnership and a member firm of the KPMG global organisation of independent member firms affiliated with KPMG International Limited, a private English company limited by guarantee. All rights reserved.© 2021 KPMG, a Hong Kong partnership and a member firm of the KPMG global organisation of independent member firms affiliated with KPMG International Limited, a private English company limited by guarantee. All rights reserved.
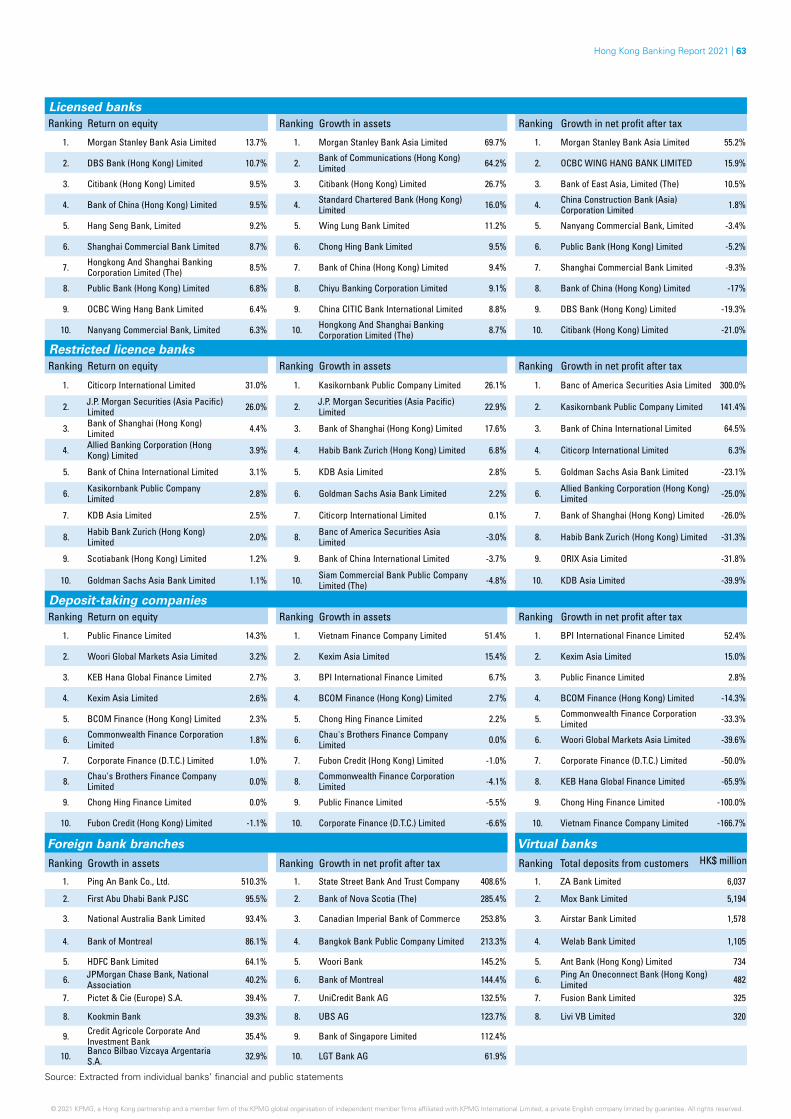
Hong Kong Banking Report 2021 | 63
Licensed banksRanking Return on equity Ranking Growth in assets Ranking Growth in net profit after tax
1. Morgan Stanley Bank Asia Limited 13.7% 1. Morgan Stanley Bank Asia Limited 69.7% 1. Morgan Stanley Bank Asia Limited 55.2%
2. DBS Bank (Hong Kong) Limited 10.7% 2. Bank of Communications (Hong Kong) Limited 64.2% 2. OCBC WING HANG BANK LIMITED 15.9%
3. Citibank (Hong Kong) Limited 9.5% 3. Citibank (Hong Kong) Limited 26.7% 3. Bank of East Asia, Limited (The) 10.5%
4. Bank of China (Hong Kong) Limited 9.5% 4. Standard Chartered Bank (Hong Kong) Limited 16.0% 4. China Construction Bank (Asia)
Corporation Limited 1.8%
5. Hang Seng Bank, Limited 9.2% 5. Wing Lung Bank Limited 11.2% 5. Nanyang Commercial Bank, Limited -3.4%
6. Shanghai Commercial Bank Limited 8.7% 6. Chong Hing Bank Limited 9.5% 6. Public Bank (Hong Kong) Limited -5.2%
7. Hongkong And Shanghai Banking Corporation Limited (The) 8.5% 7. Bank of China (Hong Kong) Limited 9.4% 7. Shanghai Commercial Bank Limited -9.3%
8. Public Bank (Hong Kong) Limited 6.8% 8. Chiyu Banking Corporation Limited 9.1% 8. Bank of China (Hong Kong) Limited -17%
9. OCBC Wing Hang Bank Limited 6.4% 9. China CITIC Bank International Limited 8.8% 9. DBS Bank (Hong Kong) Limited -19.3%
10. Nanyang Commercial Bank, Limited 6.3% 10. Hongkong And Shanghai Banking Corporation Limited (The) 8.7% 10. Citibank (Hong Kong) Limited -21.0%
Restricted licence banksRanking Return on equity Ranking Growth in assets Ranking Growth in net profit after tax
1. Citicorp International Limited 31.0% 1. Kasikornbank Public Company Limited 26.1% 1. Banc of America Securities Asia Limited 300.0%
2. J.P. Morgan Securities (Asia Pacific) Limited 26.0% 2. J.P. Morgan Securities (Asia Pacific)
Limited 22.9% 2. Kasikornbank Public Company Limited 141.4%
3. Bank of Shanghai (Hong Kong) Limited 4.4% 3. Bank of Shanghai (Hong Kong) Limited 17.6% 3. Bank of China International Limited 64.5%
4. Allied Banking Corporation (Hong Kong) Limited 3.9% 4. Habib Bank Zurich (Hong Kong) Limited 6.8% 4. Citicorp International Limited 6.3%
5. Bank of China International Limited 3.1% 5. KDB Asia Limited 2.8% 5. Goldman Sachs Asia Bank Limited -23.1%
6. Kasikornbank Public Company Limited 2.8% 6. Goldman Sachs Asia Bank Limited 2.2% 6. Allied Banking Corporation (Hong Kong)
Limited -25.0%
7. KDB Asia Limited 2.5% 7. Citicorp International Limited 0.1% 7. Bank of Shanghai (Hong Kong) Limited -26.0%
8. Habib Bank Zurich (Hong Kong) Limited 2.0% 8. Banc of America Securities Asia
Limited -3.0% 8. Habib Bank Zurich (Hong Kong) Limited -31.3%
9. Scotiabank (Hong Kong) Limited 1.2% 9. Bank of China International Limited -3.7% 9. ORIX Asia Limited -31.8%
10. Goldman Sachs Asia Bank Limited 1.1% 10. Siam Commercial Bank Public Company Limited (The) -4.8% 10. KDB Asia Limited -39.9%
Deposit-taking companiesRanking Return on equity Ranking Growth in assets Ranking Growth in net profit after tax
1. Public Finance Limited 14.3% 1. Vietnam Finance Company Limited 51.4% 1. BPI International Finance Limited 52.4%
2. Woori Global Markets Asia Limited 3.2% 2. Kexim Asia Limited 15.4% 2. Kexim Asia Limited 15.0%
3. KEB Hana Global Finance Limited 2.7% 3. BPI International Finance Limited 6.7% 3. Public Finance Limited 2.8%
4. Kexim Asia Limited 2.6% 4. BCOM Finance (Hong Kong) Limited 2.7% 4. BCOM Finance (Hong Kong) Limited -14.3%
5. BCOM Finance (Hong Kong) Limited 2.3% 5. Chong Hing Finance Limited 2.2% 5. Commonwealth Finance Corporation Limited -33.3%
6. Commonwealth Finance Corporation Limited 1.8% 6. Chau's Brothers Finance Company
Limited 0.0% 6. Woori Global Markets Asia Limited -39.6%
7. Corporate Finance (D.T.C.) Limited 1.0% 7. Fubon Credit (Hong Kong) Limited -1.0% 7. Corporate Finance (D.T.C.) Limited -50.0%
8. Chau's Brothers Finance Company Limited 0.0% 8. Commonwealth Finance Corporation
Limited -4.1% 8. KEB Hana Global Finance Limited -65.9%
9. Chong Hing Finance Limited 0.0% 9. Public Finance Limited -5.5% 9. Chong Hing Finance Limited -100.0%
10. Fubon Credit (Hong Kong) Limited -1.1% 10. Corporate Finance (D.T.C.) Limited -6.6% 10. Vietnam Finance Company Limited -166.7%
Foreign bank branches Virtual banks
Ranking Growth in assets Ranking Growth in net profit after tax Ranking Total deposits from customers
1. Ping An Bank Co., Ltd. 510.3% 1. State Street Bank And Trust Company 408.6% 1. ZA Bank Limited 6,037
2. First Abu Dhabi Bank PJSC 95.5% 2. Bank of Nova Scotia (The) 285.4% 2. Mox Bank Limited 5,194
3. National Australia Bank Limited 93.4% 3. Canadian Imperial Bank of Commerce 253.8% 3. Airstar Bank Limited 1,578
4. Bank of Montreal 86.1% 4. Bangkok Bank Public Company Limited 213.3% 4. Welab Bank Limited 1,105
5. HDFC Bank Limited 64.1% 5. Woori Bank 145.2% 5. Ant Bank (Hong Kong) Limited 734
6. JPMorgan Chase Bank, National Association 40.2% 6. Bank of Montreal 144.4% 6. Ping An Oneconnect Bank (Hong Kong)
Limited 482
7. Pictet & Cie (Europe) S.A. 39.4% 7. UniCredit Bank AG 132.5% 7. Fusion Bank Limited 325
8. Kookmin Bank 39.3% 8. UBS AG 123.7% 8. Livi VB Limited 320
9. Credit Agricole Corporate And Investment Bank 35.4% 9. Bank of Singapore Limited 112.4%
10. Banco Bilbao Vizcaya Argentaria S.A. 32.9% 10. LGT Bank AG 61.9%
Source: Extracted from individual banks’ financial and public statements
HK$ million
© 2021 KPMG, a Hong Kong partnership and a member firm of the KPMG global organisation of independent member firms affiliated with KPMG International Limited, a private English company limited by guarantee. All rights reserved. © 2021 KPMG, a Hong Kong partnership and a member firm of the KPMG global organisation of independent member firms affiliated with KPMG International Limited, a private English company limited by guarantee. All rights reserved.© 2021 KPMG, a Hong Kong partnership and a member firm of the KPMG global organisation of independent member firms affiliated with KPMG International Limited, a private English company limited by guarantee. All rights reserved.
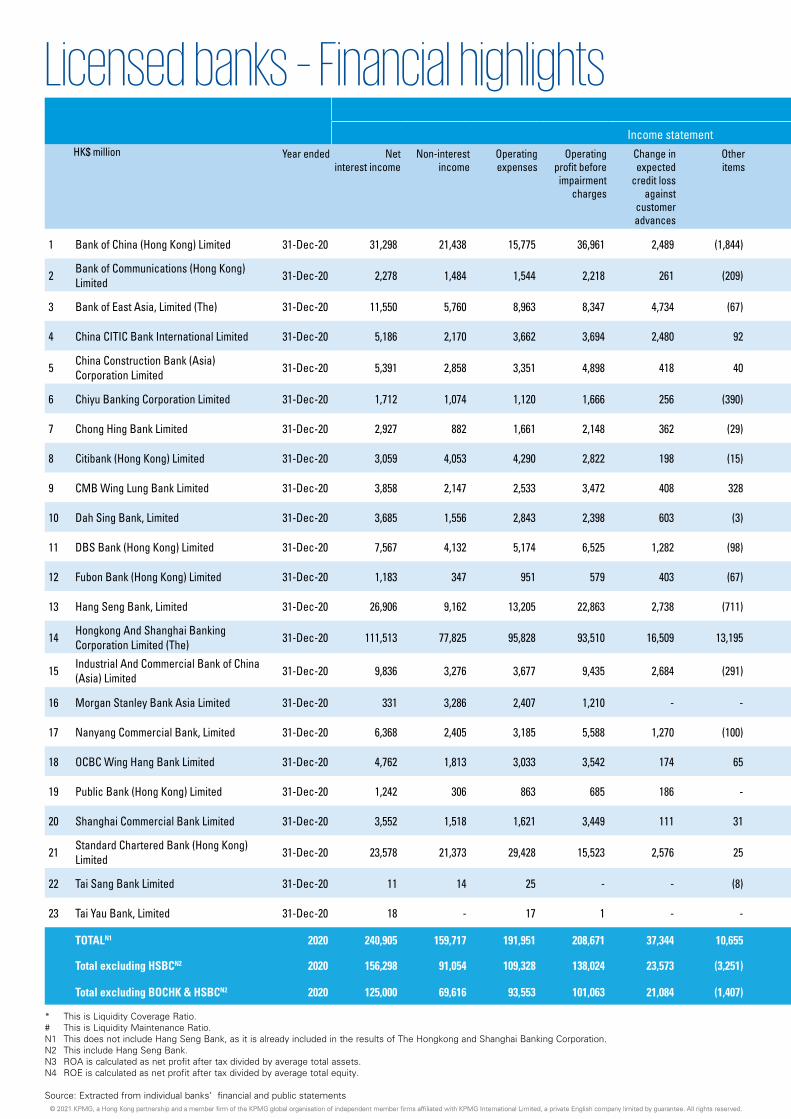
64 | Hong Kong Banking Report 2021
Financial highlights
Income statement Size and strength measuresHK$ million Year ended Net
interest incomeNon-interest
incomeOperating expenses
Operating profit before
impairment charges
Change in expected
credit loss against
customer advances
Other items
Profit before tax
Net profit after tax
Total assets
Risk-weighted assets
(“RWA”)
Gross advances to
customers
Expected credit loss allowance
against customer advances
Total deposits from
customers
Total equity
Capital adequacy
ratio
Liquidity ratio
1 Bank of China (Hong Kong) Limited 31-Dec-20 31,298 21,438 15,775 36,961 2,489 (1,844) 32,628 27,533 3,144,530 1,220,000 1,507,082 9,172 2,190,322 296,558 22.1% 132.7%*
2 Bank of Communications (Hong Kong) Limited 31-Dec-20 2,278 1,484 1,544 2,218 261 (209) 1,748 1,450 372,964 227,729 138,089 574 245,750 47,117 21.8% 163.1%*
3 Bank of East Asia, Limited (The) 31-Dec-20 11,550 5,760 8,963 8,347 4,734 (67) 3,606 3,685 884,420 494,542 525,725 4,862 589,202 113,796 21.9% 183.8%*
4 China CITIC Bank International Limited 31-Dec-20 5,186 2,170 3,662 3,694 2,480 92 1,306 1,156 392,899 299,317 220,096 2,441 309,877 47,568 17.3% 217%*
5 China Construction Bank (Asia) Corporation Limited 31-Dec-20 5,391 2,858 3,351 4,898 418 40 4,520 3,749 474,506 367,423 284,413 2,949 369,421 77,325 21.4% 163.6%*
6 Chiyu Banking Corporation Limited 31-Dec-20 1,712 1,074 1,120 1,666 256 (390) 1,020 843 163,514 91,305 79,108 768 122,573 17,894 19.2% 250.2%*
7 Chong Hing Bank Limited 31-Dec-20 2,927 882 1,661 2,148 362 (29) 1,757 1,480 232,900 175,702 142,382 879 183,228 27,934 16.8% 46.0%#
8 Citibank (Hong Kong) Limited 31-Dec-20 3,059 4,053 4,290 2,822 198 (15) 2,609 2,212 295,079 94,730 101,017 358 215,543 23,649 25.2% 51.4%#
9 CMB Wing Lung Bank Limited 31-Dec-20 3,858 2,147 2,533 3,472 408 328 3,392 2,872 380,027 250,653 194,335 1,252 270,122 49,709 18.7% 172.5%*
10 Dah Sing Bank, Limited 31-Dec-20 3,685 1,556 2,843 2,398 603 (3) 1,792 1,475 248,145 165,714 141,370 1,260 191,242 29,257 17.6% 45.8%#
11 DBS Bank (Hong Kong) Limited 31-Dec-20 7,567 4,132 5,174 6,525 1,282 (98) 5,145 4,325 484,159 249,312 197,624 3,572 404,801 41,810 18.2% 168.2%*
12 Fubon Bank (Hong Kong) Limited 31-Dec-20 1,183 347 951 579 403 (67) 109 75 112,324 72,695 56,506 677 76,538 14,727 18.9% 66.8%#
13 Hang Seng Bank, Limited 31-Dec-20 26,906 9,162 13,205 22,863 2,738 (711) 19,414 16,670 1,759,787 705,528 949,954 5,180 1,209,472 183,195 20.0% 207.8%*
14 Hongkong And Shanghai Banking Corporation Limited (The) 31-Dec-20 111,513 77,825 95,828 93,510 16,509 13,195 90,196 75,691 9,416,403 2,956,993 3,697,568 28,887 5,911,396 911,531 20.8% 172.1%*
15 Industrial And Commercial Bank of China (Asia) Limited 31-Dec-20 9,836 3,276 3,677 9,435 2,684 (291) 6,460 5,525 931,093 661,496 469,999 7,680 522,484 137,767 21.1% 207.4%*
16 Morgan Stanley Bank Asia Limited 31-Dec-20 331 3,286 2,407 1,210 - - 1,210 1,021 61,982 15,305 26,661 - 52,775 7,941 51.0% 64.0%#
17 Nanyang Commercial Bank, Limited 31-Dec-20 6,368 2,405 3,185 5,588 1,270 (100) 4,218 3,815 505,698 341,754 280,113 3,028 351,630 63,028 19.3% 149.7%*
18 OCBC Wing Hang Bank Limited 31-Dec-20 4,762 1,813 3,033 3,542 174 65 3,433 2,877 312,171 218,812 192,197 565 217,414 46,210 19.4% 38.8%#
19 Public Bank (Hong Kong) Limited 31-Dec-20 1,242 306 863 685 186 - 499 420 41,799 27,129 25,837 180 34,205 6,344 22.1% 53.7%#
20 Shanghai Commercial Bank Limited 31-Dec-20 3,552 1,518 1,621 3,449 111 31 3,369 2,742 226,732 177,770 101,739 490 177,797 32,495 20.1% 56.5%#
21 Standard Chartered Bank (Hong Kong) Limited 31-Dec-20 23,578 21,373 29,428 15,523 2,576 25 12,841 10,204 2,456,789 924,779 1,097,207 5,551 1,736,729 179,999 17.8% 147.0%*
22 Tai Sang Bank Limited 31-Dec-20 11 14 25 - - (8) (8) (12) 1,022 523 164 - 270 713 103.5% 92.3%#
23 Tai Yau Bank, Limited 31-Dec-20 18 - 17 1 - - 1 1 2,189 410 1 - 1,374 812 197.9% 102.8%#
TOTALN1 2020 240,905 159,717 191,951 208,671 37,344 10,655 181,851 153,139 21,141,345 9,034,093 9,467,809 75,148 14,174,693 2,174,184 - -
Total excluding HSBCN2 2020 156,298 91,054 109,328 138,024 23,573 (3,251) 111,069 94,118 13,484,729 6,782,628 6,720,195 51,441 9,472,769 1,445,848 - -
Total excluding BOCHK & HSBCN2 2020 125,000 69,616 93,553 101,063 21,084 (1,407) 78,441 66,585 10,340,199 5,562,628 5,213,113 42,269 7,282,447 1,149,290 - -
* This is Liquidity Coverage Ratio.# This is Liquidity Maintenance Ratio.N1 This does not include Hang Seng Bank, as it is already included in the results of The Hongkong and Shanghai Banking Corporation.N2 This include Hang Seng Bank.N3 ROA is calculated as net profit after tax divided by average total assets.N4 ROE is calculated as net profit after tax divided by average total equity.
Source: Extracted from individual banks’ financial and public statements
Licensed banks – Financial highlights
© 2021 KPMG, a Hong Kong partnership and a member firm of the KPMG global organisation of independent member firms affiliated with KPMG International Limited, a private English company limited by guarantee. All rights reserved.© 2021 KPMG, a Hong Kong partnership and a member firm of the KPMG global organisation of independent member firms affiliated with KPMG International Limited, a private English company limited by guarantee. All rights reserved.
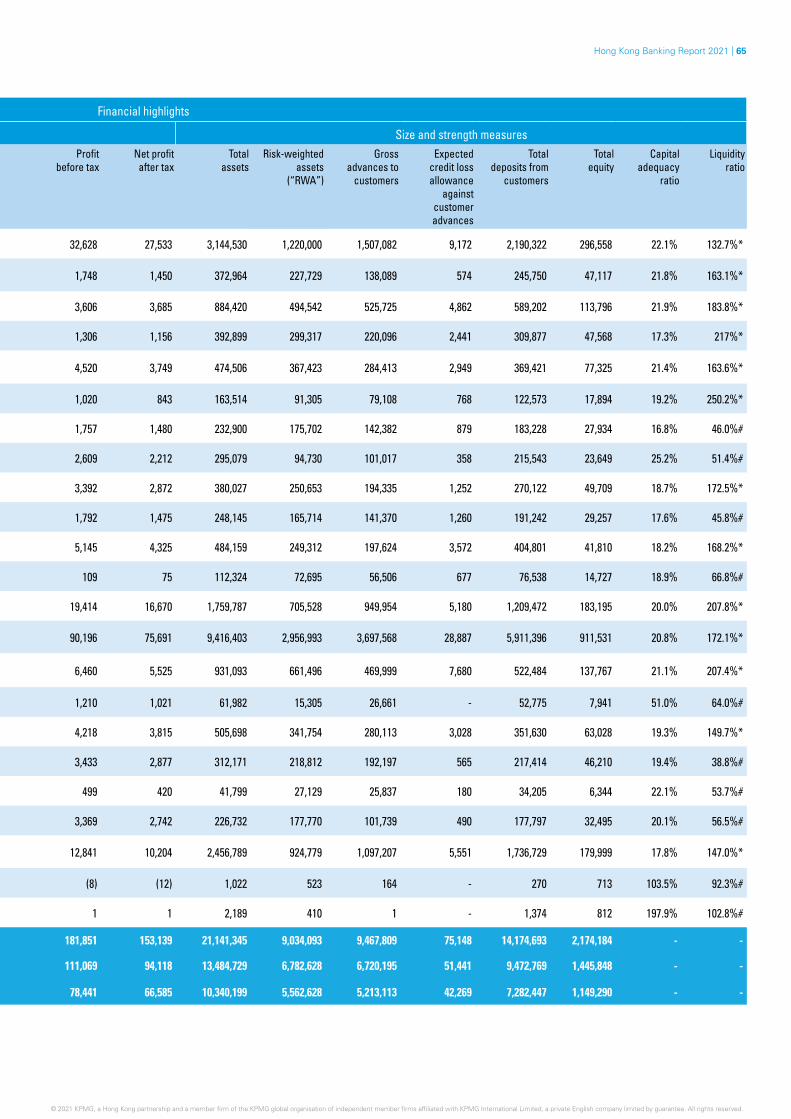
Hong Kong Banking Report 2021 | 65
Financial highlights
Income statement Size and strength measuresHK$ million Year ended Net
interest incomeNon-interest
incomeOperating expenses
Operating profit before
impairment charges
Change in expected
credit loss against
customer advances
Other items
Profit before tax
Net profit after tax
Total assets
Risk-weighted assets
(“RWA”)
Gross advances to
customers
Expected credit loss allowance
against customer advances
Total deposits from
customers
Total equity
Capital adequacy
ratio
Liquidity ratio
1 Bank of China (Hong Kong) Limited 31-Dec-20 31,298 21,438 15,775 36,961 2,489 (1,844) 32,628 27,533 3,144,530 1,220,000 1,507,082 9,172 2,190,322 296,558 22.1% 132.7%*
2 Bank of Communications (Hong Kong) Limited 31-Dec-20 2,278 1,484 1,544 2,218 261 (209) 1,748 1,450 372,964 227,729 138,089 574 245,750 47,117 21.8% 163.1%*
3 Bank of East Asia, Limited (The) 31-Dec-20 11,550 5,760 8,963 8,347 4,734 (67) 3,606 3,685 884,420 494,542 525,725 4,862 589,202 113,796 21.9% 183.8%*
4 China CITIC Bank International Limited 31-Dec-20 5,186 2,170 3,662 3,694 2,480 92 1,306 1,156 392,899 299,317 220,096 2,441 309,877 47,568 17.3% 217%*
5 China Construction Bank (Asia) Corporation Limited 31-Dec-20 5,391 2,858 3,351 4,898 418 40 4,520 3,749 474,506 367,423 284,413 2,949 369,421 77,325 21.4% 163.6%*
6 Chiyu Banking Corporation Limited 31-Dec-20 1,712 1,074 1,120 1,666 256 (390) 1,020 843 163,514 91,305 79,108 768 122,573 17,894 19.2% 250.2%*
7 Chong Hing Bank Limited 31-Dec-20 2,927 882 1,661 2,148 362 (29) 1,757 1,480 232,900 175,702 142,382 879 183,228 27,934 16.8% 46.0%#
8 Citibank (Hong Kong) Limited 31-Dec-20 3,059 4,053 4,290 2,822 198 (15) 2,609 2,212 295,079 94,730 101,017 358 215,543 23,649 25.2% 51.4%#
9 CMB Wing Lung Bank Limited 31-Dec-20 3,858 2,147 2,533 3,472 408 328 3,392 2,872 380,027 250,653 194,335 1,252 270,122 49,709 18.7% 172.5%*
10 Dah Sing Bank, Limited 31-Dec-20 3,685 1,556 2,843 2,398 603 (3) 1,792 1,475 248,145 165,714 141,370 1,260 191,242 29,257 17.6% 45.8%#
11 DBS Bank (Hong Kong) Limited 31-Dec-20 7,567 4,132 5,174 6,525 1,282 (98) 5,145 4,325 484,159 249,312 197,624 3,572 404,801 41,810 18.2% 168.2%*
12 Fubon Bank (Hong Kong) Limited 31-Dec-20 1,183 347 951 579 403 (67) 109 75 112,324 72,695 56,506 677 76,538 14,727 18.9% 66.8%#
13 Hang Seng Bank, Limited 31-Dec-20 26,906 9,162 13,205 22,863 2,738 (711) 19,414 16,670 1,759,787 705,528 949,954 5,180 1,209,472 183,195 20.0% 207.8%*
14 Hongkong And Shanghai Banking Corporation Limited (The) 31-Dec-20 111,513 77,825 95,828 93,510 16,509 13,195 90,196 75,691 9,416,403 2,956,993 3,697,568 28,887 5,911,396 911,531 20.8% 172.1%*
15 Industrial And Commercial Bank of China (Asia) Limited 31-Dec-20 9,836 3,276 3,677 9,435 2,684 (291) 6,460 5,525 931,093 661,496 469,999 7,680 522,484 137,767 21.1% 207.4%*
16 Morgan Stanley Bank Asia Limited 31-Dec-20 331 3,286 2,407 1,210 - - 1,210 1,021 61,982 15,305 26,661 - 52,775 7,941 51.0% 64.0%#
17 Nanyang Commercial Bank, Limited 31-Dec-20 6,368 2,405 3,185 5,588 1,270 (100) 4,218 3,815 505,698 341,754 280,113 3,028 351,630 63,028 19.3% 149.7%*
18 OCBC Wing Hang Bank Limited 31-Dec-20 4,762 1,813 3,033 3,542 174 65 3,433 2,877 312,171 218,812 192,197 565 217,414 46,210 19.4% 38.8%#
19 Public Bank (Hong Kong) Limited 31-Dec-20 1,242 306 863 685 186 - 499 420 41,799 27,129 25,837 180 34,205 6,344 22.1% 53.7%#
20 Shanghai Commercial Bank Limited 31-Dec-20 3,552 1,518 1,621 3,449 111 31 3,369 2,742 226,732 177,770 101,739 490 177,797 32,495 20.1% 56.5%#
21 Standard Chartered Bank (Hong Kong) Limited 31-Dec-20 23,578 21,373 29,428 15,523 2,576 25 12,841 10,204 2,456,789 924,779 1,097,207 5,551 1,736,729 179,999 17.8% 147.0%*
22 Tai Sang Bank Limited 31-Dec-20 11 14 25 - - (8) (8) (12) 1,022 523 164 - 270 713 103.5% 92.3%#
23 Tai Yau Bank, Limited 31-Dec-20 18 - 17 1 - - 1 1 2,189 410 1 - 1,374 812 197.9% 102.8%#
TOTALN1 2020 240,905 159,717 191,951 208,671 37,344 10,655 181,851 153,139 21,141,345 9,034,093 9,467,809 75,148 14,174,693 2,174,184 - -
Total excluding HSBCN2 2020 156,298 91,054 109,328 138,024 23,573 (3,251) 111,069 94,118 13,484,729 6,782,628 6,720,195 51,441 9,472,769 1,445,848 - -
Total excluding BOCHK & HSBCN2 2020 125,000 69,616 93,553 101,063 21,084 (1,407) 78,441 66,585 10,340,199 5,562,628 5,213,113 42,269 7,282,447 1,149,290 - -
© 2021 KPMG, a Hong Kong partnership and a member firm of the KPMG global organisation of independent member firms affiliated with KPMG International Limited, a private English company limited by guarantee. All rights reserved. © 2021 KPMG, a Hong Kong partnership and a member firm of the KPMG global organisation of independent member firms affiliated with KPMG International Limited, a private English company limited by guarantee. All rights reserved.© 2021 KPMG, a Hong Kong partnership and a member firm of the KPMG global organisation of independent member firms affiliated with KPMG International Limited, a private English company limited by guarantee. All rights reserved.
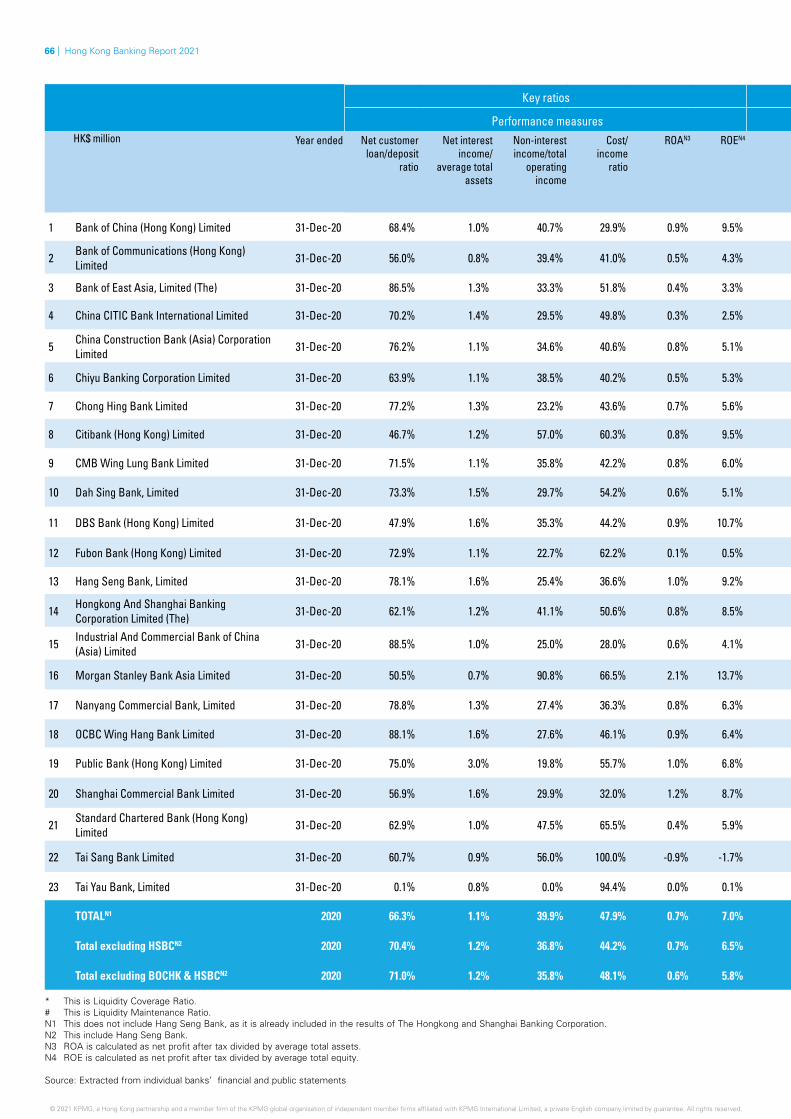
66 | Hong Kong Banking Report 2021
Key ratios Loan asset quality
Performance measures Impaired advances (stage 3) Advances (stage 2)HK$ million Year ended Net customer
loan/deposit ratio
Net interest income/
average total assets
Non-interest income/total
operating income
Cost/ income
ratio
ROAN3 ROEN4 Gross impaired
advances
Gross impaired advances/
Advances to customers
Stage 3 expected credit loss allowance
made against impaired
advances
Stage 3 expected credit loss
allowance as a percentage of
gross impaired advances
Collateral for impaired
advances
Gross advances in
Stage 2
Expected credit loss allowance
made against Stage 2 advances
Stage 2 expected credit loss
allowances as a percentage of gross stage 2
advances
1 Bank of China (Hong Kong) Limited 31-Dec-20 68.4% 1.0% 40.7% 29.9% 0.9% 9.5% 3,994 0.3% 2,652 66.4% 3,046 23,378 1,115 4.8%
2 Bank of Communications (Hong Kong) Limited 31-Dec-20 56.0% 0.8% 39.4% 41.0% 0.5% 4.3% 106 0.1% 44 41.5% 45 2,403 149 6.2%
3 Bank of East Asia, Limited (The) 31-Dec-20 86.5% 1.3% 33.3% 51.8% 0.4% 3.3% 6,465 1.3% 2,976 46.0% 4,801 25,139 1,038 4.1%
4 China CITIC Bank International Limited 31-Dec-20 70.2% 1.4% 29.5% 49.8% 0.3% 2.5% 3,631 1.6% 1,274 35.1% 2,799 10,496 578 5.5%
5 China Construction Bank (Asia) Corporation Limited 31-Dec-20 76.2% 1.1% 34.6% 40.6% 0.8% 5.1% 3,283 1.2% 1,172 35.7% 2,070 21,859 714 3.3%
6 Chiyu Banking Corporation Limited 31-Dec-20 63.9% 1.1% 38.5% 40.2% 0.5% 5.3% 280 0.4% 279 99.6% 37 876 8 0.9%
7 Chong Hing Bank Limited 31-Dec-20 77.2% 1.3% 23.2% 43.6% 0.7% 5.6% 922 0.6% 342 37.1% 342 4,001 109 2.7%
8 Citibank (Hong Kong) Limited 31-Dec-20 46.7% 1.2% 57.0% 60.3% 0.8% 9.5% 92 0.1% 40 43.5% 105 196 141 71.9%
9 CMB Wing Lung Bank Limited 31-Dec-20 71.5% 1.1% 35.8% 42.2% 0.8% 6.0% 986 0.5% 771 78.2% 93 17,240 138 0.8%
10 Dah Sing Bank, Limited 31-Dec-20 73.3% 1.5% 29.7% 54.2% 0.6% 5.1% 1,574 1.1% 557 35.4% 787 11,002 208 1.9%
11 DBS Bank (Hong Kong) Limited 31-Dec-20 47.9% 1.6% 35.3% 44.2% 0.9% 10.7% 2,996 1.5% 1,341 44.8% 1,280 20,553 974 4.7%
12 Fubon Bank (Hong Kong) Limited 31-Dec-20 72.9% 1.1% 22.7% 62.2% 0.1% 0.5% 483 0.9% 395 81.8% 3 2,061 53 2.6%
13 Hang Seng Bank, Limited 31-Dec-20 78.1% 1.6% 25.4% 36.6% 1.0% 9.2% 5,723 0.6% 2,044 35.7% 2,210 130,084 1,821 1.4%
14 Hongkong And Shanghai Banking Corporation Limited (The) 31-Dec-20 62.1% 1.2% 41.1% 50.6% 0.8% 8.5% 35,752 1.0% 17,694 49.5% 12,683 510,040 6,438 1.3%
15 Industrial And Commercial Bank of China (Asia) Limited 31-Dec-20 88.5% 1.0% 25.0% 28.0% 0.6% 4.1% 4,422 0.91% 2,900 65.6% 11,925 32,269 577 1.8%
16 Morgan Stanley Bank Asia Limited 31-Dec-20 50.5% 0.7% 90.8% 66.5% 2.1% 13.7% - 0.0% - 0.0% - - - 0.0%
17 Nanyang Commercial Bank, Limited 31-Dec-20 78.8% 1.3% 27.4% 36.3% 0.8% 6.3% 2,393 0.9% 1,702 71.1% 793 2,973 97 3.3%
18 OCBC Wing Hang Bank Limited 31-Dec-20 88.1% 1.6% 27.6% 46.1% 0.9% 6.4% 833 0.4% 134 16.1% 658 22,444 150 0.7%
19 Public Bank (Hong Kong) Limited 31-Dec-20 75.0% 3.0% 19.8% 55.7% 1.0% 6.8% 220 0.9% 60 27.3% 202 268 24 9.0%
20 Shanghai Commercial Bank Limited 31-Dec-20 56.9% 1.6% 29.9% 32.0% 1.2% 8.7% 168 0.2% 32 19.0% 393 9,273 119 1.3%
21 Standard Chartered Bank (Hong Kong) Limited 31-Dec-20 62.9% 1.0% 47.5% 65.5% 0.4% 5.9% 7,327 0.7% 3,050 41.6% 3,189 54,699 924 1.7%
22 Tai Sang Bank Limited 31-Dec-20 60.7% 0.9% 56.0% 100.0% -0.9% -1.7% - 0.0% - 0.0% - - - 0.0%
23 Tai Yau Bank, Limited 31-Dec-20 0.1% 0.8% 0.0% 94.4% 0.0% 0.1% - 0.0% - 0.0% - - - 0.0%
TOTALN1 2020 66.3% 1.1% 39.9% 47.9% 0.7% 7.0% 75,927 0.8% 37,415 49.3% 45,146 771,170 13,554 1.8%
Total excluding HSBCN2 2020 70.4% 1.2% 36.8% 44.2% 0.7% 6.5% 45,898 0.7% 21,765 47.4% 32,463 391,214 8,937 2.3%
Total excluding BOCHK & HSBCN2 2020 71.0% 1.2% 35.8% 48.1% 0.6% 5.8% 41,904 0.8% 19,113 45.6% 29,417 367,836 7,822 2.1%
* This is Liquidity Coverage Ratio.# This is Liquidity Maintenance Ratio.N1 This does not include Hang Seng Bank, as it is already included in the results of The Hongkong and Shanghai Banking Corporation.N2 This include Hang Seng Bank.N3 ROA is calculated as net profit after tax divided by average total assets.N4 ROE is calculated as net profit after tax divided by average total equity.
Source: Extracted from individual banks’ financial and public statements
© 2021 KPMG, a Hong Kong partnership and a member firm of the KPMG global organisation of independent member firms affiliated with KPMG International Limited, a private English company limited by guarantee. All rights reserved.
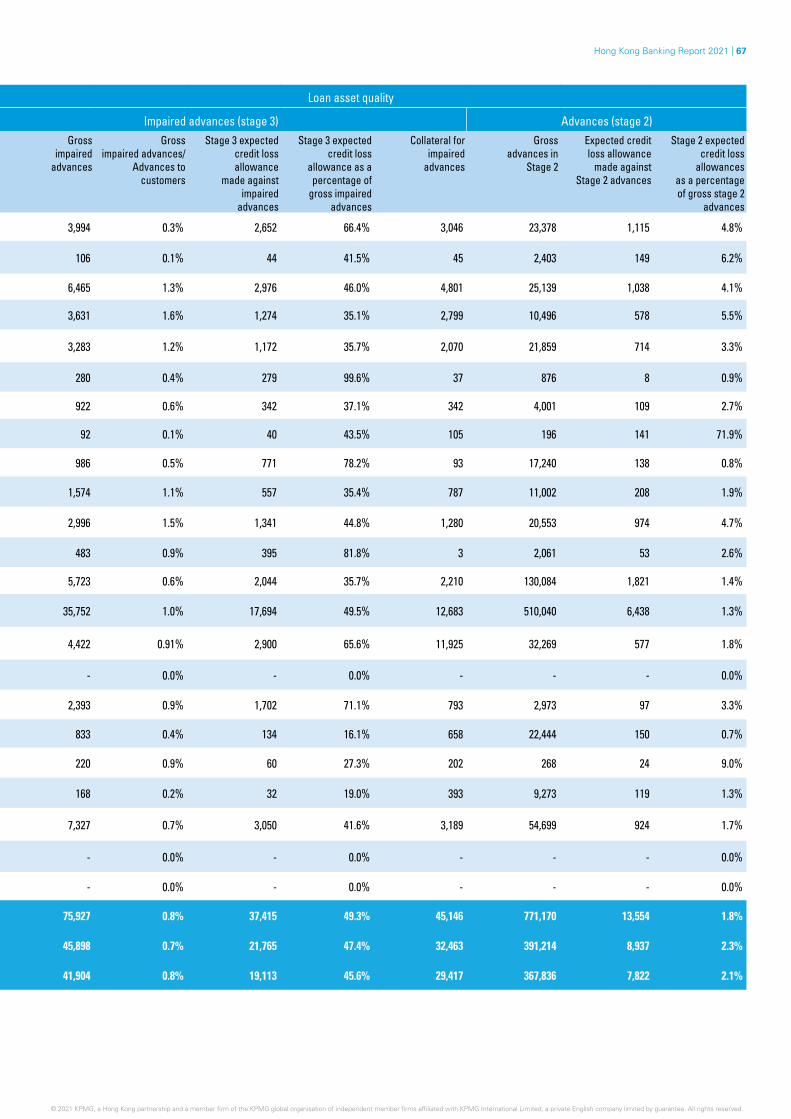
Hong Kong Banking Report 2021 | 67
Key ratios Loan asset quality
Performance measures Impaired advances (stage 3) Advances (stage 2)HK$ million Year ended Net customer
loan/deposit ratio
Net interest income/
average total assets
Non-interest income/total
operating income
Cost/ income
ratio
ROAN3 ROEN4 Gross impaired
advances
Gross impaired advances/
Advances to customers
Stage 3 expected credit loss allowance
made against impaired
advances
Stage 3 expected credit loss
allowance as a percentage of
gross impaired advances
Collateral for impaired
advances
Gross advances in
Stage 2
Expected credit loss allowance
made against Stage 2 advances
Stage 2 expected credit loss
allowances as a percentage of gross stage 2
advances
1 Bank of China (Hong Kong) Limited 31-Dec-20 68.4% 1.0% 40.7% 29.9% 0.9% 9.5% 3,994 0.3% 2,652 66.4% 3,046 23,378 1,115 4.8%
2 Bank of Communications (Hong Kong) Limited 31-Dec-20 56.0% 0.8% 39.4% 41.0% 0.5% 4.3% 106 0.1% 44 41.5% 45 2,403 149 6.2%
3 Bank of East Asia, Limited (The) 31-Dec-20 86.5% 1.3% 33.3% 51.8% 0.4% 3.3% 6,465 1.3% 2,976 46.0% 4,801 25,139 1,038 4.1%
4 China CITIC Bank International Limited 31-Dec-20 70.2% 1.4% 29.5% 49.8% 0.3% 2.5% 3,631 1.6% 1,274 35.1% 2,799 10,496 578 5.5%
5 China Construction Bank (Asia) Corporation Limited 31-Dec-20 76.2% 1.1% 34.6% 40.6% 0.8% 5.1% 3,283 1.2% 1,172 35.7% 2,070 21,859 714 3.3%
6 Chiyu Banking Corporation Limited 31-Dec-20 63.9% 1.1% 38.5% 40.2% 0.5% 5.3% 280 0.4% 279 99.6% 37 876 8 0.9%
7 Chong Hing Bank Limited 31-Dec-20 77.2% 1.3% 23.2% 43.6% 0.7% 5.6% 922 0.6% 342 37.1% 342 4,001 109 2.7%
8 Citibank (Hong Kong) Limited 31-Dec-20 46.7% 1.2% 57.0% 60.3% 0.8% 9.5% 92 0.1% 40 43.5% 105 196 141 71.9%
9 CMB Wing Lung Bank Limited 31-Dec-20 71.5% 1.1% 35.8% 42.2% 0.8% 6.0% 986 0.5% 771 78.2% 93 17,240 138 0.8%
10 Dah Sing Bank, Limited 31-Dec-20 73.3% 1.5% 29.7% 54.2% 0.6% 5.1% 1,574 1.1% 557 35.4% 787 11,002 208 1.9%
11 DBS Bank (Hong Kong) Limited 31-Dec-20 47.9% 1.6% 35.3% 44.2% 0.9% 10.7% 2,996 1.5% 1,341 44.8% 1,280 20,553 974 4.7%
12 Fubon Bank (Hong Kong) Limited 31-Dec-20 72.9% 1.1% 22.7% 62.2% 0.1% 0.5% 483 0.9% 395 81.8% 3 2,061 53 2.6%
13 Hang Seng Bank, Limited 31-Dec-20 78.1% 1.6% 25.4% 36.6% 1.0% 9.2% 5,723 0.6% 2,044 35.7% 2,210 130,084 1,821 1.4%
14 Hongkong And Shanghai Banking Corporation Limited (The) 31-Dec-20 62.1% 1.2% 41.1% 50.6% 0.8% 8.5% 35,752 1.0% 17,694 49.5% 12,683 510,040 6,438 1.3%
15 Industrial And Commercial Bank of China (Asia) Limited 31-Dec-20 88.5% 1.0% 25.0% 28.0% 0.6% 4.1% 4,422 0.91% 2,900 65.6% 11,925 32,269 577 1.8%
16 Morgan Stanley Bank Asia Limited 31-Dec-20 50.5% 0.7% 90.8% 66.5% 2.1% 13.7% - 0.0% - 0.0% - - - 0.0%
17 Nanyang Commercial Bank, Limited 31-Dec-20 78.8% 1.3% 27.4% 36.3% 0.8% 6.3% 2,393 0.9% 1,702 71.1% 793 2,973 97 3.3%
18 OCBC Wing Hang Bank Limited 31-Dec-20 88.1% 1.6% 27.6% 46.1% 0.9% 6.4% 833 0.4% 134 16.1% 658 22,444 150 0.7%
19 Public Bank (Hong Kong) Limited 31-Dec-20 75.0% 3.0% 19.8% 55.7% 1.0% 6.8% 220 0.9% 60 27.3% 202 268 24 9.0%
20 Shanghai Commercial Bank Limited 31-Dec-20 56.9% 1.6% 29.9% 32.0% 1.2% 8.7% 168 0.2% 32 19.0% 393 9,273 119 1.3%
21 Standard Chartered Bank (Hong Kong) Limited 31-Dec-20 62.9% 1.0% 47.5% 65.5% 0.4% 5.9% 7,327 0.7% 3,050 41.6% 3,189 54,699 924 1.7%
22 Tai Sang Bank Limited 31-Dec-20 60.7% 0.9% 56.0% 100.0% -0.9% -1.7% - 0.0% - 0.0% - - - 0.0%
23 Tai Yau Bank, Limited 31-Dec-20 0.1% 0.8% 0.0% 94.4% 0.0% 0.1% - 0.0% - 0.0% - - - 0.0%
TOTALN1 2020 66.3% 1.1% 39.9% 47.9% 0.7% 7.0% 75,927 0.8% 37,415 49.3% 45,146 771,170 13,554 1.8%
Total excluding HSBCN2 2020 70.4% 1.2% 36.8% 44.2% 0.7% 6.5% 45,898 0.7% 21,765 47.4% 32,463 391,214 8,937 2.3%
Total excluding BOCHK & HSBCN2 2020 71.0% 1.2% 35.8% 48.1% 0.6% 5.8% 41,904 0.8% 19,113 45.6% 29,417 367,836 7,822 2.1%
© 2021 KPMG, a Hong Kong partnership and a member firm of the KPMG global organisation of independent member firms affiliated with KPMG International Limited, a private English company limited by guarantee. All rights reserved. © 2021 KPMG, a Hong Kong partnership and a member firm of the KPMG global organisation of independent member firms affiliated with KPMG International Limited, a private English company limited by guarantee. All rights reserved.

68 | Hong Kong Banking Report 2021
Financial highlights
Income statement Size and strength measuresHK$ million Year ended Net
interest income
Non-interest income
Operating expenses
Operating profit before
impairment charges
Change in expected
credit loss against
customer advances
Other items
Profit before tax
Net profit after tax
Total assets
Gross advances
to customers
Expected credit loss allowance
against customer advances
Total deposits
from customers
Total equity
Capital adequacy
ratio
Liquidity ratio#
1 Allied Banking Corporation (Hong Kong) Limited 31-Dec-20 48 10 35 23 (1) - 24 21 1,620 1,096 - 1,022 554 35.8% 89.8%
2 Banc of America Securities Asia Limited 31-Dec-20 3 86 43 46 - - 46 36 4,354 - - - 4,189 674.5% 13,958.8%
3 Bank of China International Limited 31-Dec-20 111 196 246 61 - - 61 51 9,324 4,893 1 7,537 1,662 39.9% 49.7%
4 Bank of Shanghai (Hong Kong) Limited 31-Dec-20 667 310 251 726 369 (85) 272 228 38,745 20,598 478 13,819 5,275 18.7% 77.2%
5 Citicorp International Limited 31-Dec-20 54 4,645 2,086 2,613 - - 2,613 2,161 8,089 - - - 7,061 69.5% 160.0%
6 Goldman Sachs Asia Bank Limited 31-Dec-20 10 40 38 12 - - 12 10 1,091 - - 8 913 214.7% 160.0%
7 Habib Bank Zurich (Hong Kong) Limited 31-Dec-20 56 44 85 15 2 - 13 11 2,703 1,708 16 1,380 553 28.4% 75.5%
8 J.P. Morgan Securities (Asia Pacific) Limited 31-Dec-20 45 8,797 6,131 2,711 - - 2,711 2,244 14,659 - - - 9,734 50.1% 367.8%
9 Kasikornbank Public Company Limited 31-Dec-20 72 32 20 84 1 - 83 70 19,635 1,213 12 10 4,428 18.8% 74.0%
10 KDB Asia Limited 31-Dec-20 218 43 86 175 82 (1) 92 83 19,196 14,085 117 335 3,359 19.3% 71.9%
11 Nippon Wealth Limited 31-Dec-20 1 18 66 (47) - - (47) (47) 133 11 - - 109 130% 160.0%
12 ORIX Asia Limited 31-Mar-20 144 75 144 75 59 - 16 15 4,812 4,449 108 750 2,158 45.3% 128.0%
13 Scotiabank (Hong Kong) Limited 31-Oct-20 93 10 44 59 (2) - 61 51 2,880 - - - 2,876 327.6% 236.9%
14 Siam Commercial Bank Public Company Limited (The) 31-Dec-20 32 16 13 35 - - 35 32 15,708 1,626 4 1,095 - 18.2% 67.5%
TOTAL 2020 1,554 14,322 9,288 6,588 510 (86) 5,992 4,966 142,949 49,679 736 25,956 42,871 - -
Source: Extracted from individual banks’ financial and public statements# Note that all are Liquidity Maintenance Ratio
Restricted licence banks – Financial highlights
© 2021 KPMG, a Hong Kong partnership and a member firm of the KPMG global organisation of independent member firms affiliated with KPMG International Limited, a private English company limited by guarantee. All rights reserved.© 2021 KPMG, a Hong Kong partnership and a member firm of the KPMG global organisation of independent member firms affiliated with KPMG International Limited, a private English company limited by guarantee. All rights reserved.
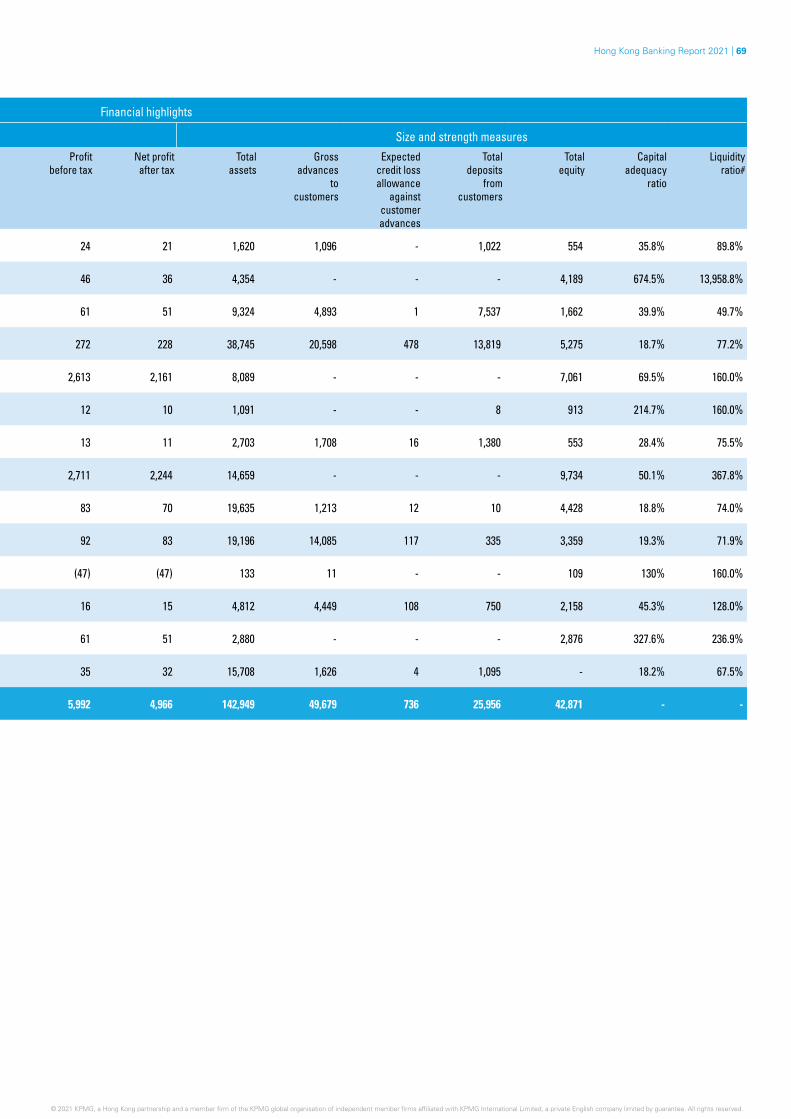
Hong Kong Banking Report 2021 | 69
Financial highlights
Income statement Size and strength measuresHK$ million Year ended Net
interest income
Non-interest income
Operating expenses
Operating profit before
impairment charges
Change in expected
credit loss against
customer advances
Other items
Profit before tax
Net profit after tax
Total assets
Gross advances
to customers
Expected credit loss allowance
against customer advances
Total deposits
from customers
Total equity
Capital adequacy
ratio
Liquidity ratio#
1 Allied Banking Corporation (Hong Kong) Limited 31-Dec-20 48 10 35 23 (1) - 24 21 1,620 1,096 - 1,022 554 35.8% 89.8%
2 Banc of America Securities Asia Limited 31-Dec-20 3 86 43 46 - - 46 36 4,354 - - - 4,189 674.5% 13,958.8%
3 Bank of China International Limited 31-Dec-20 111 196 246 61 - - 61 51 9,324 4,893 1 7,537 1,662 39.9% 49.7%
4 Bank of Shanghai (Hong Kong) Limited 31-Dec-20 667 310 251 726 369 (85) 272 228 38,745 20,598 478 13,819 5,275 18.7% 77.2%
5 Citicorp International Limited 31-Dec-20 54 4,645 2,086 2,613 - - 2,613 2,161 8,089 - - - 7,061 69.5% 160.0%
6 Goldman Sachs Asia Bank Limited 31-Dec-20 10 40 38 12 - - 12 10 1,091 - - 8 913 214.7% 160.0%
7 Habib Bank Zurich (Hong Kong) Limited 31-Dec-20 56 44 85 15 2 - 13 11 2,703 1,708 16 1,380 553 28.4% 75.5%
8 J.P. Morgan Securities (Asia Pacific) Limited 31-Dec-20 45 8,797 6,131 2,711 - - 2,711 2,244 14,659 - - - 9,734 50.1% 367.8%
9 Kasikornbank Public Company Limited 31-Dec-20 72 32 20 84 1 - 83 70 19,635 1,213 12 10 4,428 18.8% 74.0%
10 KDB Asia Limited 31-Dec-20 218 43 86 175 82 (1) 92 83 19,196 14,085 117 335 3,359 19.3% 71.9%
11 Nippon Wealth Limited 31-Dec-20 1 18 66 (47) - - (47) (47) 133 11 - - 109 130% 160.0%
12 ORIX Asia Limited 31-Mar-20 144 75 144 75 59 - 16 15 4,812 4,449 108 750 2,158 45.3% 128.0%
13 Scotiabank (Hong Kong) Limited 31-Oct-20 93 10 44 59 (2) - 61 51 2,880 - - - 2,876 327.6% 236.9%
14 Siam Commercial Bank Public Company Limited (The) 31-Dec-20 32 16 13 35 - - 35 32 15,708 1,626 4 1,095 - 18.2% 67.5%
TOTAL 2020 1,554 14,322 9,288 6,588 510 (86) 5,992 4,966 142,949 49,679 736 25,956 42,871 - -
© 2021 KPMG, a Hong Kong partnership and a member firm of the KPMG global organisation of independent member firms affiliated with KPMG International Limited, a private English company limited by guarantee. All rights reserved. © 2021 KPMG, a Hong Kong partnership and a member firm of the KPMG global organisation of independent member firms affiliated with KPMG International Limited, a private English company limited by guarantee. All rights reserved.© 2021 KPMG, a Hong Kong partnership and a member firm of the KPMG global organisation of independent member firms affiliated with KPMG International Limited, a private English company limited by guarantee. All rights reserved.
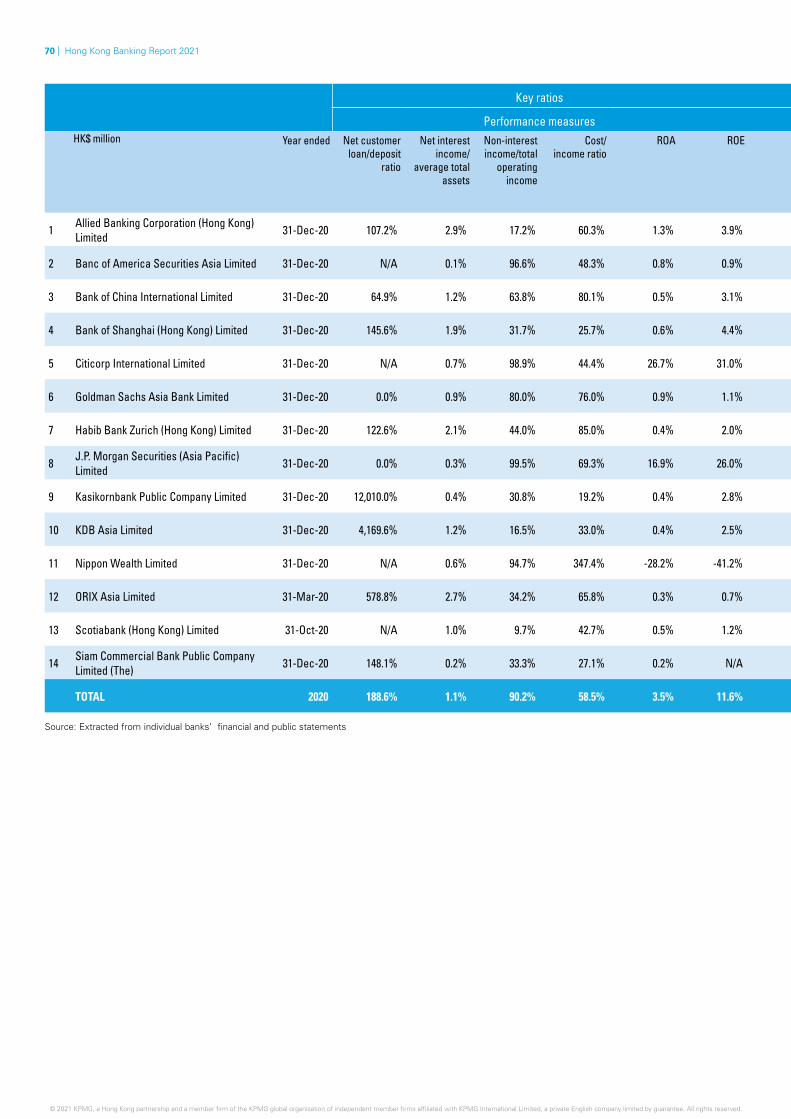
70 | Hong Kong Banking Report 2021
Key ratios Loan asset quality
Performance measures Impaired advances / Stage 3 advances Advances (stage 2)HK$ million Year ended Net customer
loan/deposit ratio
Net interest income/
average total assets
Non-interest income/total
operating income
Cost/ income ratio
ROA ROE Gross impaired advances
Gross impaired advances/
Advances to customers
Stage 3 expected credit loss
allowance made against impaired
advances
Stage 3 expected credit loss
allowance as a percentage of
gross impaired advances
Collateral for impaired
advances
Gross advances in Stage 2
Expected credit loss allowance
made against Stage 2 advances
Stage 2 expected credit loss
allowances as a percentage
of gross stage 2 advances
1 Allied Banking Corporation (Hong Kong) Limited 31-Dec-20 107.2% 2.9% 17.2% 60.3% 1.3% 3.9% 26 2.4% - 0.0% 40 1 - 0%
2 Banc of America Securities Asia Limited 31-Dec-20 N/A 0.1% 96.6% 48.3% 0.8% 0.9% - 0.0% - 0.0% - - - 0.0%
3 Bank of China International Limited 31-Dec-20 64.9% 1.2% 63.8% 80.1% 0.5% 3.1% 1 0.0% 1 100.0% - - - 0.0%
4 Bank of Shanghai (Hong Kong) Limited 31-Dec-20 145.6% 1.9% 31.7% 25.7% 0.6% 4.4% 504 2.4% 249 49.4% - - - 0.0%
5 Citicorp International Limited 31-Dec-20 N/A 0.7% 98.9% 44.4% 26.7% 31.0% - 0.0% - 0.0% - - - 0.0%
6 Goldman Sachs Asia Bank Limited 31-Dec-20 0.0% 0.9% 80.0% 76.0% 0.9% 1.1% - 0.0% - 0.0% - - - 0.0%
7 Habib Bank Zurich (Hong Kong) Limited 31-Dec-20 122.6% 2.1% 44.0% 85.0% 0.4% 2.0% 11 0.6% 3 27.3% 7 50 9 18.0%
8 J.P. Morgan Securities (Asia Pacific) Limited 31-Dec-20 0.0% 0.3% 99.5% 69.3% 16.9% 26.0% - 0.0% - 0.0% - - - 0.0%
9 Kasikornbank Public Company Limited 31-Dec-20 12,010.0% 0.4% 30.8% 19.2% 0.4% 2.8% - 0.0% - 0.0% - - - 0.0%
10 KDB Asia Limited 31-Dec-20 4,169.6% 1.2% 16.5% 33.0% 0.4% 2.5% 77 0.5% 77 100.0% - 97 19 19.6%
11 Nippon Wealth Limited 31-Dec-20 N/A 0.6% 94.7% 347.4% -28.2% -41.2% - 0.0% - 0.0% - - - 0.0%
12 ORIX Asia Limited 31-Mar-20 578.8% 2.7% 34.2% 65.8% 0.3% 0.7% 96 2.2% 70 72.9% 27 135 19 14.1%
13 Scotiabank (Hong Kong) Limited 31-Oct-20 N/A 1.0% 9.7% 42.7% 0.5% 1.2% - 0.0% - 0.0% - - - 0.0%
14 Siam Commercial Bank Public Company Limited (The) 31-Dec-20 148.1% 0.2% 33.3% 27.1% 0.2% N/A - 0.0% - 0.0% - - - 0.0%
TOTAL 2020 188.6% 1.1% 90.2% 58.5% 3.5% 11.6% 715 1.4% 400 55.9% 34 282 47 16.7%
Source: Extracted from individual banks’ financial and public statements
© 2021 KPMG, a Hong Kong partnership and a member firm of the KPMG global organisation of independent member firms affiliated with KPMG International Limited, a private English company limited by guarantee. All rights reserved.
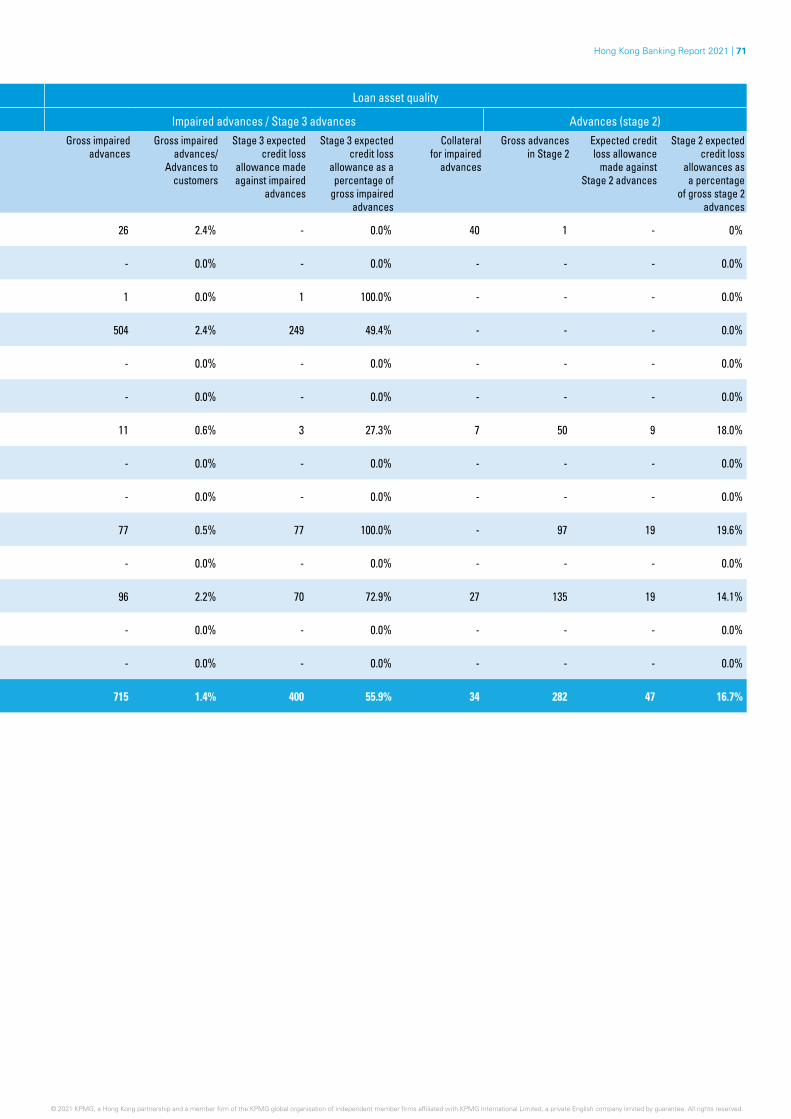
Hong Kong Banking Report 2021 | 71
Key ratios Loan asset quality
Performance measures Impaired advances / Stage 3 advances Advances (stage 2)HK$ million Year ended Net customer
loan/deposit ratio
Net interest income/
average total assets
Non-interest income/total
operating income
Cost/ income ratio
ROA ROE Gross impaired advances
Gross impaired advances/
Advances to customers
Stage 3 expected credit loss
allowance made against impaired
advances
Stage 3 expected credit loss
allowance as a percentage of
gross impaired advances
Collateral for impaired
advances
Gross advances in Stage 2
Expected credit loss allowance
made against Stage 2 advances
Stage 2 expected credit loss
allowances as a percentage
of gross stage 2 advances
1 Allied Banking Corporation (Hong Kong) Limited 31-Dec-20 107.2% 2.9% 17.2% 60.3% 1.3% 3.9% 26 2.4% - 0.0% 40 1 - 0%
2 Banc of America Securities Asia Limited 31-Dec-20 N/A 0.1% 96.6% 48.3% 0.8% 0.9% - 0.0% - 0.0% - - - 0.0%
3 Bank of China International Limited 31-Dec-20 64.9% 1.2% 63.8% 80.1% 0.5% 3.1% 1 0.0% 1 100.0% - - - 0.0%
4 Bank of Shanghai (Hong Kong) Limited 31-Dec-20 145.6% 1.9% 31.7% 25.7% 0.6% 4.4% 504 2.4% 249 49.4% - - - 0.0%
5 Citicorp International Limited 31-Dec-20 N/A 0.7% 98.9% 44.4% 26.7% 31.0% - 0.0% - 0.0% - - - 0.0%
6 Goldman Sachs Asia Bank Limited 31-Dec-20 0.0% 0.9% 80.0% 76.0% 0.9% 1.1% - 0.0% - 0.0% - - - 0.0%
7 Habib Bank Zurich (Hong Kong) Limited 31-Dec-20 122.6% 2.1% 44.0% 85.0% 0.4% 2.0% 11 0.6% 3 27.3% 7 50 9 18.0%
8 J.P. Morgan Securities (Asia Pacific) Limited 31-Dec-20 0.0% 0.3% 99.5% 69.3% 16.9% 26.0% - 0.0% - 0.0% - - - 0.0%
9 Kasikornbank Public Company Limited 31-Dec-20 12,010.0% 0.4% 30.8% 19.2% 0.4% 2.8% - 0.0% - 0.0% - - - 0.0%
10 KDB Asia Limited 31-Dec-20 4,169.6% 1.2% 16.5% 33.0% 0.4% 2.5% 77 0.5% 77 100.0% - 97 19 19.6%
11 Nippon Wealth Limited 31-Dec-20 N/A 0.6% 94.7% 347.4% -28.2% -41.2% - 0.0% - 0.0% - - - 0.0%
12 ORIX Asia Limited 31-Mar-20 578.8% 2.7% 34.2% 65.8% 0.3% 0.7% 96 2.2% 70 72.9% 27 135 19 14.1%
13 Scotiabank (Hong Kong) Limited 31-Oct-20 N/A 1.0% 9.7% 42.7% 0.5% 1.2% - 0.0% - 0.0% - - - 0.0%
14 Siam Commercial Bank Public Company Limited (The) 31-Dec-20 148.1% 0.2% 33.3% 27.1% 0.2% N/A - 0.0% - 0.0% - - - 0.0%
TOTAL 2020 188.6% 1.1% 90.2% 58.5% 3.5% 11.6% 715 1.4% 400 55.9% 34 282 47 16.7%
© 2021 KPMG, a Hong Kong partnership and a member firm of the KPMG global organisation of independent member firms affiliated with KPMG International Limited, a private English company limited by guarantee. All rights reserved. © 2021 KPMG, a Hong Kong partnership and a member firm of the KPMG global organisation of independent member firms affiliated with KPMG International Limited, a private English company limited by guarantee. All rights reserved.
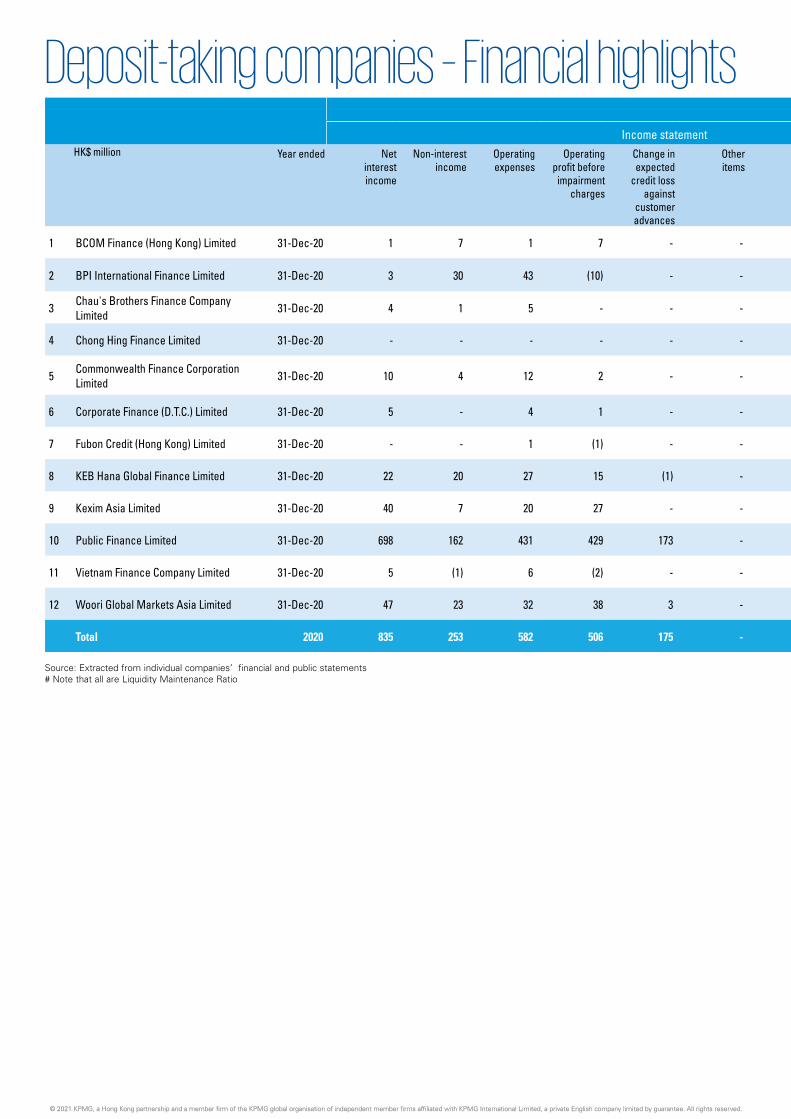
72 | Hong Kong Banking Report 2021
Financial highlights
Income statement Size and strength measuresHK$ million Year ended Net
interest income
Non-interest income
Operating expenses
Operating profit before
impairment charges
Change in expected
credit loss against
customer advances
Other items
Profit before tax
Net profit after tax
Total assets
Risk-weighted assets
(“RWA”)
Gross advances to
customers
Expected credit loss allowance
against customer advances
Total deposits
from customers
Total equity
Capital adequacy
ratio
Liquidity ratio#
1 BCOM Finance (Hong Kong) Limited 31-Dec-20 1 7 1 7 - - 7 6 268 N/A - - 1 265 N/A N/A
2 BPI International Finance Limited 31-Dec-20 3 30 43 (10) - - (10) (10) 414 275 106 - 266 134 48.8% 475.7%
3 Chau's Brothers Finance Company Limited 31-Dec-20 4 1 5 - - - - - 71 N/A 54 1 1 69 116.9% 160.6%
4 Chong Hing Finance Limited 31-Dec-20 - - - - - - - - 47 N/A - - - 47 N/A N/A
5 Commonwealth Finance Corporation Limited 31-Dec-20 10 4 12 2 - - 2 2 305 N/A 165 5 134 113 84.2% 77.8%
6 Corporate Finance (D.T.C.) Limited 31-Dec-20 5 - 4 1 - - 1 1 297 N/A 126 - 193 103 N/A N/A
7 Fubon Credit (Hong Kong) Limited 31-Dec-20 - - 1 (1) - - (1) (1) 96 N/A 1 - - 91 N/A N/A
8 KEB Hana Global Finance Limited 31-Dec-20 22 20 27 15 (1) - 16 14 1,255 632 1,076 1 - 528 83.4% 41,341.4%
9 Kexim Asia Limited 31-Dec-20 40 7 20 27 - - 27 23 3,876 3,474 1,985 6 N/A 1,284 40.5% 161.9%
10 Public Finance Limited 31-Dec-20 698 162 431 429 173 - 256 220 7,025 5,298 5,458 141 5,161 1,589 24.7% 66.4%
11 Vietnam Finance Company Limited 31-Dec-20 5 (1) 6 (2) - - (2) (2) 386 N/A 1 - - 109 N/A N/A
12 Woori Global Markets Asia Limited 31-Dec-20 47 23 32 38 3 - 35 29 3,376 3,260 1,639 24 N/A 922 27.1% 133.7%
Total 2020 835 253 582 506 175 - 331 282 17,416 12,939 10,611 178 5,756 5,254 - -
Source: Extracted from individual companies’ financial and public statements# Note that all are Liquidity Maintenance Ratio
Deposit-taking companies – Financial highlights
© 2021 KPMG, a Hong Kong partnership and a member firm of the KPMG global organisation of independent member firms affiliated with KPMG International Limited, a private English company limited by guarantee. All rights reserved.© 2021 KPMG, a Hong Kong partnership and a member firm of the KPMG global organisation of independent member firms affiliated with KPMG International Limited, a private English company limited by guarantee. All rights reserved.
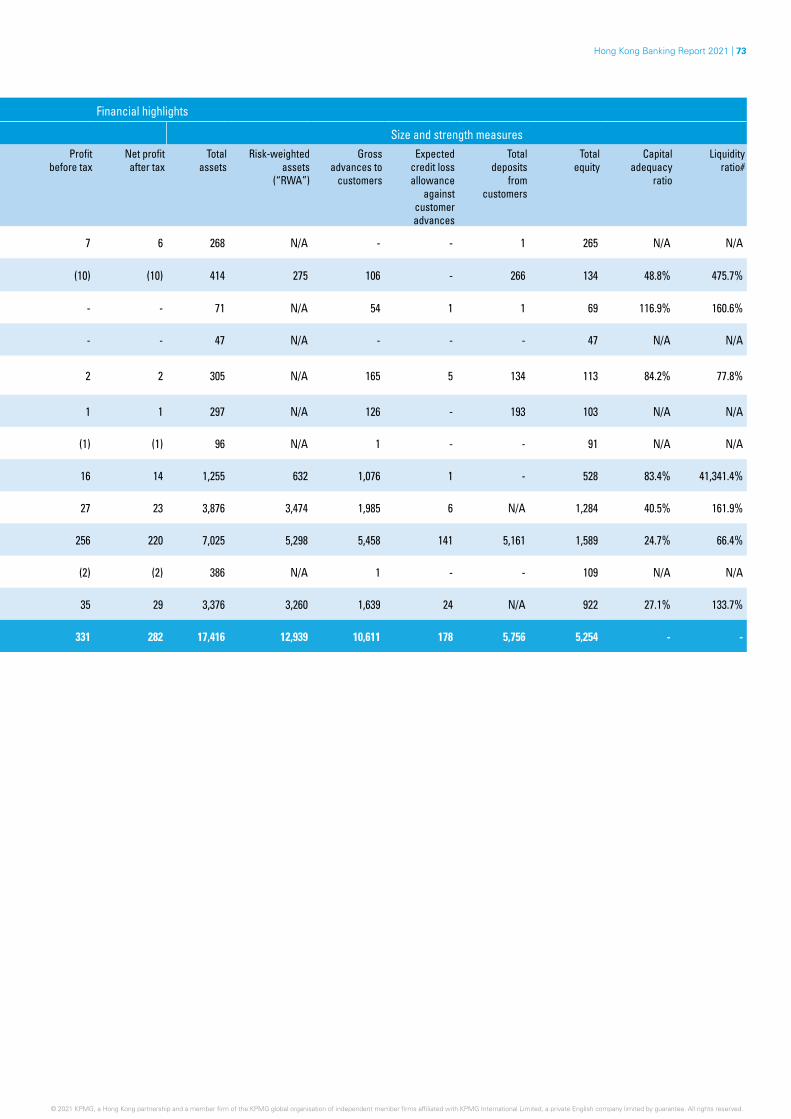
Hong Kong Banking Report 2021 | 73
Financial highlights
Income statement Size and strength measuresHK$ million Year ended Net
interest income
Non-interest income
Operating expenses
Operating profit before
impairment charges
Change in expected
credit loss against
customer advances
Other items
Profit before tax
Net profit after tax
Total assets
Risk-weighted assets
(“RWA”)
Gross advances to
customers
Expected credit loss allowance
against customer advances
Total deposits
from customers
Total equity
Capital adequacy
ratio
Liquidity ratio#
1 BCOM Finance (Hong Kong) Limited 31-Dec-20 1 7 1 7 - - 7 6 268 N/A - - 1 265 N/A N/A
2 BPI International Finance Limited 31-Dec-20 3 30 43 (10) - - (10) (10) 414 275 106 - 266 134 48.8% 475.7%
3 Chau's Brothers Finance Company Limited 31-Dec-20 4 1 5 - - - - - 71 N/A 54 1 1 69 116.9% 160.6%
4 Chong Hing Finance Limited 31-Dec-20 - - - - - - - - 47 N/A - - - 47 N/A N/A
5 Commonwealth Finance Corporation Limited 31-Dec-20 10 4 12 2 - - 2 2 305 N/A 165 5 134 113 84.2% 77.8%
6 Corporate Finance (D.T.C.) Limited 31-Dec-20 5 - 4 1 - - 1 1 297 N/A 126 - 193 103 N/A N/A
7 Fubon Credit (Hong Kong) Limited 31-Dec-20 - - 1 (1) - - (1) (1) 96 N/A 1 - - 91 N/A N/A
8 KEB Hana Global Finance Limited 31-Dec-20 22 20 27 15 (1) - 16 14 1,255 632 1,076 1 - 528 83.4% 41,341.4%
9 Kexim Asia Limited 31-Dec-20 40 7 20 27 - - 27 23 3,876 3,474 1,985 6 N/A 1,284 40.5% 161.9%
10 Public Finance Limited 31-Dec-20 698 162 431 429 173 - 256 220 7,025 5,298 5,458 141 5,161 1,589 24.7% 66.4%
11 Vietnam Finance Company Limited 31-Dec-20 5 (1) 6 (2) - - (2) (2) 386 N/A 1 - - 109 N/A N/A
12 Woori Global Markets Asia Limited 31-Dec-20 47 23 32 38 3 - 35 29 3,376 3,260 1,639 24 N/A 922 27.1% 133.7%
Total 2020 835 253 582 506 175 - 331 282 17,416 12,939 10,611 178 5,756 5,254 - -
© 2021 KPMG, a Hong Kong partnership and a member firm of the KPMG global organisation of independent member firms affiliated with KPMG International Limited, a private English company limited by guarantee. All rights reserved. © 2021 KPMG, a Hong Kong partnership and a member firm of the KPMG global organisation of independent member firms affiliated with KPMG International Limited, a private English company limited by guarantee. All rights reserved.© 2021 KPMG, a Hong Kong partnership and a member firm of the KPMG global organisation of independent member firms affiliated with KPMG International Limited, a private English company limited by guarantee. All rights reserved.
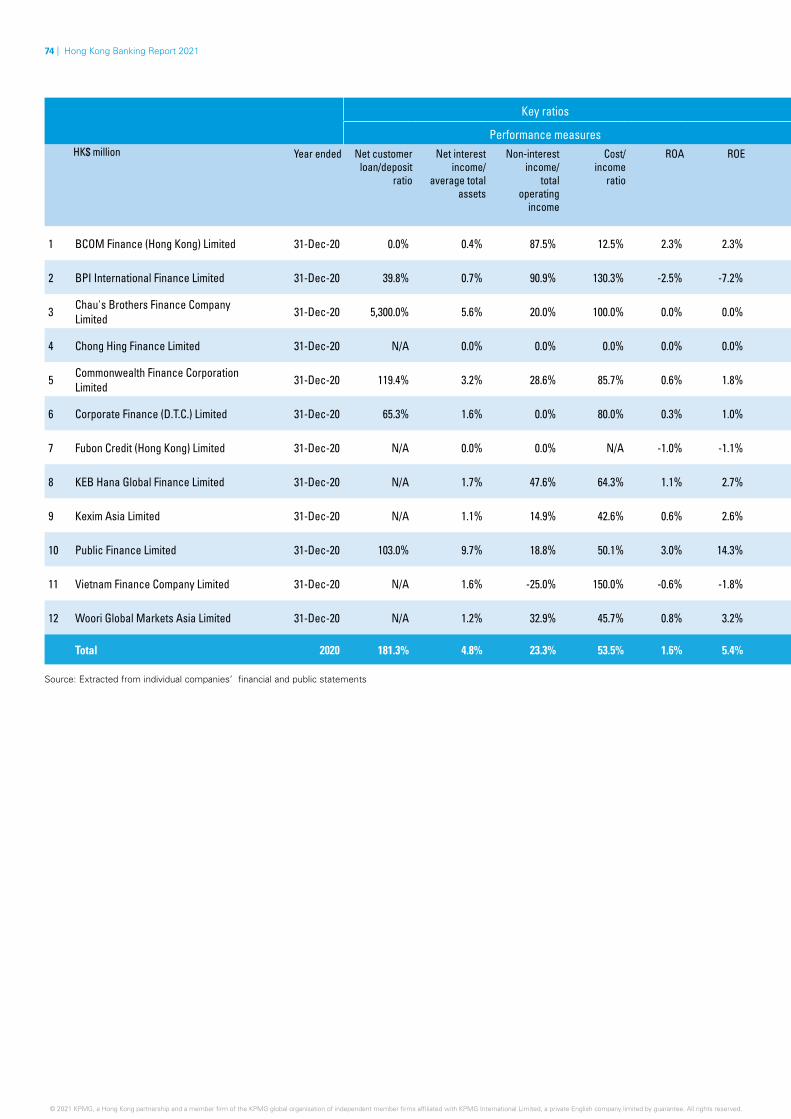
74 | Hong Kong Banking Report 2021
Key ratios Loan asset quality
Performance measures Impaired advances (stage 3) Advances (stage 2)HK$ million Year ended Net customer
loan/deposit ratio
Net interest income/
average total assets
Non-interest income/
total operating
income
Cost/ income
ratio
ROA ROE Gross impaired
advances
Gross impaired advances/
Advances to customers
Stage 3 expected credit loss
allowance made against impaired
advances
Stage 3 expected credit loss
allowance as a percentage of
gross impaired advances
Collateral for impaired
advances
Gross advances in Stage 2
Expected credit loss allowance made against Stage 2
advances
Stage 2 expected credit loss
allowances as a percentage of gross stage 2
advances
1 BCOM Finance (Hong Kong) Limited 31-Dec-20 0.0% 0.4% 87.5% 12.5% 2.3% 2.3% - N/A - 0.0% - - - 0.0%
2 BPI International Finance Limited 31-Dec-20 39.8% 0.7% 90.9% 130.3% -2.5% -7.2% - 0.0% - 0.0% - - - 0.0%
3 Chau's Brothers Finance Company Limited 31-Dec-20 5,300.0% 5.6% 20.0% 100.0% 0.0% 0.0% - N/A - 0.0% - - - 0.0%
4 Chong Hing Finance Limited 31-Dec-20 N/A 0.0% 0.0% 0.0% 0.0% 0.0% - N/A - 0.0% - - - 0.0%
5 Commonwealth Finance Corporation Limited 31-Dec-20 119.4% 3.2% 28.6% 85.7% 0.6% 1.8% 10 6.1% 3 30.0% 2 - - 0.0%
6 Corporate Finance (D.T.C.) Limited 31-Dec-20 65.3% 1.6% 0.0% 80.0% 0.3% 1.0% - 0.0% - 0.0% - - - 0.0%
7 Fubon Credit (Hong Kong) Limited 31-Dec-20 N/A 0.0% 0.0% N/A -1.0% -1.1% - 0.0% - 0.0% - - - 0.0%
8 KEB Hana Global Finance Limited 31-Dec-20 N/A 1.7% 47.6% 64.3% 1.1% 2.7% - 0.0% - 0.0% 0 57 - 0.0%
9 Kexim Asia Limited 31-Dec-20 N/A 1.1% 14.9% 42.6% 0.6% 2.6% - 0.0% - 0.0% - - - 0.0%
10 Public Finance Limited 31-Dec-20 103.0% 9.7% 18.8% 50.1% 3.0% 14.3% 92 1.7% 41 44.6% 9 39 21 53.8%
11 Vietnam Finance Company Limited 31-Dec-20 N/A 1.6% -25.0% 150.0% -0.6% -1.8% - 0.0% - 0% 0 - - 0%
12 Woori Global Markets Asia Limited 31-Dec-20 N/A 1.2% 32.9% 45.7% 0.8% 3.2% 67 4.1% 20 29.9% 46 - - 0%
Total 2020 181.3% 4.8% 23.3% 53.5% 1.6% 5.4% 169 1.6% 64 37.9% 11 96 21 21.9%
Source: Extracted from individual companies’ financial and public statements
© 2021 KPMG, a Hong Kong partnership and a member firm of the KPMG global organisation of independent member firms affiliated with KPMG International Limited, a private English company limited by guarantee. All rights reserved.
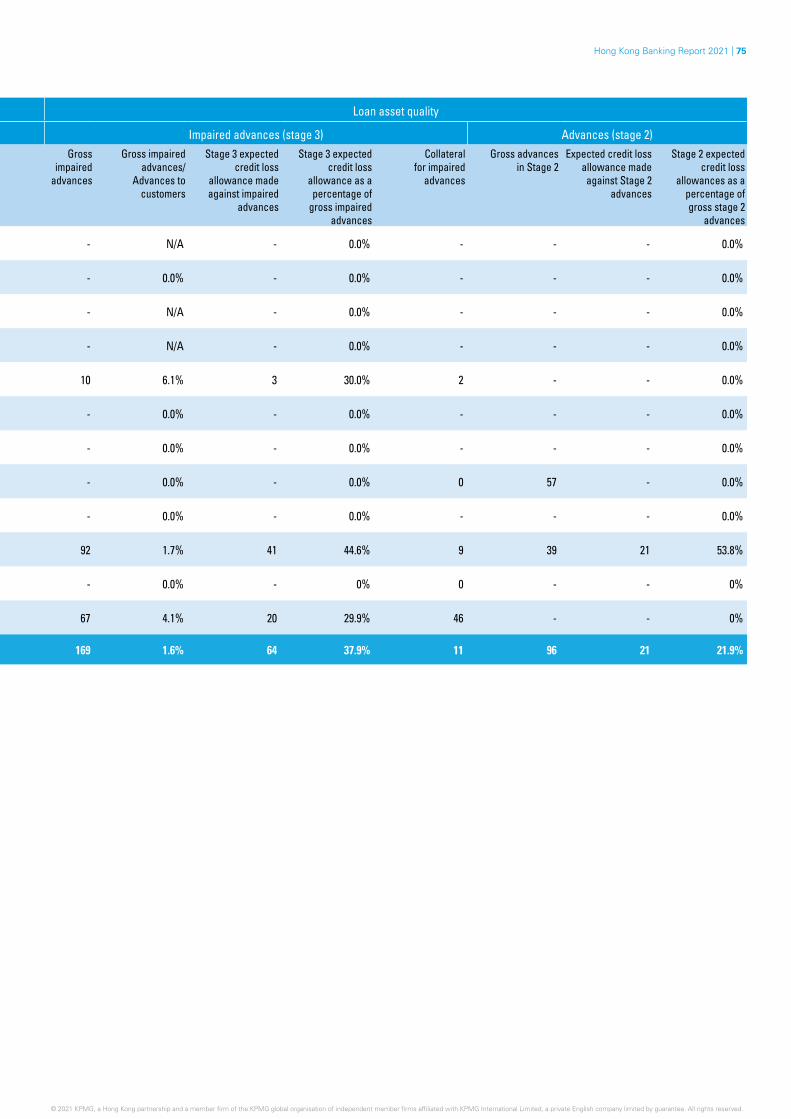
Hong Kong Banking Report 2021 | 75
Key ratios Loan asset quality
Performance measures Impaired advances (stage 3) Advances (stage 2)HK$ million Year ended Net customer
loan/deposit ratio
Net interest income/
average total assets
Non-interest income/
total operating
income
Cost/ income
ratio
ROA ROE Gross impaired
advances
Gross impaired advances/
Advances to customers
Stage 3 expected credit loss
allowance made against impaired
advances
Stage 3 expected credit loss
allowance as a percentage of
gross impaired advances
Collateral for impaired
advances
Gross advances in Stage 2
Expected credit loss allowance made against Stage 2
advances
Stage 2 expected credit loss
allowances as a percentage of gross stage 2
advances
1 BCOM Finance (Hong Kong) Limited 31-Dec-20 0.0% 0.4% 87.5% 12.5% 2.3% 2.3% - N/A - 0.0% - - - 0.0%
2 BPI International Finance Limited 31-Dec-20 39.8% 0.7% 90.9% 130.3% -2.5% -7.2% - 0.0% - 0.0% - - - 0.0%
3 Chau's Brothers Finance Company Limited 31-Dec-20 5,300.0% 5.6% 20.0% 100.0% 0.0% 0.0% - N/A - 0.0% - - - 0.0%
4 Chong Hing Finance Limited 31-Dec-20 N/A 0.0% 0.0% 0.0% 0.0% 0.0% - N/A - 0.0% - - - 0.0%
5 Commonwealth Finance Corporation Limited 31-Dec-20 119.4% 3.2% 28.6% 85.7% 0.6% 1.8% 10 6.1% 3 30.0% 2 - - 0.0%
6 Corporate Finance (D.T.C.) Limited 31-Dec-20 65.3% 1.6% 0.0% 80.0% 0.3% 1.0% - 0.0% - 0.0% - - - 0.0%
7 Fubon Credit (Hong Kong) Limited 31-Dec-20 N/A 0.0% 0.0% N/A -1.0% -1.1% - 0.0% - 0.0% - - - 0.0%
8 KEB Hana Global Finance Limited 31-Dec-20 N/A 1.7% 47.6% 64.3% 1.1% 2.7% - 0.0% - 0.0% 0 57 - 0.0%
9 Kexim Asia Limited 31-Dec-20 N/A 1.1% 14.9% 42.6% 0.6% 2.6% - 0.0% - 0.0% - - - 0.0%
10 Public Finance Limited 31-Dec-20 103.0% 9.7% 18.8% 50.1% 3.0% 14.3% 92 1.7% 41 44.6% 9 39 21 53.8%
11 Vietnam Finance Company Limited 31-Dec-20 N/A 1.6% -25.0% 150.0% -0.6% -1.8% - 0.0% - 0% 0 - - 0%
12 Woori Global Markets Asia Limited 31-Dec-20 N/A 1.2% 32.9% 45.7% 0.8% 3.2% 67 4.1% 20 29.9% 46 - - 0%
Total 2020 181.3% 4.8% 23.3% 53.5% 1.6% 5.4% 169 1.6% 64 37.9% 11 96 21 21.9%
© 2021 KPMG, a Hong Kong partnership and a member firm of the KPMG global organisation of independent member firms affiliated with KPMG International Limited, a private English company limited by guarantee. All rights reserved. © 2021 KPMG, a Hong Kong partnership and a member firm of the KPMG global organisation of independent member firms affiliated with KPMG International Limited, a private English company limited by guarantee. All rights reserved.
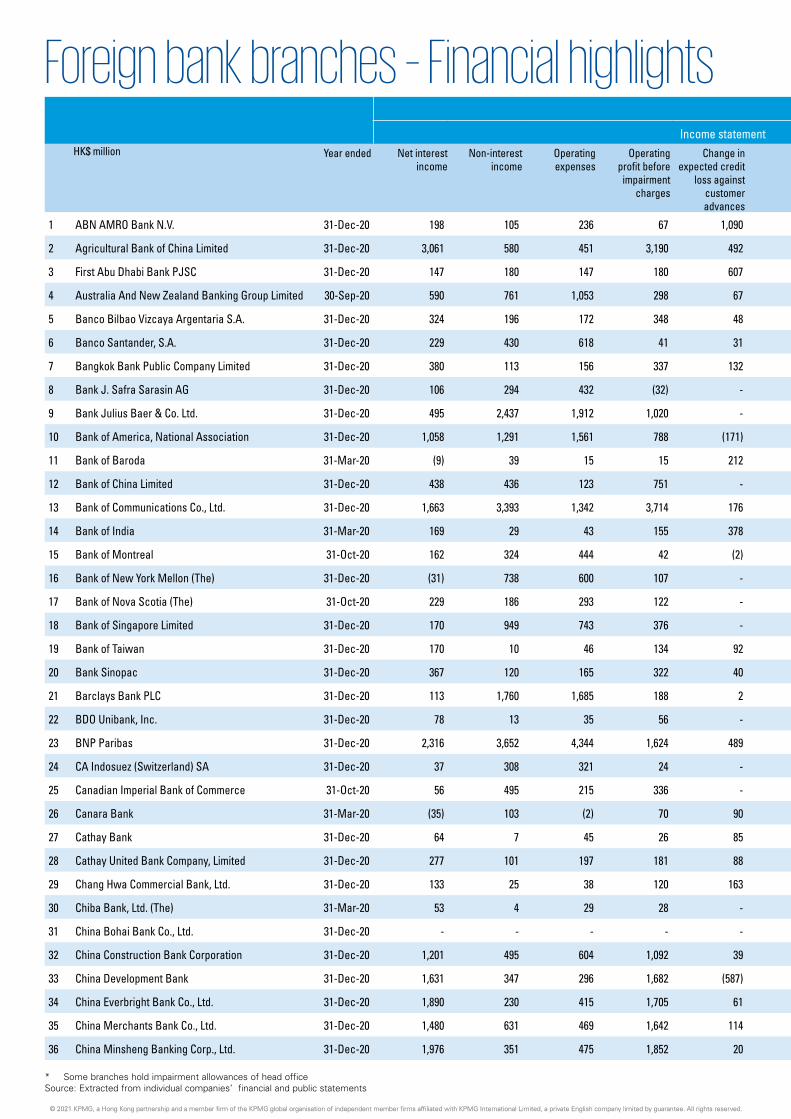
76 | Hong Kong Banking Report 2021
Financial highlights
Income statement Size and strength measuresHK$ million Year ended Net interest
incomeNon-interest
incomeOperating expenses
Operating profit before
impairment charges
Change in expected credit
loss against customer advances
Other items
Profit before
tax
Net profit after tax
Total assets
Gross advances to customers
Expected credit loss allowance against
customer advances*
Total deposits from customers
Liquidity ratio
1 ABN AMRO Bank N.V. 31-Dec-20 198 105 236 67 1,090 (160) (1,183) (1,277) 18,721 2,775 (145) 555 55.6%
2 Agricultural Bank of China Limited 31-Dec-20 3,061 580 451 3,190 492 51 2,749 2,338 571,636 254,404 1,804 156,271 90.5%
3 First Abu Dhabi Bank PJSC 31-Dec-20 147 180 147 180 607 - (427) (353) 54,519 9,563 22 11,764 54.6%
4 Australia And New Zealand Banking Group Limited 30-Sep-20 590 761 1,053 298 67 - 231 160 136,227 49,201 386 38,639 43.3%
5 Banco Bilbao Vizcaya Argentaria S.A. 31-Dec-20 324 196 172 348 48 - 300 249 48,386 40,356 44 1,566 51.1%
6 Banco Santander, S.A. 31-Dec-20 229 430 618 41 31 - 10 (6) 74,334 27,296 34 2,752 56.8%
7 Bangkok Bank Public Company Limited 31-Dec-20 380 113 156 337 132 - 205 188 75,231 15,644 2,160 12,206 45.7%
8 Bank J. Safra Sarasin AG 31-Dec-20 106 294 432 (32) - - (32) (27) 13,583 8,158 - 8,452 42.2%
9 Bank Julius Baer & Co. Ltd. 31-Dec-20 495 2,437 1,912 1,020 - - 1,020 852 90,386 47,462 1 60,460 39.4%
10 Bank of America, National Association 31-Dec-20 1,058 1,291 1,561 788 (171) 1 960 789 93,298 50,228 998 33,129 56.0%
11 Bank of Baroda 31-Mar-20 (9) 39 15 15 212 - (197) (195) 832 499 87 67 37.3%
12 Bank of China Limited 31-Dec-20 438 436 123 751 - - 751 628 209,460 - - - 520.9%
13 Bank of Communications Co., Ltd. 31-Dec-20 1,663 3,393 1,342 3,714 176 95 3,633 3,151 516,740 129,535 783 294,222 175.8%
14 Bank of India 31-Mar-20 169 29 43 155 378 1 (222) (222) 20,365 11,502 618 3,052 123.45%
15 Bank of Montreal 31-Oct-20 162 324 444 42 (2) - 44 44 59,453 14,329 N/A 21,419 52.96%
16 Bank of New York Mellon (The) 31-Dec-20 (31) 738 600 107 - - 107 85 67,729 1,001 - 1,741 383.3%
17 Bank of Nova Scotia (The) 31-Oct-20 229 186 293 122 - - 122 158 44,848 23,017 - 16,994 41.8%
18 Bank of Singapore Limited 31-Dec-20 170 949 743 376 - - 376 308 28,596 12,471 5 14,002 43.1%
19 Bank of Taiwan 31-Dec-20 170 10 46 134 92 (1) 41 41 14,609 3,627 133 7,134 82.9%
20 Bank Sinopac 31-Dec-20 367 120 165 322 40 (132) 150 122 32,668 8,772 141 24,473 100.0%
21 Barclays Bank PLC 31-Dec-20 113 1,760 1,685 188 2 - 186 140 10,133 118 4 1,353 289.3%
22 BDO Unibank, Inc. 31-Dec-20 78 13 35 56 - 3 59 36 5,702 3,810 67 2,641 77.9%
23 BNP Paribas 31-Dec-20 2,316 3,652 4,344 1,624 489 - 1,135 964 362,490 158,415 1,126 188,325 39.2%
24 CA Indosuez (Switzerland) SA 31-Dec-20 37 308 321 24 - - 24 19 9,762 2,367 N/A 5,936 58.1%
25 Canadian Imperial Bank of Commerce 31-Oct-20 56 495 215 336 - - 336 283 16,899 6,495 N/A 8,988 56.71%
26 Canara Bank 31-Mar-20 (35) 103 (2) 70 90 - (20) (20) 10,811 7,730 69 377 87.53%
27 Cathay Bank 31-Dec-20 64 7 45 26 85 - (59) (59) 3,421 2,174 21 1,765 44.1%
28 Cathay United Bank Company, Limited 31-Dec-20 277 101 197 181 88 - 93 76 23,629 13,528 7,443 9,164 47.4%
29 Chang Hwa Commercial Bank, Ltd. 31-Dec-20 133 25 38 120 163 - (43) (44) 12,146 3,802 119 7,720 88.4%
30 Chiba Bank, Ltd. (The) 31-Mar-20 53 4 29 28 - - 28 26 10,190 4,136 - 422 97.87%
31 China Bohai Bank Co., Ltd. 31-Dec-20 - - - - - - - - 1,013 - - - 57733.9%
32 China Construction Bank Corporation 31-Dec-20 1,201 495 604 1,092 39 - 1,053 841 241,311 51,346 943 73,193 152.6%
33 China Development Bank 31-Dec-20 1,631 347 296 1,682 (587) - 2,269 2,498 360,623 210,378 13,126 32,779 102.9%
34 China Everbright Bank Co., Ltd. 31-Dec-20 1,890 230 415 1,705 61 - 1,644 1,366 207,073 70,812 239 77,229 75.6%
35 China Merchants Bank Co., Ltd. 31-Dec-20 1,480 631 469 1,642 114 - 1,528 1,317 173,357 65,800 170 103,406 54.8%
36 China Minsheng Banking Corp., Ltd. 31-Dec-20 1,976 351 475 1,852 20 (20) 1,812 1,419 204,025 97,399 682 98,088 71.1%
* Some branches hold impairment allowances of head office Source: Extracted from individual companies’ financial and public statements
Foreign bank branches – Financial highlights
© 2021 KPMG, a Hong Kong partnership and a member firm of the KPMG global organisation of independent member firms affiliated with KPMG International Limited, a private English company limited by guarantee. All rights reserved.© 2021 KPMG, a Hong Kong partnership and a member firm of the KPMG global organisation of independent member firms affiliated with KPMG International Limited, a private English company limited by guarantee. All rights reserved.
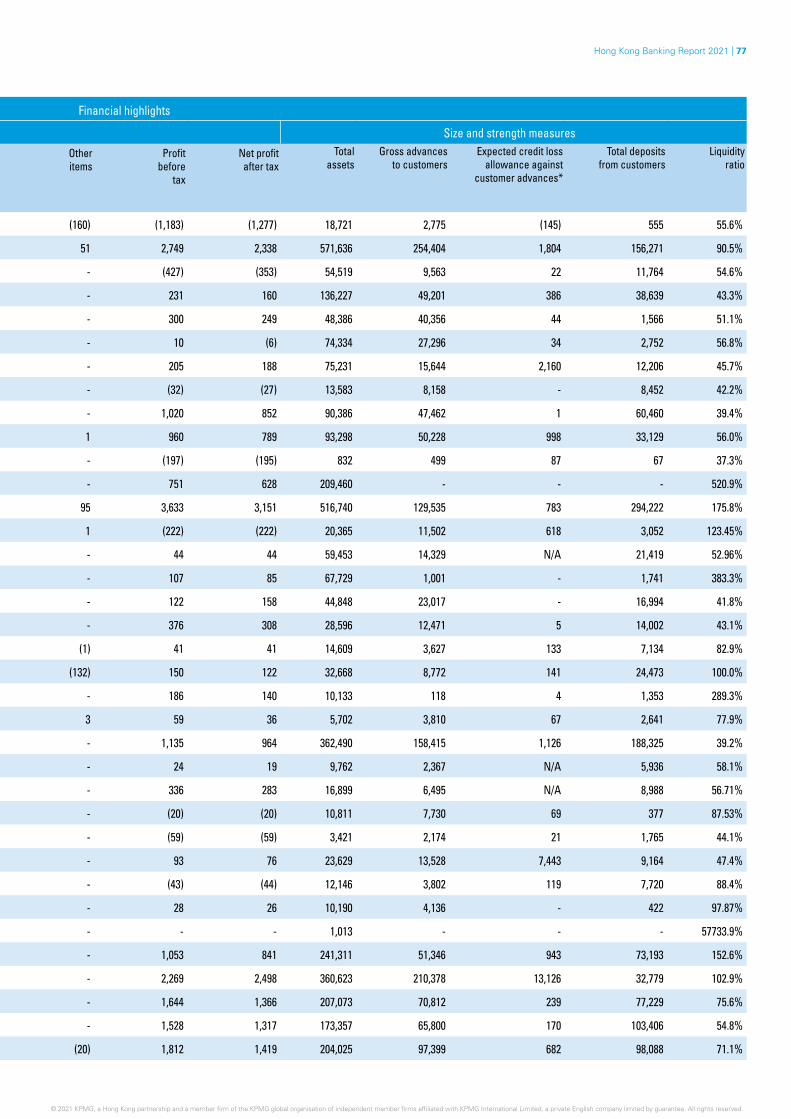
Hong Kong Banking Report 2021 | 77
Financial highlights
Income statement Size and strength measuresHK$ million Year ended Net interest
incomeNon-interest
incomeOperating expenses
Operating profit before
impairment charges
Change in expected credit
loss against customer advances
Other items
Profit before
tax
Net profit after tax
Total assets
Gross advances to customers
Expected credit loss allowance against
customer advances*
Total deposits from customers
Liquidity ratio
1 ABN AMRO Bank N.V. 31-Dec-20 198 105 236 67 1,090 (160) (1,183) (1,277) 18,721 2,775 (145) 555 55.6%
2 Agricultural Bank of China Limited 31-Dec-20 3,061 580 451 3,190 492 51 2,749 2,338 571,636 254,404 1,804 156,271 90.5%
3 First Abu Dhabi Bank PJSC 31-Dec-20 147 180 147 180 607 - (427) (353) 54,519 9,563 22 11,764 54.6%
4 Australia And New Zealand Banking Group Limited 30-Sep-20 590 761 1,053 298 67 - 231 160 136,227 49,201 386 38,639 43.3%
5 Banco Bilbao Vizcaya Argentaria S.A. 31-Dec-20 324 196 172 348 48 - 300 249 48,386 40,356 44 1,566 51.1%
6 Banco Santander, S.A. 31-Dec-20 229 430 618 41 31 - 10 (6) 74,334 27,296 34 2,752 56.8%
7 Bangkok Bank Public Company Limited 31-Dec-20 380 113 156 337 132 - 205 188 75,231 15,644 2,160 12,206 45.7%
8 Bank J. Safra Sarasin AG 31-Dec-20 106 294 432 (32) - - (32) (27) 13,583 8,158 - 8,452 42.2%
9 Bank Julius Baer & Co. Ltd. 31-Dec-20 495 2,437 1,912 1,020 - - 1,020 852 90,386 47,462 1 60,460 39.4%
10 Bank of America, National Association 31-Dec-20 1,058 1,291 1,561 788 (171) 1 960 789 93,298 50,228 998 33,129 56.0%
11 Bank of Baroda 31-Mar-20 (9) 39 15 15 212 - (197) (195) 832 499 87 67 37.3%
12 Bank of China Limited 31-Dec-20 438 436 123 751 - - 751 628 209,460 - - - 520.9%
13 Bank of Communications Co., Ltd. 31-Dec-20 1,663 3,393 1,342 3,714 176 95 3,633 3,151 516,740 129,535 783 294,222 175.8%
14 Bank of India 31-Mar-20 169 29 43 155 378 1 (222) (222) 20,365 11,502 618 3,052 123.45%
15 Bank of Montreal 31-Oct-20 162 324 444 42 (2) - 44 44 59,453 14,329 N/A 21,419 52.96%
16 Bank of New York Mellon (The) 31-Dec-20 (31) 738 600 107 - - 107 85 67,729 1,001 - 1,741 383.3%
17 Bank of Nova Scotia (The) 31-Oct-20 229 186 293 122 - - 122 158 44,848 23,017 - 16,994 41.8%
18 Bank of Singapore Limited 31-Dec-20 170 949 743 376 - - 376 308 28,596 12,471 5 14,002 43.1%
19 Bank of Taiwan 31-Dec-20 170 10 46 134 92 (1) 41 41 14,609 3,627 133 7,134 82.9%
20 Bank Sinopac 31-Dec-20 367 120 165 322 40 (132) 150 122 32,668 8,772 141 24,473 100.0%
21 Barclays Bank PLC 31-Dec-20 113 1,760 1,685 188 2 - 186 140 10,133 118 4 1,353 289.3%
22 BDO Unibank, Inc. 31-Dec-20 78 13 35 56 - 3 59 36 5,702 3,810 67 2,641 77.9%
23 BNP Paribas 31-Dec-20 2,316 3,652 4,344 1,624 489 - 1,135 964 362,490 158,415 1,126 188,325 39.2%
24 CA Indosuez (Switzerland) SA 31-Dec-20 37 308 321 24 - - 24 19 9,762 2,367 N/A 5,936 58.1%
25 Canadian Imperial Bank of Commerce 31-Oct-20 56 495 215 336 - - 336 283 16,899 6,495 N/A 8,988 56.71%
26 Canara Bank 31-Mar-20 (35) 103 (2) 70 90 - (20) (20) 10,811 7,730 69 377 87.53%
27 Cathay Bank 31-Dec-20 64 7 45 26 85 - (59) (59) 3,421 2,174 21 1,765 44.1%
28 Cathay United Bank Company, Limited 31-Dec-20 277 101 197 181 88 - 93 76 23,629 13,528 7,443 9,164 47.4%
29 Chang Hwa Commercial Bank, Ltd. 31-Dec-20 133 25 38 120 163 - (43) (44) 12,146 3,802 119 7,720 88.4%
30 Chiba Bank, Ltd. (The) 31-Mar-20 53 4 29 28 - - 28 26 10,190 4,136 - 422 97.87%
31 China Bohai Bank Co., Ltd. 31-Dec-20 - - - - - - - - 1,013 - - - 57733.9%
32 China Construction Bank Corporation 31-Dec-20 1,201 495 604 1,092 39 - 1,053 841 241,311 51,346 943 73,193 152.6%
33 China Development Bank 31-Dec-20 1,631 347 296 1,682 (587) - 2,269 2,498 360,623 210,378 13,126 32,779 102.9%
34 China Everbright Bank Co., Ltd. 31-Dec-20 1,890 230 415 1,705 61 - 1,644 1,366 207,073 70,812 239 77,229 75.6%
35 China Merchants Bank Co., Ltd. 31-Dec-20 1,480 631 469 1,642 114 - 1,528 1,317 173,357 65,800 170 103,406 54.8%
36 China Minsheng Banking Corp., Ltd. 31-Dec-20 1,976 351 475 1,852 20 (20) 1,812 1,419 204,025 97,399 682 98,088 71.1%
© 2021 KPMG, a Hong Kong partnership and a member firm of the KPMG global organisation of independent member firms affiliated with KPMG International Limited, a private English company limited by guarantee. All rights reserved. © 2021 KPMG, a Hong Kong partnership and a member firm of the KPMG global organisation of independent member firms affiliated with KPMG International Limited, a private English company limited by guarantee. All rights reserved.© 2021 KPMG, a Hong Kong partnership and a member firm of the KPMG global organisation of independent member firms affiliated with KPMG International Limited, a private English company limited by guarantee. All rights reserved.

78 | Hong Kong Banking Report 2021
Financial highlights
Income statement Size and strength measuresHK$ million Year ended Net interest
incomeNon-interest
incomeOperating expenses
Operating profit before
impairment charges
Change in expected credit
loss against customer advances
Other items
Profit before
tax
Net profit after tax
Total assets
Gross advances to customers
Expected credit loss allowance against
customer advances*
Total deposits from customers
Liquidity ratio
37 China Zheshang Bank Co., Ltd. 31-Dec-20 415 101 138 378 4 - 374 316 31,952 11,361 63 2,148 288.8%
38 CIMB Bank Berhad 31-Dec-20 62 (11) 86 (35) 178 - (213) (176) 10,273 4,576 181 4,852 107.13%
39 Citibank, N.A. 31-Dec-20 4,435 3,040 4,505 2,970 729 - 2,241 1,892 549,842 137,631 814 399,300 36.9%
40 Commerzbank AG 31-Dec-20 190 98 274 14 331 - (317) (320) 25,381 9,215 339 3,044 142.0%
41 Commonwealth Bank of Australia 30-Jun-20 116 24 196 (56) 805 - (861) (852) 10,718 4,768 (838) 1,753 132.8%
42 Coöperatieve Rabobank U.A. 31-Dec-20 500 326 613 213 292 - (79) (74) 81,190 37,150 429 8,013 43.6%
43 Credit Agricole Corporate And Investment Bank 31-Dec-20 633 1,228 1,253 608 137 (19) 452 376 252,233 53,557 222 32,931 48.9%
44 Crédit Industriel et Commercial 31-Dec-20 55 26 50 31 7 - 24 19 14,073 10,274 14 2,880 43.9%
45 Credit Suisse AG 31-Dec-20 874 2,876 2,699 1,051 356 - 695 559 174,832 68,732 46 99,617 164.4%
46 CTBC Bank Co., Ltd. 31-Dec-20 1,013 359 517 855 160 13 708 574 75,017 23,367 338 61,345 72.2%
47 DBS Bank Ltd. 31-Dec-20 1,522 1,001 716 1,807 481 - 1,326 1,133 360,413 211,279 1,038 57,145 44.0%
48 Deutsche Bank Aktiengesellschaft 31-Dec-20 1,320 4,493 4,765 1,048 502 - 546 772 136,164 50,471 1,179 52,130 75.8%
49 DZ BANK AG Deutsche Zentral-Genossenschaftsbank, Frankfurt Am Main 31-Dec-20 150 41 171 20 42 - (22) (22) 21,963 8,883 165 453 136.9%
50 E.Sun Commercial Bank, Ltd. 31-Dec-20 518 277 174 621 11 - 610 509 41,149 15,052 332 35,031 46.7%
51 East West Bank 31-Dec-20 131 43 162 12 (28) - 40 37 11,028 5,464 55 6,670 46.4%
52 EFG Bank AG 31-Dec-20 113 325 604 (166) - (11) -177 -177 22,275 12,585 - 14,036 45.5%
53 Erste Group Bank AG 31-Dec-20 203 (10) 63 130 - - 130 118 28,232 - - - 69.7%
54 Far Eastern International Bank 31-Dec-20 55 16 40 31 131 - (100) (95) 4,209 2,156 40 2,790 51.3%
55 First Commercial Bank, Ltd. 31-Dec-20 254 42 53 243 65 - 178 151 19,351 9,063 160 12,643 45.6%
56 HDFC Bank Limited 31-Mar-20 38 1 14 25 8 - 17 15 6,218 2,546 34 861 249.47%
57 Hua Nan Commercial Bank, Ltd. 31-Dec-20 186 24 71 139 13 - 126 104 21,614 6,273 76 17,674 60.7%
58 ICICI Bank Limited 31-Mar-20 64 194 144 114 137 - (23) (17) 20,273 7,228 218 1,985 40.87%
59 Indian Overseas Bank 31-Mar-20 66 105 26 145 163 (6) (24) (24) 6,554 2,930 28 1,763 105.8%
60 Industrial And Commercial Bank of China Limited 31-Dec-20 950 169 314 805 (40) - 845 698 209,475 68,176 240 - 52.5%
61 Industrial Bank Co., Ltd. 31-Dec-20 1,762 354 574 1,542 3,331 - (1,789) (1,481) 210,140 89,702 2,261 97,053 72.0%
62 Industrial Bank of Korea 31-Dec-20 113 57 33 137 2 - 135 110 14,503 4,482 12 1,821 117.7%
63 ING Bank N.V. 31-Dec-20 576 239 450 365 426 - (61) (53) 88,588 39,586 496 6,541 58.1%
64 Intesa Sanpaolo S.p.A. 31-Dec-20 381 118 150 349 367 1 (17) (26) 52,789 20,444 761 43,311 46.0%
65 JPMorgan Chase Bank, National Association 31-Dec-20 502 8,339 7,846 995 (68) (7) 1,056 936 244,576 16,821 229 43,745 61.7%
66 KBC Bank N.V. 31-Dec-20 60 23 64 19 9 - 10 9 7,217 1,205 21 1,428 52.5%
67 KEB Hana Bank 31-Dec-20 265 122 54 333 69 1 265 197 24,477 18,833 137 4,377 50.0%
68 Kookmin Bank 31-Dec-20 162 77 56 183 68 - 115 91 24,689 18,306 94 1,500 52.6%
69 LGT Bank AG 31-Dec-20 258 1,806 1,878 186 - - 186 157 53,157 16,828 - 42,716 61.1%
70 Macquarie Bank Limited 31-Mar-20 (80) 752 824 (152) - - (152) (155) 29,967 - - - 391.1%
71 Malayan Banking Berhad 31-Dec-20 264 79 176 167 240 - (73) (90) 42,258 20,615 384 25,079 64.9%
72 Mega International Commercial Bank Co., Ltd. 31-Dec-20 284 36 84 236 10 - 226 194 33,417 9,721 118 30,234 68.7%
* Some branches hold impairment allowances of head office Source: Extracted from individual companies’ financial and public statements
© 2021 KPMG, a Hong Kong partnership and a member firm of the KPMG global organisation of independent member firms affiliated with KPMG International Limited, a private English company limited by guarantee. All rights reserved.
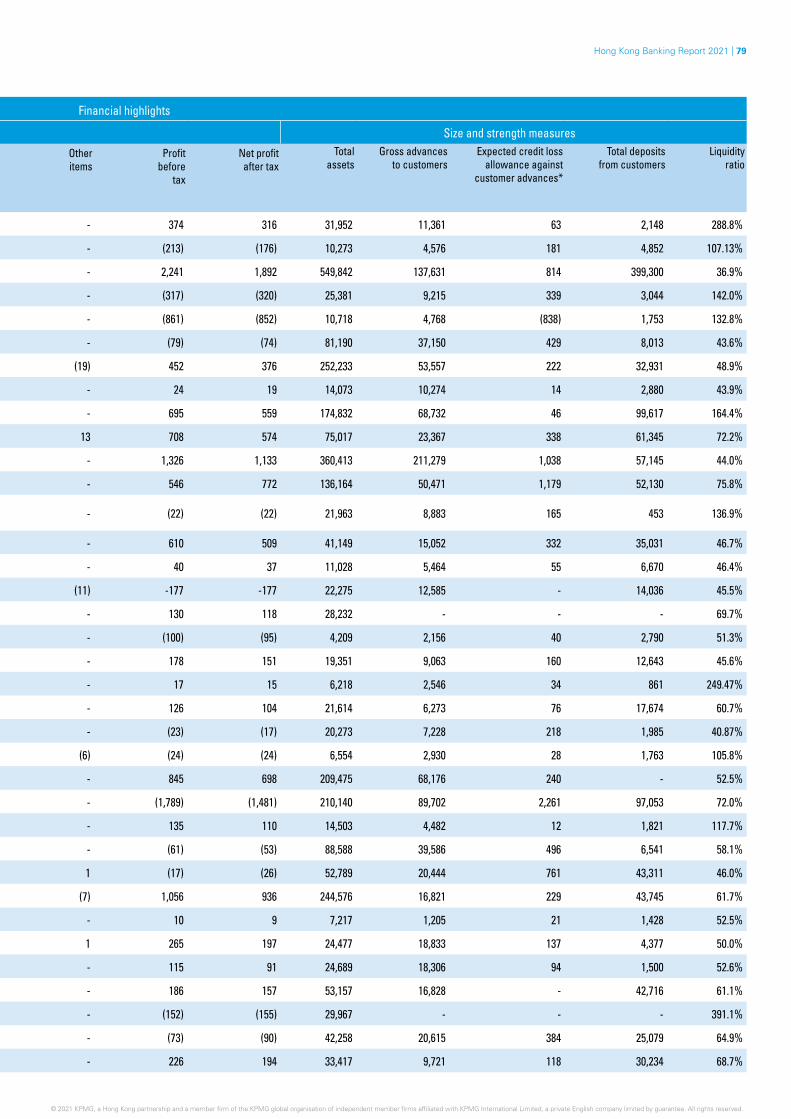
Hong Kong Banking Report 2021 | 79
Financial highlights
Income statement Size and strength measuresHK$ million Year ended Net interest
incomeNon-interest
incomeOperating expenses
Operating profit before
impairment charges
Change in expected credit
loss against customer advances
Other items
Profit before
tax
Net profit after tax
Total assets
Gross advances to customers
Expected credit loss allowance against
customer advances*
Total deposits from customers
Liquidity ratio
37 China Zheshang Bank Co., Ltd. 31-Dec-20 415 101 138 378 4 - 374 316 31,952 11,361 63 2,148 288.8%
38 CIMB Bank Berhad 31-Dec-20 62 (11) 86 (35) 178 - (213) (176) 10,273 4,576 181 4,852 107.13%
39 Citibank, N.A. 31-Dec-20 4,435 3,040 4,505 2,970 729 - 2,241 1,892 549,842 137,631 814 399,300 36.9%
40 Commerzbank AG 31-Dec-20 190 98 274 14 331 - (317) (320) 25,381 9,215 339 3,044 142.0%
41 Commonwealth Bank of Australia 30-Jun-20 116 24 196 (56) 805 - (861) (852) 10,718 4,768 (838) 1,753 132.8%
42 Coöperatieve Rabobank U.A. 31-Dec-20 500 326 613 213 292 - (79) (74) 81,190 37,150 429 8,013 43.6%
43 Credit Agricole Corporate And Investment Bank 31-Dec-20 633 1,228 1,253 608 137 (19) 452 376 252,233 53,557 222 32,931 48.9%
44 Crédit Industriel et Commercial 31-Dec-20 55 26 50 31 7 - 24 19 14,073 10,274 14 2,880 43.9%
45 Credit Suisse AG 31-Dec-20 874 2,876 2,699 1,051 356 - 695 559 174,832 68,732 46 99,617 164.4%
46 CTBC Bank Co., Ltd. 31-Dec-20 1,013 359 517 855 160 13 708 574 75,017 23,367 338 61,345 72.2%
47 DBS Bank Ltd. 31-Dec-20 1,522 1,001 716 1,807 481 - 1,326 1,133 360,413 211,279 1,038 57,145 44.0%
48 Deutsche Bank Aktiengesellschaft 31-Dec-20 1,320 4,493 4,765 1,048 502 - 546 772 136,164 50,471 1,179 52,130 75.8%
49 DZ BANK AG Deutsche Zentral-Genossenschaftsbank, Frankfurt Am Main 31-Dec-20 150 41 171 20 42 - (22) (22) 21,963 8,883 165 453 136.9%
50 E.Sun Commercial Bank, Ltd. 31-Dec-20 518 277 174 621 11 - 610 509 41,149 15,052 332 35,031 46.7%
51 East West Bank 31-Dec-20 131 43 162 12 (28) - 40 37 11,028 5,464 55 6,670 46.4%
52 EFG Bank AG 31-Dec-20 113 325 604 (166) - (11) -177 -177 22,275 12,585 - 14,036 45.5%
53 Erste Group Bank AG 31-Dec-20 203 (10) 63 130 - - 130 118 28,232 - - - 69.7%
54 Far Eastern International Bank 31-Dec-20 55 16 40 31 131 - (100) (95) 4,209 2,156 40 2,790 51.3%
55 First Commercial Bank, Ltd. 31-Dec-20 254 42 53 243 65 - 178 151 19,351 9,063 160 12,643 45.6%
56 HDFC Bank Limited 31-Mar-20 38 1 14 25 8 - 17 15 6,218 2,546 34 861 249.47%
57 Hua Nan Commercial Bank, Ltd. 31-Dec-20 186 24 71 139 13 - 126 104 21,614 6,273 76 17,674 60.7%
58 ICICI Bank Limited 31-Mar-20 64 194 144 114 137 - (23) (17) 20,273 7,228 218 1,985 40.87%
59 Indian Overseas Bank 31-Mar-20 66 105 26 145 163 (6) (24) (24) 6,554 2,930 28 1,763 105.8%
60 Industrial And Commercial Bank of China Limited 31-Dec-20 950 169 314 805 (40) - 845 698 209,475 68,176 240 - 52.5%
61 Industrial Bank Co., Ltd. 31-Dec-20 1,762 354 574 1,542 3,331 - (1,789) (1,481) 210,140 89,702 2,261 97,053 72.0%
62 Industrial Bank of Korea 31-Dec-20 113 57 33 137 2 - 135 110 14,503 4,482 12 1,821 117.7%
63 ING Bank N.V. 31-Dec-20 576 239 450 365 426 - (61) (53) 88,588 39,586 496 6,541 58.1%
64 Intesa Sanpaolo S.p.A. 31-Dec-20 381 118 150 349 367 1 (17) (26) 52,789 20,444 761 43,311 46.0%
65 JPMorgan Chase Bank, National Association 31-Dec-20 502 8,339 7,846 995 (68) (7) 1,056 936 244,576 16,821 229 43,745 61.7%
66 KBC Bank N.V. 31-Dec-20 60 23 64 19 9 - 10 9 7,217 1,205 21 1,428 52.5%
67 KEB Hana Bank 31-Dec-20 265 122 54 333 69 1 265 197 24,477 18,833 137 4,377 50.0%
68 Kookmin Bank 31-Dec-20 162 77 56 183 68 - 115 91 24,689 18,306 94 1,500 52.6%
69 LGT Bank AG 31-Dec-20 258 1,806 1,878 186 - - 186 157 53,157 16,828 - 42,716 61.1%
70 Macquarie Bank Limited 31-Mar-20 (80) 752 824 (152) - - (152) (155) 29,967 - - - 391.1%
71 Malayan Banking Berhad 31-Dec-20 264 79 176 167 240 - (73) (90) 42,258 20,615 384 25,079 64.9%
72 Mega International Commercial Bank Co., Ltd. 31-Dec-20 284 36 84 236 10 - 226 194 33,417 9,721 118 30,234 68.7%
© 2021 KPMG, a Hong Kong partnership and a member firm of the KPMG global organisation of independent member firms affiliated with KPMG International Limited, a private English company limited by guarantee. All rights reserved. © 2021 KPMG, a Hong Kong partnership and a member firm of the KPMG global organisation of independent member firms affiliated with KPMG International Limited, a private English company limited by guarantee. All rights reserved.
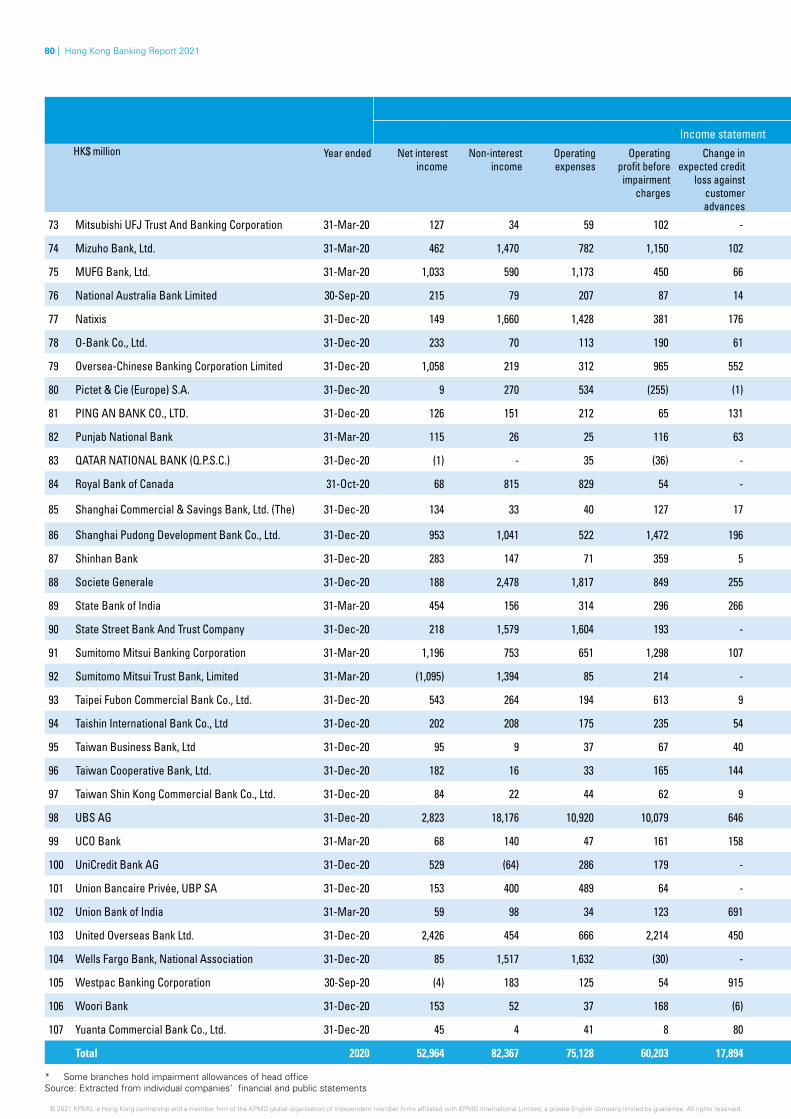
80 | Hong Kong Banking Report 2021
Financial highlights
Income statement Size and strength measuresHK$ million Year ended Net interest
incomeNon-interest
incomeOperating expenses
Operating profit before
impairment charges
Change in expected credit
loss against customer advances
Other items
Profit before
tax
Net profit after tax
Total assets
Gross advances to customers
Expected credit loss allowance against
customer advances*
Total deposits from customers
Liquidity ratio
73 Mitsubishi UFJ Trust And Banking Corporation 31-Mar-20 127 34 59 102 - - 102 102 26,157 - - 738 194.5%
74 Mizuho Bank, Ltd. 31-Mar-20 462 1,470 782 1,150 102 - 1,048 925 549,150 210,224 162 113,297 61.5%
75 MUFG Bank, Ltd. 31-Mar-20 1,033 590 1,173 450 66 (5) 379 293 425,799 210,430 2,168 111,437 49.81%
76 National Australia Bank Limited 30-Sep-20 215 79 207 87 14 - 73 56 85,149 3,683 41 13,100 180.5%
77 Natixis 31-Dec-20 149 1,660 1,428 381 176 - 205 227 87,981 44,454 76 7,311 46.6%
78 O-Bank Co., Ltd. 31-Dec-20 233 70 113 190 61 - 129 110 13,186 7,355 98 11,099 55.4%
79 Oversea-Chinese Banking Corporation Limited 31-Dec-20 1,058 219 312 965 552 - 413 336 128,924 52,043 546 25,835 139.4%
80 Pictet & Cie (Europe) S.A. 31-Dec-20 9 270 534 (255) (1) - (254) (254) 9,410 1,509 1 5,526 59.9%
81 PING AN BANK CO., LTD. 31-Dec-20 126 151 212 65 131 - (66) (69) 25,204 9,068 101 13,984 95%
82 Punjab National Bank 31-Mar-20 115 26 25 116 63 - 53 53 21,592 13,639 366 150 127.4%
83 QATAR NATIONAL BANK (Q.P.S.C.) 31-Dec-20 (1) - 35 (36) - - (36) (36) 2,855 - - 2,791 165.53%
84 Royal Bank of Canada 31-Oct-20 68 815 829 54 - - 54 54 57,896 688 - 967 135.0%
85 Shanghai Commercial & Savings Bank, Ltd. (The) 31-Dec-20 134 33 40 127 17 - 110 83 8,376 3,146 60 5,324 46.0%
86 Shanghai Pudong Development Bank Co., Ltd. 31-Dec-20 953 1,041 522 1,472 196 - 1,276 1,007 212,229 82,350 525 85,784 57.9%
87 Shinhan Bank 31-Dec-20 283 147 71 359 5 - 354 274 36,429 22,090 72 3,214 129.9%
88 Societe Generale 31-Dec-20 188 2,478 1,817 849 255 (1) 593 529 135,444 53,047 (374) 8,202 60.9%
89 State Bank of India 31-Mar-20 454 156 314 296 266 - 30 14 110,461 34,738 504 4,706 91.5%
90 State Street Bank And Trust Company 31-Dec-20 218 1,579 1,604 193 - - 193 178 50,331 39 - 18,380 54.0%
91 Sumitomo Mitsui Banking Corporation 31-Mar-20 1,196 753 651 1,298 107 1 1,192 1,142 308,982 149,656 159 72,973 51.7%
92 Sumitomo Mitsui Trust Bank, Limited 31-Mar-20 (1,095) 1,394 85 214 - - 214 184 79,390 16,151 20,541 23,914 120.6%
93 Taipei Fubon Commercial Bank Co., Ltd. 31-Dec-20 543 264 194 613 9 3 607 505 56,284 19,997 246 37,142 40.1%
94 Taishin International Bank Co., Ltd 31-Dec-20 202 208 175 235 54 - 181 149 17,815 8,676 86 14,244 42.8%
95 Taiwan Business Bank, Ltd 31-Dec-20 95 9 37 67 40 - 27 5 5,225 2,637 43 3,738 44.6%
96 Taiwan Cooperative Bank, Ltd. 31-Dec-20 182 16 33 165 144 - 21 5 9,344 4,438 135 5,876 56.1%
97 Taiwan Shin Kong Commercial Bank Co., Ltd. 31-Dec-20 84 22 44 62 9 - 53 42 8,410 3,759 47 6,314 80.1%
98 UBS AG 31-Dec-20 2,823 18,176 10,920 10,079 646 - 9,433 7,846 256,448 182,069 650 173,592 57.0%
99 UCO Bank 31-Mar-20 68 140 47 161 158 - 3 3 7,043 4,530 37 2,348 398.3%
100 UniCredit Bank AG 31-Dec-20 529 (64) 286 179 - - 179 179 91,553 3,613 - 2,085 745.3%
101 Union Bancaire Privée, UBP SA 31-Dec-20 153 400 489 64 - - 64 53 22,640 9,739 - 13,570 74.4%
102 Union Bank of India 31-Mar-20 59 98 34 123 691 - (568) (568) 17,844 14,240 694 971 110.42%
103 United Overseas Bank Ltd. 31-Dec-20 2,426 454 666 2,214 450 - 1,764 1,437 201,544 141,760 915 50,848 43.6%
104 Wells Fargo Bank, National Association 31-Dec-20 85 1,517 1,632 (30) - - (30) (35) 18,853 8,037 - 711 381.0%
105 Westpac Banking Corporation 30-Sep-20 (4) 183 125 54 915 - (861) (874) 20,193 15,217 700 6,422 59.9%
106 Woori Bank 31-Dec-20 153 52 37 168 (6) - 174 152 24,661 14,919 31 1,970 111.3%
107 Yuanta Commercial Bank Co., Ltd. 31-Dec-20 45 4 41 8 80 - (72) (69) 3,564 1,269 18 3,103 88.9%
Total 2020 52,964 82,367 75,128 60,203 17,894 (192) 42,117 35,338 9,920,779 3,776,640 69,414 3,288,819 687
* Some branches hold impairment allowances of head office Source: Extracted from individual companies’ financial and public statements
© 2021 KPMG, a Hong Kong partnership and a member firm of the KPMG global organisation of independent member firms affiliated with KPMG International Limited, a private English company limited by guarantee. All rights reserved.
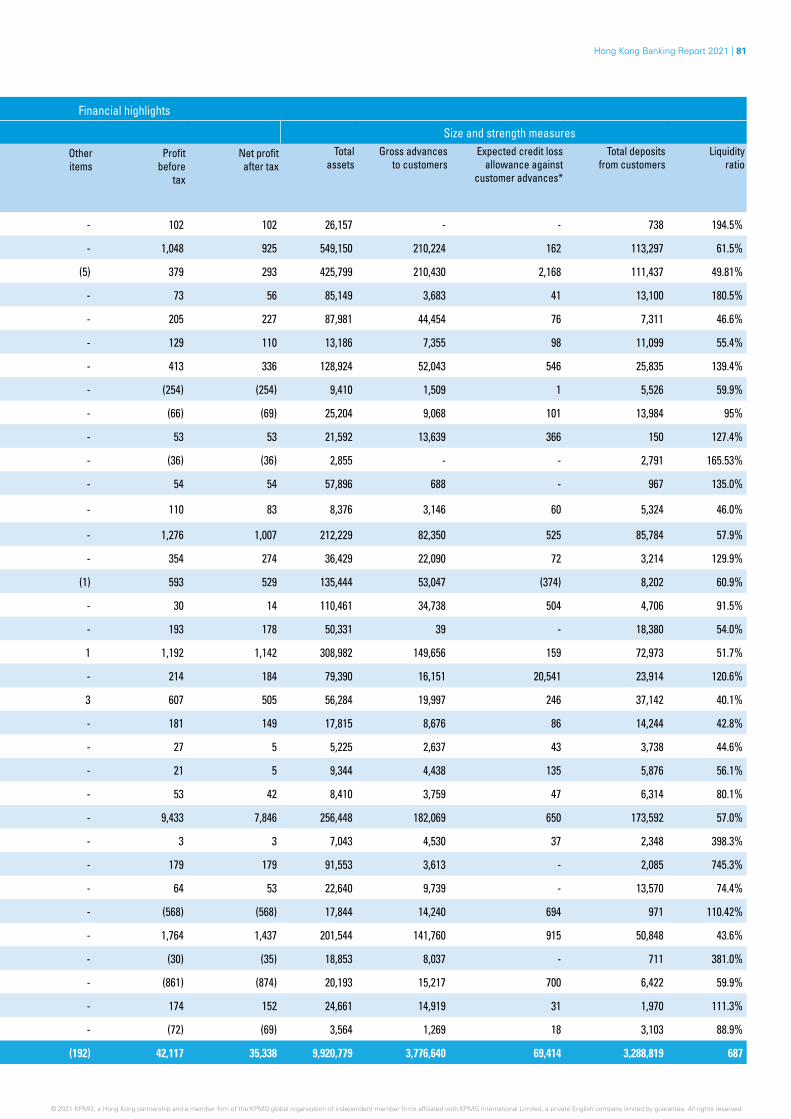
Hong Kong Banking Report 2021 | 81
Financial highlights
Income statement Size and strength measuresHK$ million Year ended Net interest
incomeNon-interest
incomeOperating expenses
Operating profit before
impairment charges
Change in expected credit
loss against customer advances
Other items
Profit before
tax
Net profit after tax
Total assets
Gross advances to customers
Expected credit loss allowance against
customer advances*
Total deposits from customers
Liquidity ratio
73 Mitsubishi UFJ Trust And Banking Corporation 31-Mar-20 127 34 59 102 - - 102 102 26,157 - - 738 194.5%
74 Mizuho Bank, Ltd. 31-Mar-20 462 1,470 782 1,150 102 - 1,048 925 549,150 210,224 162 113,297 61.5%
75 MUFG Bank, Ltd. 31-Mar-20 1,033 590 1,173 450 66 (5) 379 293 425,799 210,430 2,168 111,437 49.81%
76 National Australia Bank Limited 30-Sep-20 215 79 207 87 14 - 73 56 85,149 3,683 41 13,100 180.5%
77 Natixis 31-Dec-20 149 1,660 1,428 381 176 - 205 227 87,981 44,454 76 7,311 46.6%
78 O-Bank Co., Ltd. 31-Dec-20 233 70 113 190 61 - 129 110 13,186 7,355 98 11,099 55.4%
79 Oversea-Chinese Banking Corporation Limited 31-Dec-20 1,058 219 312 965 552 - 413 336 128,924 52,043 546 25,835 139.4%
80 Pictet & Cie (Europe) S.A. 31-Dec-20 9 270 534 (255) (1) - (254) (254) 9,410 1,509 1 5,526 59.9%
81 PING AN BANK CO., LTD. 31-Dec-20 126 151 212 65 131 - (66) (69) 25,204 9,068 101 13,984 95%
82 Punjab National Bank 31-Mar-20 115 26 25 116 63 - 53 53 21,592 13,639 366 150 127.4%
83 QATAR NATIONAL BANK (Q.P.S.C.) 31-Dec-20 (1) - 35 (36) - - (36) (36) 2,855 - - 2,791 165.53%
84 Royal Bank of Canada 31-Oct-20 68 815 829 54 - - 54 54 57,896 688 - 967 135.0%
85 Shanghai Commercial & Savings Bank, Ltd. (The) 31-Dec-20 134 33 40 127 17 - 110 83 8,376 3,146 60 5,324 46.0%
86 Shanghai Pudong Development Bank Co., Ltd. 31-Dec-20 953 1,041 522 1,472 196 - 1,276 1,007 212,229 82,350 525 85,784 57.9%
87 Shinhan Bank 31-Dec-20 283 147 71 359 5 - 354 274 36,429 22,090 72 3,214 129.9%
88 Societe Generale 31-Dec-20 188 2,478 1,817 849 255 (1) 593 529 135,444 53,047 (374) 8,202 60.9%
89 State Bank of India 31-Mar-20 454 156 314 296 266 - 30 14 110,461 34,738 504 4,706 91.5%
90 State Street Bank And Trust Company 31-Dec-20 218 1,579 1,604 193 - - 193 178 50,331 39 - 18,380 54.0%
91 Sumitomo Mitsui Banking Corporation 31-Mar-20 1,196 753 651 1,298 107 1 1,192 1,142 308,982 149,656 159 72,973 51.7%
92 Sumitomo Mitsui Trust Bank, Limited 31-Mar-20 (1,095) 1,394 85 214 - - 214 184 79,390 16,151 20,541 23,914 120.6%
93 Taipei Fubon Commercial Bank Co., Ltd. 31-Dec-20 543 264 194 613 9 3 607 505 56,284 19,997 246 37,142 40.1%
94 Taishin International Bank Co., Ltd 31-Dec-20 202 208 175 235 54 - 181 149 17,815 8,676 86 14,244 42.8%
95 Taiwan Business Bank, Ltd 31-Dec-20 95 9 37 67 40 - 27 5 5,225 2,637 43 3,738 44.6%
96 Taiwan Cooperative Bank, Ltd. 31-Dec-20 182 16 33 165 144 - 21 5 9,344 4,438 135 5,876 56.1%
97 Taiwan Shin Kong Commercial Bank Co., Ltd. 31-Dec-20 84 22 44 62 9 - 53 42 8,410 3,759 47 6,314 80.1%
98 UBS AG 31-Dec-20 2,823 18,176 10,920 10,079 646 - 9,433 7,846 256,448 182,069 650 173,592 57.0%
99 UCO Bank 31-Mar-20 68 140 47 161 158 - 3 3 7,043 4,530 37 2,348 398.3%
100 UniCredit Bank AG 31-Dec-20 529 (64) 286 179 - - 179 179 91,553 3,613 - 2,085 745.3%
101 Union Bancaire Privée, UBP SA 31-Dec-20 153 400 489 64 - - 64 53 22,640 9,739 - 13,570 74.4%
102 Union Bank of India 31-Mar-20 59 98 34 123 691 - (568) (568) 17,844 14,240 694 971 110.42%
103 United Overseas Bank Ltd. 31-Dec-20 2,426 454 666 2,214 450 - 1,764 1,437 201,544 141,760 915 50,848 43.6%
104 Wells Fargo Bank, National Association 31-Dec-20 85 1,517 1,632 (30) - - (30) (35) 18,853 8,037 - 711 381.0%
105 Westpac Banking Corporation 30-Sep-20 (4) 183 125 54 915 - (861) (874) 20,193 15,217 700 6,422 59.9%
106 Woori Bank 31-Dec-20 153 52 37 168 (6) - 174 152 24,661 14,919 31 1,970 111.3%
107 Yuanta Commercial Bank Co., Ltd. 31-Dec-20 45 4 41 8 80 - (72) (69) 3,564 1,269 18 3,103 88.9%
Total 2020 52,964 82,367 75,128 60,203 17,894 (192) 42,117 35,338 9,920,779 3,776,640 69,414 3,288,819 687
© 2021 KPMG, a Hong Kong partnership and a member firm of the KPMG global organisation of independent member firms affiliated with KPMG International Limited, a private English company limited by guarantee. All rights reserved. © 2021 KPMG, a Hong Kong partnership and a member firm of the KPMG global organisation of independent member firms affiliated with KPMG International Limited, a private English company limited by guarantee. All rights reserved.
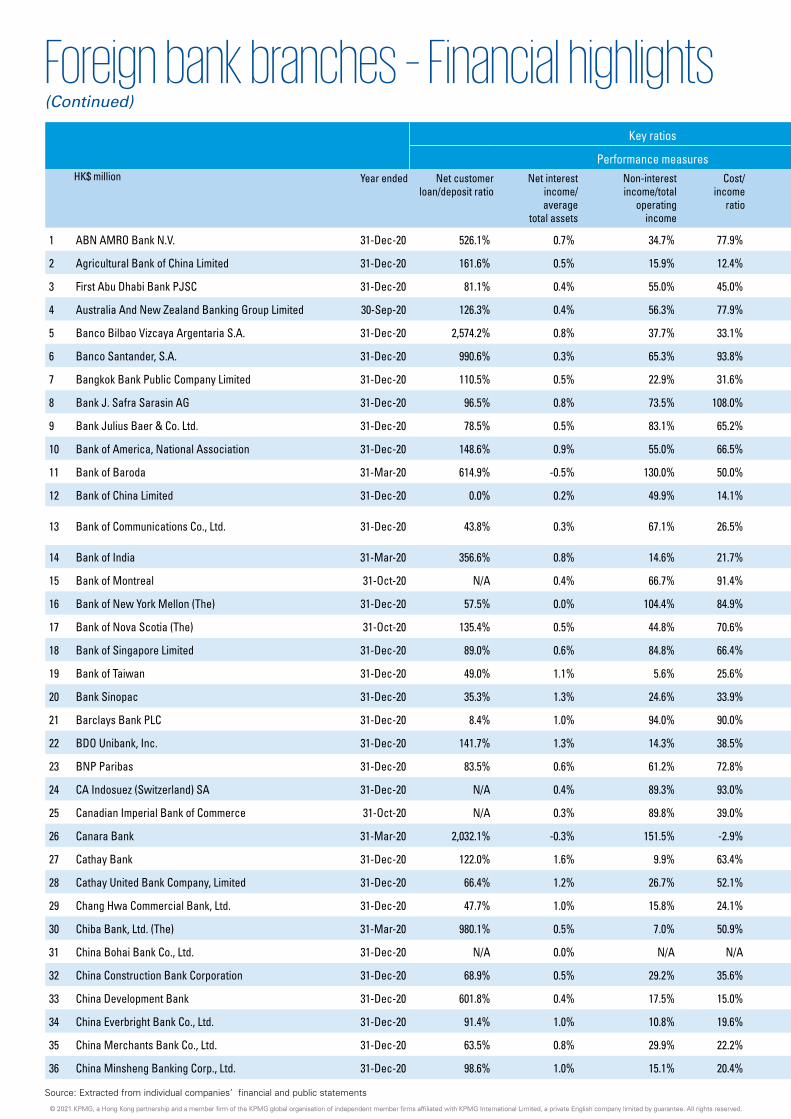
82 | Hong Kong Banking Report 2021
Source: Extracted from individual companies’ financial and public statements
Foreign bank branches – Financial highlights(Continued)
Key ratios Loan asset quality
Performance measures Impaired advances / Stage 3 advancesHK$ million Year ended Net customer
loan/deposit ratioNet interest
income/ average
total assets
Non-interest income/total
operating income
Cost/ income
ratio
ROA Gross impaired
advances
Gross impaired advances/
Advances to customers
Stage 3 expected credit loss allowane
made against impaired advances
Stage 3 expected credit loss allowance made against impaired
advances as percentage of gross impaired advances
Collateral for impaired
advances
1 ABN AMRO Bank N.V. 31-Dec-20 526.1% 0.7% 34.7% 77.9% -4.3% 73 2.6% 73 100.0% 6
2 Agricultural Bank of China Limited 31-Dec-20 161.6% 0.5% 15.9% 12.4% 0.4% 116 0.0% 112 96.6% 1
3 First Abu Dhabi Bank PJSC 31-Dec-20 81.1% 0.4% 55.0% 45.0% -0.9% - 0.0% - 0.0% -
4 Australia And New Zealand Banking Group Limited 30-Sep-20 126.3% 0.4% 56.3% 77.9% 0.1% 3 0.0% 3 100.0% -
5 Banco Bilbao Vizcaya Argentaria S.A. 31-Dec-20 2,574.2% 0.8% 37.7% 33.1% 0.6% 802 2.0% 14 1.7% 804
6 Banco Santander, S.A. 31-Dec-20 990.6% 0.3% 65.3% 93.8% 0.0% - 0.0% - 0.0% -
7 Bangkok Bank Public Company Limited 31-Dec-20 110.5% 0.5% 22.9% 31.6% 0.2% 126 0.8% 118 93.7% -
8 Bank J. Safra Sarasin AG 31-Dec-20 96.5% 0.8% 73.5% 108.0% -0.2% - 0.0% - 0.0% -
9 Bank Julius Baer & Co. Ltd. 31-Dec-20 78.5% 0.5% 83.1% 65.2% 0.9% - 0.0% - 0.0% -
10 Bank of America, National Association 31-Dec-20 148.6% 0.9% 55.0% 66.5% 0.7% 429 0.9% 405 94.4% -
11 Bank of Baroda 31-Mar-20 614.9% -0.5% 130.0% 50.0% -9.9% 268 53.8% 64 24.0% 43
12 Bank of China Limited 31-Dec-20 0.0% 0.2% 49.9% 14.1% 0.3% - 0.0% - 0.0% -
13 Bank of Communications Co., Ltd. 31-Dec-20 43.8% 0.3% 67.1% 26.5% 0.6% 2,601 2.0% 318 12.2% 2,378
14 Bank of India 31-Mar-20 356.6% 0.8% 14.6% 21.7% -1.0% 377 3.3% 290 76.9% 171
15 Bank of Montreal 31-Oct-20 N/A 0.4% 66.7% 91.4% 0.1% - 0.0% - 0.0% -
16 Bank of New York Mellon (The) 31-Dec-20 57.5% 0.0% 104.4% 84.9% 0.1% - 0.0% - 0.0% -
17 Bank of Nova Scotia (The) 31-Oct-20 135.4% 0.5% 44.8% 70.6% 0.3% - 0.0% - 0.0% -
18 Bank of Singapore Limited 31-Dec-20 89.0% 0.6% 84.8% 66.4% 1.1% 5 0.0% 5 100.0% -
19 Bank of Taiwan 31-Dec-20 49.0% 1.1% 5.6% 25.6% 0.3% 229 6.3% 87 38.0% -
20 Bank Sinopac 31-Dec-20 35.3% 1.3% 24.6% 33.9% 0.4% 92 1.0% N/A N/A -
21 Barclays Bank PLC 31-Dec-20 8.4% 1.0% 94.0% 90.0% 1.2% - 0.0% - 0.0% -
22 BDO Unibank, Inc. 31-Dec-20 141.7% 1.3% 14.3% 38.5% 0.6% N/A N/A N/A N/A N/A
23 BNP Paribas 31-Dec-20 83.5% 0.6% 61.2% 72.8% 0.3% 2,439 1.5% 759 31.1% 445
24 CA Indosuez (Switzerland) SA 31-Dec-20 N/A 0.4% 89.3% 93.0% 0.2% - 0.0% - 0.0% -
25 Canadian Imperial Bank of Commerce 31-Oct-20 N/A 0.3% 89.8% 39.0% 1.6% - 0.0% - 0.0% -
26 Canara Bank 31-Mar-20 2,032.1% -0.3% 151.5% -2.9% -0.1% - 0.0% - 0.0% -
27 Cathay Bank 31-Dec-20 122.0% 1.6% 9.9% 63.4% -1.5% 44 2.0% - 0.0% 1
28 Cathay United Bank Company, Limited 31-Dec-20 66.4% 1.2% 26.7% 52.1% 0.3% 296 2.2% 59 19.9% -
29 Chang Hwa Commercial Bank, Ltd. 31-Dec-20 47.7% 1.0% 15.8% 24.1% -0.3% 228 6.0% 73 32.0% -
30 Chiba Bank, Ltd. (The) 31-Mar-20 980.1% 0.5% 7.0% 50.9% 0.3% - 0.0% - 0.0% -
31 China Bohai Bank Co., Ltd. 31-Dec-20 N/A 0.0% N/A N/A 0.0% - N/A - 0.0% -
32 China Construction Bank Corporation 31-Dec-20 68.9% 0.5% 29.2% 35.6% 0.3% 28 0.1% 8 28.6% 28
33 China Development Bank 31-Dec-20 601.8% 0.4% 17.5% 15.0% 0.6% 5,775 2.7% 3,494 60.5% 601
34 China Everbright Bank Co., Ltd. 31-Dec-20 91.4% 1.0% 10.8% 19.6% 0.7% 10 0.0% 10 100.0% -
35 China Merchants Bank Co., Ltd. 31-Dec-20 63.5% 0.8% 29.9% 22.2% 0.7% 290 0.4% 53 18.3% 217
36 China Minsheng Banking Corp., Ltd. 31-Dec-20 98.6% 1.0% 15.1% 20.4% 0.7% 555 0.6% 241 43.4% 9
© 2021 KPMG, a Hong Kong partnership and a member firm of the KPMG global organisation of independent member firms affiliated with KPMG International Limited, a private English company limited by guarantee. All rights reserved.© 2021 KPMG, a Hong Kong partnership and a member firm of the KPMG global organisation of independent member firms affiliated with KPMG International Limited, a private English company limited by guarantee. All rights reserved.
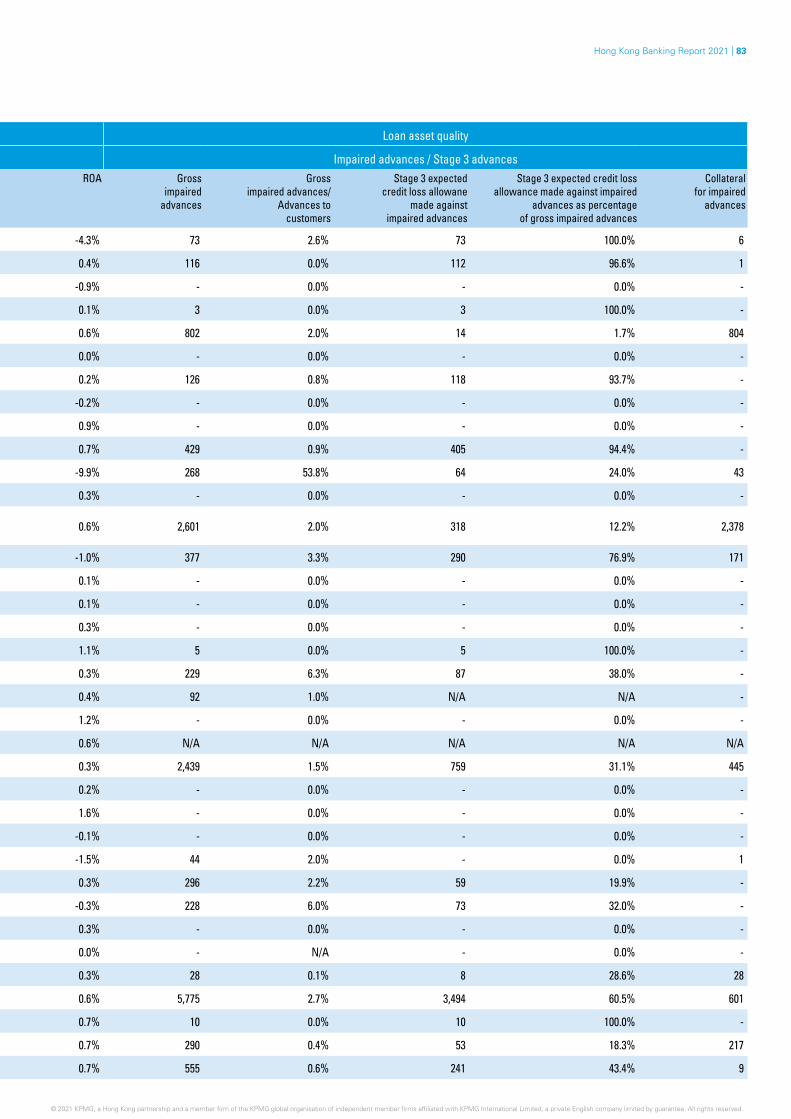
Hong Kong Banking Report 2021 | 83
Key ratios Loan asset quality
Performance measures Impaired advances / Stage 3 advancesHK$ million Year ended Net customer
loan/deposit ratioNet interest
income/ average
total assets
Non-interest income/total
operating income
Cost/ income
ratio
ROA Gross impaired
advances
Gross impaired advances/
Advances to customers
Stage 3 expected credit loss allowane
made against impaired advances
Stage 3 expected credit loss allowance made against impaired
advances as percentage of gross impaired advances
Collateral for impaired
advances
1 ABN AMRO Bank N.V. 31-Dec-20 526.1% 0.7% 34.7% 77.9% -4.3% 73 2.6% 73 100.0% 6
2 Agricultural Bank of China Limited 31-Dec-20 161.6% 0.5% 15.9% 12.4% 0.4% 116 0.0% 112 96.6% 1
3 First Abu Dhabi Bank PJSC 31-Dec-20 81.1% 0.4% 55.0% 45.0% -0.9% - 0.0% - 0.0% -
4 Australia And New Zealand Banking Group Limited 30-Sep-20 126.3% 0.4% 56.3% 77.9% 0.1% 3 0.0% 3 100.0% -
5 Banco Bilbao Vizcaya Argentaria S.A. 31-Dec-20 2,574.2% 0.8% 37.7% 33.1% 0.6% 802 2.0% 14 1.7% 804
6 Banco Santander, S.A. 31-Dec-20 990.6% 0.3% 65.3% 93.8% 0.0% - 0.0% - 0.0% -
7 Bangkok Bank Public Company Limited 31-Dec-20 110.5% 0.5% 22.9% 31.6% 0.2% 126 0.8% 118 93.7% -
8 Bank J. Safra Sarasin AG 31-Dec-20 96.5% 0.8% 73.5% 108.0% -0.2% - 0.0% - 0.0% -
9 Bank Julius Baer & Co. Ltd. 31-Dec-20 78.5% 0.5% 83.1% 65.2% 0.9% - 0.0% - 0.0% -
10 Bank of America, National Association 31-Dec-20 148.6% 0.9% 55.0% 66.5% 0.7% 429 0.9% 405 94.4% -
11 Bank of Baroda 31-Mar-20 614.9% -0.5% 130.0% 50.0% -9.9% 268 53.8% 64 24.0% 43
12 Bank of China Limited 31-Dec-20 0.0% 0.2% 49.9% 14.1% 0.3% - 0.0% - 0.0% -
13 Bank of Communications Co., Ltd. 31-Dec-20 43.8% 0.3% 67.1% 26.5% 0.6% 2,601 2.0% 318 12.2% 2,378
14 Bank of India 31-Mar-20 356.6% 0.8% 14.6% 21.7% -1.0% 377 3.3% 290 76.9% 171
15 Bank of Montreal 31-Oct-20 N/A 0.4% 66.7% 91.4% 0.1% - 0.0% - 0.0% -
16 Bank of New York Mellon (The) 31-Dec-20 57.5% 0.0% 104.4% 84.9% 0.1% - 0.0% - 0.0% -
17 Bank of Nova Scotia (The) 31-Oct-20 135.4% 0.5% 44.8% 70.6% 0.3% - 0.0% - 0.0% -
18 Bank of Singapore Limited 31-Dec-20 89.0% 0.6% 84.8% 66.4% 1.1% 5 0.0% 5 100.0% -
19 Bank of Taiwan 31-Dec-20 49.0% 1.1% 5.6% 25.6% 0.3% 229 6.3% 87 38.0% -
20 Bank Sinopac 31-Dec-20 35.3% 1.3% 24.6% 33.9% 0.4% 92 1.0% N/A N/A -
21 Barclays Bank PLC 31-Dec-20 8.4% 1.0% 94.0% 90.0% 1.2% - 0.0% - 0.0% -
22 BDO Unibank, Inc. 31-Dec-20 141.7% 1.3% 14.3% 38.5% 0.6% N/A N/A N/A N/A N/A
23 BNP Paribas 31-Dec-20 83.5% 0.6% 61.2% 72.8% 0.3% 2,439 1.5% 759 31.1% 445
24 CA Indosuez (Switzerland) SA 31-Dec-20 N/A 0.4% 89.3% 93.0% 0.2% - 0.0% - 0.0% -
25 Canadian Imperial Bank of Commerce 31-Oct-20 N/A 0.3% 89.8% 39.0% 1.6% - 0.0% - 0.0% -
26 Canara Bank 31-Mar-20 2,032.1% -0.3% 151.5% -2.9% -0.1% - 0.0% - 0.0% -
27 Cathay Bank 31-Dec-20 122.0% 1.6% 9.9% 63.4% -1.5% 44 2.0% - 0.0% 1
28 Cathay United Bank Company, Limited 31-Dec-20 66.4% 1.2% 26.7% 52.1% 0.3% 296 2.2% 59 19.9% -
29 Chang Hwa Commercial Bank, Ltd. 31-Dec-20 47.7% 1.0% 15.8% 24.1% -0.3% 228 6.0% 73 32.0% -
30 Chiba Bank, Ltd. (The) 31-Mar-20 980.1% 0.5% 7.0% 50.9% 0.3% - 0.0% - 0.0% -
31 China Bohai Bank Co., Ltd. 31-Dec-20 N/A 0.0% N/A N/A 0.0% - N/A - 0.0% -
32 China Construction Bank Corporation 31-Dec-20 68.9% 0.5% 29.2% 35.6% 0.3% 28 0.1% 8 28.6% 28
33 China Development Bank 31-Dec-20 601.8% 0.4% 17.5% 15.0% 0.6% 5,775 2.7% 3,494 60.5% 601
34 China Everbright Bank Co., Ltd. 31-Dec-20 91.4% 1.0% 10.8% 19.6% 0.7% 10 0.0% 10 100.0% -
35 China Merchants Bank Co., Ltd. 31-Dec-20 63.5% 0.8% 29.9% 22.2% 0.7% 290 0.4% 53 18.3% 217
36 China Minsheng Banking Corp., Ltd. 31-Dec-20 98.6% 1.0% 15.1% 20.4% 0.7% 555 0.6% 241 43.4% 9
© 2021 KPMG, a Hong Kong partnership and a member firm of the KPMG global organisation of independent member firms affiliated with KPMG International Limited, a private English company limited by guarantee. All rights reserved. © 2021 KPMG, a Hong Kong partnership and a member firm of the KPMG global organisation of independent member firms affiliated with KPMG International Limited, a private English company limited by guarantee. All rights reserved.© 2021 KPMG, a Hong Kong partnership and a member firm of the KPMG global organisation of independent member firms affiliated with KPMG International Limited, a private English company limited by guarantee. All rights reserved.
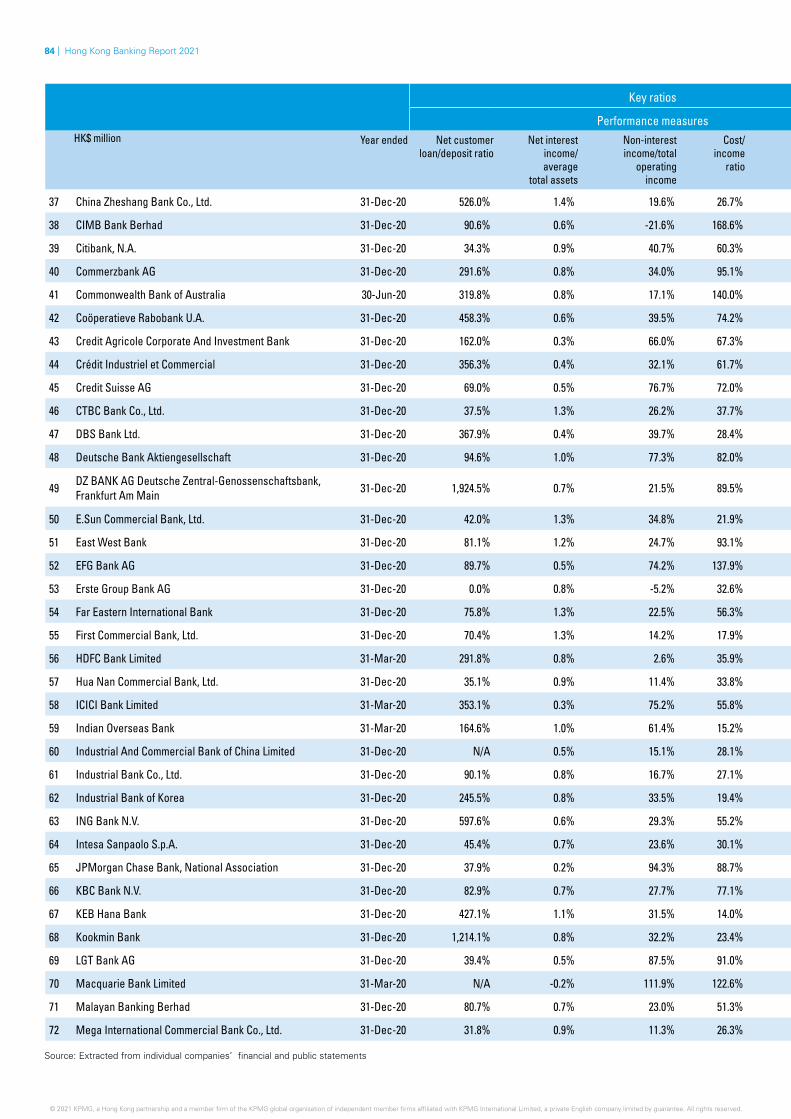
84 | Hong Kong Banking Report 2021
Source: Extracted from individual companies’ financial and public statements
Key ratios Loan asset quality
Performance measures Impaired advances / Stage 3 advancesHK$ million Year ended Net customer
loan/deposit ratioNet interest
income/ average
total assets
Non-interest income/total
operating income
Cost/ income
ratio
ROA Gross impaired
advances
Gross impaired advances/
Advances to customers
Stage 3 expected credit loss allowane
made against impaired advances
Stage 3 expected credit loss allowance made against impaired
advances as percentage of gross impaired advances
Collateral for impaired
advances
37 China Zheshang Bank Co., Ltd. 31-Dec-20 526.0% 1.4% 19.6% 26.7% 1.1% - 0.0% - 0.0% -
38 CIMB Bank Berhad 31-Dec-20 90.6% 0.6% -21.6% 168.6% -1.7% - 0.0% - 0.0% -
39 Citibank, N.A. 31-Dec-20 34.3% 0.9% 40.7% 60.3% 0.4% 302 0.2% 171 56.6% 23
40 Commerzbank AG 31-Dec-20 291.6% 0.8% 34.0% 95.1% -1.3% 331 3.6% 325 98.2% -
41 Commonwealth Bank of Australia 30-Jun-20 319.8% 0.8% 17.1% 140.0% -6.0% 654 13.7% 591 90.4% N/A
42 Coöperatieve Rabobank U.A. 31-Dec-20 458.3% 0.6% 39.5% 74.2% -0.1% 1,078 2.9% 397 36.8% 489
43 Credit Agricole Corporate And Investment Bank 31-Dec-20 162.0% 0.3% 66.0% 67.3% 0.2% 160 0.3% 60 37.5% N/A
44 Crédit Industriel et Commercial 31-Dec-20 356.3% 0.4% 32.1% 61.7% 0.1% - 0.0% - 0.0% -
45 Credit Suisse AG 31-Dec-20 69.0% 0.5% 76.7% 72.0% 0.3% 24 0.0% 14 58.3% 15
46 CTBC Bank Co., Ltd. 31-Dec-20 37.5% 1.3% 26.2% 37.7% 0.8% 408 1.7% 256 62.7% -
47 DBS Bank Ltd. 31-Dec-20 367.9% 0.4% 39.7% 28.4% 0.3% N/A N/A N/A 0.0% N/A
48 Deutsche Bank Aktiengesellschaft 31-Dec-20 94.6% 1.0% 77.3% 82.0% 0.6% 3,530 7.0% 1,095 31.0% 1,996
49 DZ BANK AG Deutsche Zentral-Genossenschaftsbank, Frankfurt Am Main 31-Dec-20 1,924.5% 0.7% 21.5% 89.5% -0.1% 333 3.7% 165 49.5% -
50 E.Sun Commercial Bank, Ltd. 31-Dec-20 42.0% 1.3% 34.8% 21.9% 1.3% - 0.0% - N/A -
51 East West Bank 31-Dec-20 81.1% 1.2% 24.7% 93.1% 0.3% - 0.0% - 0.0% -
52 EFG Bank AG 31-Dec-20 89.7% 0.5% 74.2% 137.9% -0.7% - 0.0% - 0.0% -
53 Erste Group Bank AG 31-Dec-20 0.0% 0.8% -5.2% 32.6% 0.4% N/A N/A N/A N/A N/A
54 Far Eastern International Bank 31-Dec-20 75.8% 1.3% 22.5% 56.3% -2.3% 67 3.1% 13 19.4% -
55 First Commercial Bank, Ltd. 31-Dec-20 70.4% 1.3% 14.2% 17.9% 0.8% 221 2.4% 78 35.3% -
56 HDFC Bank Limited 31-Mar-20 291.8% 0.8% 2.6% 35.9% 0.3% - 0.0% - 0.0% -
57 Hua Nan Commercial Bank, Ltd. 31-Dec-20 35.1% 0.9% 11.4% 33.8% 0.5% 80 N/A 8 9.9% -
58 ICICI Bank Limited 31-Mar-20 353.1% 0.3% 75.2% 55.8% -0.1% 210 2.9% 140 66.7% -
59 Indian Overseas Bank 31-Mar-20 164.6% 1.0% 61.4% 15.2% -0.4% 20 0.7% 6 30.0% 1
60 Industrial And Commercial Bank of China Limited 31-Dec-20 N/A 0.5% 15.1% 28.1% 0.3% 30 0.0% 30 100.0% -
61 Industrial Bank Co., Ltd. 31-Dec-20 90.1% 0.8% 16.7% 27.1% -0.7% N/A N/A N/A N/A N/A
62 Industrial Bank of Korea 31-Dec-20 245.5% 0.8% 33.5% 19.4% 0.8% - 0.0% - 0.0% N/A
63 ING Bank N.V. 31-Dec-20 597.6% 0.6% 29.3% 55.2% -0.1% 1,447 3.7% 443 30.6% 5
64 Intesa Sanpaolo S.p.A. 31-Dec-20 45.4% 0.7% 23.6% 30.1% 0.0% 1,087 5.3% 579 53.3% 71
65 JPMorgan Chase Bank, National Association 31-Dec-20 37.9% 0.2% 94.3% 88.7% 0.4% - 0.0% - 0.0% -
66 KBC Bank N.V. 31-Dec-20 82.9% 0.7% 27.7% 77.1% 0.1% 19 1.6% 18 94.7% -
67 KEB Hana Bank 31-Dec-20 427.1% 1.1% 31.5% 14.0% 0.8% - 0.0% - 0.0% -
68 Kookmin Bank 31-Dec-20 1,214.1% 0.8% 32.2% 23.4% 0.4% - 0.0% - 0.0% -
69 LGT Bank AG 31-Dec-20 39.4% 0.5% 87.5% 91.0% 0.3% - 0.0% - 0.0% -
70 Macquarie Bank Limited 31-Mar-20 N/A -0.2% 111.9% 122.6% -0.5% - N/A - 0.0% -
71 Malayan Banking Berhad 31-Dec-20 80.7% 0.7% 23.0% 51.3% -0.2% 249 1.2% 208 83.5% N/A
72 Mega International Commercial Bank Co., Ltd. 31-Dec-20 31.8% 0.9% 11.3% 26.3% 0.6% - 0.0% - 0.0% -
© 2021 KPMG, a Hong Kong partnership and a member firm of the KPMG global organisation of independent member firms affiliated with KPMG International Limited, a private English company limited by guarantee. All rights reserved.
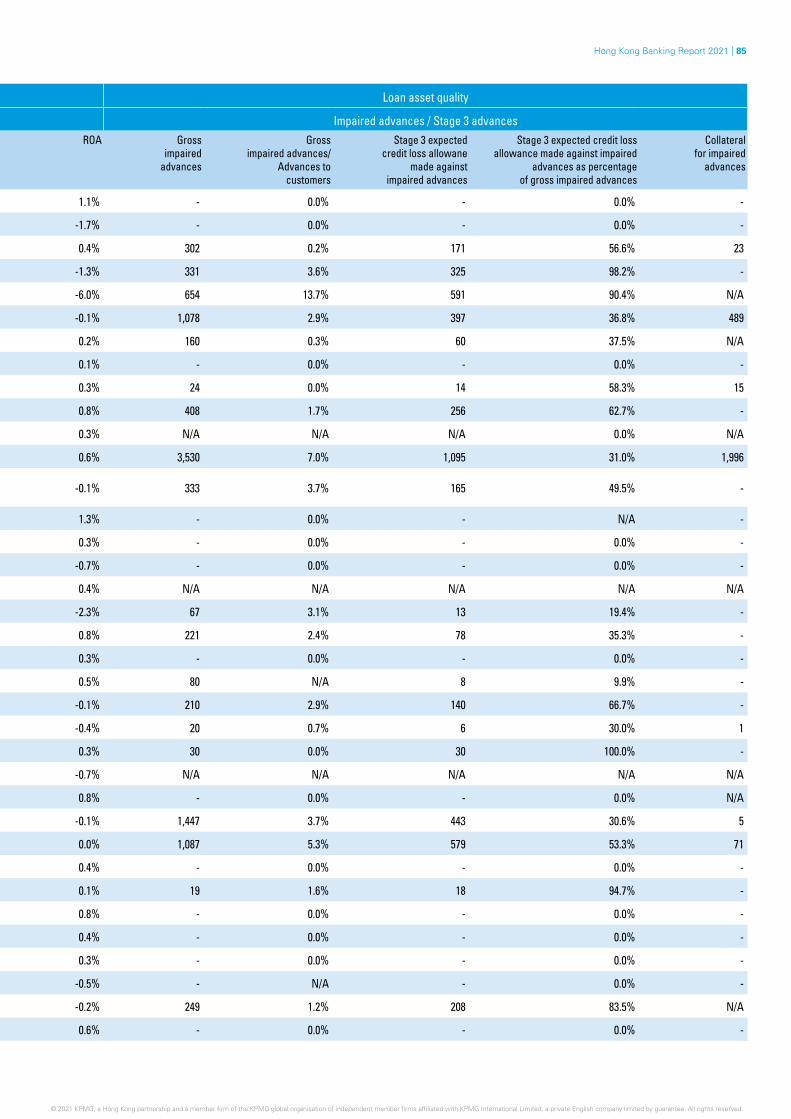
Hong Kong Banking Report 2021 | 85
Key ratios Loan asset quality
Performance measures Impaired advances / Stage 3 advancesHK$ million Year ended Net customer
loan/deposit ratioNet interest
income/ average
total assets
Non-interest income/total
operating income
Cost/ income
ratio
ROA Gross impaired
advances
Gross impaired advances/
Advances to customers
Stage 3 expected credit loss allowane
made against impaired advances
Stage 3 expected credit loss allowance made against impaired
advances as percentage of gross impaired advances
Collateral for impaired
advances
37 China Zheshang Bank Co., Ltd. 31-Dec-20 526.0% 1.4% 19.6% 26.7% 1.1% - 0.0% - 0.0% -
38 CIMB Bank Berhad 31-Dec-20 90.6% 0.6% -21.6% 168.6% -1.7% - 0.0% - 0.0% -
39 Citibank, N.A. 31-Dec-20 34.3% 0.9% 40.7% 60.3% 0.4% 302 0.2% 171 56.6% 23
40 Commerzbank AG 31-Dec-20 291.6% 0.8% 34.0% 95.1% -1.3% 331 3.6% 325 98.2% -
41 Commonwealth Bank of Australia 30-Jun-20 319.8% 0.8% 17.1% 140.0% -6.0% 654 13.7% 591 90.4% N/A
42 Coöperatieve Rabobank U.A. 31-Dec-20 458.3% 0.6% 39.5% 74.2% -0.1% 1,078 2.9% 397 36.8% 489
43 Credit Agricole Corporate And Investment Bank 31-Dec-20 162.0% 0.3% 66.0% 67.3% 0.2% 160 0.3% 60 37.5% N/A
44 Crédit Industriel et Commercial 31-Dec-20 356.3% 0.4% 32.1% 61.7% 0.1% - 0.0% - 0.0% -
45 Credit Suisse AG 31-Dec-20 69.0% 0.5% 76.7% 72.0% 0.3% 24 0.0% 14 58.3% 15
46 CTBC Bank Co., Ltd. 31-Dec-20 37.5% 1.3% 26.2% 37.7% 0.8% 408 1.7% 256 62.7% -
47 DBS Bank Ltd. 31-Dec-20 367.9% 0.4% 39.7% 28.4% 0.3% N/A N/A N/A 0.0% N/A
48 Deutsche Bank Aktiengesellschaft 31-Dec-20 94.6% 1.0% 77.3% 82.0% 0.6% 3,530 7.0% 1,095 31.0% 1,996
49 DZ BANK AG Deutsche Zentral-Genossenschaftsbank, Frankfurt Am Main 31-Dec-20 1,924.5% 0.7% 21.5% 89.5% -0.1% 333 3.7% 165 49.5% -
50 E.Sun Commercial Bank, Ltd. 31-Dec-20 42.0% 1.3% 34.8% 21.9% 1.3% - 0.0% - N/A -
51 East West Bank 31-Dec-20 81.1% 1.2% 24.7% 93.1% 0.3% - 0.0% - 0.0% -
52 EFG Bank AG 31-Dec-20 89.7% 0.5% 74.2% 137.9% -0.7% - 0.0% - 0.0% -
53 Erste Group Bank AG 31-Dec-20 0.0% 0.8% -5.2% 32.6% 0.4% N/A N/A N/A N/A N/A
54 Far Eastern International Bank 31-Dec-20 75.8% 1.3% 22.5% 56.3% -2.3% 67 3.1% 13 19.4% -
55 First Commercial Bank, Ltd. 31-Dec-20 70.4% 1.3% 14.2% 17.9% 0.8% 221 2.4% 78 35.3% -
56 HDFC Bank Limited 31-Mar-20 291.8% 0.8% 2.6% 35.9% 0.3% - 0.0% - 0.0% -
57 Hua Nan Commercial Bank, Ltd. 31-Dec-20 35.1% 0.9% 11.4% 33.8% 0.5% 80 N/A 8 9.9% -
58 ICICI Bank Limited 31-Mar-20 353.1% 0.3% 75.2% 55.8% -0.1% 210 2.9% 140 66.7% -
59 Indian Overseas Bank 31-Mar-20 164.6% 1.0% 61.4% 15.2% -0.4% 20 0.7% 6 30.0% 1
60 Industrial And Commercial Bank of China Limited 31-Dec-20 N/A 0.5% 15.1% 28.1% 0.3% 30 0.0% 30 100.0% -
61 Industrial Bank Co., Ltd. 31-Dec-20 90.1% 0.8% 16.7% 27.1% -0.7% N/A N/A N/A N/A N/A
62 Industrial Bank of Korea 31-Dec-20 245.5% 0.8% 33.5% 19.4% 0.8% - 0.0% - 0.0% N/A
63 ING Bank N.V. 31-Dec-20 597.6% 0.6% 29.3% 55.2% -0.1% 1,447 3.7% 443 30.6% 5
64 Intesa Sanpaolo S.p.A. 31-Dec-20 45.4% 0.7% 23.6% 30.1% 0.0% 1,087 5.3% 579 53.3% 71
65 JPMorgan Chase Bank, National Association 31-Dec-20 37.9% 0.2% 94.3% 88.7% 0.4% - 0.0% - 0.0% -
66 KBC Bank N.V. 31-Dec-20 82.9% 0.7% 27.7% 77.1% 0.1% 19 1.6% 18 94.7% -
67 KEB Hana Bank 31-Dec-20 427.1% 1.1% 31.5% 14.0% 0.8% - 0.0% - 0.0% -
68 Kookmin Bank 31-Dec-20 1,214.1% 0.8% 32.2% 23.4% 0.4% - 0.0% - 0.0% -
69 LGT Bank AG 31-Dec-20 39.4% 0.5% 87.5% 91.0% 0.3% - 0.0% - 0.0% -
70 Macquarie Bank Limited 31-Mar-20 N/A -0.2% 111.9% 122.6% -0.5% - N/A - 0.0% -
71 Malayan Banking Berhad 31-Dec-20 80.7% 0.7% 23.0% 51.3% -0.2% 249 1.2% 208 83.5% N/A
72 Mega International Commercial Bank Co., Ltd. 31-Dec-20 31.8% 0.9% 11.3% 26.3% 0.6% - 0.0% - 0.0% -
© 2021 KPMG, a Hong Kong partnership and a member firm of the KPMG global organisation of independent member firms affiliated with KPMG International Limited, a private English company limited by guarantee. All rights reserved. © 2021 KPMG, a Hong Kong partnership and a member firm of the KPMG global organisation of independent member firms affiliated with KPMG International Limited, a private English company limited by guarantee. All rights reserved.
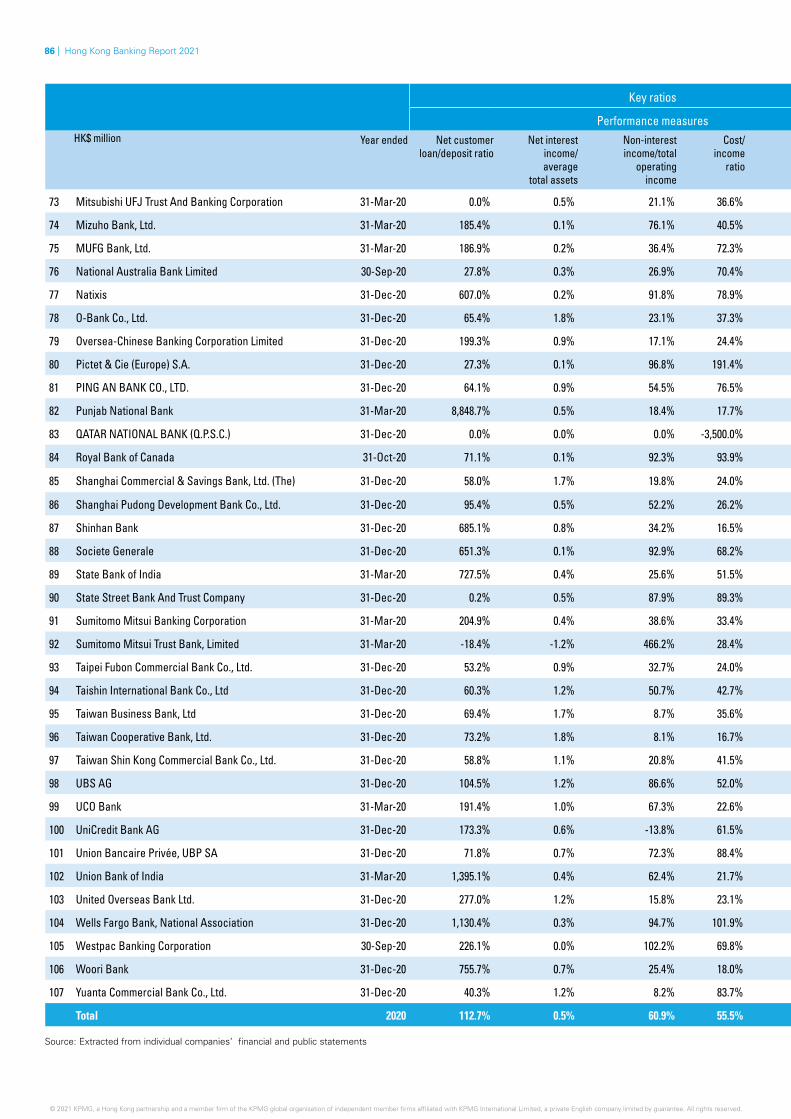
86 | Hong Kong Banking Report 2021
Source: Extracted from individual companies’ financial and public statements
Key ratios Loan asset quality
Performance measures Impaired advances / Stage 3 advancesHK$ million Year ended Net customer
loan/deposit ratioNet interest
income/ average
total assets
Non-interest income/total
operating income
Cost/ income
ratio
ROA Gross impaired
advances
Gross impaired advances/
Advances to customers
Stage 3 expected credit loss allowane
made against impaired advances
Stage 3 expected credit loss allowance made against impaired
advances as percentage of gross impaired advances
Collateral for impaired
advances
73 Mitsubishi UFJ Trust And Banking Corporation 31-Mar-20 0.0% 0.5% 21.1% 36.6% 0.4% - N/A - 0.0% -
74 Mizuho Bank, Ltd. 31-Mar-20 185.4% 0.1% 76.1% 40.5% 0.2% 613 0.3% 162 26.4% 1
75 MUFG Bank, Ltd. 31-Mar-20 186.9% 0.2% 36.4% 72.3% 0.1% 117 0.1% 57 48.7% -
76 National Australia Bank Limited 30-Sep-20 27.8% 0.3% 26.9% 70.4% 0.1% 4 0.1% - 0.0% N/A
77 Natixis 31-Dec-20 607.0% 0.2% 91.8% 78.9% 0.2% 119 0.3% 41 34.5% -
78 O-Bank Co., Ltd. 31-Dec-20 65.4% 1.8% 23.1% 37.3% 0.8% 66 0.9% 7 10.6% 66
79 Oversea-Chinese Banking Corporation Limited 31-Dec-20 199.3% 0.9% 17.1% 24.4% 0.3% 961 1.8% 460 47.9% 327
80 Pictet & Cie (Europe) S.A. 31-Dec-20 27.3% 0.1% 96.8% 191.4% -3.1% - 0.0% - 0.0% -
81 PING AN BANK CO., LTD. 31-Dec-20 64.1% 0.9% 54.5% 76.5% -0.5% - 0.0% - 0.0% -
82 Punjab National Bank 31-Mar-20 8,848.7% 0.5% 18.4% 17.7% 0.2% 146 1.1% 217 148.6% N/A
83 QATAR NATIONAL BANK (Q.P.S.C.) 31-Dec-20 0.0% 0.0% 0.0% -3,500.0% -1.3% - N/A - 0.0% -
84 Royal Bank of Canada 31-Oct-20 71.1% 0.1% 92.3% 93.9% 0.1% - 0.0% - 0.0% -
85 Shanghai Commercial & Savings Bank, Ltd. (The) 31-Dec-20 58.0% 1.7% 19.8% 24.0% 1.0% 22 0.7% 14 63.6% -
86 Shanghai Pudong Development Bank Co., Ltd. 31-Dec-20 95.4% 0.5% 52.2% 26.2% 0.5% 233 0.3% 173 74.2% N/A
87 Shinhan Bank 31-Dec-20 685.1% 0.8% 34.2% 16.5% 0.8% - 0.0% - 0.0% -
88 Societe Generale 31-Dec-20 651.3% 0.1% 92.9% 68.2% 0.4% 1,018 1.9% 279 27.4% -
89 State Bank of India 31-Mar-20 727.5% 0.4% 25.6% 51.5% 0.0% 194 0.6% - 0.0% -
90 State Street Bank And Trust Company 31-Dec-20 0.2% 0.5% 87.9% 89.3% 0.4% - 0.0% - 0.0% -
91 Sumitomo Mitsui Banking Corporation 31-Mar-20 204.9% 0.4% 38.6% 33.4% 0.4% 506 0.3% 159 31.4% -
92 Sumitomo Mitsui Trust Bank, Limited 31-Mar-20 -18.4% -1.2% 466.2% 28.4% 0.2% - 0.0% - 0.0% -
93 Taipei Fubon Commercial Bank Co., Ltd. 31-Dec-20 53.2% 0.9% 32.7% 24.0% 0.9% 269 1.3% 49 18.2% -
94 Taishin International Bank Co., Ltd 31-Dec-20 60.3% 1.2% 50.7% 42.7% 0.9% 62 0.7% 62 100.0% -
95 Taiwan Business Bank, Ltd 31-Dec-20 69.4% 1.7% 8.7% 35.6% 0.1% 67 2.5% 16 23.9% N/A
96 Taiwan Cooperative Bank, Ltd. 31-Dec-20 73.2% 1.8% 8.1% 16.7% 0.0% 314 7.1% 79 25.2% -
97 Taiwan Shin Kong Commercial Bank Co., Ltd. 31-Dec-20 58.8% 1.1% 20.8% 41.5% 0.5% - 0.0% - 0.0% -
98 UBS AG 31-Dec-20 104.5% 1.2% 86.6% 52.0% 3.2% 2,042 1.1% 650 31.8% 2,042
99 UCO Bank 31-Mar-20 191.4% 1.0% 67.3% 22.6% 0.0% 76 1.7% 9 11.8% 61
100 UniCredit Bank AG 31-Dec-20 173.3% 0.6% -13.8% 61.5% 0.2% - 0.0% - 0.0% -
101 Union Bancaire Privée, UBP SA 31-Dec-20 71.8% 0.7% 72.3% 88.4% 0.2% - 0.0% - 0.0% -
102 Union Bank of India 31-Mar-20 1,395.1% 0.4% 62.4% 21.7% -3.5% 823 5.8% 352 42.8% 731
103 United Overseas Bank Ltd. 31-Dec-20 277.0% 1.2% 15.8% 23.1% 0.7% 1,678 1.2% 469 27.9% 728
104 Wells Fargo Bank, National Association 31-Dec-20 1,130.4% 0.3% 94.7% 101.9% -0.1% - 0.0% - N/A -
105 Westpac Banking Corporation 30-Sep-20 226.1% 0.0% 102.2% 69.8% -3.3% 1,078 7.1% 639 59.3% -
106 Woori Bank 31-Dec-20 755.7% 0.7% 25.4% 18.0% 0.7% - 0.0% - 0.0% N/A
107 Yuanta Commercial Bank Co., Ltd. 31-Dec-20 40.3% 1.2% 8.2% 83.7% -1.8% - 0.0% - 0.0% -
Total 2020 112.7% 0.5% 60.9% 55.5% 0.4% 35,364 0.9% 14,677 41.5% 11,260
© 2021 KPMG, a Hong Kong partnership and a member firm of the KPMG global organisation of independent member firms affiliated with KPMG International Limited, a private English company limited by guarantee. All rights reserved.
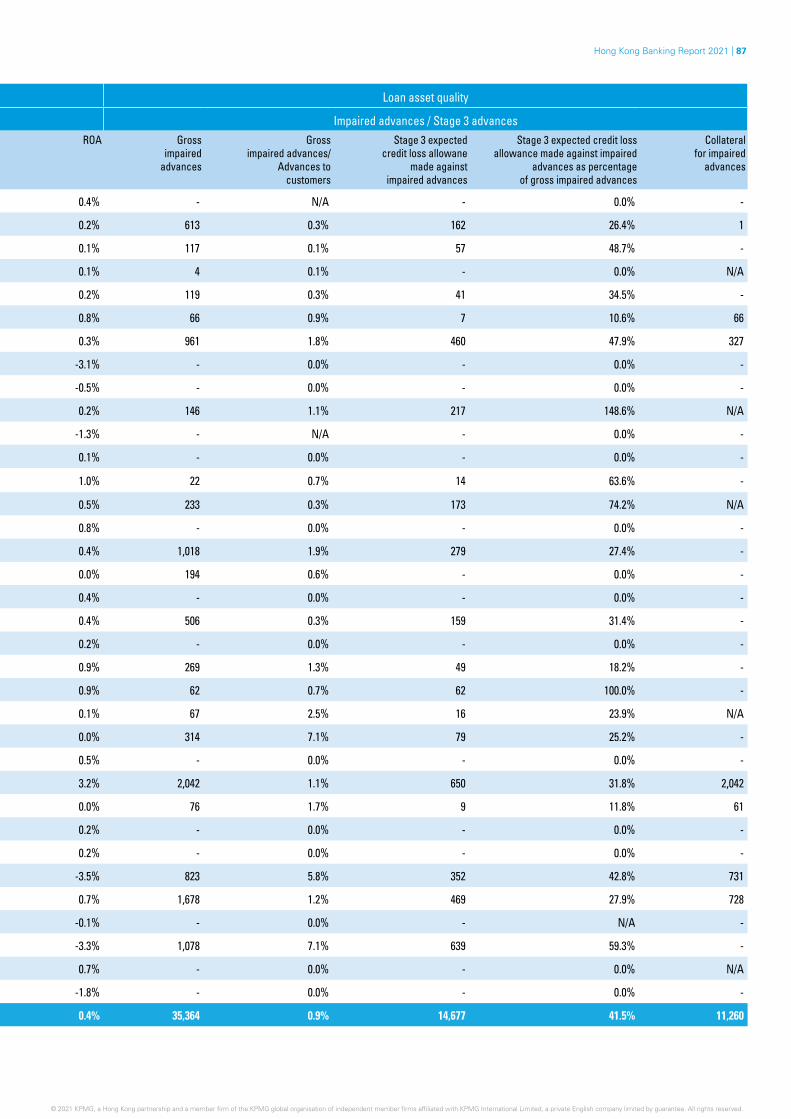
Hong Kong Banking Report 2021 | 87
Key ratios Loan asset quality
Performance measures Impaired advances / Stage 3 advancesHK$ million Year ended Net customer
loan/deposit ratioNet interest
income/ average
total assets
Non-interest income/total
operating income
Cost/ income
ratio
ROA Gross impaired
advances
Gross impaired advances/
Advances to customers
Stage 3 expected credit loss allowane
made against impaired advances
Stage 3 expected credit loss allowance made against impaired
advances as percentage of gross impaired advances
Collateral for impaired
advances
73 Mitsubishi UFJ Trust And Banking Corporation 31-Mar-20 0.0% 0.5% 21.1% 36.6% 0.4% - N/A - 0.0% -
74 Mizuho Bank, Ltd. 31-Mar-20 185.4% 0.1% 76.1% 40.5% 0.2% 613 0.3% 162 26.4% 1
75 MUFG Bank, Ltd. 31-Mar-20 186.9% 0.2% 36.4% 72.3% 0.1% 117 0.1% 57 48.7% -
76 National Australia Bank Limited 30-Sep-20 27.8% 0.3% 26.9% 70.4% 0.1% 4 0.1% - 0.0% N/A
77 Natixis 31-Dec-20 607.0% 0.2% 91.8% 78.9% 0.2% 119 0.3% 41 34.5% -
78 O-Bank Co., Ltd. 31-Dec-20 65.4% 1.8% 23.1% 37.3% 0.8% 66 0.9% 7 10.6% 66
79 Oversea-Chinese Banking Corporation Limited 31-Dec-20 199.3% 0.9% 17.1% 24.4% 0.3% 961 1.8% 460 47.9% 327
80 Pictet & Cie (Europe) S.A. 31-Dec-20 27.3% 0.1% 96.8% 191.4% -3.1% - 0.0% - 0.0% -
81 PING AN BANK CO., LTD. 31-Dec-20 64.1% 0.9% 54.5% 76.5% -0.5% - 0.0% - 0.0% -
82 Punjab National Bank 31-Mar-20 8,848.7% 0.5% 18.4% 17.7% 0.2% 146 1.1% 217 148.6% N/A
83 QATAR NATIONAL BANK (Q.P.S.C.) 31-Dec-20 0.0% 0.0% 0.0% -3,500.0% -1.3% - N/A - 0.0% -
84 Royal Bank of Canada 31-Oct-20 71.1% 0.1% 92.3% 93.9% 0.1% - 0.0% - 0.0% -
85 Shanghai Commercial & Savings Bank, Ltd. (The) 31-Dec-20 58.0% 1.7% 19.8% 24.0% 1.0% 22 0.7% 14 63.6% -
86 Shanghai Pudong Development Bank Co., Ltd. 31-Dec-20 95.4% 0.5% 52.2% 26.2% 0.5% 233 0.3% 173 74.2% N/A
87 Shinhan Bank 31-Dec-20 685.1% 0.8% 34.2% 16.5% 0.8% - 0.0% - 0.0% -
88 Societe Generale 31-Dec-20 651.3% 0.1% 92.9% 68.2% 0.4% 1,018 1.9% 279 27.4% -
89 State Bank of India 31-Mar-20 727.5% 0.4% 25.6% 51.5% 0.0% 194 0.6% - 0.0% -
90 State Street Bank And Trust Company 31-Dec-20 0.2% 0.5% 87.9% 89.3% 0.4% - 0.0% - 0.0% -
91 Sumitomo Mitsui Banking Corporation 31-Mar-20 204.9% 0.4% 38.6% 33.4% 0.4% 506 0.3% 159 31.4% -
92 Sumitomo Mitsui Trust Bank, Limited 31-Mar-20 -18.4% -1.2% 466.2% 28.4% 0.2% - 0.0% - 0.0% -
93 Taipei Fubon Commercial Bank Co., Ltd. 31-Dec-20 53.2% 0.9% 32.7% 24.0% 0.9% 269 1.3% 49 18.2% -
94 Taishin International Bank Co., Ltd 31-Dec-20 60.3% 1.2% 50.7% 42.7% 0.9% 62 0.7% 62 100.0% -
95 Taiwan Business Bank, Ltd 31-Dec-20 69.4% 1.7% 8.7% 35.6% 0.1% 67 2.5% 16 23.9% N/A
96 Taiwan Cooperative Bank, Ltd. 31-Dec-20 73.2% 1.8% 8.1% 16.7% 0.0% 314 7.1% 79 25.2% -
97 Taiwan Shin Kong Commercial Bank Co., Ltd. 31-Dec-20 58.8% 1.1% 20.8% 41.5% 0.5% - 0.0% - 0.0% -
98 UBS AG 31-Dec-20 104.5% 1.2% 86.6% 52.0% 3.2% 2,042 1.1% 650 31.8% 2,042
99 UCO Bank 31-Mar-20 191.4% 1.0% 67.3% 22.6% 0.0% 76 1.7% 9 11.8% 61
100 UniCredit Bank AG 31-Dec-20 173.3% 0.6% -13.8% 61.5% 0.2% - 0.0% - 0.0% -
101 Union Bancaire Privée, UBP SA 31-Dec-20 71.8% 0.7% 72.3% 88.4% 0.2% - 0.0% - 0.0% -
102 Union Bank of India 31-Mar-20 1,395.1% 0.4% 62.4% 21.7% -3.5% 823 5.8% 352 42.8% 731
103 United Overseas Bank Ltd. 31-Dec-20 277.0% 1.2% 15.8% 23.1% 0.7% 1,678 1.2% 469 27.9% 728
104 Wells Fargo Bank, National Association 31-Dec-20 1,130.4% 0.3% 94.7% 101.9% -0.1% - 0.0% - N/A -
105 Westpac Banking Corporation 30-Sep-20 226.1% 0.0% 102.2% 69.8% -3.3% 1,078 7.1% 639 59.3% -
106 Woori Bank 31-Dec-20 755.7% 0.7% 25.4% 18.0% 0.7% - 0.0% - 0.0% N/A
107 Yuanta Commercial Bank Co., Ltd. 31-Dec-20 40.3% 1.2% 8.2% 83.7% -1.8% - 0.0% - 0.0% -
Total 2020 112.7% 0.5% 60.9% 55.5% 0.4% 35,364 0.9% 14,677 41.5% 11,260
© 2021 KPMG, a Hong Kong partnership and a member firm of the KPMG global organisation of independent member firms affiliated with KPMG International Limited, a private English company limited by guarantee. All rights reserved. © 2021 KPMG, a Hong Kong partnership and a member firm of the KPMG global organisation of independent member firms affiliated with KPMG International Limited, a private English company limited by guarantee. All rights reserved.
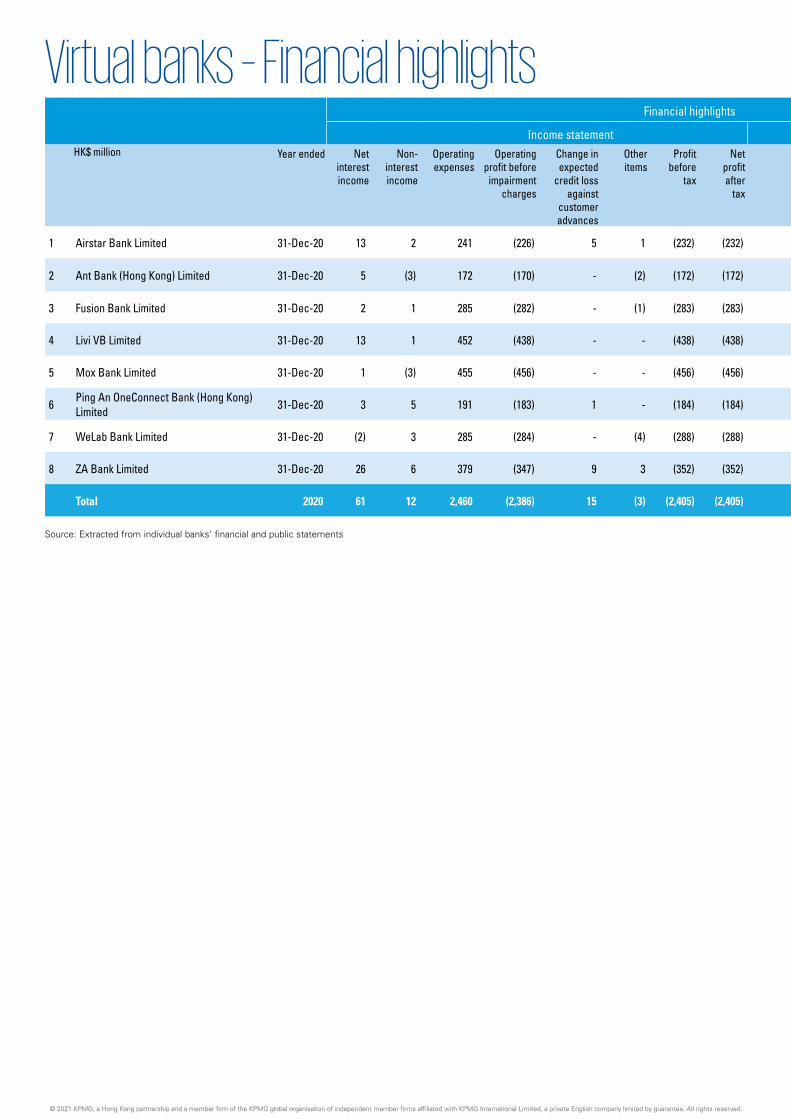
88 | Hong Kong Banking Report 2021
Financial highlights Key ratios
Income statement Size and strength measures Performance measuresHK$ million Year ended Net
interest income
Non- interest income
Operating expenses
Operating profit before
impairment charges
Change in expected
credit loss against
customer advances
Other items
Profit before
tax
Net profit after
tax
Total assets
Gross advances to
customers
Expected credit loss allowance
against customer advances
Total deposits
from customers
Total equity
Capital adequacy
ratio
Liquidity ratio
Net customer
loan/ deposit
ratio
Net interest income/ average
total assets
Non- interest income/
total operating
income
Cost/ income
ratio
ROA ROE
1 Airstar Bank Limited 31-Dec-20 13 2 241 (226) 5 1 (232) (232) 2,880 557 5 1,578 1,203 66.3% 281.0% 35.0% 0.6% 13.3% 1,606.7% -10.5% -18%
2 Ant Bank (Hong Kong) Limited 31-Dec-20 5 (3) 172 (170) - (2) (172) (172) 1,392 - - 734 617 223.1% 133.5% 0.0% 0.5% -150.0% 8,600.0% -15.9% -25%
3 Fusion Bank Limited 31-Dec-20 2 1 285 (282) - (1) (283) (283) 1,070 - - 325 575 82.4% 780.6% 0.0% 0.3% 33.3% 9,500.0% -38.1% -61%
4 Livi VB Limited 31-Dec-20 13 1 452 (438) - - (438) (438) 2,342 - - 320 1,861 139.9% 464.3% 0.0% 0.5% 7.1% 3,228.6% -18.0% -21%
5 Mox Bank Limited 31-Dec-20 1 (3) 455 (456) - - (456) (456) 6,757 1 - 5,194 1,265 59.1% 81.6% 0.0% 0.0% 300.0% -45,500.0% -10.7% -36%
6 Ping An OneConnect Bank (Hong Kong) Limited 31-Dec-20 3 5 191 (183) 1 - (184) (184) 1,220 70 1 482 611 81.8% 148.4% 14.3% 0.3% 62.5% 2,387.5% -20.0% -33%
7 WeLab Bank Limited 31-Dec-20 (2) 3 285 (284) - (4) (288) (288) 1,721 - - 1,105 495 130.2% 853.9% 0.0% -0.2% -150.0% 28,500.0% -25.0% -57%
8 ZA Bank Limited 31-Dec-20 26 6 379 (347) 9 3 (352) (352) 7,861 683 9 6,037 1,561 30.6% 91.3% 11.2% 0.6% 18.8% 1,184.4% -7.6% -24%
Total 2020 61 12 2,460 (2,386) 15 (3) (2,405) (2,405) 25,243 1,311 15 15,775 8,188 - - 8.2% 0.2% 16.0% 3,280.0% -9.5% -29%
Source: Extracted from individual banks’ financial and public statements
Virtual banks – Financial highlights
© 2021 KPMG, a Hong Kong partnership and a member firm of the KPMG global organisation of independent member firms affiliated with KPMG International Limited, a private English company limited by guarantee. All rights reserved.© 2021 KPMG, a Hong Kong partnership and a member firm of the KPMG global organisation of independent member firms affiliated with KPMG International Limited, a private English company limited by guarantee. All rights reserved.
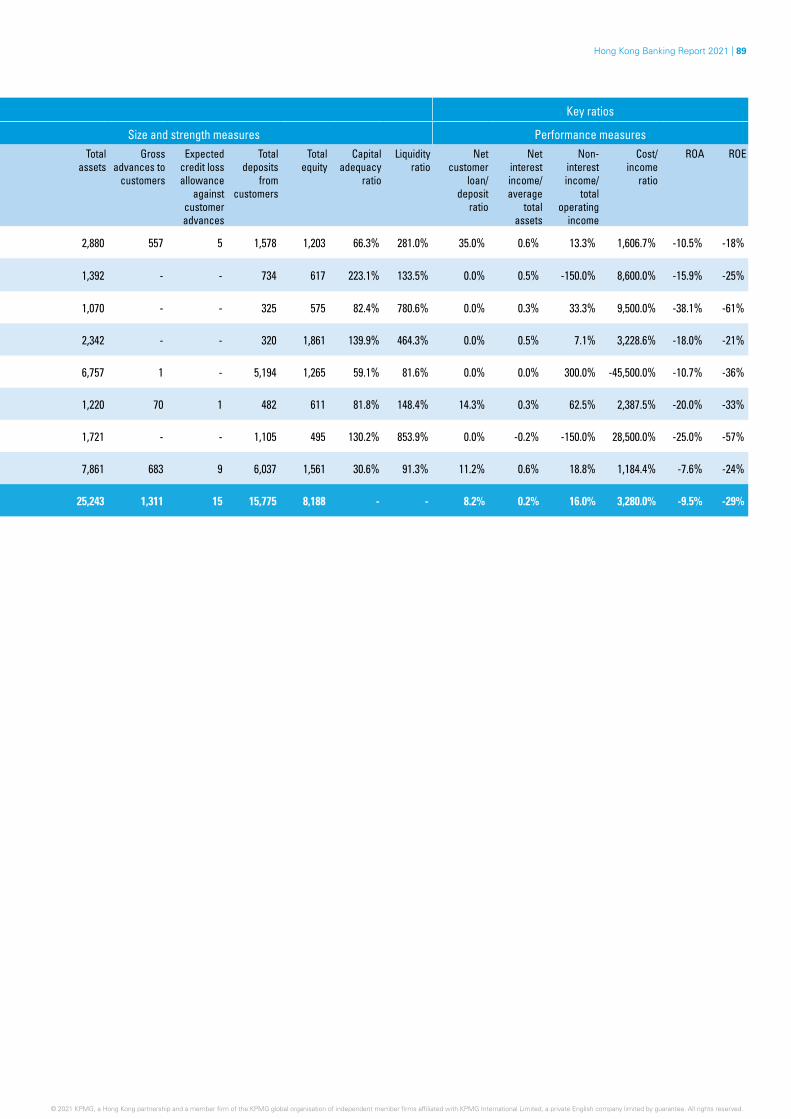
Hong Kong Banking Report 2021 | 89
Financial highlights Key ratios
Income statement Size and strength measures Performance measuresHK$ million Year ended Net
interest income
Non- interest income
Operating expenses
Operating profit before
impairment charges
Change in expected
credit loss against
customer advances
Other items
Profit before
tax
Net profit after
tax
Total assets
Gross advances to
customers
Expected credit loss allowance
against customer advances
Total deposits
from customers
Total equity
Capital adequacy
ratio
Liquidity ratio
Net customer
loan/ deposit
ratio
Net interest income/ average
total assets
Non- interest income/
total operating
income
Cost/ income
ratio
ROA ROE
1 Airstar Bank Limited 31-Dec-20 13 2 241 (226) 5 1 (232) (232) 2,880 557 5 1,578 1,203 66.3% 281.0% 35.0% 0.6% 13.3% 1,606.7% -10.5% -18%
2 Ant Bank (Hong Kong) Limited 31-Dec-20 5 (3) 172 (170) - (2) (172) (172) 1,392 - - 734 617 223.1% 133.5% 0.0% 0.5% -150.0% 8,600.0% -15.9% -25%
3 Fusion Bank Limited 31-Dec-20 2 1 285 (282) - (1) (283) (283) 1,070 - - 325 575 82.4% 780.6% 0.0% 0.3% 33.3% 9,500.0% -38.1% -61%
4 Livi VB Limited 31-Dec-20 13 1 452 (438) - - (438) (438) 2,342 - - 320 1,861 139.9% 464.3% 0.0% 0.5% 7.1% 3,228.6% -18.0% -21%
5 Mox Bank Limited 31-Dec-20 1 (3) 455 (456) - - (456) (456) 6,757 1 - 5,194 1,265 59.1% 81.6% 0.0% 0.0% 300.0% -45,500.0% -10.7% -36%
6 Ping An OneConnect Bank (Hong Kong) Limited 31-Dec-20 3 5 191 (183) 1 - (184) (184) 1,220 70 1 482 611 81.8% 148.4% 14.3% 0.3% 62.5% 2,387.5% -20.0% -33%
7 WeLab Bank Limited 31-Dec-20 (2) 3 285 (284) - (4) (288) (288) 1,721 - - 1,105 495 130.2% 853.9% 0.0% -0.2% -150.0% 28,500.0% -25.0% -57%
8 ZA Bank Limited 31-Dec-20 26 6 379 (347) 9 3 (352) (352) 7,861 683 9 6,037 1,561 30.6% 91.3% 11.2% 0.6% 18.8% 1,184.4% -7.6% -24%
Total 2020 61 12 2,460 (2,386) 15 (3) (2,405) (2,405) 25,243 1,311 15 15,775 8,188 - - 8.2% 0.2% 16.0% 3,280.0% -9.5% -29%
© 2021 KPMG, a Hong Kong partnership and a member firm of the KPMG global organisation of independent member firms affiliated with KPMG International Limited, a private English company limited by guarantee. All rights reserved. © 2021 KPMG, a Hong Kong partnership and a member firm of the KPMG global organisation of independent member firms affiliated with KPMG International Limited, a private English company limited by guarantee. All rights reserved.© 2021 KPMG, a Hong Kong partnership and a member firm of the KPMG global organisation of independent member firms affiliated with KPMG International Limited, a private English company limited by guarantee. All rights reserved.
90 | Hong Kong Banking Report 2021
About KPMGKPMG China is based in 28 offices across 25 cities with around 12,000 partners and staff in Beijing, Changsha, Chengdu, Chongqing, Foshan, Fuzhou, Guangzhou, Haikou, Hangzhou, Hefei, Jinan, Nanjing, Ningbo, Qingdao, Shanghai, Shenyang, Shenzhen, Suzhou, Tianjin, Wuhan, Xiamen, Xi’an, Zhengzhou, Hong Kong SAR and Macau SAR. Working collaboratively across all these offices, KPMG China can deploy experienced professionals efficiently, wherever our client is located.
KPMG is a global organisation of independent professional services firms providing Audit, Tax and Advisory services. We operate in 146 countries and territories and in FY20 had close to 227,000 people working in member firms around the world. Each KPMG firm is a legally distinct and separate entity and describes itself as such. KPMG International Limited is a private English company limited by guarantee. KPMG International Limited and its related entities do not provide services to clients.
In 1992, KPMG became the first international accounting network to be granted a joint venture licence in mainland China. KPMG was also the first among the Big Four in mainland China to convert from a joint venture to a special general partnership, as of 1 August 2012. Additionally, the Hong Kong firm can trace its origins to 1945. This early commitment to this market, together with an unwavering focus on quality, has been the foundation for accumulated industry experience, and is reflected in KPMG’s appointment for multi-disciplinary services (including audit, tax and advisory) by some of China’s most prestigious companies.
© 2021 KPMG, a Hong Kong partnership and a member firm of the KPMG global organisation of independent member firms affiliated with KPMG International Limited, a private English company limited by guarantee. All rights reserved.
Hong Kong Banking Report 2021 | 91
Contact usBonn LiuHead of Asset Management, ASPAC / Head of Financial Services, Banking and Capital Markets, Hong KongKPMG China+852 2826 [email protected]
Paul McSheaffreyPartner, Financial Services KPMG China+852 2978 [email protected]
Jianing SongPartner, Head of Banking Advisory Hong Kong KPMG China +852 2978 [email protected]
Terence FongPartner, Head of Chinese Banks, Hong KongKPMG China+852 2978 [email protected]
Ivan LiPartner, Head of Financial Services, Southern Region KPMG China+86 755 2547 [email protected]
John TimpanyPartner, Head of Tax, Hong KongKPMG China+852 2143 [email protected]
Tom JenkinsPartner, Head of Financial Risk ManagementKPMG China+852 2143 [email protected]
Pat WooPartner, Head of Sustainable Finance, Hong Kong, KPMG China, and Global Co-Chair, Sustainable Finance, KPMG IMPACT +852 3927 [email protected]
James O’Callaghan Partner, Head of Technology Consulting, Hong Kong KPMG China+852 2143 [email protected]
Isabel ZisselsbergerPartner, Strategy and Performance, Financial Services KPMG China+852 2826 [email protected]
Rani KamaruddinPartner, Head of Financial Crime, Hong KongKPMG China+852 2140 [email protected]
Matthew FenwickPartner, Corporate Tax AdvisoryKPMG China+852 2143 [email protected]
Larry CampbellPartner, Head of Financial Services StrategyKPMG Asia Pacific+852 2685 [email protected]
Dickson LeePartnerKPMG China+852 2143 [email protected]
Edmond TanPartnerKPMG China+86 21 2212 [email protected]
Jeffrey HauPartner, Risk ConsultingKPMG China+852 2685 [email protected]
Michael MontefortePartner, Financial Risk ManagementKPMG China+852 2847 [email protected]
Edna Wong Partner, Financial Services KPMG China+852 2143 [email protected]
Steve CheungPartner, Financial ServicesKPMG China+852 2143 [email protected]
Gemini YangPartner, Financial Risk ManagementKPMG China+852 3927 [email protected]
Connie KangDirector, Financial Risk ManagementKPMG China+852 3927 [email protected]
Sean RenAssociate Director, Strategy and Performance, Hong KongKPMG China+852 3927 [email protected]
© 2021 KPMG, a Hong Kong partnership and a member firm of the KPMG global organisation of independent member firms affiliated with KPMG International Limited, a private English company limited by guarantee. All rights reserved. © 2021 KPMG, a Hong Kong partnership and a member firm of the KPMG global organisation of independent member firms affiliated with KPMG International Limited, a private English company limited by guarantee. All rights reserved.

home.kpmg.com/cn/socialmedia
The information contained herein is of a general nature and is not intended to address the circumstances of any particular individual or entity. Although we endeavour to provide accurate and timely information, there can be no guarantee that such information is accurate as of the date it is received or that it will continue to be accurate in the future. No one should act upon such information without appropriate professional advice after a thorough examination of the particular situation.
© 2021 KPMG, a Hong Kong partnership and a member firm of the KPMG global organisation of independent member firms affiliated with KPMG International Limited, a private English company limited by guarantee. All rights reserved. Printed in Hong Kong, China.
The KPMG name and logo are trademarks used under license by the independent member firms of the KPMG global organisation.
Publication number: HK-FS21-0006
Publication date: June 2021
For a list of KPMG China offices, please scan the QR code or visit our website: https://home.kpmg.com/cn/en/home/about/offices.html
home.kpmg/cn/banking
This publication is printed on Novatech paper which is FSCTM Certified. Acid-free. Elemental Chlorine Free (ECF). EU Flower Environmental Certificate. EMAS Environmental Certificate. ISO 14001 Environmental Certificate. Certificated for packaging in direct contact with dry and non-greasy foodstuffs.
Cover – 250 gsm Novatech matt white paper. Text pages – 135 gsm Novatech matt white paper.
Printed using environmentally friendly soy ink.