DRIVING EXCELLENCE LABOUR MARKET REPORTS 2021
29
Labour Market Forecast Employment & Development Compensation & Benefits Business & Financial Workforce Trends DRIVING EXCELLENCE | LABOUR MARKET REPORTS 2021
Transcript of DRIVING EXCELLENCE LABOUR MARKET REPORTS 2021
Labour Market Forecast
Employment & Development
Compensation & Benefits
Business & Financial
Workforce Trends
DRIVING EXCELLENCE | LABOUR MARKET REPORTS 2021
CONTENTS
INTRODUCTION - MOTOR CARRIER PASSENGER COUNCIL OF CANADA (MCPCC) . . . . . . . . . . . . . . . . . . . . . . . . . . . . . . . . . . . . . . . . . . . . . . . . . . . . . . . . 3
PART ONE OVERVIEW 4PART TWO KEY SKILLS AND COMPENSATION 6
A CAUTIOUS RECOVERY ..................................................................................................... 6
WHAT’S IN DEMAND . . . . . . . . . . . . . . . . . . . . . . . . . . . . . . . . . . . . . . . . . . . . . . . . . . . . . . . . . . 6FINANCIAL AND SUPPORT STAFF .................................................................................... 6TECHNOLOGY ........................................................................................................................ 6ADMINISTRATIVE SUPPORT TEAMS ..................................................................................7TECHNICAL TEAMS ................................................................................................................7TOP 3 HIRING CHANGES ....................................................................................................7RETENTION ............................................................................................................................. 8TRANSPARENT PAY PHILOSOPHY AND PRACTICES .................................................... 8
PART THREE 9COMPENSATION REVIEW 2020-2021 9
MORNEAU SHEPELL SURVEY RESULTS . . . . . . . . . . . . . . . . . . . . . . . . . . . . . . . . . . . . . . . . 112021 SALARY PROJECTION SURVEY | SEPTEMBER 2020..........................................12SALARY STRUCTURE ............................................................................................................15IMPACT OF COVID-19 ........................................................................................................ 16A MORE DIFFICULT CONTEXT FOR SMALLER ORGANIZATIONS ........................... 16
PART FOUR BUS INDUSTRY COMPENSATION 17
A LOOK AHEAD ....................................................................................................................20
RIDERSHIP DECLINES AND IMPACT ON COMPENSATION . . . . . . . . . . . . . . . . . . . . . . 21RIDERSHIP REMAINS LOW .................................................................................................21
FINANCIAL SITUATION . . . . . . . . . . . . . . . . . . . . . . . . . . . . . . . . . . . . . . . . . . . . . . . . . . . . . . .22MCPCC INDUSTRY COMPENSATION OUTLOOK . . . . . . . . . . . . . . . . . . . . . . . . . . . . . . .23COMPENSATION 2021 – INDUSTRY SURVEY RESPONSES FOR KEY POSITIONS . . . . . . . . . . . . . . . . . . . . . . . . . . . . . . . . . . . . . . . . . . . . . . . . . . . . . . . . .24
TRADES AND MANAGEMENT ........................................................................................... 24URBAN BUS OPERATORS .................................................................................................. 24SCHOOL BUS OPERATORS ............................................................................................... 24MOTOR COACH OPERATORS .......................................................................................... 25
AVERAGE SALARIES IN CANADA 2019 . . . . . . . . . . . . . . . . . . . . . . . . . . . . . . . . . . . . . . . . 25THE AVERAGE SALARY FOR CANADIAN EMPLOYEES ................................................ 25
PART FIVE BENEFITS AND PERKS 26
BENEFIT TRENDS . . . . . . . . . . . . . . . . . . . . . . . . . . . . . . . . . . . . . . . . . . . . . . . . . . . . . . . . . . .26RESET ON HEALTH PLANS AND BENEFIT PROGRAMS ............................................. 27MENTAL HEALTH SUPPORT .............................................................................................. 27CAREGIVING SUPPORT ......................................................................................................28NEW, TAILORED BENEFITS ...............................................................................................28
INDUSTRY BENEFITS . . . . . . . . . . . . . . . . . . . . . . . . . . . . . . . . . . . . . . . . . . . . . . . . . . . . . . . . .29
2
MCPCC | LABOUR MARKET REPORTS 2021 COMPENSATION AND BENEFITS
www.buscouncil.ca
INTRODUCTION - MOTOR CARRIER PASSENGER COUNCIL OF CANADA (MCPCC)
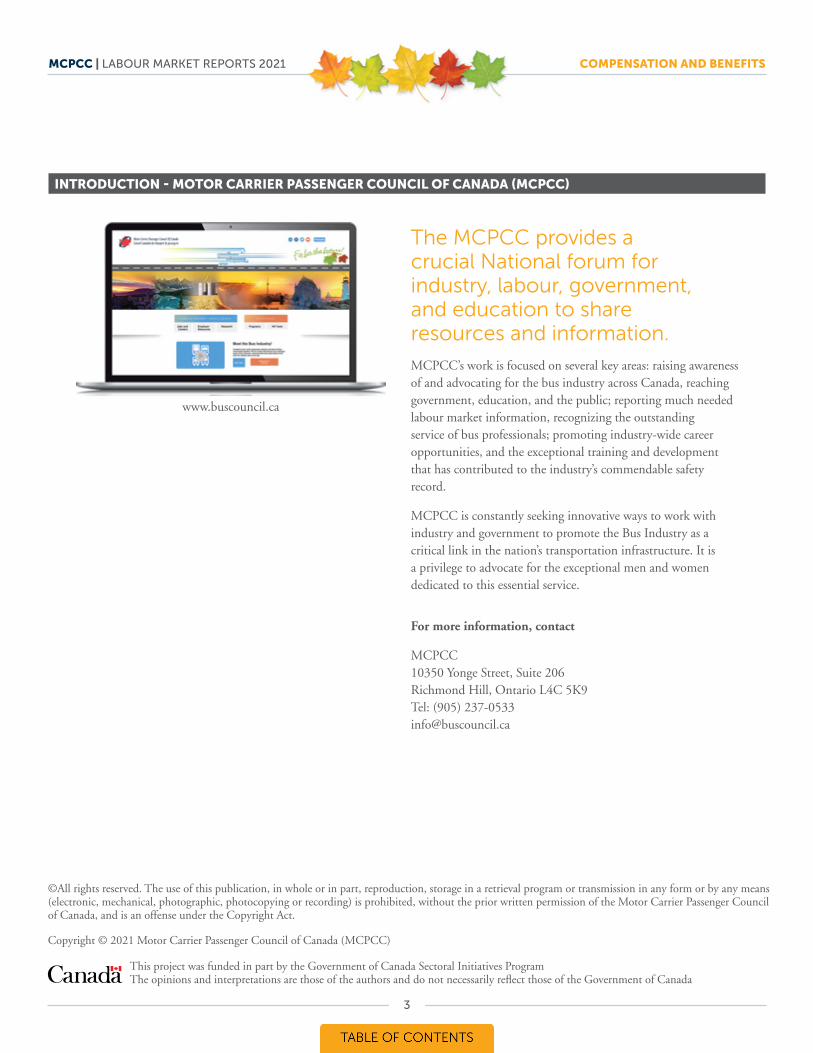
The MCPCC provides a crucial National forum for industry, labour, government, and education to share resources and information.
MCPCC’s work is focused on several key areas: raising awareness of and advocating for the bus industry across Canada, reaching government, education, and the public; reporting much needed labour market information, recognizing the outstanding service of bus professionals; promoting industry-wide career opportunities, and the exceptional training and development that has contributed to the industry’s commendable safety record.
MCPCC is constantly seeking innovative ways to work with industry and government to promote the Bus Industry as a critical link in the nation’s transportation infrastructure. It is a privilege to advocate for the exceptional men and women dedicated to this essential service.
For more information, contact
MCPCC 10350 Yonge Street, Suite 206 Richmond Hill, Ontario L4C 5K9 Tel: (905) 237-0533 [email protected]
©All rights reserved. The use of this publication, in whole or in part, reproduction, storage in a retrieval program or transmission in any form or by any means (electronic, mechanical, photographic, photocopying or recording) is prohibited, without the prior written permission of the Motor Carrier Passenger Council of Canada, and is an offense under the Copyright Act.
Copyright © 2021 Motor Carrier Passenger Council of Canada (MCPCC)
This project was funded in part by the Government of Canada Sectoral Initiatives Program The opinions and interpretations are those of the authors and do not necessarily reflect those of the Government of Canada
3
44
Throughout 2020, the COVID-19 pandemic challenged every aspect of life and society as we knew it. Experts are urging the public to think long-term and accept that the effects of the COVID-19 pandemic may not end soon. Some economists expect continued disruption, while others see a relatively stable new normal. In this environment, managers need guideposts. The economic effects of COVID-19 have forced companies to re-evaluate and be cautious of the compensation structure, and salary increment budget for 2021.
A strategy for recovery in 2021 is paramount to strengthen resiliency against similar disruptions in the future. The early days of the pandemic found companies struggling to determine a measured response for managing costs and protecting employees at the same time. This circumstance highlighted the need for organizations to increase their agility and transparency.
PART ONE
OVERVIEW
The Coronavirus pandemic has changed traditional
HR structures: hiring, recruiting, onboarding and compensation. The latter is one area that has become increasingly
more complex, as employers must consider the full context of the pandemic—
both now and what may come in the near future—while they redesign
approaches to compensation.
MCPCC | LABOUR MARKET REPORTS 2021 COMPENSATION AND BENEFITS
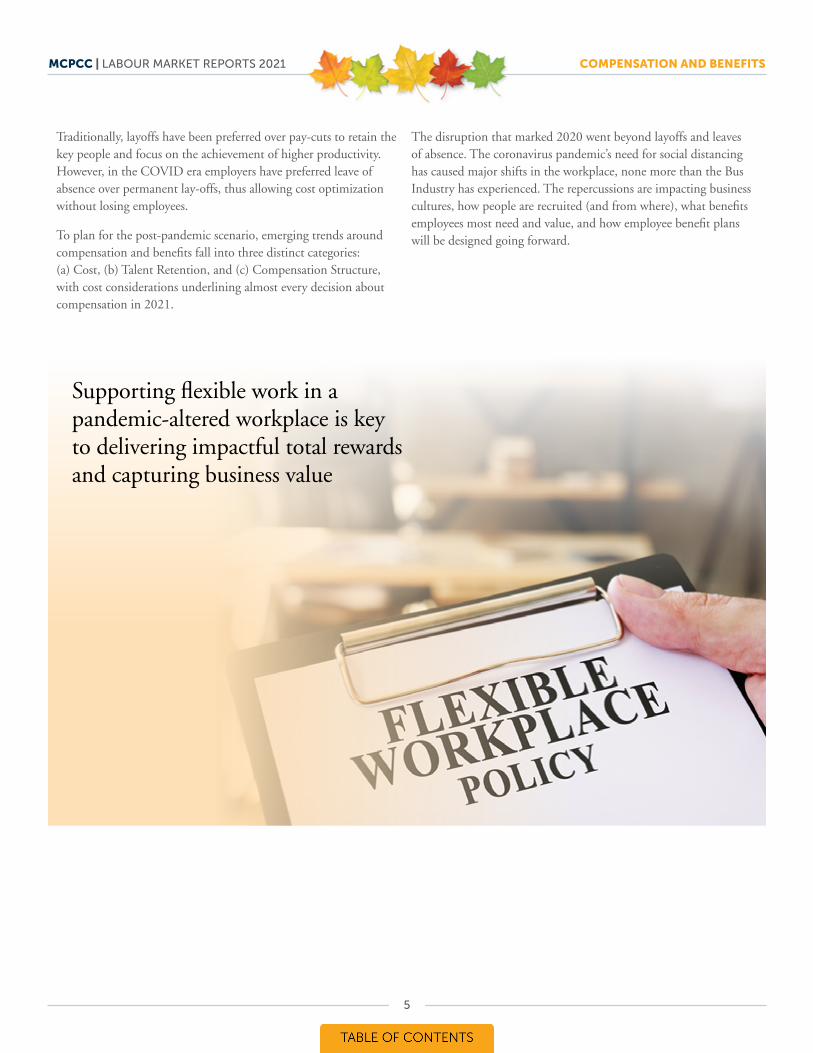
Supporting flexible work in a pandemic-altered workplace is key to delivering impactful total rewards and capturing business value
PART ONE
OVERVIEW
Traditionally, layoffs have been preferred over pay-cuts to retain the key people and focus on the achievement of higher productivity. However, in the COVID era employers have preferred leave of absence over permanent lay-offs, thus allowing cost optimization without losing employees.
To plan for the post-pandemic scenario, emerging trends around compensation and benefits fall into three distinct categories: (a) Cost, (b) Talent Retention, and (c) Compensation Structure, with cost considerations underlining almost every decision about compensation in 2021.
The disruption that marked 2020 went beyond layoffs and leaves of absence. The coronavirus pandemic’s need for social distancing has caused major shifts in the workplace, none more than the Bus Industry has experienced. The repercussions are impacting business cultures, how people are recruited (and from where), what benefits employees most need and value, and how employee benefit plans will be designed going forward.
5
66
When it comes to determining compensation, key skills may be an even more reliable metric to compare against than job title. Different companies may have very different definitions of the same job title with many skill sets
applying to a wide variety of roles – all of which are effectively competing for the same talent. That’s why it’s important for employers to consider the value of key skills when determining compensation.
Competitive intelligence is key to determining compensation.
A CAUTIOUS RECOVERY
Wary of over-hiring before revenues sufficiently rebound, some businesses are supplementing their full-time staff with temporary workers. Salaries are likely to remain relatively flat into 2021, although compensation for administrative professionals with in-demand technical skills and industry-specific experience, as well as financial and technology expertise is increasing. As the use of telehealth for physical and mental wellness increases, medical providers are seeking tech-savvy support professionals, including remote customer service representatives. HR specialists are also needed to help hire, onboard and train incoming staff.
WHAT’S IN DEMAND
FINANCIAL AND SUPPORT STAFF
Hiring for financial staff in all industries especially in the areas of billing, accounts receivable and collections remains strong. Having to work remotely has further highlighted the need for financial professionals with strong business acumen who collaborate effectively, especially on tasks like financial reporting. Completing filings of reports may take longer because staff must evaluate the current and expected impact of COVID-19 on the business, as well as update disclosures when circumstances change.
Internal controls and compliance are also more complicated with teams working remotely. Finance departments need more time to conduct proper reviews and gather appropriate evidence, requiring an earlier start to control reviews. As companies adapt to a changed business environment, some employers are bringing back workers who were temporarily laid off and hiring additional administrative professionals for key support roles.
TECHNOLOGY
Technology is helping keep firms running smoothly. Communication apps, in particular, are allowing employees and customers to connect remotely. As companies continue to build out their digital infrastructure, administrative professionals are playing important support roles. While IT and business transformation teams are leading the process by identifying needs and devising strategies around new artificial intelligence (AI) or cloud-based tools, it is often support staff who first use them and help colleagues learn and increase their efficiency with them.
Employers are seeing competition for developers as well, including versatile full-stack developers and DevOps engineers.
PART TWO
KEY SKILLS AND COMPENSATION

MCPCC | LABOUR MARKET REPORTS 2021 COMPENSATION AND BENEFITS
The rapid expansion of remote work is making it easier for companies to access skilled talent in markets across Canada and beyond. That’s positive news for businesses that have struggled to hire senior-level IT professionals in recent years. Employers are fielding far more applications today and hiring many candidates remotely, and there is still competition for top performers even with deeper talent pools.
TECHNICAL TEAMS
• Security
• Cloud architect
• Data base admin
• Programmer analyst
• Mobile app developer
• Network admin
• DevOps engineer
• Software developer
• Help desk
• Systems analyst
OF WORKERS WANT TO WORK REMOTELY MORE OFTEN AFTER THE PANDEMIC
74%
ADMINISTRATIVE SUPPORT TEAMS
• Administrative Assistant
• Call center/Customer Service Representative
• Data Entry Specialist
• Executive Assistant
• HR Benefits
TOP 3 HIRING CHANGES
50%Conducting remote
interviews and onboarding
33%Shortening the hiring process
32%Advertising fully
remote jobs
7
MCPCC | LABOUR MARKET REPORTS 2021 COMPENSATION AND BENEFITS
RETENTION
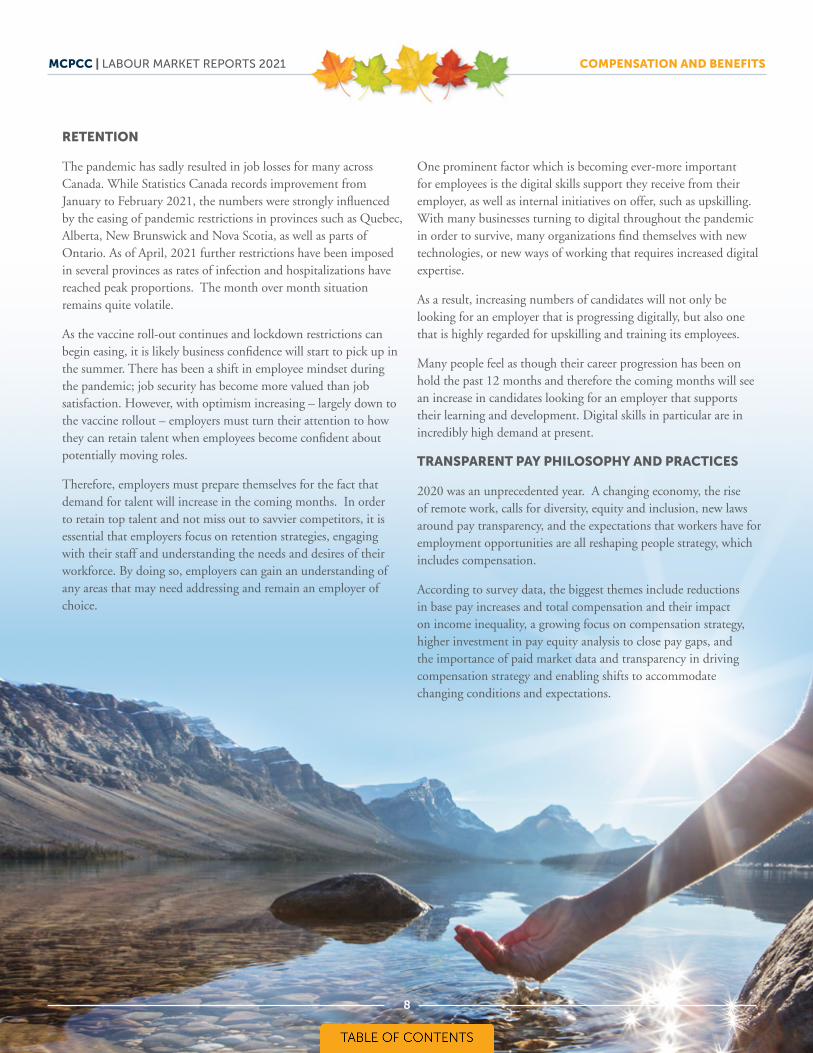
The pandemic has sadly resulted in job losses for many across Canada. While Statistics Canada records improvement from January to February 2021, the numbers were strongly influenced by the easing of pandemic restrictions in provinces such as Quebec, Alberta, New Brunswick and Nova Scotia, as well as parts of Ontario. As of April, 2021 further restrictions have been imposed in several provinces as rates of infection and hospitalizations have reached peak proportions. The month over month situation remains quite volatile.
As the vaccine roll-out continues and lockdown restrictions can begin easing, it is likely business confidence will start to pick up in the summer. There has been a shift in employee mindset during the pandemic; job security has become more valued than job satisfaction. However, with optimism increasing – largely down to the vaccine rollout – employers must turn their attention to how they can retain talent when employees become confident about potentially moving roles.
Therefore, employers must prepare themselves for the fact that demand for talent will increase in the coming months. In order to retain top talent and not miss out to savvier competitors, it is essential that employers focus on retention strategies, engaging with their staff and understanding the needs and desires of their workforce. By doing so, employers can gain an understanding of any areas that may need addressing and remain an employer of choice.
One prominent factor which is becoming ever-more important for employees is the digital skills support they receive from their employer, as well as internal initiatives on offer, such as upskilling. With many businesses turning to digital throughout the pandemic in order to survive, many organizations find themselves with new technologies, or new ways of working that requires increased digital expertise.
As a result, increasing numbers of candidates will not only be looking for an employer that is progressing digitally, but also one that is highly regarded for upskilling and training its employees.
Many people feel as though their career progression has been on hold the past 12 months and therefore the coming months will see an increase in candidates looking for an employer that supports their learning and development. Digital skills in particular are in incredibly high demand at present.
TRANSPARENT PAY PHILOSOPHY AND PRACTICES
2020 was an unprecedented year. A changing economy, the rise of remote work, calls for diversity, equity and inclusion, new laws around pay transparency, and the expectations that workers have for employment opportunities are all reshaping people strategy, which includes compensation.
According to survey data, the biggest themes include reductions in base pay increases and total compensation and their impact on income inequality, a growing focus on compensation strategy, higher investment in pay equity analysis to close pay gaps, and the importance of paid market data and transparency in driving compensation strategy and enabling shifts to accommodate changing conditions and expectations.
8
99
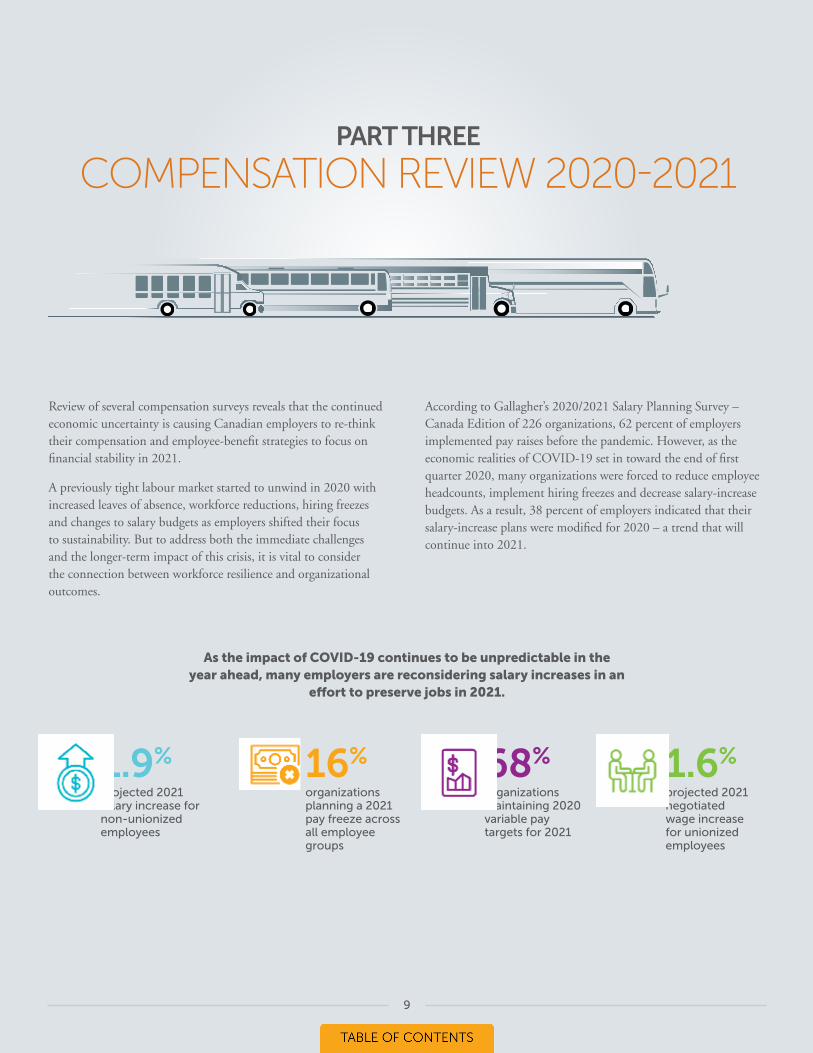
1 .9%
projected 2021 salary increase for non-unionized employees
16%
organizations planning a 2021 pay freeze across all employee groups
68%
organizations maintaining 2020 variable pay targets for 2021
1 .6%
projected 2021 negotiated wage increase for unionized employees
Review of several compensation surveys reveals that the continued economic uncertainty is causing Canadian employers to re-think their compensation and employee-benefit strategies to focus on financial stability in 2021.
A previously tight labour market started to unwind in 2020 with increased leaves of absence, workforce reductions, hiring freezes and changes to salary budgets as employers shifted their focus to sustainability. But to address both the immediate challenges and the longer-term impact of this crisis, it is vital to consider the connection between workforce resilience and organizational outcomes.
According to Gallagher’s 2020/2021 Salary Planning Survey – Canada Edition of 226 organizations, 62 percent of employers implemented pay raises before the pandemic. However, as the economic realities of COVID-19 set in toward the end of first quarter 2020, many organizations were forced to reduce employee headcounts, implement hiring freezes and decrease salary-increase budgets. As a result, 38 percent of employers indicated that their salary-increase plans were modified for 2020 – a trend that will continue into 2021.
As the impact of COVID-19 continues to be unpredictable in the year ahead, many employers are reconsidering salary increases in an
effort to preserve jobs in 2021.
PART THREE
COMPENSATION REVIEW 2020-2021

MCPCC | LABOUR MARKET REPORTS 2021 COMPENSATION AND BENEFITS
10
Surveys indicate that employers’ priorities have changed as a result of the pandemic, and leaders have shifted their focus from talent acquisition and retention to financial stability and business continuity. Having said that, employers are also focused on employee wellbeing and engagement for positive business performance.
Co-existing with COVID-19 has required an unprecedented level of adaptability, however employees are looking for stability and personal wellness more than anything, according to surveys. Employers need to strike the right balance between cutting costs and investing in their employees’ financial, physical and mental health, and opportunity to access and pursue physical fitness classes, to better position themselves to retain staff and compete for new talent when the labour market picks up.
MCPCC | LABOUR MARKET REPORTS 2021 COMPENSATION AND BENEFITS
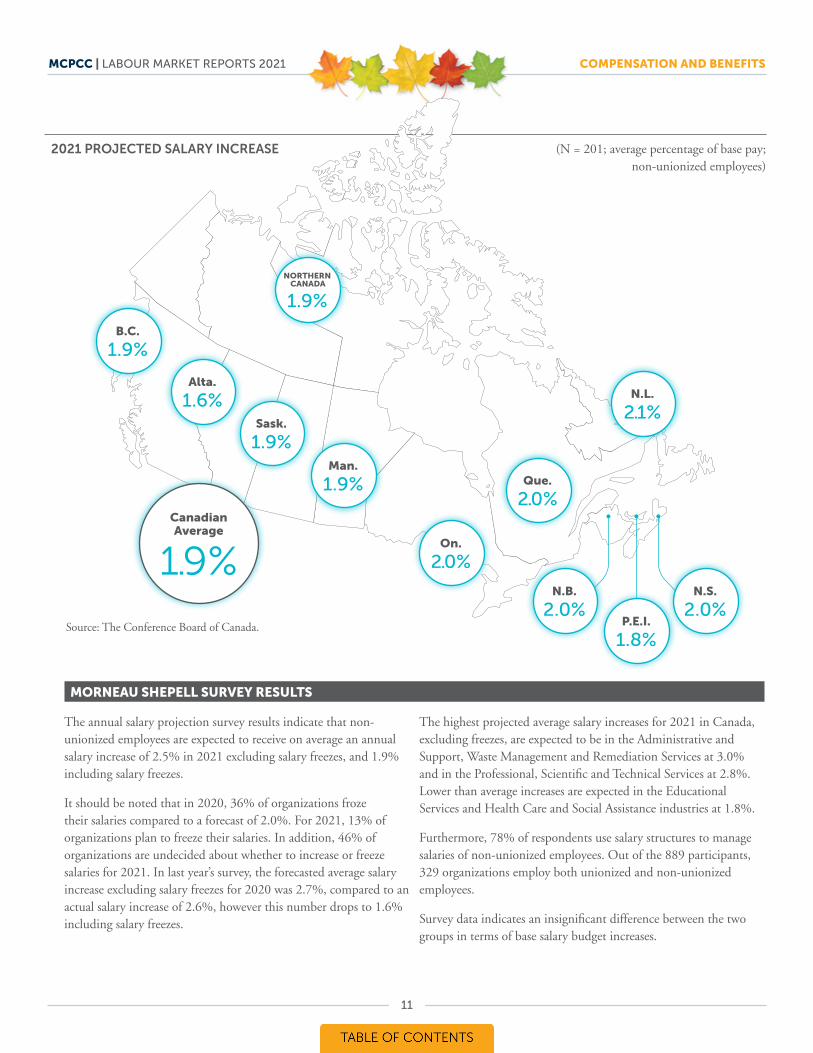
2021 PROJECTED SALARY INCREASE (N = 201; average percentage of base pay; non-unionized employees)
Source: The Conference Board of Canada.
MORNEAU SHEPELL SURVEY RESULTS
The annual salary projection survey results indicate that non-unionized employees are expected to receive on average an annual salary increase of 2.5% in 2021 excluding salary freezes, and 1.9% including salary freezes.
It should be noted that in 2020, 36% of organizations froze their salaries compared to a forecast of 2.0%. For 2021, 13% of organizations plan to freeze their salaries. In addition, 46% of organizations are undecided about whether to increase or freeze salaries for 2021. In last year’s survey, the forecasted average salary increase excluding salary freezes for 2020 was 2.7%, compared to an actual salary increase of 2.6%, however this number drops to 1.6% including salary freezes.
The highest projected average salary increases for 2021 in Canada, excluding freezes, are expected to be in the Administrative and Support, Waste Management and Remediation Services at 3.0% and in the Professional, Scientific and Technical Services at 2.8%. Lower than average increases are expected in the Educational Services and Health Care and Social Assistance industries at 1.8%.
Furthermore, 78% of respondents use salary structures to manage salaries of non-unionized employees. Out of the 889 participants, 329 organizations employ both unionized and non-unionized employees.
Survey data indicates an insignificant difference between the two groups in terms of base salary budget increases.
11
B.C.
1.9%
Alta.
1.6%Sask.
1.9%Man.
1.9%
On.
2.0%
Canadian Average
1.9%
Que.
2.0%
N.L.
2.1%
P.E.I.
1.8%
N.B.
2.0%N.S.
2.0%
NORTHERN CANADA
1.9%
MCPCC | LABOUR MARKET REPORTS 2021 COMPENSATION AND BENEFITS
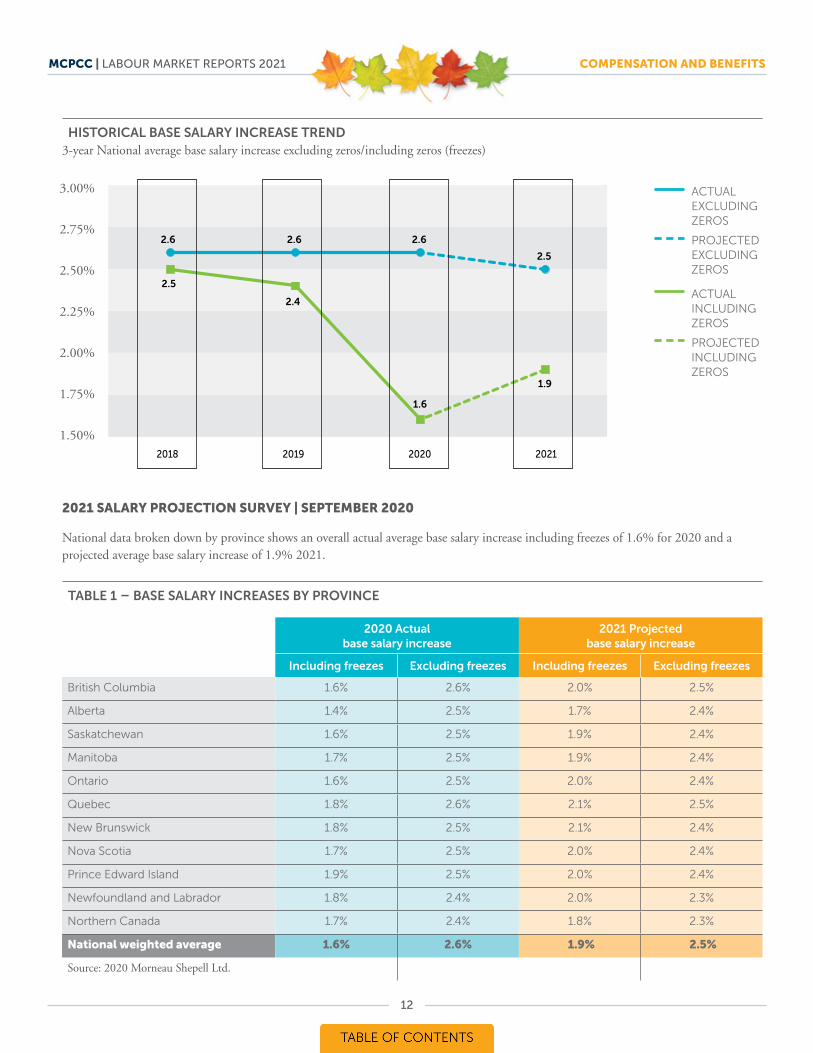
2021 SALARY PROJECTION SURVEY | SEPTEMBER 2020
National data broken down by province shows an overall actual average base salary increase including freezes of 1.6% for 2020 and a projected average base salary increase of 1.9% 2021.
TABLE 1 – BASE SALARY INCREASES BY PROVINCE
2020 Actual base salary increase
2021 Projected base salary increase
Including freezes Excluding freezes Including freezes Excluding freezes
British Columbia 1.6% 2.6% 2.0% 2.5%
Alberta 1.4% 2.5% 1.7% 2.4%
Saskatchewan 1.6% 2.5% 1.9% 2.4%
Manitoba 1.7% 2.5% 1.9% 2.4%
Ontario 1.6% 2.5% 2.0% 2.4%
Quebec 1.8% 2.6% 2.1% 2.5%
New Brunswick 1.8% 2.5% 2.1% 2.4%
Nova Scotia 1.7% 2.5% 2.0% 2.4%
Prince Edward Island 1.9% 2.5% 2.0% 2.4%
Newfoundland and Labrador 1.8% 2.4% 2.0% 2.3%
Northern Canada 1.7% 2.4% 1.8% 2.3%
National weighted average 1.6% 2.6% 1.9% 2.5%
Source: 2020 Morneau Shepell Ltd.
HISTORICAL BASE SALARY INCREASE TREND3-year National average base salary increase excluding zeros/including zeros (freezes)
3.00%
2.75%
2.50%
2.25%
2.00%
1.75%
1.50%
2.6 2.6 2.6
2.5
2.5
2.4
1.6
1.9
2018 2019 2020 2021
ACTUAL EXCLUDING ZEROS
ACTUAL INCLUDING ZEROS
PROJECTED EXCLUDING ZEROS
PROJECTED INCLUDING ZEROS
12
MCPCC | LABOUR MARKET REPORTS 2021 COMPENSATION AND BENEFITS
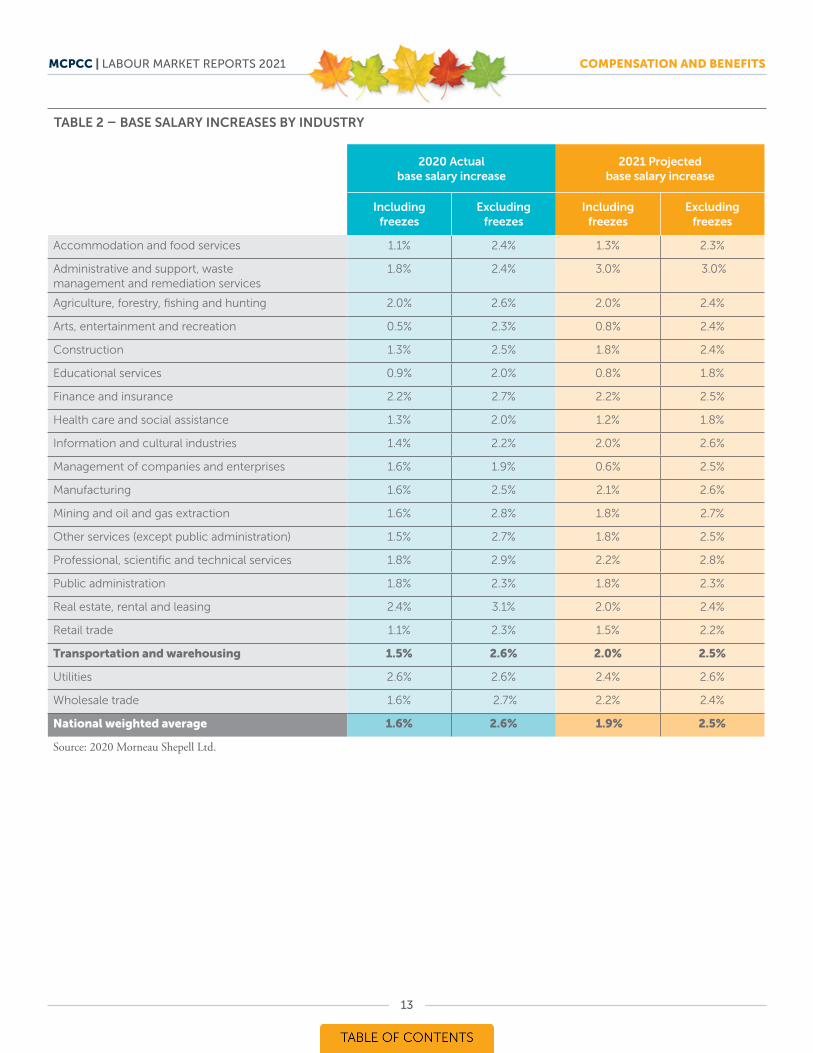
TABLE 2 – BASE SALARY INCREASES BY INDUSTRY
2020 Actual base salary increase
2021 Projected base salary increase
Including freezes
Excluding freezes
Including freezes
Excluding freezes
Accommodation and food services 1.1% 2.4% 1.3% 2.3%
Administrative and support, wastemanagement and remediation services
1.8% 2.4% 3.0% 3.0%
Agriculture, forestry, fishing and hunting 2.0% 2.6% 2.0% 2.4%
Arts, entertainment and recreation 0.5% 2.3% 0.8% 2.4%
Construction 1.3% 2.5% 1.8% 2.4%
Educational services 0.9% 2.0% 0.8% 1.8%
Finance and insurance 2.2% 2.7% 2.2% 2.5%
Health care and social assistance 1.3% 2.0% 1.2% 1.8%
Information and cultural industries 1.4% 2.2% 2.0% 2.6%
Management of companies and enterprises 1.6% 1.9% 0.6% 2.5%
Manufacturing 1.6% 2.5% 2.1% 2.6%
Mining and oil and gas extraction 1.6% 2.8% 1.8% 2.7%
Other services (except public administration) 1.5% 2.7% 1.8% 2.5%
Professional, scientific and technical services 1.8% 2.9% 2.2% 2.8%
Public administration 1.8% 2.3% 1.8% 2.3%
Real estate, rental and leasing 2.4% 3.1% 2.0% 2.4%
Retail trade 1.1% 2.3% 1.5% 2.2%
Transportation and warehousing 1.5% 2.6% 2.0% 2.5%
Utilities 2.6% 2.6% 2.4% 2.6%
Wholesale trade 1.6% 2.7% 2.2% 2.4%
National weighted average 1.6% 2.6% 1.9% 2.5%
Source: 2020 Morneau Shepell Ltd.
13
MCPCC | LABOUR MARKET REPORTS 2021 COMPENSATION AND BENEFITS
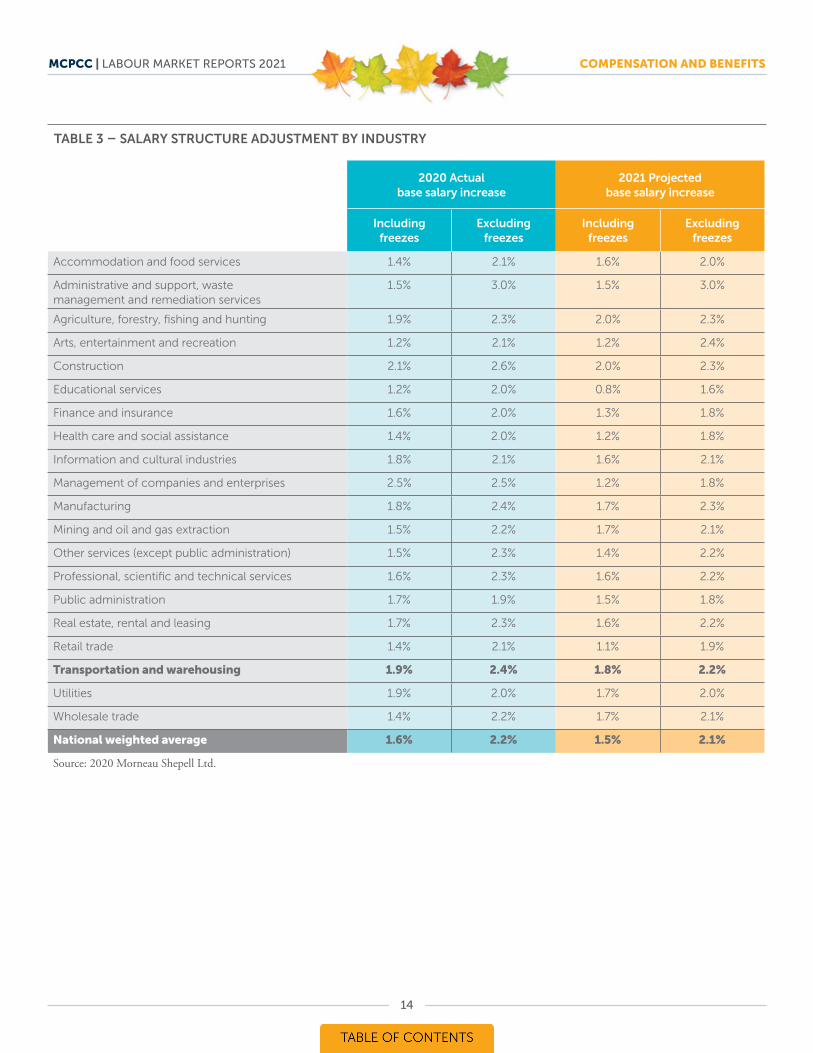
TABLE 3 – SALARY STRUCTURE ADJUSTMENT BY INDUSTRY
2020 Actual base salary increase
2021 Projected base salary increase
Including freezes
Excluding freezes
Including freezes
Excluding freezes
Accommodation and food services 1.4% 2.1% 1.6% 2.0%
Administrative and support, wastemanagement and remediation services
1.5% 3.0% 1.5% 3.0%
Agriculture, forestry, fishing and hunting 1.9% 2.3% 2.0% 2.3%
Arts, entertainment and recreation 1.2% 2.1% 1.2% 2.4%
Construction 2.1% 2.6% 2.0% 2.3%
Educational services 1.2% 2.0% 0.8% 1.6%
Finance and insurance 1.6% 2.0% 1.3% 1.8%
Health care and social assistance 1.4% 2.0% 1.2% 1.8%
Information and cultural industries 1.8% 2.1% 1.6% 2.1%
Management of companies and enterprises 2.5% 2.5% 1.2% 1.8%
Manufacturing 1.8% 2.4% 1.7% 2.3%
Mining and oil and gas extraction 1.5% 2.2% 1.7% 2.1%
Other services (except public administration) 1.5% 2.3% 1.4% 2.2%
Professional, scientific and technical services 1.6% 2.3% 1.6% 2.2%
Public administration 1.7% 1.9% 1.5% 1.8%
Real estate, rental and leasing 1.7% 2.3% 1.6% 2.2%
Retail trade 1.4% 2.1% 1.1% 1.9%
Transportation and warehousing 1.9% 2.4% 1.8% 2.2%
Utilities 1.9% 2.0% 1.7% 2.0%
Wholesale trade 1.4% 2.2% 1.7% 2.1%
National weighted average 1.6% 2.2% 1.5% 2.1%
Source: 2020 Morneau Shepell Ltd.
14
MCPCC | LABOUR MARKET REPORTS 2021 COMPENSATION AND BENEFITS
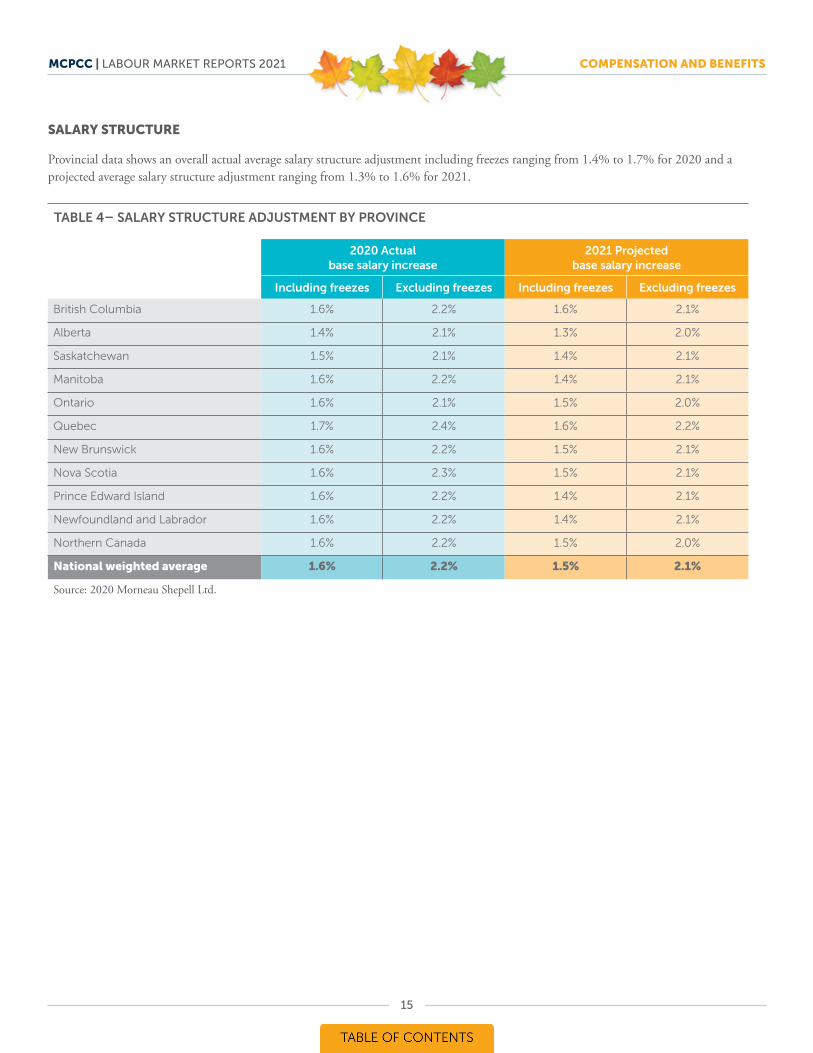
SALARY STRUCTURE
Provincial data shows an overall actual average salary structure adjustment including freezes ranging from 1.4% to 1.7% for 2020 and a projected average salary structure adjustment ranging from 1.3% to 1.6% for 2021.
TABLE 4– SALARY STRUCTURE ADJUSTMENT BY PROVINCE
2020 Actual base salary increase
2021 Projected base salary increase
Including freezes Excluding freezes Including freezes Excluding freezes
British Columbia 1.6% 2.2% 1.6% 2.1%
Alberta 1.4% 2.1% 1.3% 2.0%
Saskatchewan 1.5% 2.1% 1.4% 2.1%
Manitoba 1.6% 2.2% 1.4% 2.1%
Ontario 1.6% 2.1% 1.5% 2.0%
Quebec 1.7% 2.4% 1.6% 2.2%
New Brunswick 1.6% 2.2% 1.5% 2.1%
Nova Scotia 1.6% 2.3% 1.5% 2.1%
Prince Edward Island 1.6% 2.2% 1.4% 2.1%
Newfoundland and Labrador 1.6% 2.2% 1.4% 2.1%
Northern Canada 1.6% 2.2% 1.5% 2.0%
National weighted average 1.6% 2.2% 1.5% 2.1%
Source: 2020 Morneau Shepell Ltd.
15
MCPCC | LABOUR MARKET REPORTS 2021 COMPENSATION AND BENEFITS
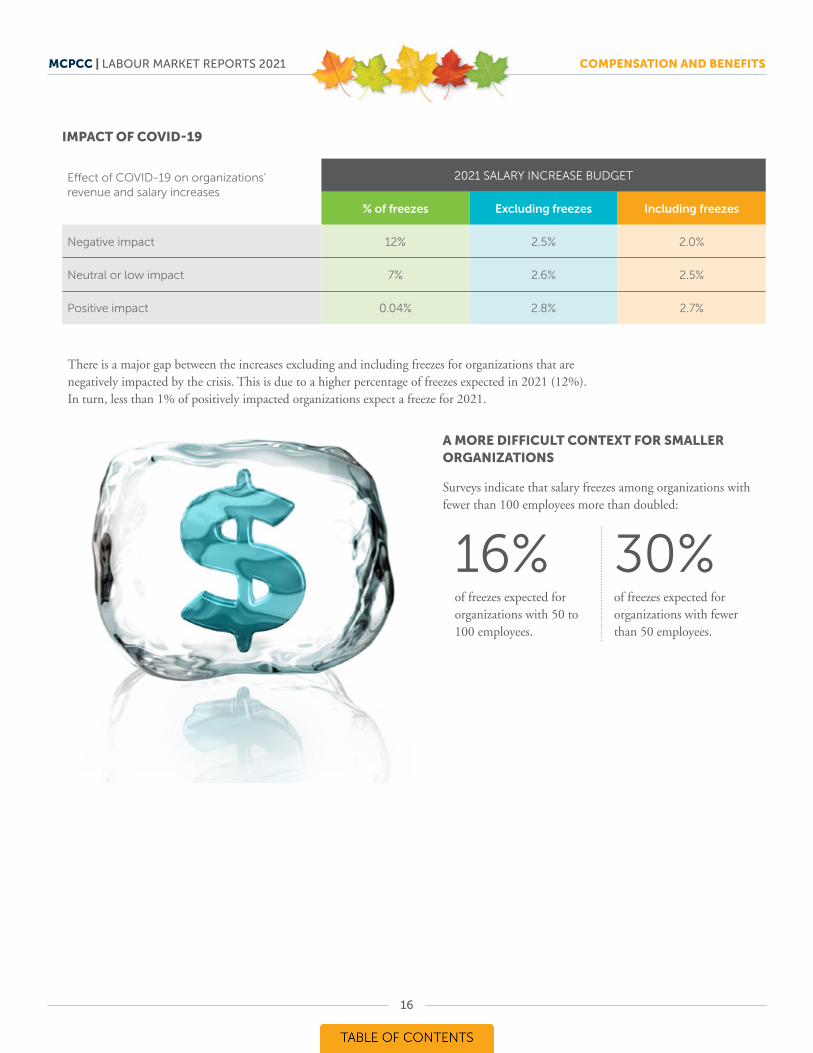
IMPACT OF COVID-19
Effect of COVID-19 on organizations’revenue and salary increases
2021 SALARY INCREASE BUDGET
% of freezes Excluding freezes Including freezes
Negative impact 12% 2.5% 2.0%
Neutral or low impact 7% 2.6% 2.5%
Positive impact 0.04% 2.8% 2.7%
There is a major gap between the increases excluding and including freezes for organizations that are negatively impacted by the crisis. This is due to a higher percentage of freezes expected in 2021 (12%). In turn, less than 1% of positively impacted organizations expect a freeze for 2021.
A MORE DIFFICULT CONTEXT FOR SMALLER ORGANIZATIONS
Surveys indicate that salary freezes among organizations with fewer than 100 employees more than doubled:
16%
of freezes expected for organizations with 50 to 100 employees.
30%of freezes expected for organizations with fewer than 50 employees.
16
PART FOUR
BUS INDUSTRY COMPENSATION

1717
MCPCC | LABOUR MARKET REPORTS 2021 COMPENSATION AND BENEFITS
PART FOUR
BUS INDUSTRY COMPENSATION
YEAR OVER YEAR STATISTICS CANADA BASE-LINE COMPARISON FOR THE PERIOD 2015-2019
Total Bus Industries
Employment and compensation 2015 2016 2017 2018 2019
NUMBER
Total number of employees 119,082 126,940 120,789 119,754 122,923
Drivers 82,168 86,681 82,021 82,085 84,060
Mechanics 7,471 7,470 6,765 7,468 7,266
Other employees 29,434 32,789 32,003 30,201 31,597
DOLLARS
Total compensation (x 1,000) 7,458,523 8,007,022 8,118,394 8,100,677 8,442,268
Average expenditure per employee 62,634 63,077 67,211 67,645 68,679
Urban Transit Systems
Employment and compensation 2015 2016 2017 2018 2019
NUMBER
Total number of employees 63,148 62,704 62,653 63,234 66,579
Drivers 34,838 32,619 32,737 34,276 35,706
Mechanics 4,616 4,310 4,321 4,858 4,895
Other employees 23,694 25,775 25,595 24,100 25,978
DOLLARS
Total compensation (x 1,000) 5,661,409 5,907,443 6,167,098 6,111,902 6,463,383
Average expenditure per employee 89,653 94,212 98,433 96,655 97,078
MCPCC | LABOUR MARKET REPORTS 2021 COMPENSATION AND BENEFITS
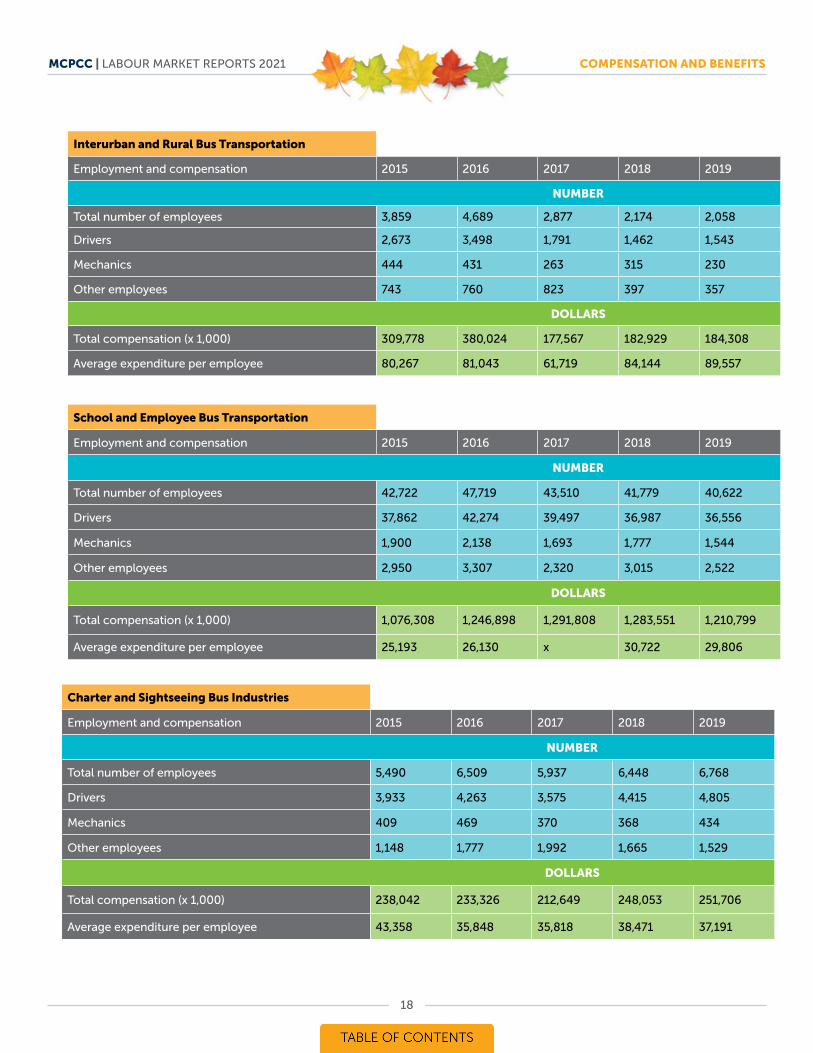
Interurban and Rural Bus Transportation
Employment and compensation 2015 2016 2017 2018 2019
NUMBER
Total number of employees 3,859 4,689 2,877 2,174 2,058
Drivers 2,673 3,498 1,791 1,462 1,543
Mechanics 444 431 263 315 230
Other employees 743 760 823 397 357
DOLLARS
Total compensation (x 1,000) 309,778 380,024 177,567 182,929 184,308
Average expenditure per employee 80,267 81,043 61,719 84,144 89,557
School and Employee Bus Transportation
Employment and compensation 2015 2016 2017 2018 2019
NUMBER
Total number of employees 42,722 47,719 43,510 41,779 40,622
Drivers 37,862 42,274 39,497 36,987 36,556
Mechanics 1,900 2,138 1,693 1,777 1,544
Other employees 2,950 3,307 2,320 3,015 2,522
DOLLARS
Total compensation (x 1,000) 1,076,308 1,246,898 1,291,808 1,283,551 1,210,799
Average expenditure per employee 25,193 26,130 x 30,722 29,806
Charter and Sightseeing Bus Industries
Employment and compensation 2015 2016 2017 2018 2019
NUMBER
Total number of employees 5,490 6,509 5,937 6,448 6,768
Drivers 3,933 4,263 3,575 4,415 4,805
Mechanics 409 469 370 368 434
Other employees 1,148 1,777 1,992 1,665 1,529
DOLLARS
Total compensation (x 1,000) 238,042 233,326 212,649 248,053 251,706
Average expenditure per employee 43,358 35,848 35,818 38,471 37,191
18
MCPCC | LABOUR MARKET REPORTS 2021 COMPENSATION AND BENEFITS
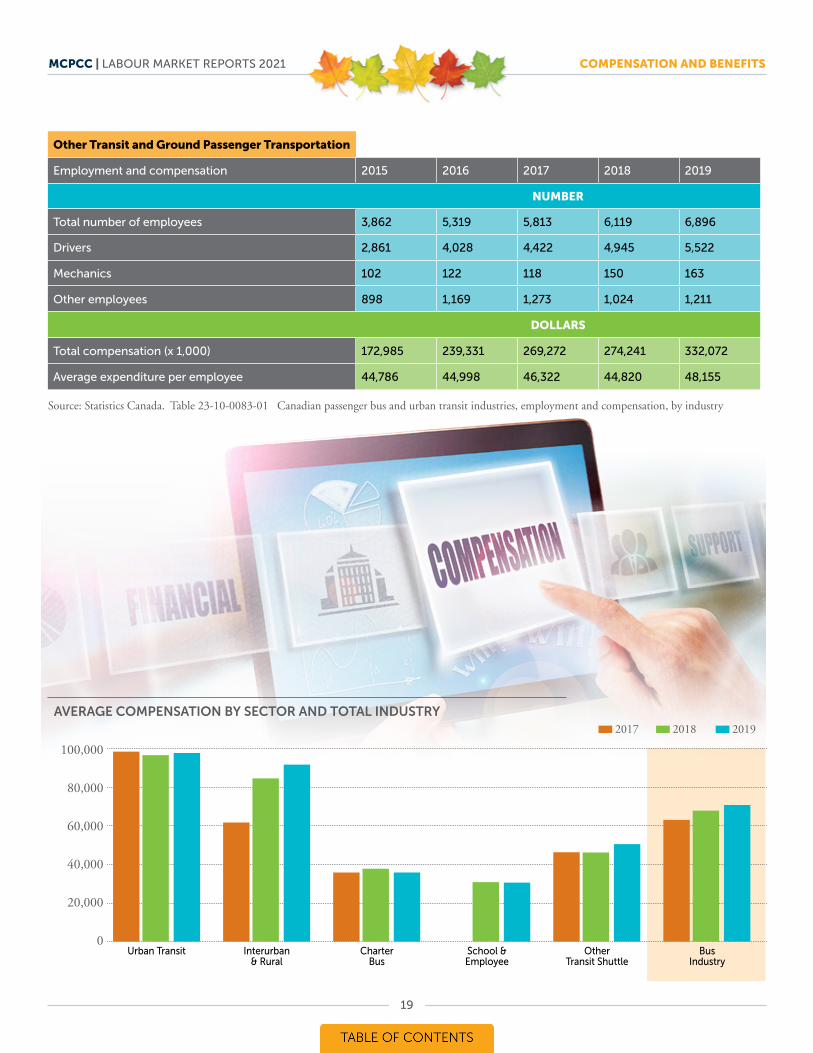
Other Transit and Ground Passenger Transportation
Employment and compensation 2015 2016 2017 2018 2019
NUMBER
Total number of employees 3,862 5,319 5,813 6,119 6,896
Drivers 2,861 4,028 4,422 4,945 5,522
Mechanics 102 122 118 150 163
Other employees 898 1,169 1,273 1,024 1,211
DOLLARS
Total compensation (x 1,000) 172,985 239,331 269,272 274,241 332,072
Average expenditure per employee 44,786 44,998 46,322 44,820 48,155
Source: Statistics Canada. Table 23-10-0083-01 Canadian passenger bus and urban transit industries, employment and compensation, by industry
AVERAGE COMPENSATION BY SECTOR AND TOTAL INDUSTRY
Urban Transit Interurban & Rural
Charter Bus
School & Employee
Other Transit Shuttle
Bus Industry
100,000
80,000
60,000
40,000
20,000
0
20192017 2018
19
MCPCC | LABOUR MARKET REPORTS 2021 COMPENSATION AND BENEFITS
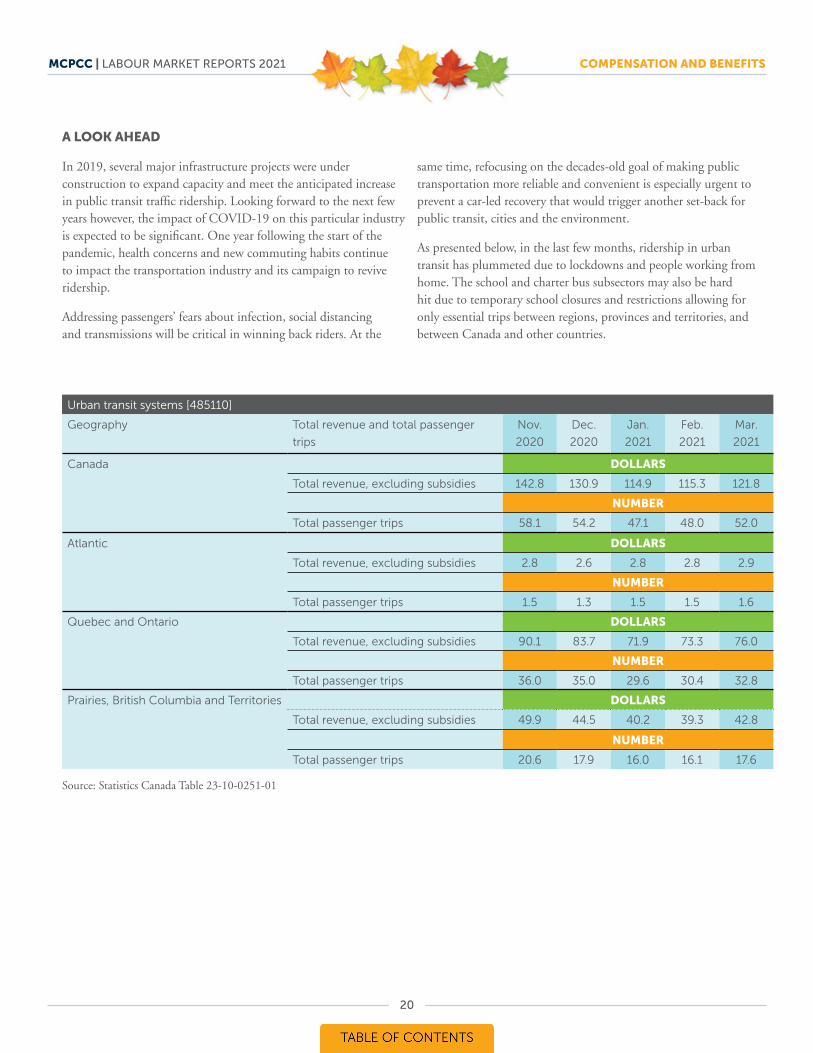
A LOOK AHEAD
In 2019, several major infrastructure projects were under construction to expand capacity and meet the anticipated increase in public transit traffic ridership. Looking forward to the next few years however, the impact of COVID-19 on this particular industry is expected to be significant. One year following the start of the pandemic, health concerns and new commuting habits continue to impact the transportation industry and its campaign to revive ridership.
Addressing passengers’ fears about infection, social distancing and transmissions will be critical in winning back riders. At the
same time, refocusing on the decades-old goal of making public transportation more reliable and convenient is especially urgent to prevent a car-led recovery that would trigger another set-back for public transit, cities and the environment.
As presented below, in the last few months, ridership in urban transit has plummeted due to lockdowns and people working from home. The school and charter bus subsectors may also be hard hit due to temporary school closures and restrictions allowing for only essential trips between regions, provinces and territories, and between Canada and other countries.
Urban transit systems [485110]
Geography Total revenue and total passenger
trips
Nov.
2020
Dec.
2020
Jan.
2021
Feb.
2021
Mar.
2021
Canada DOLLARS
Total revenue, excluding subsidies 142.8 130.9 114.9 115.3 121.8
NUMBER
Total passenger trips 58.1 54.2 47.1 48.0 52.0
Atlantic DOLLARS
Total revenue, excluding subsidies 2.8 2.6 2.8 2.8 2.9
NUMBER
Total passenger trips 1.5 1.3 1.5 1.5 1.6
Quebec and Ontario DOLLARS
Total revenue, excluding subsidies 90.1 83.7 71.9 73.3 76.0
NUMBER
Total passenger trips 36.0 35.0 29.6 30.4 32.8
Prairies, British Columbia and Territories DOLLARS
Total revenue, excluding subsidies 49.9 44.5 40.2 39.3 42.8
NUMBER
Total passenger trips 20.6 17.9 16.0 16.1 17.6
Source: Statistics Canada Table 23-10-0251-01
20
MCPCC | LABOUR MARKET REPORTS 2021 COMPENSATION AND BENEFITS
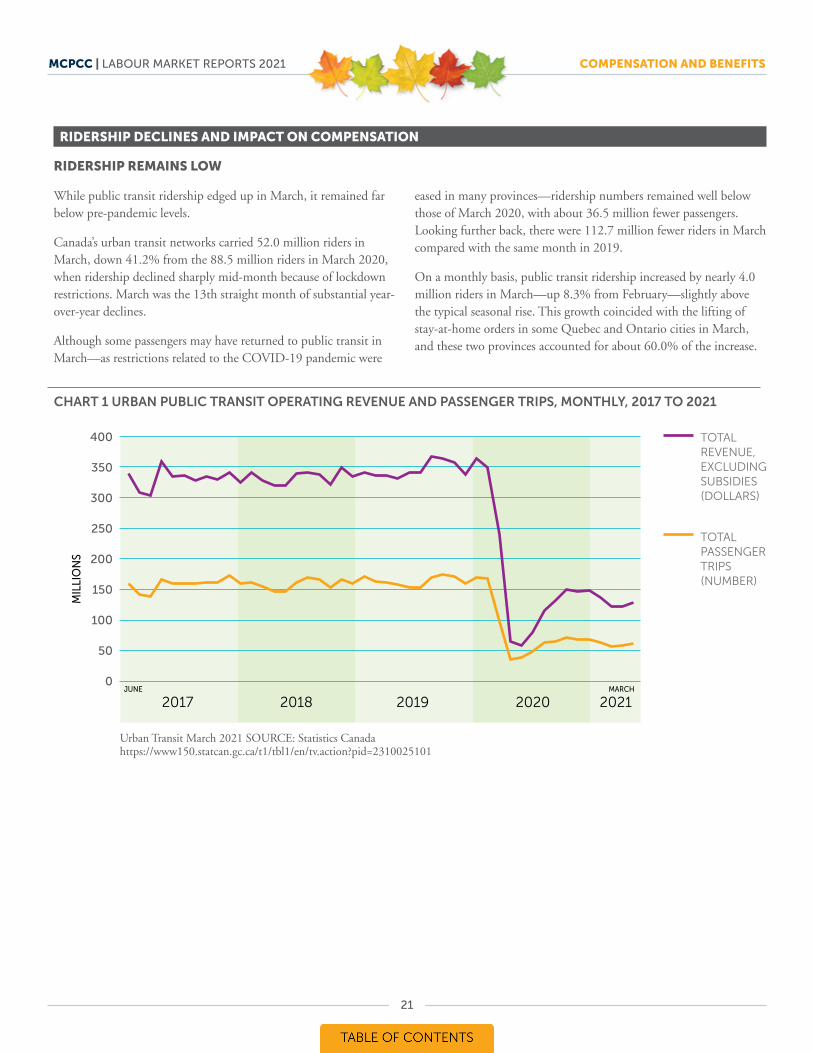
RIDERSHIP DECLINES AND IMPACT ON COMPENSATION
RIDERSHIP REMAINS LOW
While public transit ridership edged up in March, it remained far below pre-pandemic levels.
Canada’s urban transit networks carried 52.0 million riders in March, down 41.2% from the 88.5 million riders in March 2020, when ridership declined sharply mid-month because of lockdown restrictions. March was the 13th straight month of substantial year-over-year declines.
Although some passengers may have returned to public transit in March—as restrictions related to the COVID-19 pandemic were
eased in many provinces—ridership numbers remained well below those of March 2020, with about 36.5 million fewer passengers. Looking further back, there were 112.7 million fewer riders in March compared with the same month in 2019.
On a monthly basis, public transit ridership increased by nearly 4.0 million riders in March—up 8.3% from February—slightly above the typical seasonal rise. This growth coincided with the lifting of stay-at-home orders in some Quebec and Ontario cities in March, and these two provinces accounted for about 60.0% of the increase.
400
350
300
250
200
150
100
50
0
2017 2018 2019 2020 2021
TOTAL REVENUE, EXCLUDING SUBSIDIES (DOLLARS)
TOTAL PASSENGER TRIPS (NUMBER)
JUNE
MIL
LIO
NS
MARCH
CHART 1 URBAN PUBLIC TRANSIT OPERATING REVENUE AND PASSENGER TRIPS, MONTHLY, 2017 TO 2021
Urban Transit March 2021 SOURCE: Statistics Canada https://www150.statcan.gc.ca/t1/tbl1/en/tv.action?pid=2310025101
21
MCPCC | LABOUR MARKET REPORTS 2021 COMPENSATION AND BENEFITS
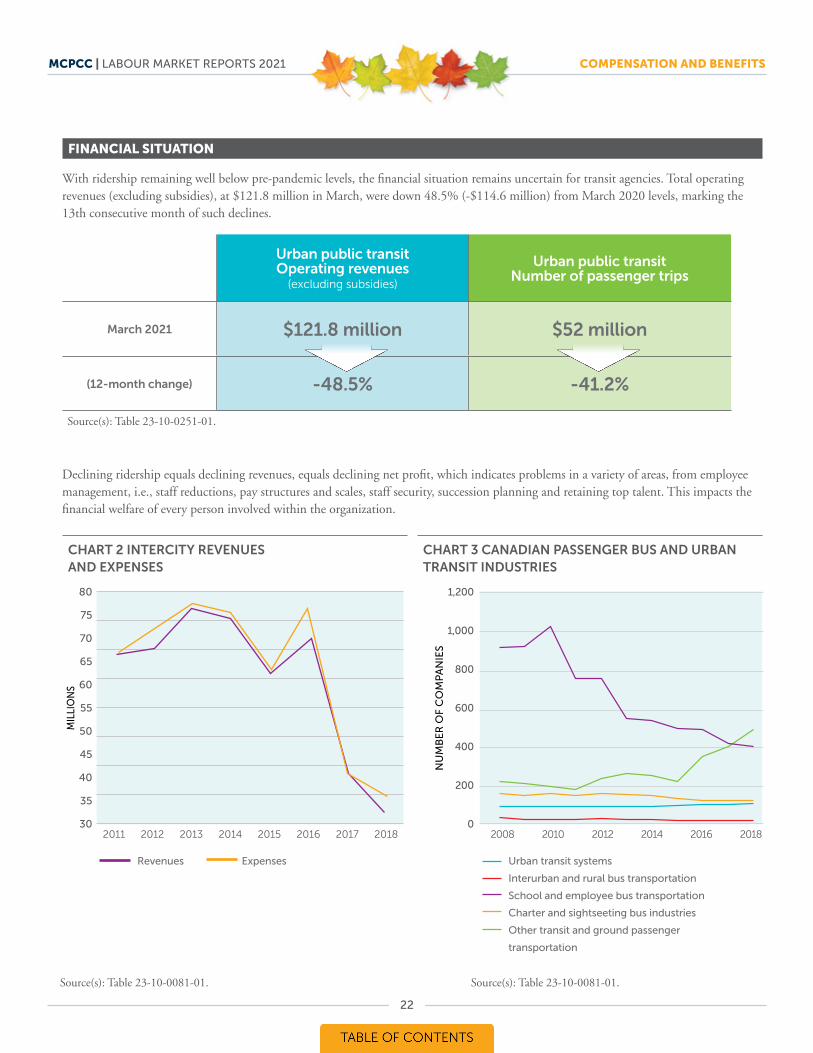
FINANCIAL SITUATION
With ridership remaining well below pre-pandemic levels, the financial situation remains uncertain for transit agencies. Total operating revenues (excluding subsidies), at $121.8 million in March, were down 48.5% (-$114.6 million) from March 2020 levels, marking the 13th consecutive month of such declines.
Urban public transit Operating revenues
(excluding subsidies)
Urban public transitNumber of passenger trips
March 2021 $121 .8 million $52 million
(12-month change) -48 .5% -41 .2%
Source(s): Table 23-10-0251-01.
Declining ridership equals declining revenues, equals declining net profit, which indicates problems in a variety of areas, from employee management, i.e., staff reductions, pay structures and scales, staff security, succession planning and retaining top talent. This impacts the financial welfare of every person involved within the organization.
CHART 2 INTERCITY REVENUES AND EXPENSES
CHART 3 CANADIAN PASSENGER BUS AND URBAN TRANSIT INDUSTRIES
80
75
70
65
60
55
50
45
40
35
30
1,200
1,000
800
600
400
200
02011 2012 2013 2014 2015 2016 2017 2018 2008 2010 2012 2014 2016 2018
Revenues Expenses Urban transit systems
Interurban and rural bus transportation
School and employee bus transportation
Charter and sightseeting bus industries
Other transit and ground passenger
transportation
MIL
LIO
NS
NU
MB
ER
OF
CO
MP
AN
IES
Source(s): Table 23-10-0081-01. Source(s): Table 23-10-0081-01.
22
MCPCC | LABOUR MARKET REPORTS 2021 COMPENSATION AND BENEFITS
BUS INDUSTRYCANADIAN ORGANIZATIONS
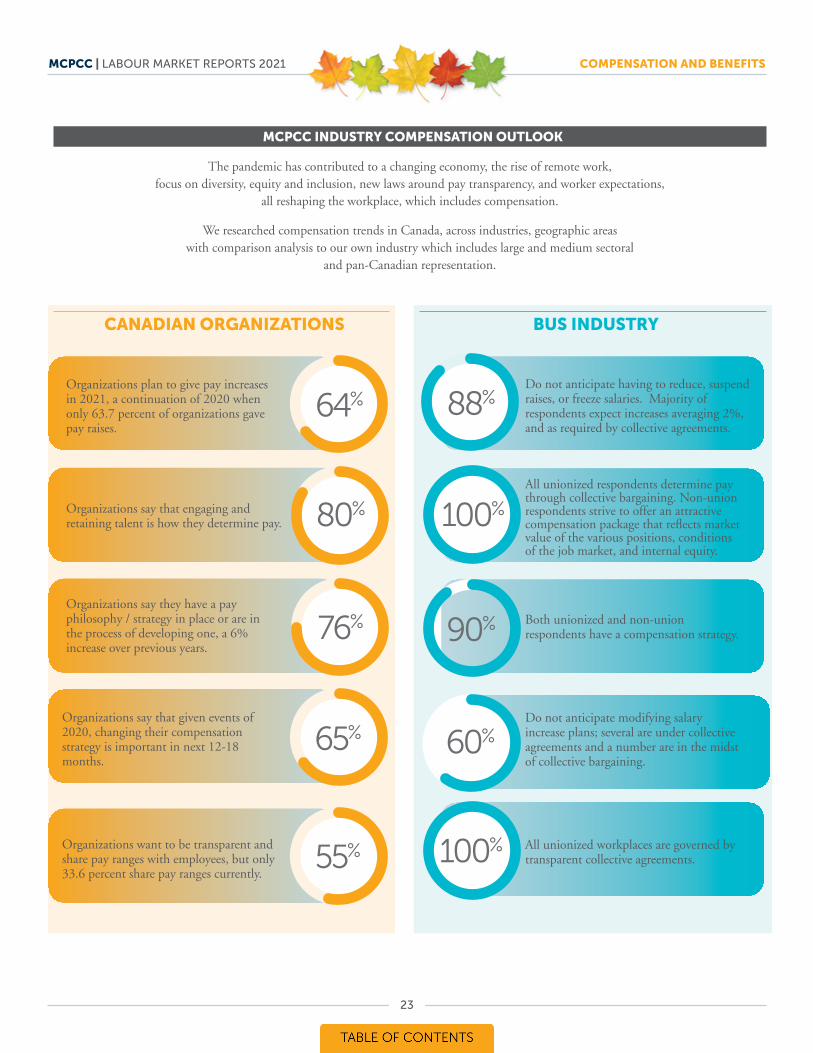
Organizations say that given events of 2020, changing their compensation strategy is important in next 12-18 months.
Organizations want to be transparent and share pay ranges with employees, but only 33.6 percent share pay ranges currently.
Organizations plan to give pay increases in 2021, a continuation of 2020 when only 63.7 percent of organizations gave pay raises.
MCPCC INDUSTRY COMPENSATION OUTLOOK
The pandemic has contributed to a changing economy, the rise of remote work, focus on diversity, equity and inclusion, new laws around pay transparency, and worker expectations,
all reshaping the workplace, which includes compensation.
We researched compensation trends in Canada, across industries, geographic areas with comparison analysis to our own industry which includes large and medium sectoral
and pan-Canadian representation.
90%
65% 60%
55% 100%
Both unionized and non-union respondents have a compensation strategy.
Do not anticipate having to reduce, suspend raises, or freeze salaries. Majority of respondents expect increases averaging 2%, and as required by collective agreements.
Organizations say that engaging and retaining talent is how they determine pay.
Do not anticipate modifying salary increase plans; several are under collective agreements and a number are in the midst of collective bargaining.
All unionized respondents determine pay through collective bargaining. Non-union respondents strive to offer an attractive compensation package that reflects market value of the various positions, conditions of the job market, and internal equity.
Organizations say they have a pay philosophy / strategy in place or are in the process of developing one, a 6% increase over previous years.
All unionized workplaces are governed by transparent collective agreements.
64% 88%
80% 100%
76%
23
MCPCC | LABOUR MARKET REPORTS 2021 COMPENSATION AND BENEFITS
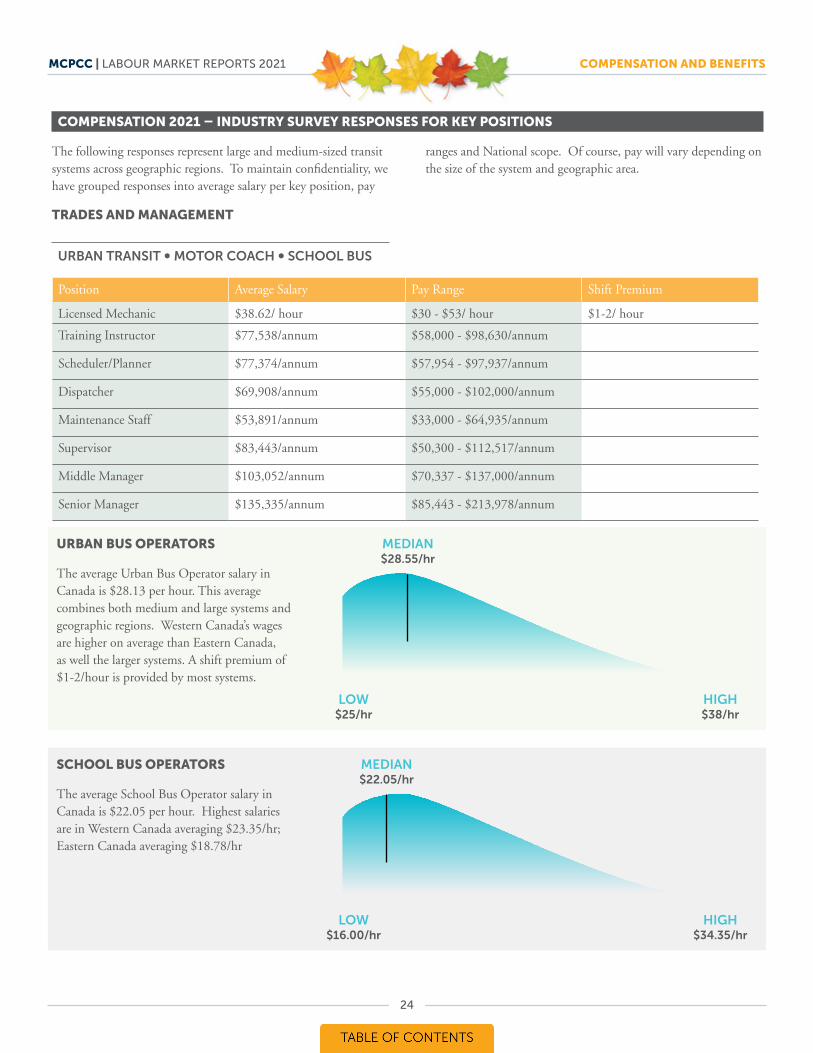
COMPENSATION 2021 – INDUSTRY SURVEY RESPONSES FOR KEY POSITIONS
The following responses represent large and medium-sized transit systems across geographic regions. To maintain confidentiality, we have grouped responses into average salary per key position, pay
ranges and National scope. Of course, pay will vary depending on the size of the system and geographic area.
TRADES AND MANAGEMENT
URBAN TRANSIT ∞ MOTOR COACH ∞ SCHOOL BUS
Position Average Salary Pay Range Shift Premium
Licensed Mechanic $38.62/ hour $30 - $53/ hour $1-2/ hour
Training Instructor $77,538/annum $58,000 - $98,630/annum
Scheduler/Planner $77,374/annum $57,954 - $97,937/annum
Dispatcher $69,908/annum $55,000 - $102,000/annum
Maintenance Staff $53,891/annum $33,000 - $64,935/annum
Supervisor $83,443/annum $50,300 - $112,517/annum
Middle Manager $103,052/annum $70,337 - $137,000/annum
Senior Manager $135,335/annum $85,443 - $213,978/annum
MEDIAN $28 .55/hr
MEDIAN $22 .05/hr
LOW $25/hr
LOW $16 .00/hr
HIGH $38/hr
HIGH $34 .35/hr
URBAN BUS OPERATORS
The average Urban Bus Operator salary in Canada is $28.13 per hour. This average combines both medium and large systems and geographic regions. Western Canada’s wages are higher on average than Eastern Canada, as well the larger systems. A shift premium of $1-2/hour is provided by most systems.
SCHOOL BUS OPERATORS
The average School Bus Operator salary in Canada is $22.05 per hour. Highest salaries are in Western Canada averaging $23.35/hr; Eastern Canada averaging $18.78/hr
24
MCPCC | LABOUR MARKET REPORTS 2021 COMPENSATION AND BENEFITS
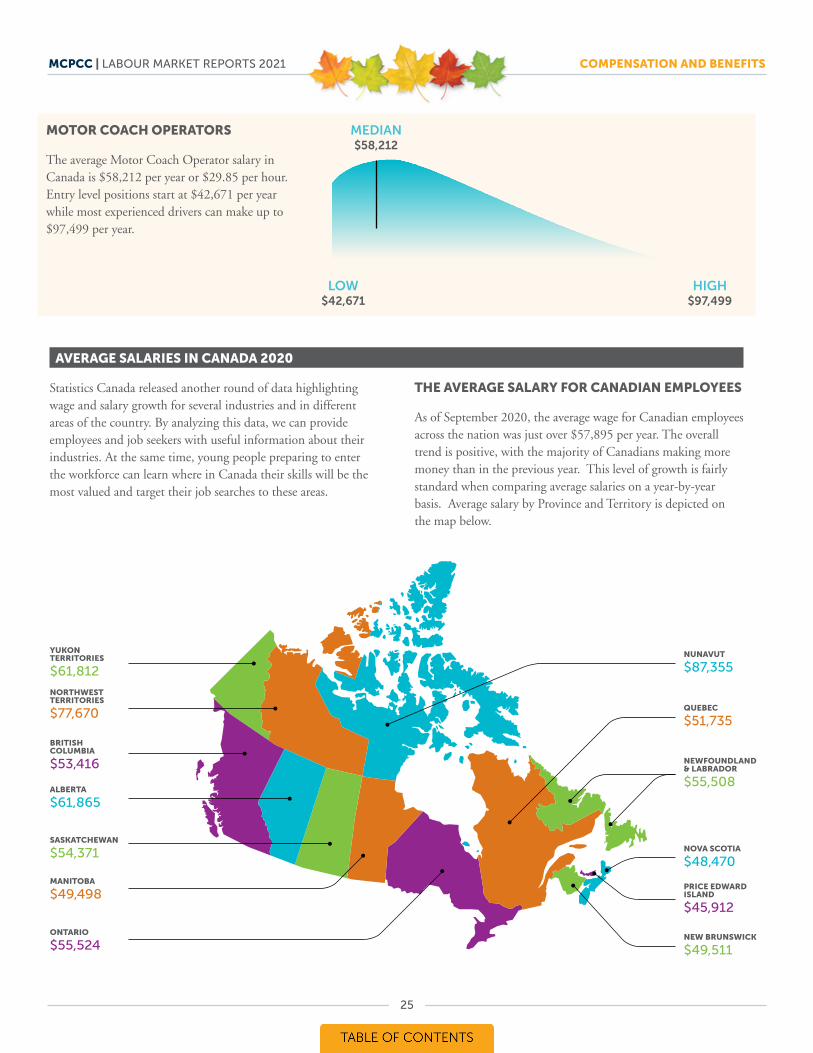
AVERAGE SALARIES IN CANADA 2020
Statistics Canada released another round of data highlighting wage and salary growth for several industries and in different areas of the country. By analyzing this data, we can provide employees and job seekers with useful information about their industries. At the same time, young people preparing to enter the workforce can learn where in Canada their skills will be the most valued and target their job searches to these areas.
THE AVERAGE SALARY FOR CANADIAN EMPLOYEES
As of September 2020, the average wage for Canadian employees across the nation was just over $57,895 per year. The overall trend is positive, with the majority of Canadians making more money than in the previous year. This level of growth is fairly standard when comparing average salaries on a year-by-year basis. Average salary by Province and Territory is depicted on the map below.
MEDIAN $58,212
LOW $42,671
HIGH $97,499
MOTOR COACH OPERATORS
The average Motor Coach Operator salary in Canada is $58,212 per year or $29.85 per hour. Entry level positions start at $42,671 per year while most experienced drivers can make up to $97,499 per year.
NORTHWEST TERRITORIES
$77,670
YUKON TERRITORIES
$61,812
NUNAVUT
$87,355
QUEBEC
$51,735
NOVA SCOTIA
$48,470
PRICE EDWARD ISLAND
$45,912
NEW BRUNSWICK
$49,511
NEWFOUNDLAND & LABRADOR
$55,508
BRITISH COLUMBIA
$53,416
ALBERTA
$61,865
SASKATCHEWAN
$54,371
MANITOBA
$49,498
ONTARIO
$55,524
25
2626
BENEFIT TRENDS
The pandemic has undoubtedly reshaped the benefits industry in 2020, teaching us important lessons along the way. But what’s ahead for the coming year? Considering the many employee challenges the pandemic helped to expose, as well as the rollout of COVID-19 vaccines, quite a lot. Here are some of the biggest health and benefit trends expected in the year ahead.
The Benefits Strategy & Benchmarking Survey revealed how employers’ have pivoted to support employee issues that have been caused or exacerbated by the pandemic. More than two-thirds of employers (68 percent) indicated that they have increased their focus on their employees’ emotional wellbeing, as employees are coping with significant lifestyle changes, financial worries and other anxieties caused by the pandemic. Gallagher’s research found well over half (56 percent) of employers have increased overall employee-wellbeing initiatives during the pandemic by offering new resources and tools (37 percent) and/or expanded programs (19 percent). Additionally, in response to the stress related to personal financial security created by COVID-19, nearly one-in-five employers (19 percent) have increased support for their employees’ financial wellbeing.
Additional key findings from the Benefits Strategy & Benchmarking Survey include:
• To combat costs, employers are exploring variable cost structures and rebalancing cost-sharing. People are among an organization’s most important assets and also one of the most expensive due to compensation and benefit costs. Medical inflation continues to outpace general inflation in Canada. As such, employers are beginning to rebalance traditionally generous cost-sharing across multiple plan-design components. While a majority of employers still pay 100 percent of plans, downward trends abound with fewer employers offering full
coverage of extended healthcare co-insurance (down three percent), extended healthcare premiums (down six percent), paramedical co-insurance (down six percent), and drug plan premiums (down nine percent).
• Aligning benefits with shifting workplace preferences increases perceived value amongst employees. Moving forward, employers will likely look to more flexible total rewards strategies, policies and practices that can be reconfigured to more readily to align with trends in workforce needs and interests. Full-time telecommuting more than tripled from early 2020 to June, reaching 72 percent, and most employers (85 percent) expect to retain their work-at-home policies post-pandemic to accommodate employees that prefer this arrangement. As both physical and emotional health are prioritized by employees and employers alike, increased access to virtual healthcare and Employee Assistance Plan options, along with more flexible sick-day policies and personal-day allowances, are becoming more important to the perceived value of the benefits package.
• Strategies for emerging from the pandemic can position the organization to thrive in future periods of disruption. Most employers planned and managed benefits from year to year (66 percent) in 2020, while just 12 percent relied on a multi-year strategy. But with the impact of COVID-19, there’s a stronger case for preparing a longer-term roadmap that includes scenario planning and regular checkpoints to ensure both employers’ and employees’ needs and interests are being met. This includes updating policies around leaves; educating managers to ensure compliance with federal, provincial and municipal regulations; and investing in HR technology that can more safely support areas of increased intensity including off-boarding and outplacement.
PART FIVE
BENEFITS AND PERKS
MCPCC | LABOUR MARKET REPORTS 2021 COMPENSATION AND BENEFITS
RESET ON HEALTH PLANS AND BENEFIT PROGRAMS
While many insurance providers did not experience the medical loss ratios of other years, there are concerns that many of the routine health services that were put off during the pandemic shutdown may play catch-up disproportionately to established norms. Plus, there is potential for large COVID-19 related claims that may still be forthcoming as some deferred services may become or exacerbate chronic issues in the longer term.
At the same time, the pandemic heightened employee appreciation for health benefits, and especially the value of telemedicine and health savings accounts (HSAs) as a way to build savings for unexpected medical costs.
In fact, to differentiate themselves while also better meeting employee needs, employers should look at 2021 as a chance to re-evaluate the basis of their benefits programs overall. Especially in a post-pandemic environment, deductibles and carrier networks are important, but employees increasingly need to know how their benefits will make their lives easier or better. It takes a strategy that’s based on a combination of employee insights, data analytics and third-party data, such as social determinants of health, to develop benefits that are tailored to particular segments of the workforce.
REMOTE WORK AND FLEXIBILITY
COVID-19 has created a massive shift in where, when and how work gets done. Scores of employees were sent home early in 2020, where they’ve remained for the better part of a year. While remote work and flexible schedules will undoubtedly continue as COVID-19 persists in 2021, we also will see the model continue in a post-pandemic world. Because of that shift, we’ll also see new benefits and perks related to remote workers. Stipends for work-from-home set-ups, technology and other perks to engage remote employees will likely come into play in the coming year.
The shift to remote workplaces will cause a big reset in how talent is recruited and compensated. Employers are no longer constrained by geographic boundaries, which will mean a vast talent pool to choose from. That will impact everything from benefits to compensation strategies, forcing employers to adjust accordingly if they hope to effectively recruit and retain talent.
On compensation, a big question is whether the pay strategies reflect how work gets done in this new environment. Employers also must evaluate other aspects of their offer, taking into consideration their entire rewards packages.
MENTAL HEALTH SUPPORT
The disruptions and anxieties that accompanied the pandemic have taken a toll on employees’ mental health. To an extent, managers can alleviate some of these stresses by checking in regularly – communicating often – and being flexible and inclusive. But it also makes the case for looking into today’s more robust employee assistance programs (EAPs), especially those that offer virtual consultations.
In addition to promoting EAP services (which often also include financial counseling), employers should consider programs that are tailored to generational needs, whether saving for retirement or paying off college loans. The financial pressures among employees may also make limited benefit medical plans an option for some employees to offer lower-paid workers who can’t afford the premiums or deductibles of more traditional plans.
27
MCPCC | LABOUR MARKET REPORTS 2021 COMPENSATION AND BENEFITS
SURVEY FINDINGSOrganizations are not yet decided on how remote work is going to impact pay. Only 11.3 percent have a pay strategy specific to remote work. Another 10.6 percent say they are working on one for 2021. Currently, 50.4 percent of organizations do not think remote work will impact their talent strategy. Most are undecided about whether they will need to re-benchmark jobs. A minority of organizations are investing in stipends to assist employees working from home.
Source: PayScale
28
CAREGIVING SUPPORT
The past year has served as a reminder that employees’ lives don’t just revolve around work. The pandemic has increased care responsibilities with schools, daycare and eldercare facilities closed, leaving many employees scrambling to find alternate arrangements. Several employers have zeroed in on—and enhanced—caregiving benefit offerings due to the pandemic, realizing that distracted and stressed employees will not be the most productive ones. Expect a focus on caregiving to continue as employees remain vulnerable to the associated challenges of the pandemic.
NEW, TAILORED BENEFITS
As a result of experiences over the past year many companies will begin to tailor new offerings and perks specific to their workforce and employees’ needs.
Looking at the benefit trends, we surveyed a representative sample of Industry companies in all sectors across Canada to ascertain any planned or implemented compensation and benefit modifications.
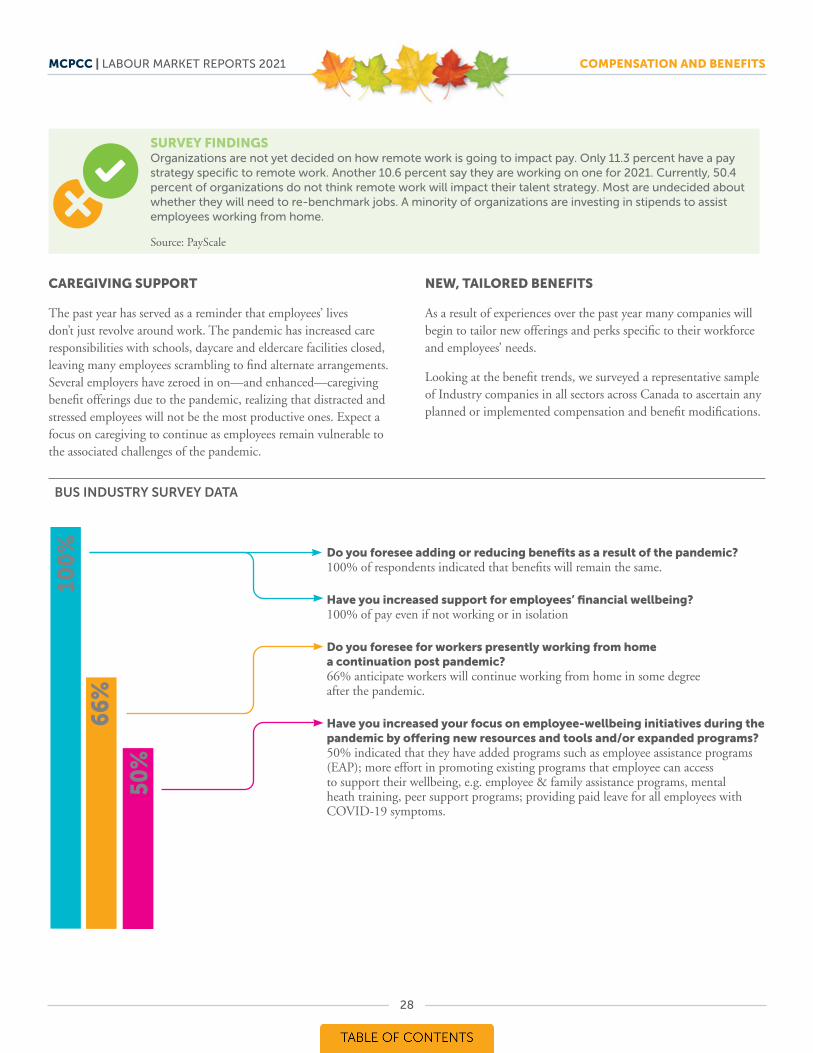
BUS INDUSTRY SURVEY DATA
100
%
66%
50%
Do you foresee adding or reducing benefits as a result of the pandemic?100% of respondents indicated that benefits will remain the same.
Have you increased support for employees’ financial wellbeing?100% of pay even if not working or in isolation
Do you foresee for workers presently working from home a continuation post pandemic? 66% anticipate workers will continue working from home in some degree after the pandemic.
Have you increased your focus on employee-wellbeing initiatives during the pandemic by offering new resources and tools and/or expanded programs? 50% indicated that they have added programs such as employee assistance programs (EAP); more effort in promoting existing programs that employee can access to support their wellbeing, e.g. employee & family assistance programs, mental heath training, peer support programs; providing paid leave for all employees with COVID-19 symptoms.
MCPCC | LABOUR MARKET REPORTS 2021 COMPENSATION AND BENEFITS
29
OwnershipTrustTransparencyEqualityInnovation
AC
HIEVEMENT AWARD
PAID VACATION
HEALTH INSURAN
CE
EM
PLO
YEES ALLOWANCE
PAY RISE
PE
RKS/BONUSES
PENSION
WO
RK LIFE BALANCE
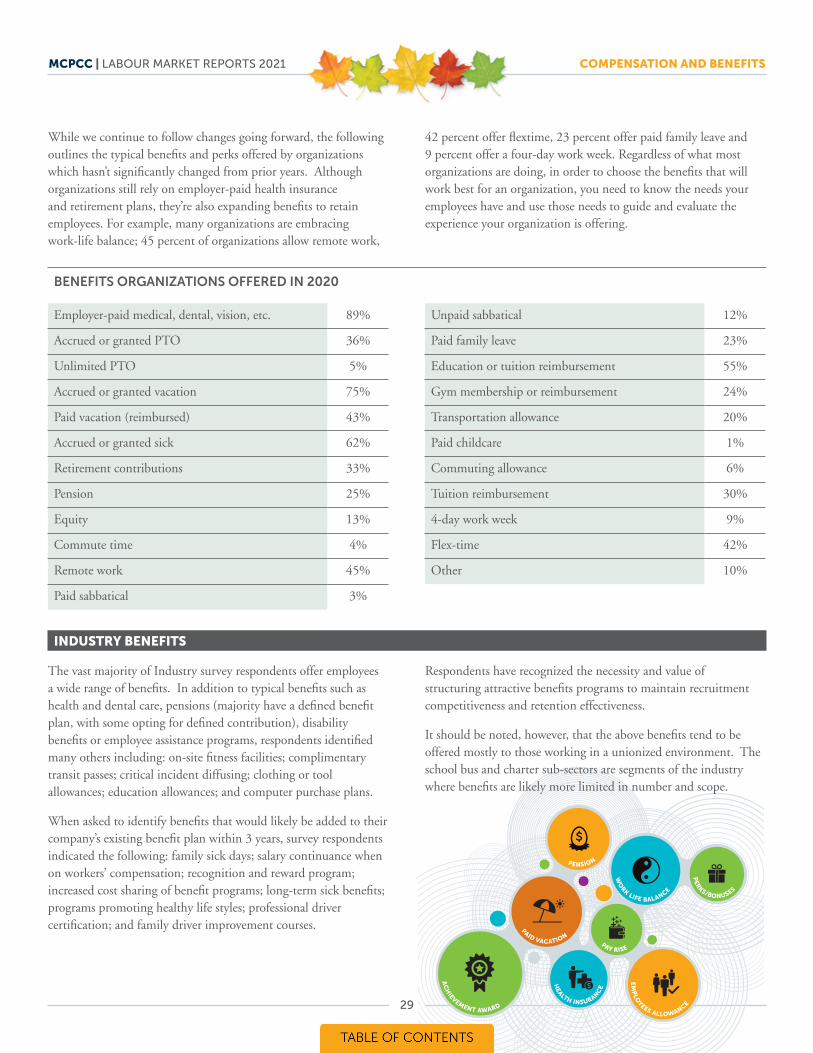
While we continue to follow changes going forward, the following outlines the typical benefits and perks offered by organizations which hasn’t significantly changed from prior years. Although organizations still rely on employer-paid health insurance and retirement plans, they’re also expanding benefits to retain employees. For example, many organizations are embracing work-life balance; 45 percent of organizations allow remote work,
42 percent offer flextime, 23 percent offer paid family leave and 9 percent offer a four-day work week. Regardless of what most organizations are doing, in order to choose the benefits that will work best for an organization, you need to know the needs your employees have and use those needs to guide and evaluate the experience your organization is offering.
BENEFITS ORGANIZATIONS OFFERED IN 2020
Employer-paid medical, dental, vision, etc. 89%
Accrued or granted PTO 36%
Unlimited PTO 5%
Accrued or granted vacation 75%
Paid vacation (reimbursed) 43%
Accrued or granted sick 62%
Retirement contributions 33%
Pension 25%
Equity 13%
Commute time 4%
Remote work 45%
Paid sabbatical 3%
Unpaid sabbatical 12%
Paid family leave 23%
Education or tuition reimbursement 55%
Gym membership or reimbursement 24%
Transportation allowance 20%
Paid childcare 1%
Commuting allowance 6%
Tuition reimbursement 30%
4-day work week 9%
Flex-time 42%
Other 10%
INDUSTRY BENEFITS
The vast majority of Industry survey respondents offer employees a wide range of benefits. In addition to typical benefits such as health and dental care, pensions (majority have a defined benefit plan, with some opting for defined contribution), disability benefits or employee assistance programs, respondents identified many others including: on-site fitness facilities; complimentary transit passes; critical incident diffusing; clothing or tool allowances; education allowances; and computer purchase plans.
When asked to identify benefits that would likely be added to their company’s existing benefit plan within 3 years, survey respondents indicated the following: family sick days; salary continuance when on workers’ compensation; recognition and reward program; increased cost sharing of benefit programs; long-term sick benefits; programs promoting healthy life styles; professional driver certification; and family driver improvement courses.
Respondents have recognized the necessity and value of structuring attractive benefits programs to maintain recruitment competitiveness and retention effectiveness.
It should be noted, however, that the above benefits tend to be offered mostly to those working in a unionized environment. The school bus and charter sub-sectors are segments of the industry where benefits are likely more limited in number and scope.