manual on deforestation, degradation, and fragmentation using
MMppiinnggoo CCoonnsseerrvvaattiioonn && DDeevveellooppmmeenntt IInniittiiaattiivvee
Drivers of Deforestation and Forest Degradation in Kilwa District
April 2012
Miya M, Ball SMJ & Nelson FD
Drivers of Deforestation in Kilwa
- 2 -
CONTENTS
List of tables ........................................................................................................................................ 3
List of Figures ..................................................................................................................................... 3
Acronyms Used ................................................................................................................................... 4
1 Background ..................................................................................................................................... 5
1.1 Lindi Region ........................................................................................................................... 5
1.2 Kilwa District .......................................................................................................................... 5
2 Deforestation and Forest Degradation in Kilwa District ................................................................. 7
2.1 Agriculture .............................................................................................................................. 7
2.2 Charcoal production and fuelwood requirement ................................................................... 10
2.3 Logging activities and timber trade ...................................................................................... 12
2.4 Fires....................................................................................................................................... 14
2.5 Wildlife ................................................................................................................................. 16
3 Survey to Determine the Drivers Of in Kilwa District ................................................................. 17
3.1 Methodology ......................................................................................................................... 17
3.2 Study area .............................................................................................................................. 17
3.3 Data collection and analysis .................................................................................................. 18
3.4 Results and Discussions ........................................................................................................ 18
4 Quantifying Drivers of Deforestation in Kilwa District ............................................................... 25
4.1 Agriculture ............................................................................................................................ 25
4.2 Charcoal ................................................................................................................................ 26
4.3 Timber Harvesting ................................................................................................................ 27
4.4 Fire ........................................................................................................................................ 27
4.5 Summary ............................................................................................................................... 28
4.6 Anticipated Losses in Community Forests ........................................................................... 29
5 Conclusions & Recommendations ................................................................................................ 30
5.1 Conclusions ........................................................................................................................... 30
5.2 Commoditising Carbon Losses ............................................................................................. 30
6 References ..................................................................................................................................... 32
Drivers of Deforestation in Kilwa
- 3 -
List of tables
Table 1: Area under cultivation in Kilwa District. .................................................................................. 8
Table 2: Data on legal charcoal production in Kilwa District. ............................................................. 12
Table 3: Total volumes of timber (m3) issued on harvest licences from the study area, 2003.............. 12
Table 4: Volumes (m3) of timber products specified on transit passes, January-October 2004. .......... 12
Table 5: Timber export from Tanzania, July 2005 to January 2006. .................................................... 13
Table 6: Timber harvesting data from Kilwa District during various licensing periods, 2006-2010. .. 14
Table 7: Changes in above-ground biomass resulting from different fire return intervals. .................. 16
Table 8: Number of respondents in each focus group from the villages surveyed. .............................. 18
Table 9: Village population and number of households. ...................................................................... 19
Table 10: Average area under cultivation and average yield of crops per acre. ................................... 19
Table 11: Projected area under shifting cultivation in the villages surveyed. ....................................... 20
Table 12: Tree species most preferred for charcoal. ............................................................................. 22
Table 13: Some of most preferred and most harvested timber species in the villages surveyed. ......... 23
Table 14: Estimates of total carbon loss through expansion of cultivated land and shifting cultivation
in Kilwa District. ................................................................................................................................... 25
Table 15: Estimates of total and per hectare carbon loss from charcoal production in Kilwa District. 26
Table 16: Estimates of total carbon loss from timber harvesting in Kilwa District. ............................. 27
Table 17: Estimates of total annual carbon loss to fire in Kilwa District. ............................................ 28
Table 18: Estimated annual total carbon losses, and losses per hectare, from the four main drivers of
forest carbon loss through deforestation and degradation in Kilwa District. ........................................ 28
List of Figures
Figure 1: Fire frequency in Kilwa District, from MODIS fire monitoring data. .................................. 15
Figure 2: Population increase from 2002 to 2010 in the surveyed villages. ......................................... 21
Drivers of Deforestation in Kilwa
- 4 -
Acronyms Used
asl = above sea level
DADPs = District Agriculture Development Plans
DALDO =District Agriculture and Livestock Development Officer
FBD = Forest and Beekeeping Division
MACEMP = Marine and Coastal Environmental Management Programme, a World Bank sponsored
project operating in Kilwa District
MCDI = Mpingo Conservation and Development Initiative
PFM = Participatory Forest Management
REDD = Reduction of Emission through Deforestation and Forest degradation
TRAFFIC = Trade in Flora and Fauna in International Commerce, the wildlife trade monitoring
network
UNFCCC = United Nations Framework Convention for Climate Change
VEO = Village Executive Officer
VLFR = Village Land Forest Reserve
WWF = World Wide Fund for Nature
Drivers of Deforestation in Kilwa
- 5 -
1 BACKGROUND
1.1 Lindi Region
Lindi Region is located in the southeast part of Tanzania. The region is bordered by the Indian Ocean
(east), Coast Region (north), Morogoro and Ruvuma Regions to the west and Mtwara Region in the
south. The region is the fourth largest in the country with an area of 67,000km2, of which 18,000km
2
lie within the confines of the Selous Game Reserve. The region is endowed with abundant forest and
timber resources, estimated at roughly 3.75 million ha of forest and woodland.
According to the population census of 2002 the population of Lindi Region is 791,306. Some 90% of
the population makes a living from subsistence agriculture and are dependent on the region’s forests
to some degree. The region is sparsely populated and one of the poorest parts of the country.
In recent years the Tanzanian government and its donors have made efforts to improve development
prospects in the region with investments in infrastructure, and to attract investors in various sectors
such as agriculture and forestry. However, these efforts have led to serious environmental and socio-
economic tradeoffs such as a surge in uncontrolled logging and timber trade activities after the
completion of the Mkapa Bridge (Milledge et al. 2007).
Lindi Region has become increasingly important as a primary revenue source for central government,
with Rufiji, Kilwa and Liwale Districts among the top four forest product revenue earners in the
country during 2003/2004. However, forest inventories conducted in 2005 concluded that most forests
in southern Tanzania “are degraded” or “heavily degraded”, whilst rates of revenue loss from
irregular timber trade were amongst the highest in the country (Milledge et al. 2007, Malimbwi et al.
2005a,c,d,e).
1.2 Kilwa District
1.2.1 Population and Socio-economic status
Kilwa District is the most northerly district in Lindi Region. To the east of the district is the Indian
Ocean, to the west are Liwale District and the Selous Game Reserve, to the north is Rufiji District and
south is Lindi Rural District. Kilwa District covers an area of 13,347.5 km² (1,221.5 km2
is ocean),
which is divided into 93 villages containing an estimated 36,549 households (DADPS 2009).
The population in Kilwa District is estimated at 181,975 according to the 2010 district population
projections. The population density is 12.6 people per km2, annual growth and death rates are 2.4%
and 0.2% respectively. 85% of the population lives in rural areas and 15% in urban and peri-urban
areas.
Fishing and subsistence agriculture are the main economic activities, accounting for ~80% of the
labour force. The average per capita income is estimated at TSh 150,000/- per year (DADPS 2009,
MACEMP 2009).
Fish is the main source of protein in the district, nearly all of which comes from coastal marine
fisheries. These coastal fisheries, which support around 1,900 fishermen and 1,000 fishing boats, are
Drivers of Deforestation in Kilwa
- 6 -
almost entirely dependent on traditional methods and gear (artisanal fishing) including mashua, dau,
ngalawa and dugout canoes (MACEMP 2001).
The major cash crops grown in the district are coconuts, cashew nuts and sesame, while maize,
sorghum, cassava, rice, sweet potatoes and cowpeas are the main food crops. Other crops grown
include pulses, mangoes, citrus and vegetables. Intercropping is widespread and often results in
complicated cropping patterns (DADPS 2009, MACEMP 2009).
In recent years logging activities and livestock keeping have increased. Two factors have contributed
to this rise; one is the improvement of the road that links Kilwa with Dar es Salaam (especially the
completion of the Mkapa Bridge over the Rufiji River in 2003), and the second is the relocation in
2006 of livestock keepers from Ihefu Wetland in Mbeya to Lindi and Mtwara Regions.
1.2.2 Land cover and Vegetation
Kilwa District is sparsely populated and most of it is covered with natural vegetation, a large part
comprising miombo woodland with patches of coastal forest. At a macro scale, miombo vegetation is
considered to be fairly uniform. When viewed at a smaller scale, however, as a result of topography
and soil, it is a dynamic mosaic of grassland, thicket, forest and other woodland (Chidumayo 1997)
The major vegetation zones in Kilwa are the low-lying coastal strip, the central dissected plateaux on
higher lying lands (100m asl) and the far west bordering the Selous Game Reserve.
Along the low lying coastal strip the vegetation is characterized by the East African Coastal Forest
and thickets, and the vegetation is predominantly deciduous scrub with scattered trees. There are
substantial areas of seasonally flooded sandy soil, and much scattered cropland (Burgess et al. 1998).
Running down the centre of Kilwa District are dissected plateaux of slightly higher lying land with
fragments of the globally important biodiversity hotspot East African Coastal Forest (Ngusaru et al.
2001, Burgess et al. 1998). In the centre and far west of the District, bordering the Selous Game
Reserve, wildlife numbers are greater, with large mammals such as elephant, hippopotamus, and lion,
among many other species. Their grazing and browsing have a substantial impact on the vegetation,
which is generally short and open. Although the dominant trees here are mostly typical miombo
species, such as Brachystegia longifolia and Diplorhynchus condylocarpon, they are unable to grow
to their full stature due to high browsing pressure by wild herbivores, as well as the influence of
frequent fires set by villagers and hunting block owners (MCP 2006).
1 Marine and Coastal Environment Management Programme (MACEMP) recently conducted a study to assess land
capability for Kilwa district to provide information and knowledge of potential and limitations of the land resources and
provide information on the carrying capabilities of land in the District.
Drivers of Deforestation in Kilwa
- 7 -
2 DEFORESTATION AND FOREST DEGRADATION IN KILWA DISTRICT
Deforestation in UNFCCC terms involves a permanent change to another land use (Penman et al.
2003).The UNFCCC definition of forest degradation is direct human-induced long-term loss
(persisting for X years or more) of at least Y per cent of forest carbon stocks (and forest values) since
time (T), in a manner that does not qualify as deforestation (Penman et al. 2003). Therefore, even an
area that is temporarily devoid of trees may still qualify as degraded forest if those trees are likely to
grow back.
The Ministry of Natural Resources and Tourism estimates Tanzania’s reduction of national forest
cover at decreasing from 44 million ha in 1961 to 33.5 million ha in 1998 (FBD 2001). That
represents an annual loss of 0.73% which, if sustained, would further reduce the forest to 28.4 million
ha by 2020. In fact, the rate of deforestation is more likely to increase than simply to be sustained
because, unless extraordinary change occurs, demand for forest products is increasing which will
result in people taking more wood from less forest. The FAO (2005) estimates Tanzania’s annual rate
of deforestation at 413,000 hectares per annum.
Deforestation and forest degradation is ultimately driven by the demand for timber and other forest
products such as charcoal from urban areas, agricultural expansion, livestock keeping and other
development activities. Dallu (2006) and Mbonde (2005) list the threats currently facing forest
management in Tanzania as illegal harvesting and trade in timber and other forest products, forest
encroachment due to small-scale shifting agriculture, and the impacts of refugees, livestock, mining
and fire.
2.1 Agriculture
Agriculture is the predominant driver of deforestation worldwide. According to the UNFCCC,
subsistence agriculture in poor countries is responsible for 48% of deforestation, with commercial
agriculture responsible for 32% of deforestation, and commercial logging responsible for only 14% of
deforestation. Charcoal and other fuel wood removals account for less than 6% of deforestation, but
those uses can generally be assigned to subsistence practises (UNFCCC 2007).
Traditionally agriculture in Kilwa District has been for subsistence and followed shifting cultivation
patterns and customary practices. Agricultural expansion in the district is mainly influenced by the
size of households – i.e. population growth – and the amount of surplus crop obtained from the
previous harvest. Immigrants from other parts of the country practice permanent farming with better
farming techniques and use more sophisticated tools, although their goal is also primarily subsistence.
Major crops grown in the district are sorghum, maize, cassava, rice, millet and legumes as food crops,
whereas cashew, sesame and coconuts are the main cash crops. Banana and other fruit trees such as
mangoes, orange and lime are also widely grown in the region.
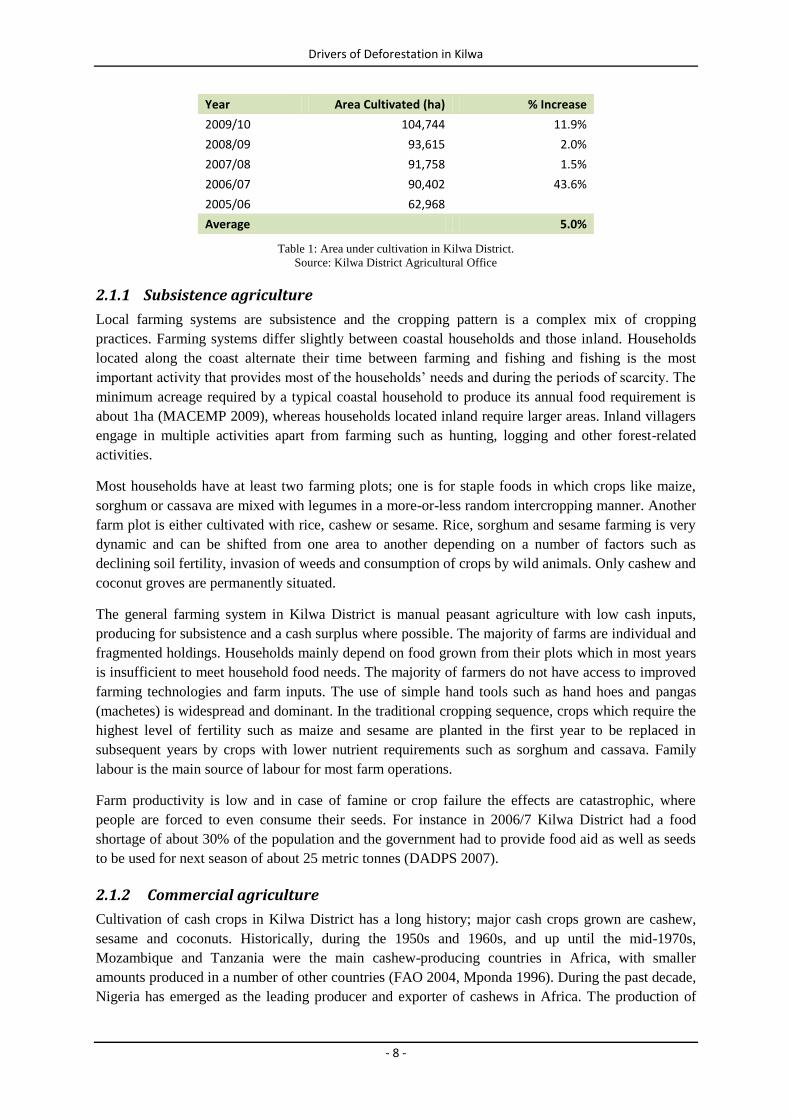
The area under cultivation in Kilwa District as of 2010 is estimated at 104,744 ha, which shows an
increase of approximately 40% as compared to less than about 63,000 ha under cultivation in 2005/6
(Table 1). There is no intensive or commercial farming of food or cash crops in the district apart from
Bioshape’s attempted and now abandoned Jatropha plantation in Mavuji, Nainokwe and Liwiti
villages (DADPS 2009; Sulle and Nelson forthcoming). Shifting cultivation is prevalent although
estimates by the district agricultural office puts it at 5-10% of the total area under cultivation (Pers.
comm., DALDO Kilwa 2010).
Drivers of Deforestation in Kilwa
- 8 -
Year Area Cultivated (ha) % Increase
2009/10 104,744 11.9%
2008/09 93,615 2.0%
2007/08 91,758 1.5%
2006/07 90,402 43.6%
2005/06 62,968
Average 5.0%
Table 1: Area under cultivation in Kilwa District.
Source: Kilwa District Agricultural Office
2.1.1 Subsistence agriculture
Local farming systems are subsistence and the cropping pattern is a complex mix of cropping
practices. Farming systems differ slightly between coastal households and those inland. Households
located along the coast alternate their time between farming and fishing and fishing is the most
important activity that provides most of the households’ needs and during the periods of scarcity. The
minimum acreage required by a typical coastal household to produce its annual food requirement is
about 1ha (MACEMP 2009), whereas households located inland require larger areas. Inland villagers
engage in multiple activities apart from farming such as hunting, logging and other forest-related
activities.
Most households have at least two farming plots; one is for staple foods in which crops like maize,
sorghum or cassava are mixed with legumes in a more-or-less random intercropping manner. Another
farm plot is either cultivated with rice, cashew or sesame. Rice, sorghum and sesame farming is very
dynamic and can be shifted from one area to another depending on a number of factors such as
declining soil fertility, invasion of weeds and consumption of crops by wild animals. Only cashew and
coconut groves are permanently situated.
The general farming system in Kilwa District is manual peasant agriculture with low cash inputs,
producing for subsistence and a cash surplus where possible. The majority of farms are individual and
fragmented holdings. Households mainly depend on food grown from their plots which in most years
is insufficient to meet household food needs. The majority of farmers do not have access to improved
farming technologies and farm inputs. The use of simple hand tools such as hand hoes and pangas
(machetes) is widespread and dominant. In the traditional cropping sequence, crops which require the
highest level of fertility such as maize and sesame are planted in the first year to be replaced in
subsequent years by crops with lower nutrient requirements such as sorghum and cassava. Family
labour is the main source of labour for most farm operations.
Farm productivity is low and in case of famine or crop failure the effects are catastrophic, where
people are forced to even consume their seeds. For instance in 2006/7 Kilwa District had a food
shortage of about 30% of the population and the government had to provide food aid as well as seeds
to be used for next season of about 25 metric tonnes (DADPS 2007).
2.1.2 Commercial agriculture
Cultivation of cash crops in Kilwa District has a long history; major cash crops grown are cashew,
sesame and coconuts. Historically, during the 1950s and 1960s, and up until the mid-1970s,
Mozambique and Tanzania were the main cashew-producing countries in Africa, with smaller
amounts produced in a number of other countries (FAO 2004, Mponda 1996). During the past decade,
Nigeria has emerged as the leading producer and exporter of cashews in Africa. The production of
Drivers of Deforestation in Kilwa
- 9 -
cashew nuts in Nigeria has increased almost six-fold in the last decade. As in the case of other
developing countries, Nigeria has recognised the potential economic value of cashew and has made a
concerted effort to improve production of the crop (FAO 2004).
The majority of cashew production in Tanzania is carried out by small-scale farmers in mono- or
mixed production systems. The government is actively supporting farmers in upgrading their current
farming systems and practices in order to improve the condition of the trees and maximize agronomic
potential. Current yields are about 3 kg per tree, but under proper management – weeding,
fertilization, disease and pest control – yields of 8 kg per tree can be expected (FAO 2004).
Sesame is the second most important cash crop in south-eastern Tanzania after cashew. Like cashew,
sesame is grown by small-scale farmers in mono-crop farms. Sesame grows well in many types of soil
but thrives particularly on well-drained and medium textured soils; sesame is drought resistant and
tolerant to pests and diseases. The nutrient requirements of sesame are a bit higher compared to other
crops grown in the district (Mponda 1996).
Sesame in the Kilwa is grown in shifted plots. Farmers prefer virgin forest land for several reasons:
virgin forest soil is easy to work with; after clearing the area is burned and is ready for planting; new
cleared forest has less weeds for about two seasons therefore weeding is very much reduced; sesame
flea beetle is the major threatening pest and using new forest land offers a feasible strategy to avoid
this pest (Mponda 1996); new cleared forest soil is well drained and requires zero or minimum tillage
before planting thus providing the best place to grow sesame. Sesame is generally a labour intensive
crop but when grown on virgin soils the labour requirement is reduced to one third (Mponda 1996).
MACEMP (2009) analyses the cash requirement of a typical farmer, the main assumption being that
all basic cash income requirements are obtained from the sale of cashew, coconut or sesame. For
coastal people to be attracted to live on the land in their villages it is assumed that they should be
capable of earning as much as a minimum wage urban worker. The minimum wage in urban areas is
TSh 1,000,000/- per annum on the basis of 250 days ‘work’ per year. In rural villages the average
annual income is much lower, around TSh 357,000/- per annum per household in villages in which
MCDI works (Fletcher 2008).
The gross margin for coconut is TSh 633,500/- per hectare (MACEMP 2009). Thus 1.6 ha will
generate the target income of TSh 1,008,000/-. The gross margin per hectare for cashew is 694,750/-
and that of sesame is 1,219,500/- . Thus, depending on the crop grown, between about 1ha and 1.6 ha
of cash crops are required to generate a competitive income of at least TSh 1,008,000/- per year to
meet the cash demand of a typical coastal household. The situation is different in the inland villages
where an average of 0.5ha of Cashew nut is required or less than 0.5ha of sesame is required to
provide a competitive income of TSh 357,000/-.
With the increasing demand for cash crops, increasing access to markets and increasing urbanization,
farm expansion also is expected to increase beyond the current model result of 1.6ha per household to
meet these demands. The MACEMP study projected that if the present farming system and level of
technology prevails, the coastal strip of Kilwa will reach the maximum carrying capacity in the next
five years (MACEMP 2009). This may then drive agricultural expansion inland.
2.1.3 Livestock keeping
Livestock keeping in the District until recently was almost non-existent; only a few villagers had
cattle, goats or sheep. In 1996 there were only 1,436 cattle, 5,000 sheep and 4,879 goats (DADPS
2009). In 2006/7 Kilwa received a substantial amount of livestock from other regions mainly from
Drivers of Deforestation in Kilwa
- 10 -
Ihefu Wetlands in Mbeya, about 11,902 cattle plus a few hundred sheep and goats arrived during that
period, briefly bringing the livestock population to over 13,000 animals. The recent influx of
pastoralist and agro-pastoralists livestock keepers into the district has made livestock keeping an
important component in the farming system in Kilwa District.
Kilwa district has more scrubland and woodland than arable land and most of the arable land is
planted with perennial crops or is under cultivation of both food and cash crops (MACEMP 2009).
The major threat that is posed by the increasing number of livestock is the creation of more grassland
areas from forest and bush lands to meet the grazing demand. It is estimated that a single head of
cattle requires about 10 acres of grassland per year for grazing. Extended dry periods and high
incidence of bushfires may force the grazing area per head to go beyond the standard 10 acre
requirement. This will lead to more forest being cleared to create grasslands for grazing.
Miombo woodlands play a critical role in the management of livestock throughout the region,
especially now with the sudden increase of livestock. After arriving, most of the livestock were
located in the bush or forest land and livestock owners had to create grazing areas for their animals.
During wetter times of the year, open grassy patches within the miombo are sometimes heavily used
for grazing, but late in the dry season these grass patches are burnt over or are fully grazed hence
grazing must encroach into the woodland. Miombo is a seasonal habitat, and loses much of its leaf
cover during the dry season. In the early spring, the so-called ‘late dry season flush’ sees the miombo
coming back to life, with vast swathes of the woodland covered in bright red, orange and yellow
foliage. It is during this time of year, when seasonal grazing resources are otherwise highly
constrained, that miombo comes into its own as a critical source of fodder for livestock.
The number of livestock in the district is set to increase due to the deliberate effort by the government
to stimulate development and encourage more people to invest in livestock and ranching activities,
although in practice this is likely to lead to greater immigration by pastoralists than significant
behaviour change by existing Kilwa residents. The government is providing the necessary
infrastructure such as the construction of cattle dips, opening livestock markets at Nangurukuru and
Mbwemkuru and setting aside areas for ranch development. Kilwa district plans to have a total of
75,000 head of cattle in the near future (pers. comm. DALDO Kilwa 2010).
2.2 Charcoal production and fuelwood requirement
Charcoal and fuelwood are by far the most widely used sources of domestic energy in Tanzania; in
urban areas charcoal is used extensively and fuelwood less, the opposite is true in peri-urban zones
and in rural villages. About 85% of the total urban population depends on charcoal for household
cooking and energy for small and medium enterprises (Sawe 2004). Driven by low incomes amongst
the majority of charcoal users and the lack of affordable alternative energy sources, the majority of
medium to low-income families in urban areas rely heavily upon charcoal as their principle source of
domestic energy due to a lack of competitively priced alternatives (Monera et al. 2003, Luoga et al.
2000).
Rural people in Kilwa depend entirely on fuel wood for all their energy need for cooking and other
uses. In 1992, the total amount of charcoal consumed nationwide was estimated to be about 1.2
million tons (TaTEDO, 2002). In 2002 the charcoal business generated estimated revenues of more
than 200 billion Tanzanian shillings ($200 million, Van Beukering et al. 2007) and that more than
70,000 people from rural and urban areas were employed in the charcoal industry (TaTEDO 2002).
Dar es Salaam, Tanzania’s largest city, accounts for more than 50% of all charcoal consumed in the
country (Ahrends et al. 2010). Nowadays from 15,000 to 20,000 bags of charcoal enter Dar es Salaam
Drivers of Deforestation in Kilwa
- 11 -
every 24 hours, every day of the year, and an equal amount enters the other major Tanzanian towns
combined. That adds up to nearly one million tonnes of charcoal per year, for which trees had to be
cut from 3,320km2 of forest. Some of that forest will regenerate; but much of it never will because it
is converted to farmland and/or is cut again for charcoal before it has fully recovered (Norconsult
2001). The population in Dar and other major towns in Tanzania are increasing in population, further
fuelling the demand for charcoal.
All charcoal in the country is produced in the rural areas, with the largest shares of raw materials
extracted from open Miombo woodlands (owned by local governments), reserved forests, bush land
forests (publicly owned), mangrove forests, and farm lands (Van Beukering et al. 2007, Milledge et
al. 2005).
Preference and suitability of trees used for charcoal burning varies with the type, size, availability and
accessibility of the tree species. Large tree species (>20cm diameter) with high caloric values are the
most preferred (Monela et al. 1993). If these are not easily available or accessible, other tree species
like Mangifera indica (mango), cashew etc. with low calorific values can be used as well. Reserved
trees such as Milicia excelsa, Pterocarpus angolensis and Dalbergia melanoxylon, although they have
high calorific values, in theory cannot be harvested as they are nationally protected tree species (Van
Beukering et al. 2007, Monela et al. 1993), but closer to Dar even these species are exploited for
charcoal. Moreover, as much of the trade in charcoal is not properly regulated, legal restrictions on
species selection have only marginal impact.
Trees used for charcoal making are mainly harvested in two ways: clear felling of forestland for
agriculture purposes and subsequent carbonization of the felled trees; and selective cutting done by
charcoal makers who specialise in the charcoal business, which may be their main source of income.
Selective harvesting is in principle the least destructive form as it allows young trees to grow.
However, due to inadequate management and regulation young trees are also chopped down and used
to cover the charcoal kilns, resulting in unnecessary forest destruction.
Several studies conducted to examine the supply–demand chain of charcoal trade show that the
production of charcoal follows a southward shift from Dar es salaam. Charcoal consumed in Dar used
to come from adjacent villages in Coast Region, but currently most charcoal to Dar comes from
further north around Morogoro and Tanga Regions and further south from Rufiji and as far as
Marendego, Somanga and Miteja in Kilwa District (Milledge et al. 2007, Van Beukering et al. 2007,
TaTEDO 2002, Monela et al. 1993). Charcoal enters the city though the major routes such as
Morogoro, Pugu, Kilwa and Bagamoyo. Morogoro and Pugu routes contribute 59%, Kilwa (accounts
for the charcoal from the south including Rufiji) route 31% and Bagamoyo 10% of the charcoal
arriving in Dar es Salaam (Van Beukering et al. 2007). This shift is a result of increasing demand in
the city and surrounding suburbs, decreasing forest and timber resources for charcoal in nearby
villages and as a result of improved roads and access to areas far from the city.
Charcoal burning produces high volumes of carbon dioxide, carbon monoxide and methane. On
average, fuelwood carbon is approximately diverted as follows: 52% to charcoal, 24% to CO2, and
10% to other components. This implies that charcoal fuel cycles constitute some of the largest
greenhouse-gas (GHG) emissions in the world (Van Beukering et al. 2007).
Existing legal charcoal harvesting in Kilwa District is estimated at 9,372 bags per year, based on
existing license data from 2007 and 2010 (Table 2). At 50kg/bag, this equates to a legal harvest of
about 2,343 tonnes of charcoal from Kilwa annually.
Drivers of Deforestation in Kilwa
- 12 -
Date Months No. of licenses No. of bags
Dec 06 - May 07 5 49 6153
May 07 - Dec 07 7 49 4704
Mar 10 - Jun 10 3 20 858
Total 15 118 11715
Average per year 94 9372
Table 2: Data on legal charcoal production in Kilwa District.
Source: Licenses issued by the Kilwa District Forest Office in 2007 and 2010.
Charcoal production is expected to increase considerably in Kilwa in the future, given trends of rising
demand from urban centres such as Dar es Salaam. Ahrends et al. (2010) describe how charcoal
production has, between 1991 and 2005, expanded south from Dar es Salaam at a rate of about 30 km
annually. However, even at that rate of expansion, it will not be for another decade or so that intensive
charcoal exploitation hits Kilwa District and results in a major increase in charcoal extraction, as
available supplies further north are gradually depleted.
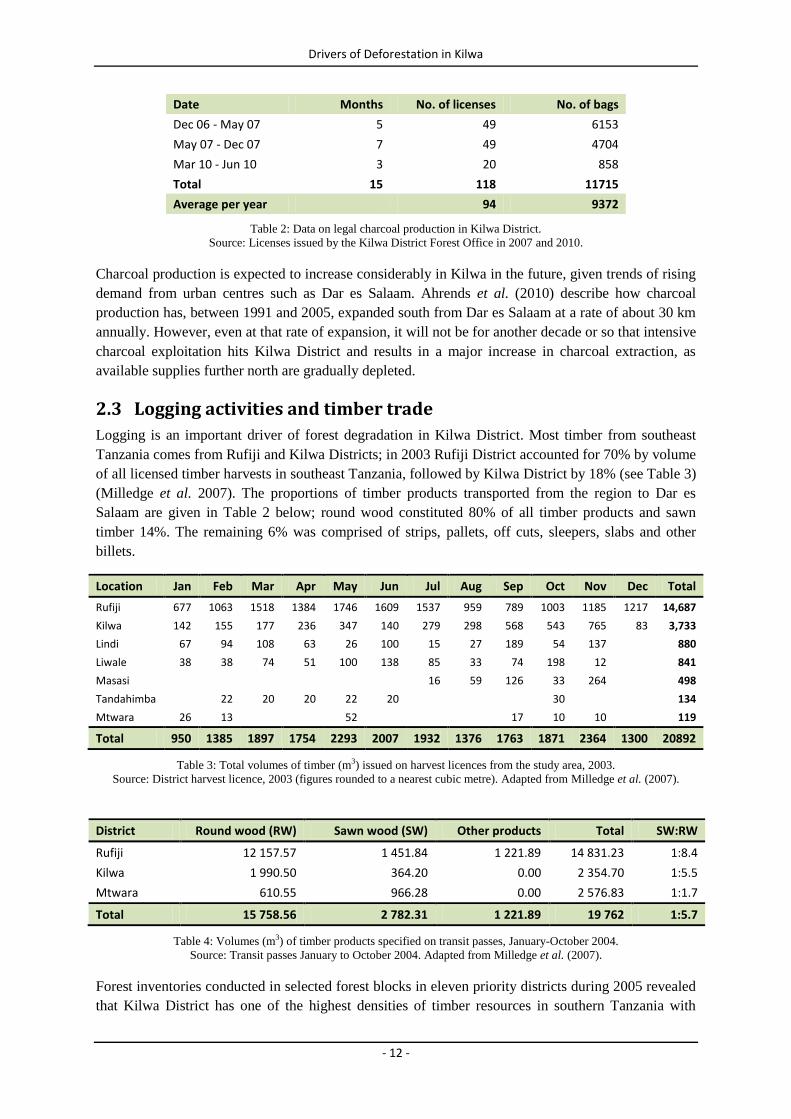
2.3 Logging activities and timber trade
Logging is an important driver of forest degradation in Kilwa District. Most timber from southeast
Tanzania comes from Rufiji and Kilwa Districts; in 2003 Rufiji District accounted for 70% by volume
of all licensed timber harvests in southeast Tanzania, followed by Kilwa District by 18% (see Table 3)
(Milledge et al. 2007). The proportions of timber products transported from the region to Dar es
Salaam are given in Table 2 below; round wood constituted 80% of all timber products and sawn
timber 14%. The remaining 6% was comprised of strips, pallets, off cuts, sleepers, slabs and other
billets.
Location Jan Feb Mar Apr May Jun Jul Aug Sep Oct Nov Dec Total
Rufiji 677 1063 1518 1384 1746 1609 1537 959 789 1003 1185 1217 14,687
Kilwa 142 155 177 236 347 140 279 298 568 543 765 83 3,733
Lindi 67 94 108 63 26 100 15 27 189 54 137 880
Liwale 38 38 74 51 100 138 85 33 74 198 12 841
Masasi 16 59 126 33 264 498
Tandahimba 22 20 20 22 20 30 134
Mtwara 26 13 52 17 10 10 119
Total 950 1385 1897 1754 2293 2007 1932 1376 1763 1871 2364 1300 20892
Table 3: Total volumes of timber (m3) issued on harvest licences from the study area, 2003.
Source: District harvest licence, 2003 (figures rounded to a nearest cubic metre). Adapted from Milledge et al. (2007).
District Round wood (RW) Sawn wood (SW) Other products Total SW:RW
Rufiji 12 157.57 1 451.84 1 221.89 14 831.23 1:8.4
Kilwa 1 990.50 364.20 0.00 2 354.70 1:5.5
Mtwara 610.55 966.28 0.00 2 576.83 1:1.7
Total 15 758.56 2 782.31 1 221.89 19 762 1:5.7
Table 4: Volumes (m3) of timber products specified on transit passes, January-October 2004.
Source: Transit passes January to October 2004. Adapted from Milledge et al. (2007).
Forest inventories conducted in selected forest blocks in eleven priority districts during 2005 revealed
that Kilwa District has one of the highest densities of timber resources in southern Tanzania with
Drivers of Deforestation in Kilwa
- 13 -
10.5m3/ha of harvestable timber in the surveyed blocks, second only to Tunduru District (12.2m
3/ha)
(Malimbwi et al. 2005a,c,d,e). However, the same inventories concluded that most forests in Liwale
and Tunduru Districts “are degraded” whilst those in Rufiji and Kilwa Districts are “heavily
degraded”. In practice this characterisation should probably be interpreted as applying only to
commercially valuable timber species.
High urban demand for timber within Dar es Salaam and the expanding global demand have driven
the logging boom in Southeast Tanzania. The adjacent coastline and Dar es Salaam port provide
excellent gateway points for timber to then be exported out to reach global markets.
Dar es Salaam is the primary destination of timber and timber products (including all round and sawn
timber) and accounting for 87% of timber felled in southeast Tanzania. It is also a major destination
of other wood products to be sold at domestic and export markets including furniture, poles, off-cuts
and charcoal (Milledge et al. 2005). Other important domestic markets of timber and wood products
from the region are Zanzibar, Mafia and Arusha.
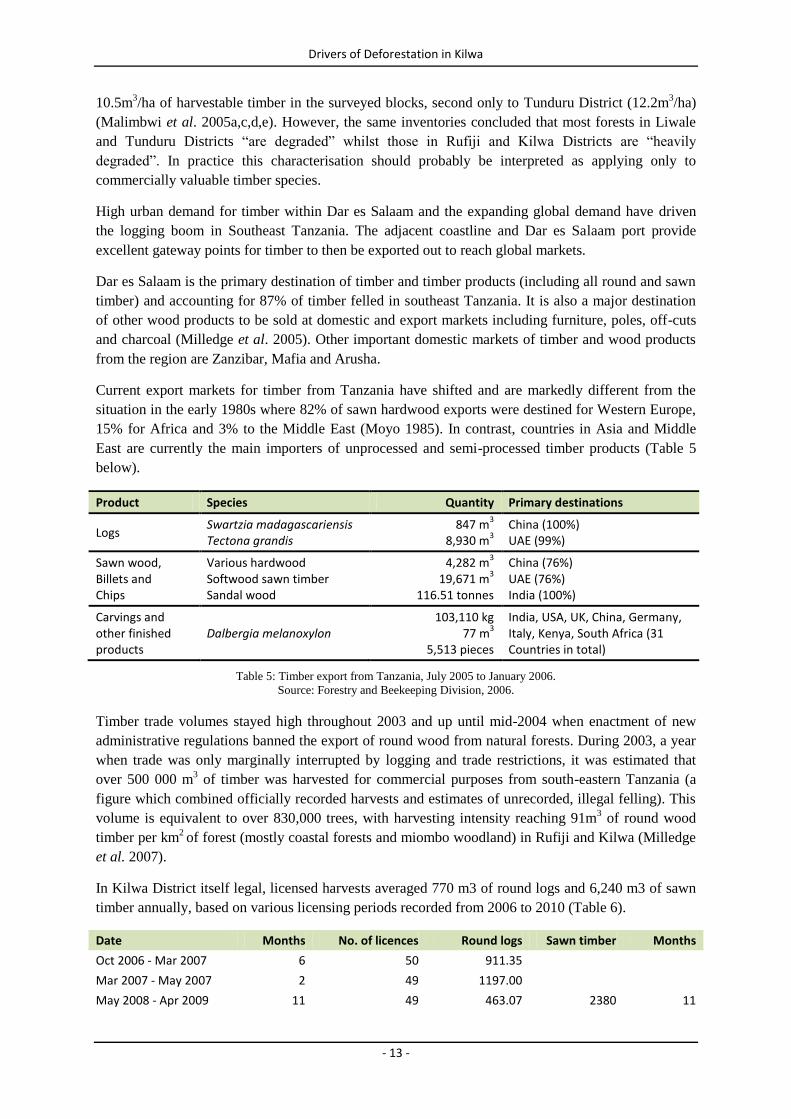
Current export markets for timber from Tanzania have shifted and are markedly different from the
situation in the early 1980s where 82% of sawn hardwood exports were destined for Western Europe,
15% for Africa and 3% to the Middle East (Moyo 1985). In contrast, countries in Asia and Middle
East are currently the main importers of unprocessed and semi-processed timber products (Table 5
below).
Product Species Quantity Primary destinations
Logs Swartzia madagascariensis Tectona grandis
847 m3
8,930 m3
China (100%) UAE (99%)
Sawn wood, Billets and Chips
Various hardwood Softwood sawn timber Sandal wood
4,282 m3
19,671 m3
116.51 tonnes
China (76%) UAE (76%) India (100%)
Carvings and other finished products
Dalbergia melanoxylon 103,110 kg
77 m3
5,513 pieces
India, USA, UK, China, Germany, Italy, Kenya, South Africa (31 Countries in total)
Table 5: Timber export from Tanzania, July 2005 to January 2006.
Source: Forestry and Beekeeping Division, 2006.
Timber trade volumes stayed high throughout 2003 and up until mid-2004 when enactment of new
administrative regulations banned the export of round wood from natural forests. During 2003, a year
when trade was only marginally interrupted by logging and trade restrictions, it was estimated that
over 500 000 m3 of timber was harvested for commercial purposes from south-eastern Tanzania (a
figure which combined officially recorded harvests and estimates of unrecorded, illegal felling). This
volume is equivalent to over 830,000 trees, with harvesting intensity reaching 91m3 of round wood
timber per km2 of forest (mostly coastal forests and miombo woodland) in Rufiji and Kilwa (Milledge
et al. 2007).
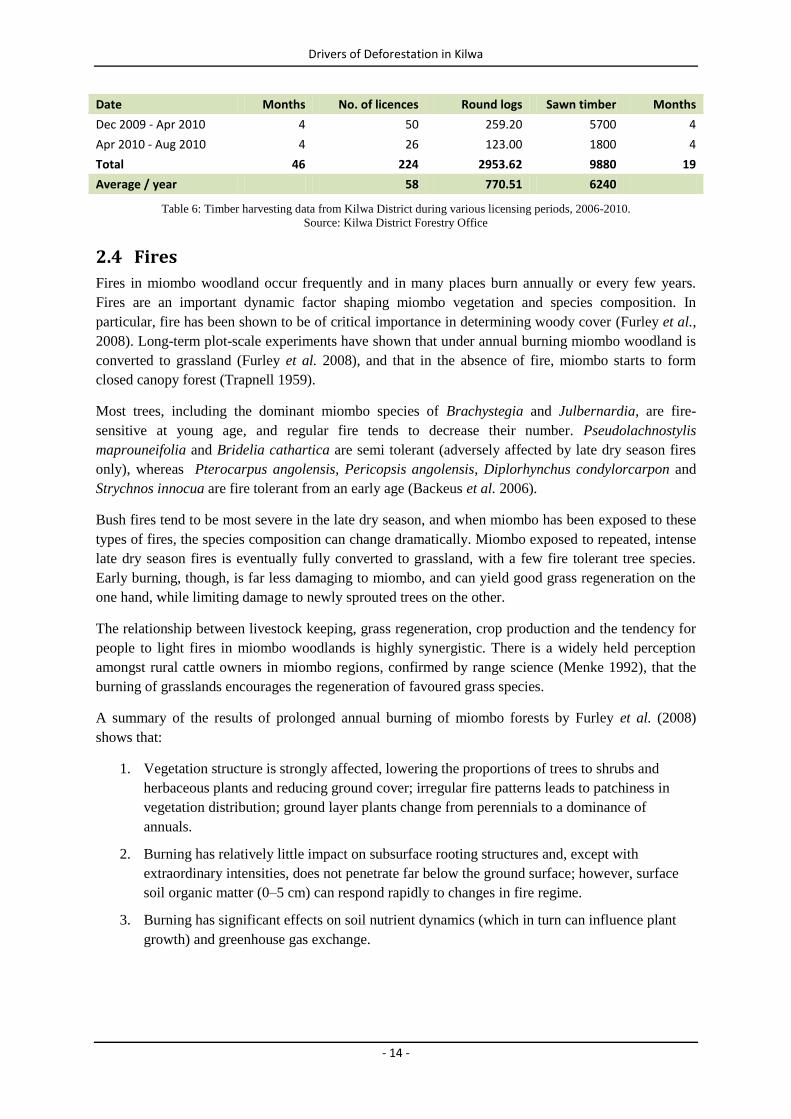
In Kilwa District itself legal, licensed harvests averaged 770 m3 of round logs and 6,240 m3 of sawn
timber annually, based on various licensing periods recorded from 2006 to 2010 (Table 6).
Date Months No. of licences Round logs Sawn timber Months
Oct 2006 - Mar 2007 6 50 911.35
Mar 2007 - May 2007 2 49 1197.00
May 2008 - Apr 2009 11 49 463.07 2380 11
Drivers of Deforestation in Kilwa
- 14 -
Date Months No. of licences Round logs Sawn timber Months
Dec 2009 - Apr 2010 4 50 259.20 5700 4
Apr 2010 - Aug 2010 4 26 123.00 1800 4
Total 46 224 2953.62 9880 19
Average / year 58 770.51 6240
Table 6: Timber harvesting data from Kilwa District during various licensing periods, 2006-2010.
Source: Kilwa District Forestry Office
2.4 Fires
Fires in miombo woodland occur frequently and in many places burn annually or every few years.
Fires are an important dynamic factor shaping miombo vegetation and species composition. In
particular, fire has been shown to be of critical importance in determining woody cover (Furley et al.,
2008). Long-term plot-scale experiments have shown that under annual burning miombo woodland is
converted to grassland (Furley et al. 2008), and that in the absence of fire, miombo starts to form
closed canopy forest (Trapnell 1959).
Most trees, including the dominant miombo species of Brachystegia and Julbernardia, are fire-
sensitive at young age, and regular fire tends to decrease their number. Pseudolachnostylis
maprouneifolia and Bridelia cathartica are semi tolerant (adversely affected by late dry season fires
only), whereas Pterocarpus angolensis, Pericopsis angolensis, Diplorhynchus condylorcarpon and
Strychnos innocua are fire tolerant from an early age (Backeus et al. 2006).
Bush fires tend to be most severe in the late dry season, and when miombo has been exposed to these
types of fires, the species composition can change dramatically. Miombo exposed to repeated, intense
late dry season fires is eventually fully converted to grassland, with a few fire tolerant tree species.
Early burning, though, is far less damaging to miombo, and can yield good grass regeneration on the
one hand, while limiting damage to newly sprouted trees on the other.
The relationship between livestock keeping, grass regeneration, crop production and the tendency for
people to light fires in miombo woodlands is highly synergistic. There is a widely held perception
amongst rural cattle owners in miombo regions, confirmed by range science (Menke 1992), that the
burning of grasslands encourages the regeneration of favoured grass species.
A summary of the results of prolonged annual burning of miombo forests by Furley et al. (2008)
shows that:
1. Vegetation structure is strongly affected, lowering the proportions of trees to shrubs and
herbaceous plants and reducing ground cover; irregular fire patterns leads to patchiness in
vegetation distribution; ground layer plants change from perennials to a dominance of
annuals.
2. Burning has relatively little impact on subsurface rooting structures and, except with
extraordinary intensities, does not penetrate far below the ground surface; however, surface
soil organic matter (0–5 cm) can respond rapidly to changes in fire regime.
3. Burning has significant effects on soil nutrient dynamics (which in turn can influence plant
growth) and greenhouse gas exchange.
Drivers of Deforestation in Kilwa
- 15 -
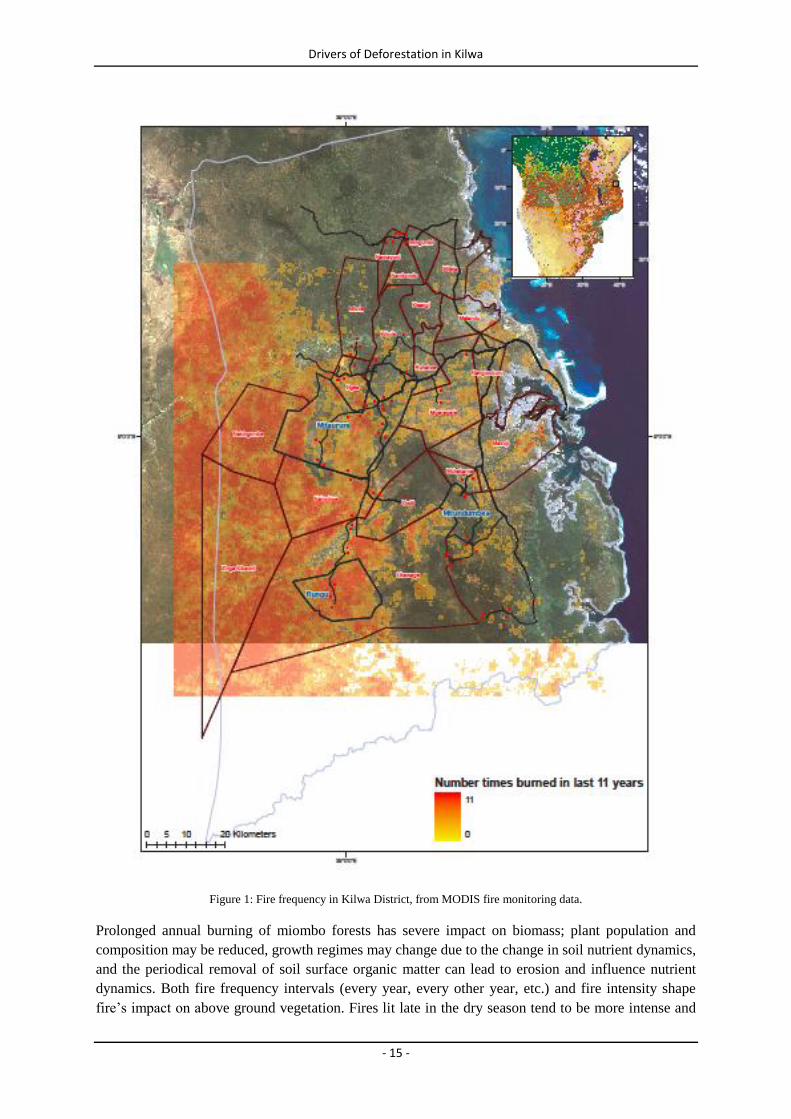
Figure 1: Fire frequency in Kilwa District, from MODIS fire monitoring data.
Prolonged annual burning of miombo forests has severe impact on biomass; plant population and
composition may be reduced, growth regimes may change due to the change in soil nutrient dynamics,
and the periodical removal of soil surface organic matter can lead to erosion and influence nutrient
dynamics. Both fire frequency intervals (every year, every other year, etc.) and fire intensity shape
fire’s impact on above ground vegetation. Fires lit late in the dry season tend to be more intense and
Drivers of Deforestation in Kilwa
- 16 -
result in greater tree mortality and loss of biomass, whereas, fires started early in the dry season
before the grass has dried completely burn at relatively low intensities. Significant areas often remain
unburned after early burning because high moisture content and path-wise distribution of grasses that
is linked to underlying variations in soil moisture and drying rates (Stronach 2009).
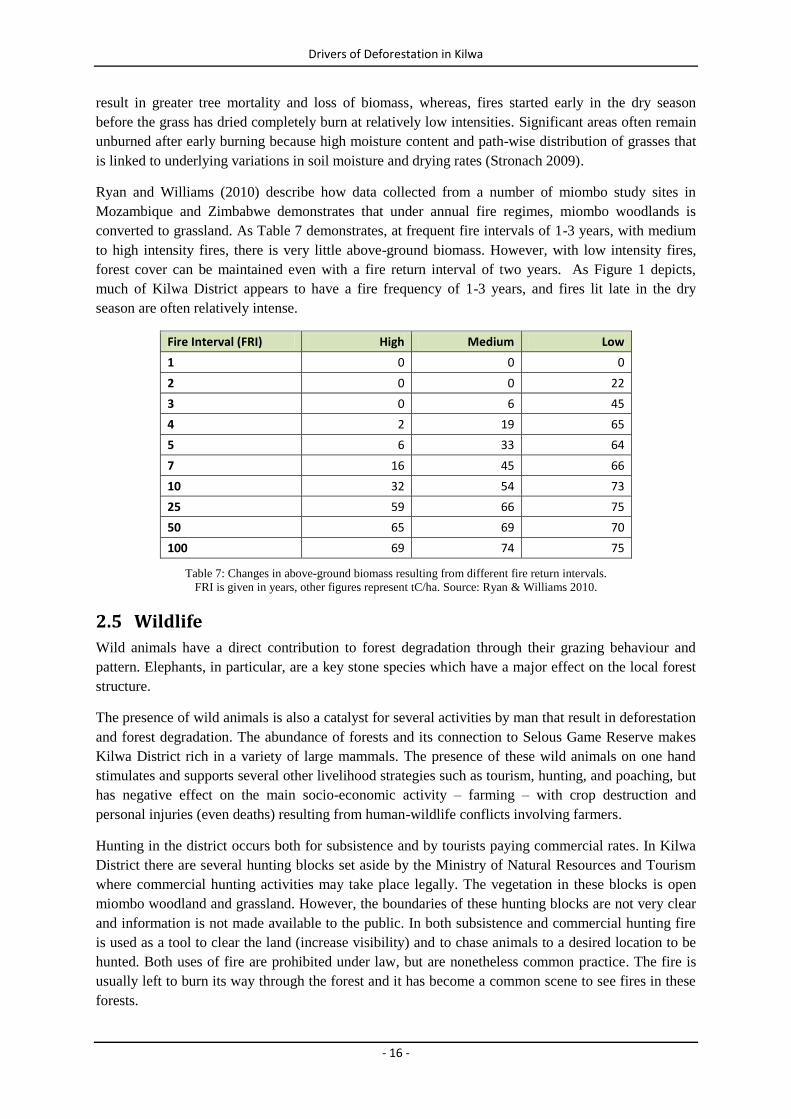
Ryan and Williams (2010) describe how data collected from a number of miombo study sites in
Mozambique and Zimbabwe demonstrates that under annual fire regimes, miombo woodlands is
converted to grassland. As Table 7 demonstrates, at frequent fire intervals of 1-3 years, with medium
to high intensity fires, there is very little above-ground biomass. However, with low intensity fires,
forest cover can be maintained even with a fire return interval of two years. As Figure 1 depicts,
much of Kilwa District appears to have a fire frequency of 1-3 years, and fires lit late in the dry
season are often relatively intense.
Fire Interval (FRI) High Medium Low
1 0 0 0
2 0 0 22
3 0 6 45
4 2 19 65
5 6 33 64
7 16 45 66
10 32 54 73
25 59 66 75
50 65 69 70
100 69 74 75
Table 7: Changes in above-ground biomass resulting from different fire return intervals.
FRI is given in years, other figures represent tC/ha. Source: Ryan & Williams 2010.
2.5 Wildlife
Wild animals have a direct contribution to forest degradation through their grazing behaviour and
pattern. Elephants, in particular, are a key stone species which have a major effect on the local forest
structure.
The presence of wild animals is also a catalyst for several activities by man that result in deforestation
and forest degradation. The abundance of forests and its connection to Selous Game Reserve makes
Kilwa District rich in a variety of large mammals. The presence of these wild animals on one hand
stimulates and supports several other livelihood strategies such as tourism, hunting, and poaching, but
has negative effect on the main socio-economic activity – farming – with crop destruction and
personal injuries (even deaths) resulting from human-wildlife conflicts involving farmers.
Hunting in the district occurs both for subsistence and by tourists paying commercial rates. In Kilwa
District there are several hunting blocks set aside by the Ministry of Natural Resources and Tourism
where commercial hunting activities may take place legally. The vegetation in these blocks is open
miombo woodland and grassland. However, the boundaries of these hunting blocks are not very clear
and information is not made available to the public. In both subsistence and commercial hunting fire
is used as a tool to clear the land (increase visibility) and to chase animals to a desired location to be
hunted. Both uses of fire are prohibited under law, but are nonetheless common practice. The fire is
usually left to burn its way through the forest and it has become a common scene to see fires in these
forests.
Drivers of Deforestation in Kilwa
- 17 -
3 SURVEY TO DETERMINE THE DRIVERS OF IN KILWA DISTRICT
In order to have an estimate of the contribution of the various potential drivers of forest loss to
deforestation and forest degradation in Kilwa District, a social survey was conducted in the form of an
informal discussion with focus groups in pre-selected villages. The discussions were guided by a
questionnaire focused on getting basic information from individuals who engage in activities that lead
in one way or another to deforestation and forest degradation. The focus groups were centred on
farmers, livestock keepers, timber traders and makers, charcoal makers and traders, petty traders, and
village leaders (Village government official, the Village Chairman or Village Executive Officer).
3.1 Methodology
The questionnaires were used and administered as the basis for the discussion in an informal setting
with the focus groups (groups of individuals from the selected villages) Village leaders were
interviewed separately from the groups. The groups were selected to represent a cross-section of
residents in a particular village. The groups consisted of male and female, young and elders, and other
relevant social groupings.
Farmers
Charcoal traders/makers
Timber traders and loggers
Petty traders (local shopkeepers/owners)
Village officials
Livestock keepers
3.2 Study area
The discussions with the focus group were conducted in six villages within the district. These villages
were selected from a list of 16 villages where MCDI operates and where it plans to implement the
REDD supported PFM and FSC projects. From the six villages, one village is among the six villages
where MCDI is already undertaking PFM work and the other five villages are among the 10 villages
where MCDI may choose to start the new PFM and FSC works under the REDD project.
The villages in which MCDI is new are Ngea, Mitole, Nambondo, Miteja and Mavuji. Kikole village
is the one village with established PFM (under MCDI’s tutelage, still active).
The villages were selected mainly due to their location in combination of other factors that directly
have an influence on accelerating deforestation and forest degradation. The main factors considered
were the location and accessibility. Preference was given to villages located along the major roads
passing through the district i.e. easily accessible throughout the year while those located off roads and
are not easily accessible throughout the year.
From Nangurukuru (Nangurukuru is the main crossroads settlement in Kilwa located along the Dar-
Mtwara tarmac road) Mavuji is located about 30 km south along the Kilwa-Lindi highway, Miteja is
about 60 km North along the Kilwa-Dar highway, Ngea is located about 50 km West along the Kilwa-
Liwale road. Nambondo is located inland about 45 km off Kilwa-Dar road and Mitole is also located
10 km inland off Kilwa – Liwale road.
Drivers of Deforestation in Kilwa
- 18 -
3.3 Data collection and analysis
Data/information on the identified activities in the selected villages was obtained through informal
discussions with the villagers. These activities were farming, livestock keeping, logging, charcoal
making and trading. The discussions were guided with a set of pre-prepared questions in a
questionnaire. The questions were designed to address the various activities for each focus group. In
addition to the focused questions there were also general questions addressing general issues about
forests and changes in forest condition as well as other initiatives such as migration, land acquisition
and ownership, and issues on Kilimo Kwanza initiatives.
The individuals participating in the discussions were selected by the village government based on the
main activity undertaken by the individual in the village and the availability of the person to attend the
discussions (the visit was done during the month of May and many villagers were busy in their field
either harvesting or guarding their fields against wild animals). The number of participant was limited
to five (5) from each group so as to facilitate effective discussions. The discussions were performed at
once with all the focus groups whereby specific questions were directed to the specific groups and
general questions were discussed together.
Village leaders were also interviewed for the demographic, migration (in and out) information and
background information on their respective communities.
3.4 Results and Discussions
These results from this survey are compiled from the primary information that was gathered through
the discussions with the focus groups and village leaders. Each activity was considered separately,
and the varying combinations which make up each potential driver of deforestation and forest
degradation are then added together to give the total potential of the drivers. For the purposes of this
project, causes and reasons of the villagers to undertake these activities are considered and were
discussed with the focus groups. This report hypothetically looks at the drivers and extrapolates the
future impacts posed by these activities on forests present in Kilwa District.
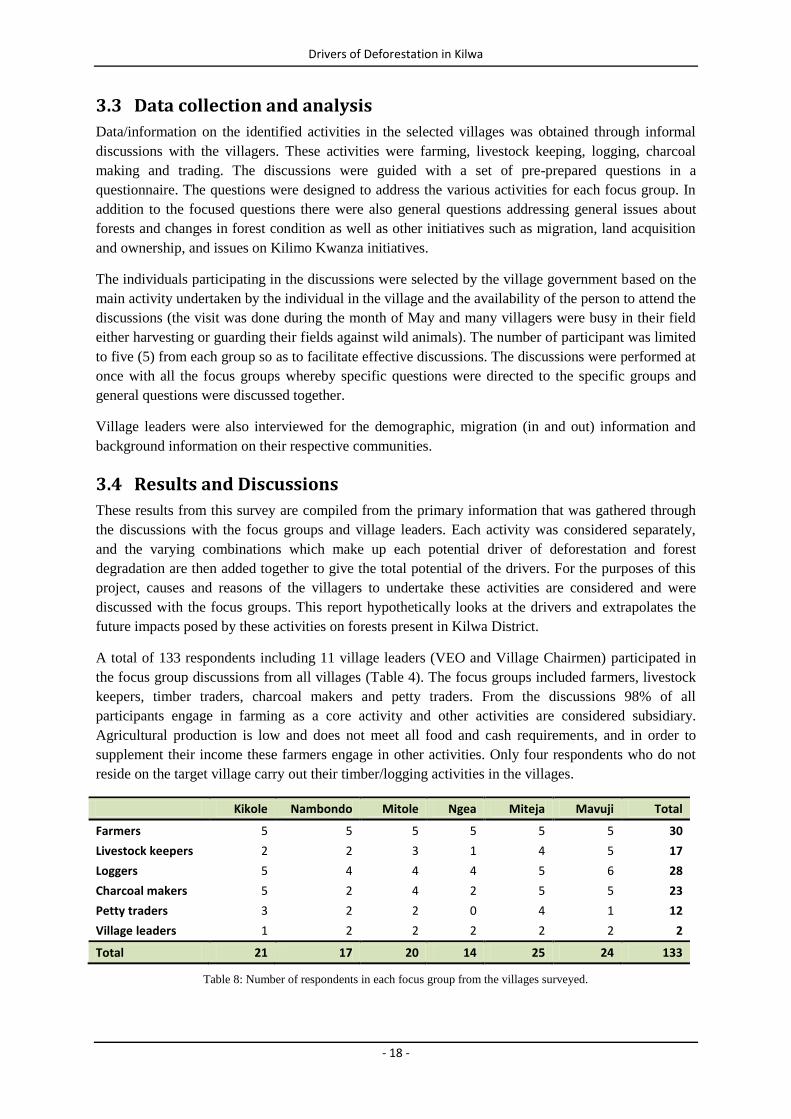
A total of 133 respondents including 11 village leaders (VEO and Village Chairmen) participated in
the focus group discussions from all villages (Table 4). The focus groups included farmers, livestock
keepers, timber traders, charcoal makers and petty traders. From the discussions 98% of all
participants engage in farming as a core activity and other activities are considered subsidiary.
Agricultural production is low and does not meet all food and cash requirements, and in order to
supplement their income these farmers engage in other activities. Only four respondents who do not
reside on the target village carry out their timber/logging activities in the villages.
Kikole Nambondo Mitole Ngea Miteja Mavuji Total
Farmers 5 5 5 5 5 5 30
Livestock keepers 2 2 3 1 4 5 17
Loggers 5 4 4 4 5 6 28
Charcoal makers 5 2 4 2 5 5 23
Petty traders 3 2 2 0 4 1 12
Village leaders 1 2 2 2 2 2 2
Total 21 17 20 14 25 24 133
Table 8: Number of respondents in each focus group from the villages surveyed.
Drivers of Deforestation in Kilwa
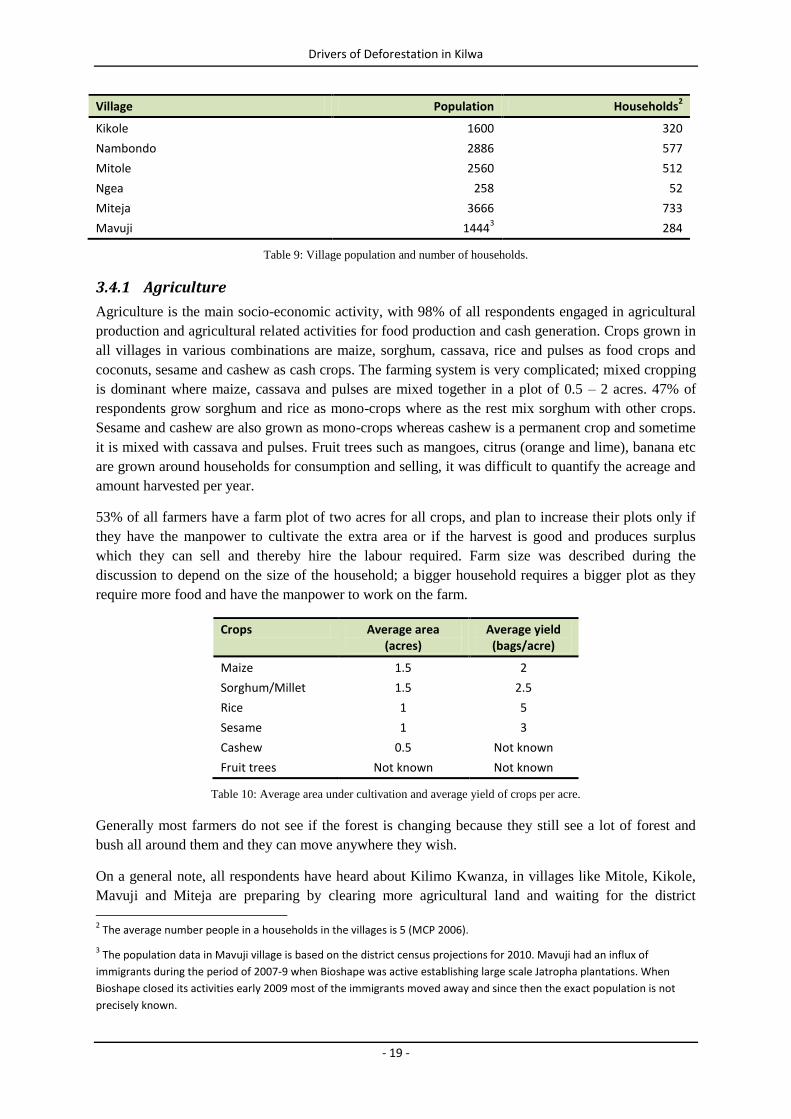
- 19 -
Village Population Households2
Kikole 1600 320
Nambondo 2886 577
Mitole 2560 512
Ngea 258 52
Miteja 3666 733
Mavuji 14443 284
Table 9: Village population and number of households.
3.4.1 Agriculture
Agriculture is the main socio-economic activity, with 98% of all respondents engaged in agricultural
production and agricultural related activities for food production and cash generation. Crops grown in
all villages in various combinations are maize, sorghum, cassava, rice and pulses as food crops and
coconuts, sesame and cashew as cash crops. The farming system is very complicated; mixed cropping
is dominant where maize, cassava and pulses are mixed together in a plot of 0.5 – 2 acres. 47% of
respondents grow sorghum and rice as mono-crops where as the rest mix sorghum with other crops.
Sesame and cashew are also grown as mono-crops whereas cashew is a permanent crop and sometime
it is mixed with cassava and pulses. Fruit trees such as mangoes, citrus (orange and lime), banana etc
are grown around households for consumption and selling, it was difficult to quantify the acreage and
amount harvested per year.
53% of all farmers have a farm plot of two acres for all crops, and plan to increase their plots only if
they have the manpower to cultivate the extra area or if the harvest is good and produces surplus
which they can sell and thereby hire the labour required. Farm size was described during the
discussion to depend on the size of the household; a bigger household requires a bigger plot as they
require more food and have the manpower to work on the farm.
Crops Average area (acres)
Average yield (bags/acre)
Maize 1.5 2
Sorghum/Millet 1.5 2.5
Rice 1 5
Sesame 1 3
Cashew 0.5 Not known
Fruit trees Not known Not known
Table 10: Average area under cultivation and average yield of crops per acre.
Generally most farmers do not see if the forest is changing because they still see a lot of forest and
bush all around them and they can move anywhere they wish.
On a general note, all respondents have heard about Kilimo Kwanza, in villages like Mitole, Kikole,
Mavuji and Miteja are preparing by clearing more agricultural land and waiting for the district
2 The average number people in a households in the villages is 5 (MCP 2006).
3 The population data in Mavuji village is based on the district census projections for 2010. Mavuji had an influx of
immigrants during the period of 2007-9 when Bioshape was active establishing large scale Jatropha plantations. When
Bioshape closed its activities early 2009 most of the immigrants moved away and since then the exact population is not
precisely known.
Drivers of Deforestation in Kilwa
- 20 -
agricultural office to provide them with power tillers to work their farms. However, the idea and the
pillars of Kilimo Kwanza are not well understood in all villages.
3.4.2 Shifting Agriculture
Shifting agriculture is common and practiced for all annual crops grown in the study area. 83% of all
respondents admitted to have shifted their plots at least once during the last five years. The most cited
reasons for shifting their plots are; invasion of weeds and evading wild animals. Emergence of tall
grasses was associated with loss of fertility and this perception changed during the discussions.
Farmers in the study area undertake minimal tillage and rely heavily on fire for clearing farm lands
before making random holes on the ground to plant seeds. Farmers in the study area described
ploughing and weeding as too difficult tasks and they consume a lot of time and instead they opt to
move to a new location when there is too much grass growing. This is explained by the fact that,
agriculture in the district is done using simple and primitive tools such as machete and hand hoes.
Mechanization to till land is seen as a privileged technology restricted to well-off farmers, while
animal ploughs were non-existent until late 2006 when agro-pastoralists moved into the district. The
use of tractors is also very limited and the few tractors present in the district are used as a means of
transport rather than in mechanised farming. 17% of farmers have not shifted their plots in the last
five years because they have permanent crops in their fields, mainly cashew, or have shifted their
homesteads in their farms.
Trees felled during land clearing and other vegetation are burned in order to remove them from the
field; big trees that cannot be burned at once are burned slowly during the season. A small number of
the trees are converted into timber and depending on the location of the plot some of the trees are used
to make charcoal (trees from easily accessible plots in Mavuji, Miteja and Ngea are used for
charcoal). 2% of all farmers admitted to have used the trees felled during land clearing for charcoal
sometime during the past 5 years.
Village Population Households Shifted Area (Ha)4
Kikole 1600 320 221.33
Nambondo 2886 577 399.23
Mitole 2560 512 354.13
Ngea 258 52 35.69
Miteja 3666 733 507.13
Mavuji 1444 289 199.75
Total 12414 2483 1717.27
Table 11: Projected area under shifting cultivation in the villages surveyed.
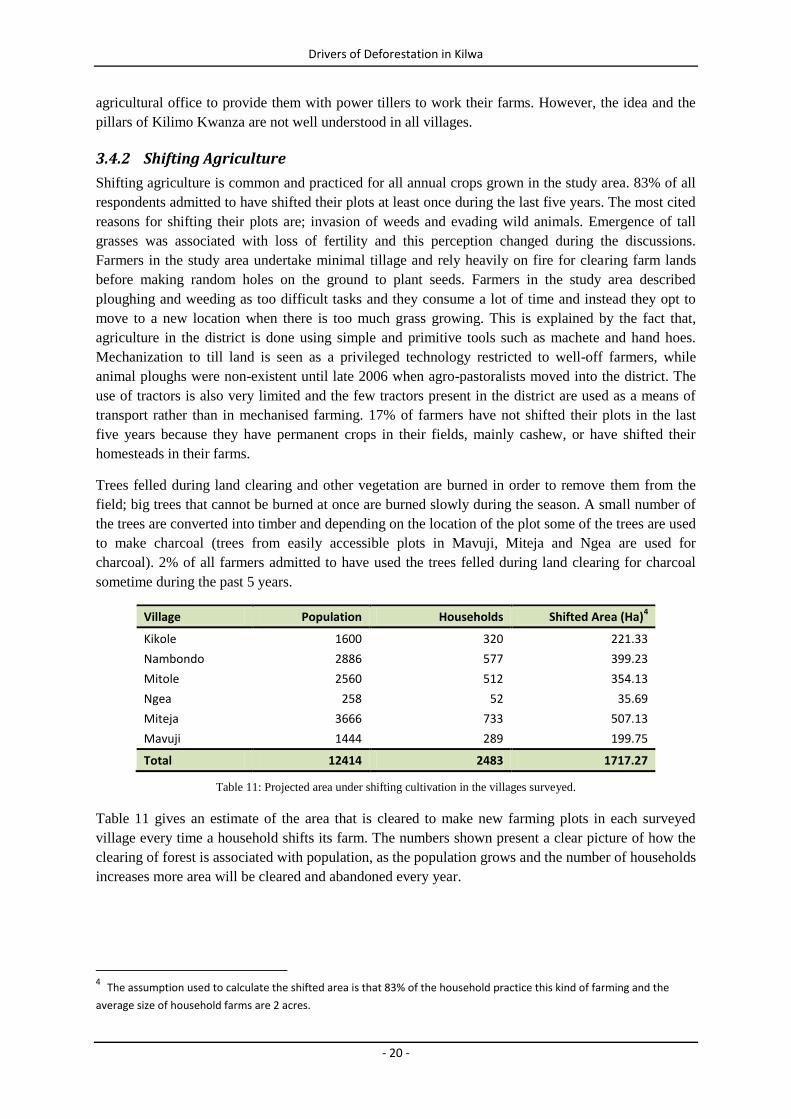
Table 11 gives an estimate of the area that is cleared to make new farming plots in each surveyed
village every time a household shifts its farm. The numbers shown present a clear picture of how the
clearing of forest is associated with population, as the population grows and the number of households
increases more area will be cleared and abandoned every year.
4 The assumption used to calculate the shifted area is that 83% of the household practice this kind of farming and the
average size of household farms are 2 acres.
Drivers of Deforestation in Kilwa
- 21 -
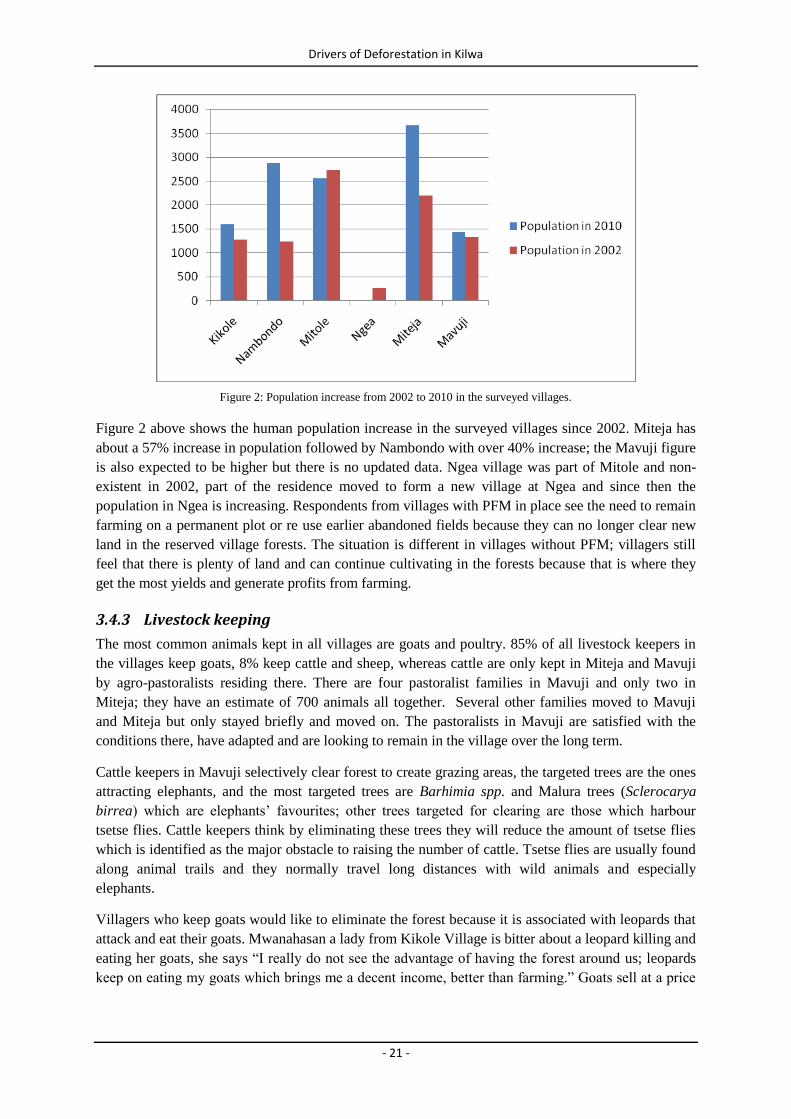
Figure 2: Population increase from 2002 to 2010 in the surveyed villages.
Figure 2 above shows the human population increase in the surveyed villages since 2002. Miteja has
about a 57% increase in population followed by Nambondo with over 40% increase; the Mavuji figure
is also expected to be higher but there is no updated data. Ngea village was part of Mitole and non-
existent in 2002, part of the residence moved to form a new village at Ngea and since then the
population in Ngea is increasing. Respondents from villages with PFM in place see the need to remain
farming on a permanent plot or re use earlier abandoned fields because they can no longer clear new
land in the reserved village forests. The situation is different in villages without PFM; villagers still
feel that there is plenty of land and can continue cultivating in the forests because that is where they
get the most yields and generate profits from farming.
3.4.3 Livestock keeping
The most common animals kept in all villages are goats and poultry. 85% of all livestock keepers in
the villages keep goats, 8% keep cattle and sheep, whereas cattle are only kept in Miteja and Mavuji
by agro-pastoralists residing there. There are four pastoralist families in Mavuji and only two in
Miteja; they have an estimate of 700 animals all together. Several other families moved to Mavuji
and Miteja but only stayed briefly and moved on. The pastoralists in Mavuji are satisfied with the
conditions there, have adapted and are looking to remain in the village over the long term.
Cattle keepers in Mavuji selectively clear forest to create grazing areas, the targeted trees are the ones
attracting elephants, and the most targeted trees are Barhimia spp. and Malura trees (Sclerocarya
birrea) which are elephants’ favourites; other trees targeted for clearing are those which harbour
tsetse flies. Cattle keepers think by eliminating these trees they will reduce the amount of tsetse flies
which is identified as the major obstacle to raising the number of cattle. Tsetse flies are usually found
along animal trails and they normally travel long distances with wild animals and especially
elephants.
Villagers who keep goats would like to eliminate the forest because it is associated with leopards that
attack and eat their goats. Mwanahasan a lady from Kikole Village is bitter about a leopard killing and
eating her goats, she says “I really do not see the advantage of having the forest around us; leopards
keep on eating my goats which brings me a decent income, better than farming.” Goats sell at a price
Drivers of Deforestation in Kilwa
- 22 -
of between TSh 30,000/- and 40,000/-. The feeling is similar among other goat keepers in these
villages.
On the general condition of the forest, livestock keepers view the forest as not changing, and that
there is plenty of grass and area for animal to graze. Only cattle keepers think there is a change in the
forest especially during the dry season where they are forced to travel long distances in search of
green pastures.
3.4.4 Charcoal making and fuel wood collection
Charcoal making and trading in the villages is a new venture and so far it is considered a subsidiary
activity to the main livelihoods of farming. 96% of all respondents engaging in charcoal business have
started their activities within the last five years and produce less than 100 bags per year. Respondents
from Miteja and Mavuji say the business is flourishing and are looking forward to expanding their
business. Trees for making charcoal are readily available and it is not a problem to get them, market
access is easy for villages along the main roads, they sell their charcoal within the village and along
the roads to customers from outside the village. Charcoal makers from Miteja get orders from dealers
from as far as Ikwiriri and business in Mavuji flourished during Bioshape’s Jatropha farming
activities because it was easy to transport charcoal to Nangurukuru and Kilwa Masoko, whereas for
villages located inland charcoal markets consist entirely of teachers and nurses working in the village
from outside (they prefer using charcoal as opposed to firewood).
Charcoal kilns are traditional and are made near or next to the trees felled or near a cleared farm plot.
Earth mound kilns have low efficiency in the range of 11–30% (Van Beukering et al. 2007). There is
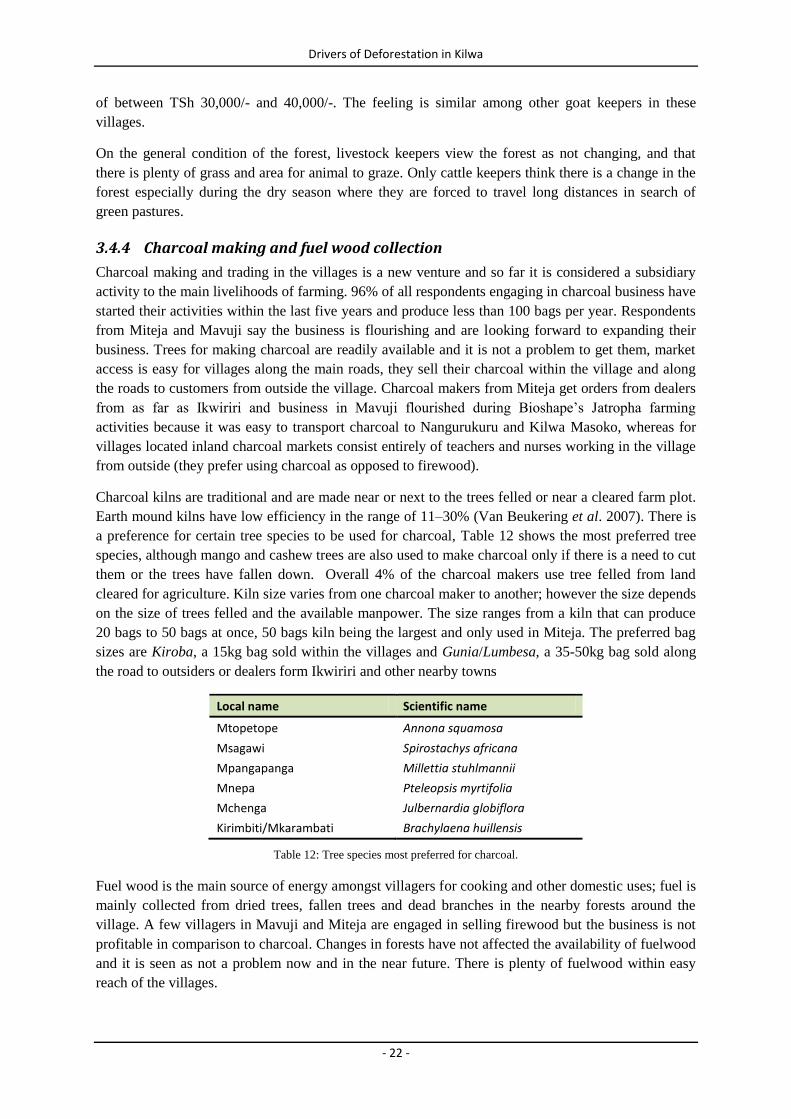
a preference for certain tree species to be used for charcoal, Table 12 shows the most preferred tree
species, although mango and cashew trees are also used to make charcoal only if there is a need to cut
them or the trees have fallen down. Overall 4% of the charcoal makers use tree felled from land
cleared for agriculture. Kiln size varies from one charcoal maker to another; however the size depends
on the size of trees felled and the available manpower. The size ranges from a kiln that can produce
20 bags to 50 bags at once, 50 bags kiln being the largest and only used in Miteja. The preferred bag
sizes are Kiroba, a 15kg bag sold within the villages and Gunia/Lumbesa, a 35-50kg bag sold along
the road to outsiders or dealers form Ikwiriri and other nearby towns
Local name Scientific name
Mtopetope Annona squamosa
Msagawi Spirostachys africana
Mpangapanga Millettia stuhlmannii
Mnepa Pteleopsis myrtifolia
Mchenga Julbernardia globiflora
Kirimbiti/Mkarambati Brachylaena huillensis
Table 12: Tree species most preferred for charcoal.
Fuel wood is the main source of energy amongst villagers for cooking and other domestic uses; fuel is
mainly collected from dried trees, fallen trees and dead branches in the nearby forests around the
village. A few villagers in Mavuji and Miteja are engaged in selling firewood but the business is not
profitable in comparison to charcoal. Changes in forests have not affected the availability of fuelwood
and it is seen as not a problem now and in the near future. There is plenty of fuelwood within easy
reach of the villages.
Drivers of Deforestation in Kilwa
- 23 -
3.4.5 Logging and Timber trade
There are two distinct groups of people who are involved in the logging and timber trade. One is the
loggers’ group and the other is the retailers group (the business men). Others involved are the middle
men and transporters. 100% of all loggers encountered during the survey reside in the villages and are
members of the local community. 99% of all retailers are people from outside the villages, conducting
their own businesses or representing big companies dealing in the timber trade. The arrangement is
that a single businessman pays 10–20 loggers (or more depending on how many pieces he wants) and
provides the saws and advance payment through his middleman. The loggers prepare the logs or
timber using pitsaw which is the commonly used method, and when the logs are ready the
businessman, through the middleman, arranges for transport and shipment of the timber/logs from the
forest or collection point. There was no logger who is engaged in logging throughout the year; for all,
the logging season starts after the rains and when the main farming activities5 are over.
90% of the timber collected by these businessmen is transported by road or shipped from Kivinje port
to markets outside Kilwa District; the major markets described are Dar es Salaam, Zanzibar, Arusha
and Mafia Island. The rest is sold to retailers in Kilwa Masoko. In order to make profit, timber traders
said they have to collect and ship over 2000 pieces of timber per each shipment.
Timber used within the villages is obtained by contacting the local loggers residing in the village. The
loggers can get an individual order of about 50 pieces of timber per year from the village, but if
contracted by an outside businessman he can make up to 1500 pieces per season.
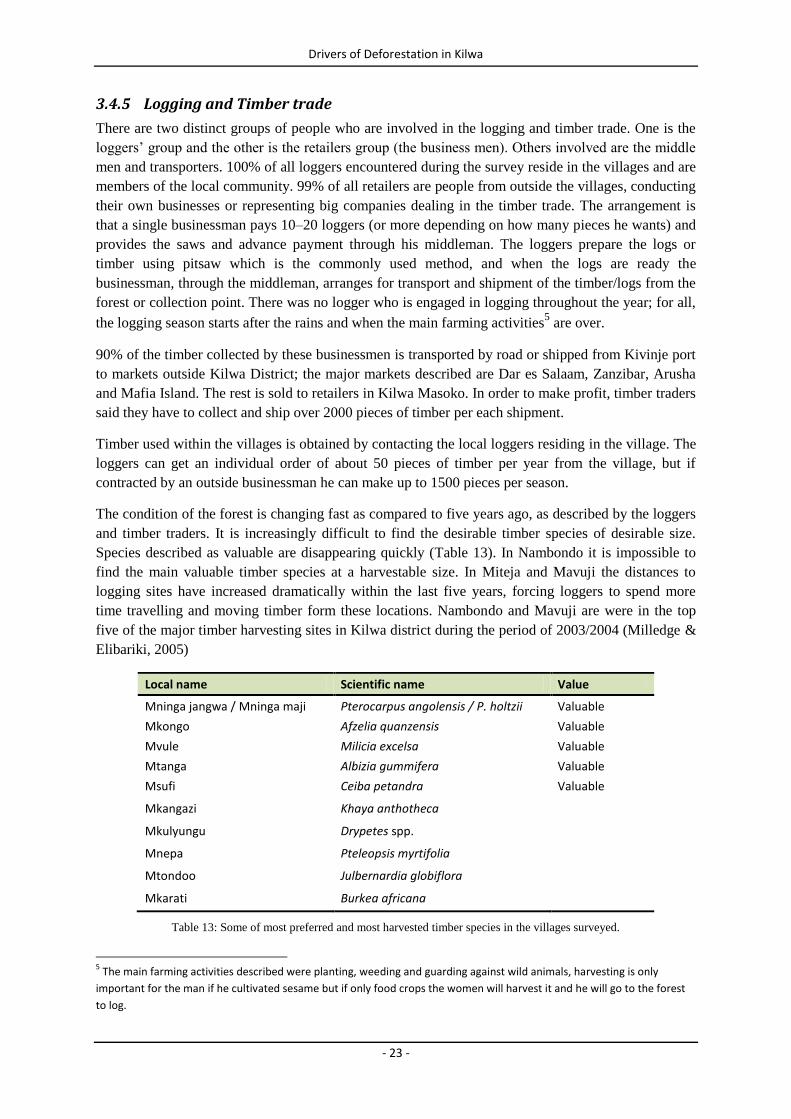
The condition of the forest is changing fast as compared to five years ago, as described by the loggers
and timber traders. It is increasingly difficult to find the desirable timber species of desirable size.
Species described as valuable are disappearing quickly (Table 13). In Nambondo it is impossible to
find the main valuable timber species at a harvestable size. In Miteja and Mavuji the distances to
logging sites have increased dramatically within the last five years, forcing loggers to spend more
time travelling and moving timber form these locations. Nambondo and Mavuji are were in the top
five of the major timber harvesting sites in Kilwa district during the period of 2003/2004 (Milledge &
Elibariki, 2005)
Local name Scientific name Value
Mninga jangwa / Mninga maji Pterocarpus angolensis / P. holtzii Valuable
Mkongo Afzelia quanzensis Valuable
Mvule Milicia excelsa Valuable
Mtanga Albizia gummifera Valuable
Msufi Ceiba petandra Valuable
Mkangazi Khaya anthotheca
Mkulyungu Drypetes spp.
Mnepa Pteleopsis myrtifolia
Mtondoo Julbernardia globiflora
Mkarati Burkea africana
Table 13: Some of most preferred and most harvested timber species in the villages surveyed.
5 The main farming activities described were planting, weeding and guarding against wild animals, harvesting is only
important for the man if he cultivated sesame but if only food crops the women will harvest it and he will go to the forest
to log.
Drivers of Deforestation in Kilwa
- 24 -
3.4.6 Wild animals and fire
The impact of wild animals on forest is through grazing and felling of trees. However, the most
indirect effect is when humans use fire against wild animals, this is when human use fire to hunt them,
or to protect farms and properties.
From the discussions, all focus groups confessed to using fire at one point in order to facilitate their
activities. It was even agreed that fire is a very useful and important tool to the farmers, loggers,
livestock keepers, hunters and even the charcoal makers in conducting their day to day activities
associated with the forest.
Farmers use fire to clear the land and burn all the trees and branches felled in newly cleared land or
preparing land before cultivation and planting. Loggers use fire to clear the logging sites and improve
access to difficult areas. Livestock keepers use fire to remove old and dry grasses and encourage
growth of new grasses for their cattle and to chase away tsetse flies. Hunters use the fire to chase
animals and improve visibility and mobility and charcoal makers use the fire for their kilns. The
intention of using fire is always well and good, it is used to facilitate basic daily livelihood activity.
The main problem is the management of the fire; when not enough precautions are taken before the
fire is started in most cases the fire gets out of hand and becomes uncontrollable and unmanageable.
When fire becomes uncontrollable it is left to burn and find its own way. The trend is similar year
after year. It was revealed that most of the fires are started intentionally by people.
Fire incidents in the area are very common and taken as normal and sometime regarded as God’s will.
In most cases lack of concern on fire’s impacts on the environment and properties leads to villagers
ignoring basic precautions before starting the fires. If this behaviour is left to continue fire incidences
will never cease.
Drivers of Deforestation in Kilwa
- 25 -
4 QUANTIFYING DRIVERS OF DEFORESTATION IN KILWA DISTRICT
This section uses the above overviews and survey information to attempt a basic quantification of the
drivers of deforestation in Kilwa District, which can be used to inform the design of REDD efforts in
the target villages and district in general. The four main drivers of deforestation in Kilwa District-
agriculture, charcoal production, timber harvesting, and fire- are examined, with quantified estimates
of their total contribution to forest carbon loss in Kilwa presented.
Data deficiency was a particular challenge with this exercise. Data were available on some but not all
variables that were required for this quantification. This quantification therefore relies strongly on
expert estimates. Such reliance introduces a major element of uncertainty, and hence to manage this
uncertainty, minimum and maximum likely estimates were made to provide a range around the best
guess on each variable.
Computing a final estimate of forest carbon losses involves multiplying several such estimated
variables together. When these minima and maxima are combined in this way this leads to very wide
ranges on the product. This can be contained to an extent by converting to the Log Normal
distribution (assuming variables are distributed roughly normally in the first place), using standard
statistical techniques for summing the variances, and then converting the product back from Log
Normal. Thus the minimum and maximum values of the final estimates are not direct products of the
minima and maxima of their dependent variables. Even after this statistical treatment, rather wide
ranges result, which illustrate just how little we know in each case as to actual carbon losses.
4.1 Agriculture
Factor Min Estimate Max Unit
Population 139,211 154,679 170,147 people
Household Size 5.5 5.0 4.5
HH Size Multiplier 0.2 0.2 0.2
Cultivated Land per Household 0.75 1.00 1.25 ha
Area Cultivated 23,098 30,936 41,434 ha
Rate of Expansion 4% 5% 6%
Area Cleared for Expansion 1,056 1,556 2,294 ha
Carbon Content in Cleared Forest 10 20 30 tC / ha
Carbon lost during Expansion 15,887 31,127 60,985 tC / year
Proportion Shifting Agriculture 50% 67% 80%
Cultivation Period 4.5 3.5 2.5 years
Fallow Period 15 12 9 years
Rotation Multiplier 0.0513 0.0645 0.0870
Area Cleared for Rotation 845 1,337 2,115 ha
Carbon Content in Fallows 5 10 15 tC / ha
Carbon lost in Fallows 4,227 13,372 31,729 ha
Total Carbon Lost 20,114 44,499 92,715 tC / year
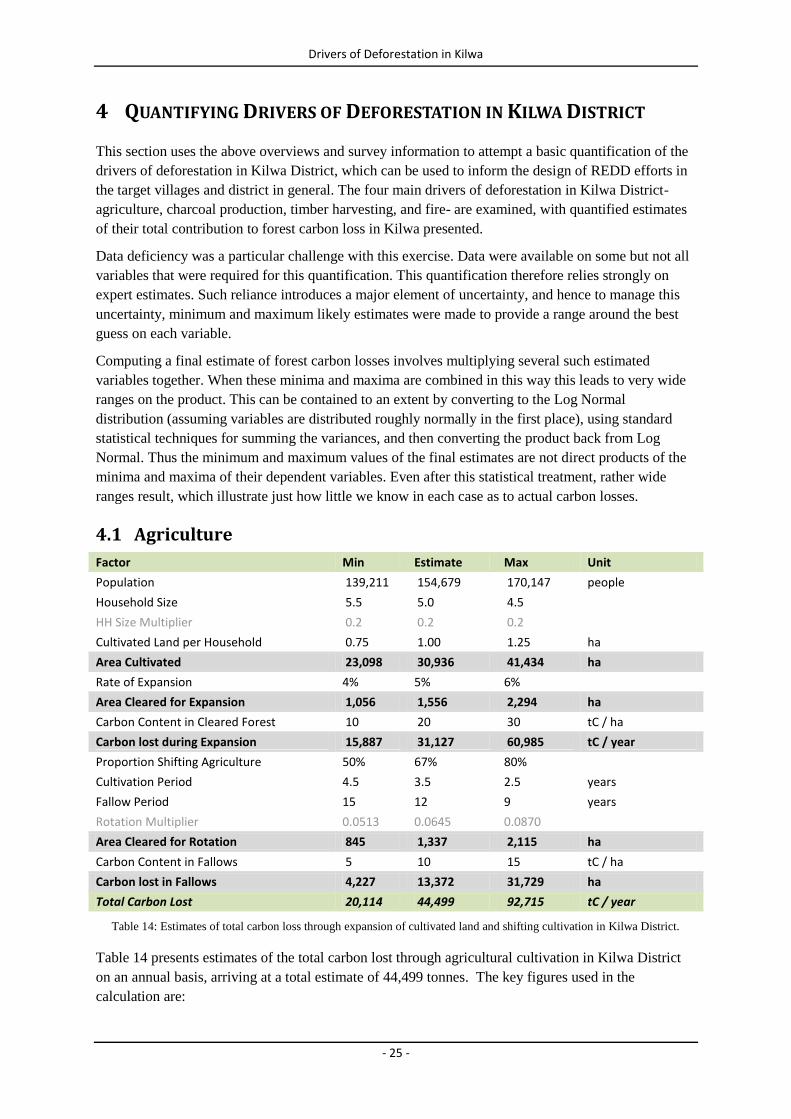
Table 14: Estimates of total carbon loss through expansion of cultivated land and shifting cultivation in Kilwa District.
Table 14 presents estimates of the total carbon lost through agricultural cultivation in Kilwa District
on an annual basis, arriving at a total estimate of 44,499 tonnes. The key figures used in the
calculation are:
Drivers of Deforestation in Kilwa
- 26 -
30,936 households in a population of 154,679 people, based on an average household size of
5 people, and one cultivated hectare per household, giving a total cultivated area of 30,936 ha.
An annual rate of expansion of 5%, for an annual loss of 1,556 to cultivation, and 31,127
tonnes of carbon lost from this area.
1,337 ha of fallow land cleared annually, with a total carbon loss of 13,372 tonnes from these
rotational agricultural practices.
4.2 Charcoal
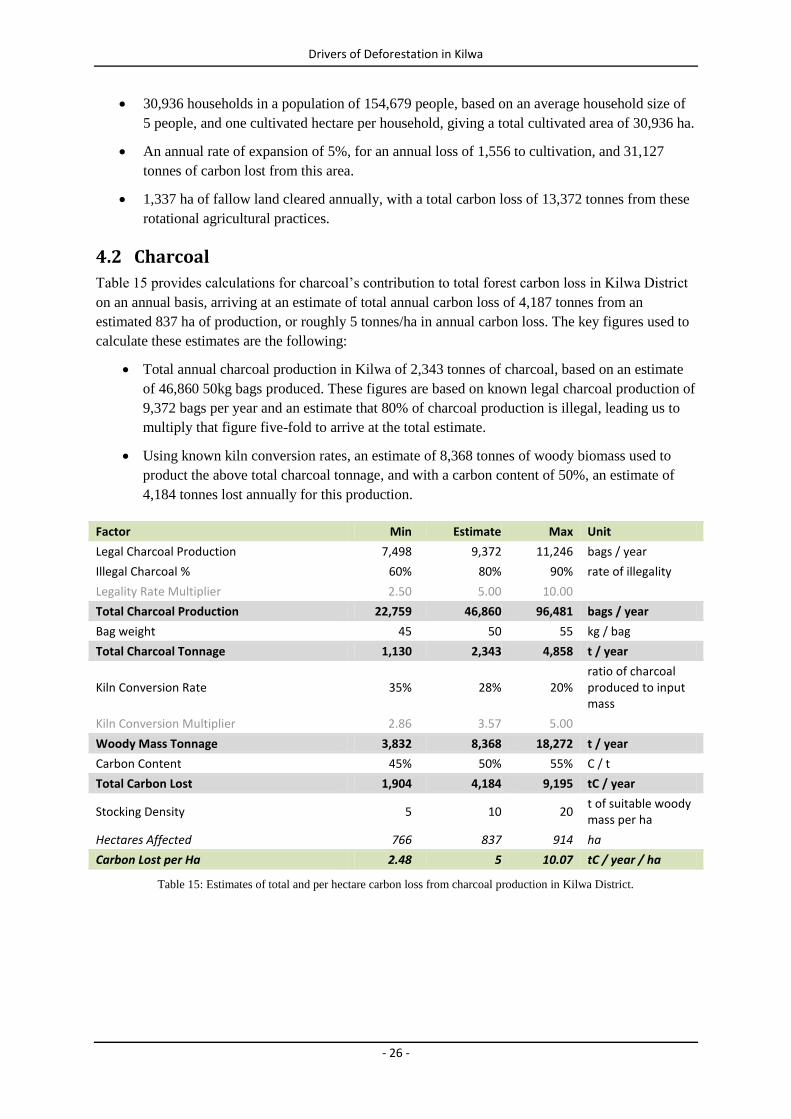
Table 15 provides calculations for charcoal’s contribution to total forest carbon loss in Kilwa District
on an annual basis, arriving at an estimate of total annual carbon loss of 4,187 tonnes from an
estimated 837 ha of production, or roughly 5 tonnes/ha in annual carbon loss. The key figures used to
calculate these estimates are the following:
Total annual charcoal production in Kilwa of 2,343 tonnes of charcoal, based on an estimate
of 46,860 50kg bags produced. These figures are based on known legal charcoal production of
9,372 bags per year and an estimate that 80% of charcoal production is illegal, leading us to
multiply that figure five-fold to arrive at the total estimate.
Using known kiln conversion rates, an estimate of 8,368 tonnes of woody biomass used to
product the above total charcoal tonnage, and with a carbon content of 50%, an estimate of
4,184 tonnes lost annually for this production.
Factor Min Estimate Max Unit
Legal Charcoal Production 7,498 9,372 11,246 bags / year
Illegal Charcoal % 60% 80% 90% rate of illegality
Legality Rate Multiplier 2.50 5.00 10.00
Total Charcoal Production 22,759 46,860 96,481 bags / year
Bag weight 45 50 55 kg / bag
Total Charcoal Tonnage 1,130 2,343 4,858 t / year
Kiln Conversion Rate 35% 28% 20% ratio of charcoal produced to input mass
Kiln Conversion Multiplier 2.86 3.57 5.00
Woody Mass Tonnage 3,832 8,368 18,272 t / year
Carbon Content 45% 50% 55% C / t
Total Carbon Lost 1,904 4,184 9,195 tC / year
Stocking Density 5 10 20 t of suitable woody mass per ha
Hectares Affected 766 837 914 ha
Carbon Lost per Ha 2.48 5 10.07 tC / year / ha
Table 15: Estimates of total and per hectare carbon loss from charcoal production in Kilwa District.
Drivers of Deforestation in Kilwa
- 27 -
4.3 Timber Harvesting
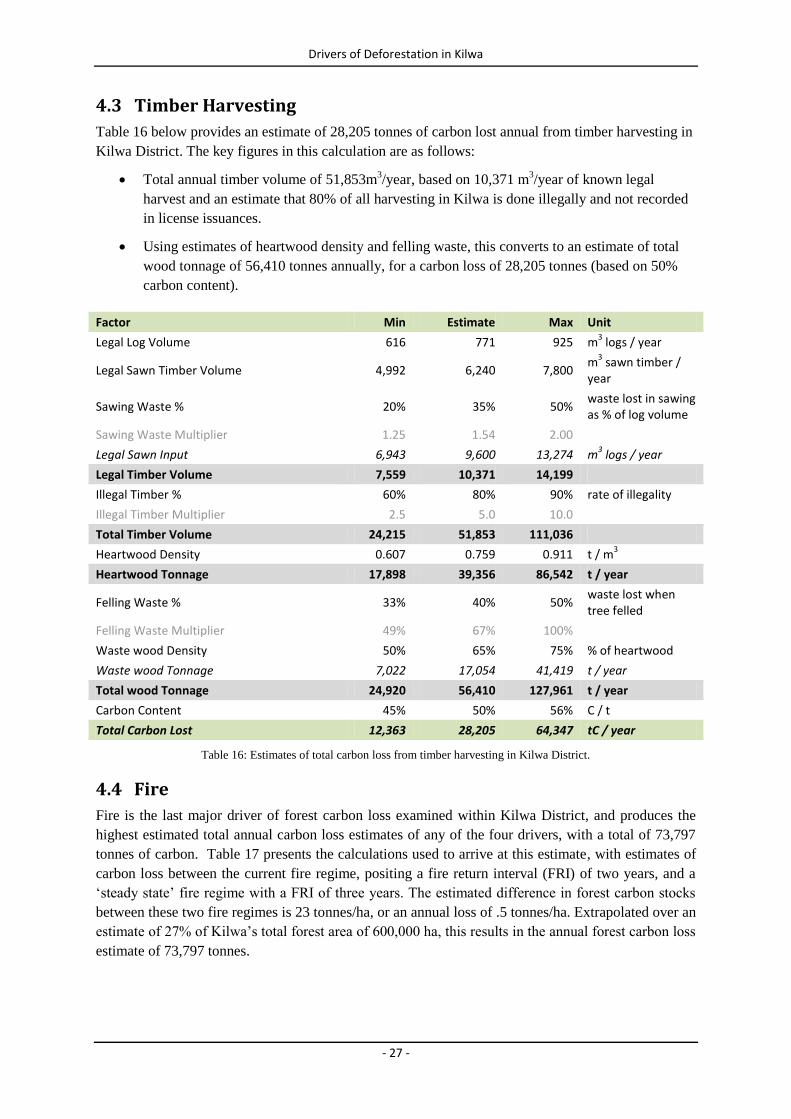
Table 16 below provides an estimate of 28,205 tonnes of carbon lost annual from timber harvesting in
Kilwa District. The key figures in this calculation are as follows:
Total annual timber volume of 51,853m3/year, based on 10,371 m
3/year of known legal
harvest and an estimate that 80% of all harvesting in Kilwa is done illegally and not recorded
in license issuances.
Using estimates of heartwood density and felling waste, this converts to an estimate of total
wood tonnage of 56,410 tonnes annually, for a carbon loss of 28,205 tonnes (based on 50%
carbon content).
Factor Min Estimate Max Unit
Legal Log Volume 616 771 925 m3 logs / year
Legal Sawn Timber Volume 4,992 6,240 7,800 m
3 sawn timber /
year
Sawing Waste % 20% 35% 50% waste lost in sawing as % of log volume
Sawing Waste Multiplier 1.25 1.54 2.00
Legal Sawn Input 6,943 9,600 13,274 m3 logs / year
Legal Timber Volume 7,559 10,371 14,199
Illegal Timber % 60% 80% 90% rate of illegality
Illegal Timber Multiplier 2.5 5.0 10.0
Total Timber Volume 24,215 51,853 111,036
Heartwood Density 0.607 0.759 0.911 t / m3
Heartwood Tonnage 17,898 39,356 86,542 t / year
Felling Waste % 33% 40% 50% waste lost when tree felled
Felling Waste Multiplier 49% 67% 100%
Waste wood Density 50% 65% 75% % of heartwood
Waste wood Tonnage 7,022 17,054 41,419 t / year
Total wood Tonnage 24,920 56,410 127,961 t / year
Carbon Content 45% 50% 56% C / t
Total Carbon Lost 12,363 28,205 64,347 tC / year
Table 16: Estimates of total carbon loss from timber harvesting in Kilwa District.
4.4 Fire
Fire is the last major driver of forest carbon loss examined within Kilwa District, and produces the
highest estimated total annual carbon loss estimates of any of the four drivers, with a total of 73,797
tonnes of carbon. Table 17 presents the calculations used to arrive at this estimate, with estimates of
carbon loss between the current fire regime, positing a fire return interval (FRI) of two years, and a
‘steady state’ fire regime with a FRI of three years. The estimated difference in forest carbon stocks
between these two fire regimes is 23 tonnes/ha, or an annual loss of .5 tonnes/ha. Extrapolated over an
estimate of 27% of Kilwa’s total forest area of 600,000 ha, this results in the annual forest carbon loss
estimate of 73,797 tonnes.
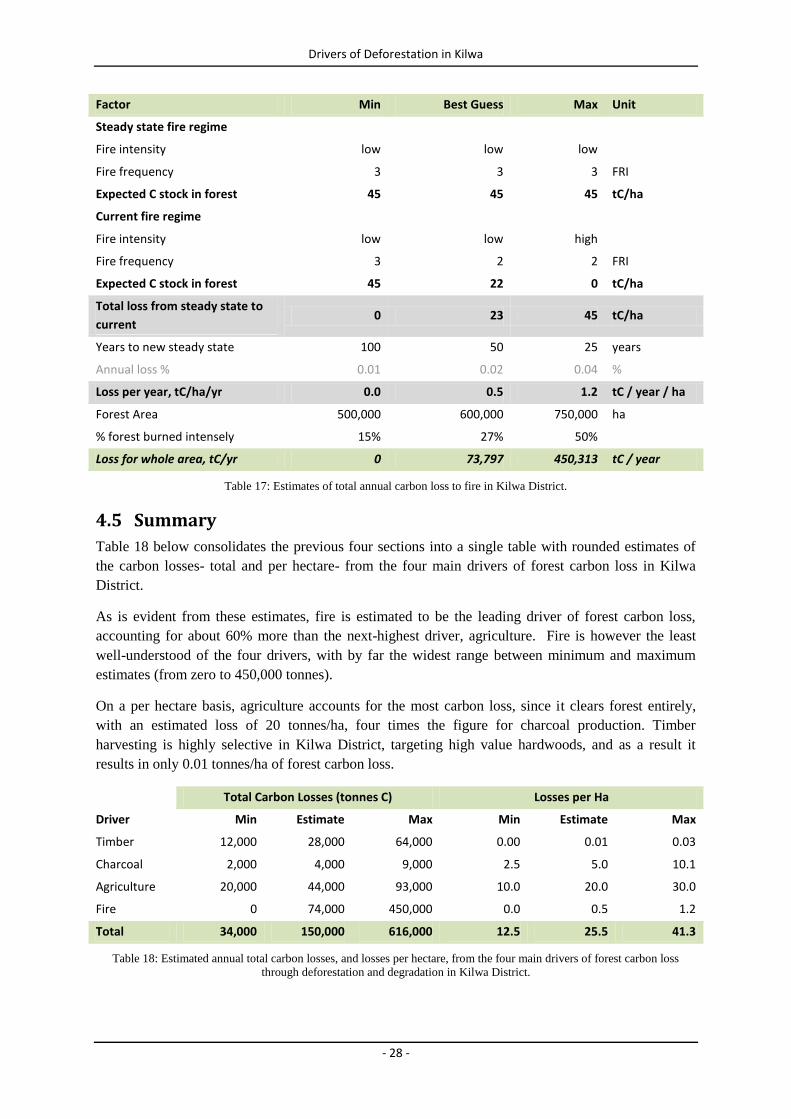
Drivers of Deforestation in Kilwa
- 28 -
Factor Min Best Guess Max Unit
Steady state fire regime
Fire intensity low low low
Fire frequency 3 3 3 FRI
Expected C stock in forest 45 45 45 tC/ha
Current fire regime
Fire intensity low low high
Fire frequency 3 2 2 FRI
Expected C stock in forest 45 22 0 tC/ha
Total loss from steady state to
current 0 23 45 tC/ha
Years to new steady state 100 50 25 years
Annual loss % 0.01 0.02 0.04 %
Loss per year, tC/ha/yr 0.0 0.5 1.2 tC / year / ha
Forest Area 500,000 600,000 750,000 ha
% forest burned intensely 15% 27% 50%
Loss for whole area, tC/yr 0 73,797 450,313 tC / year
Table 17: Estimates of total annual carbon loss to fire in Kilwa District.
4.5 Summary
Table 18 below consolidates the previous four sections into a single table with rounded estimates of
the carbon losses- total and per hectare- from the four main drivers of forest carbon loss in Kilwa
District.
As is evident from these estimates, fire is estimated to be the leading driver of forest carbon loss,
accounting for about 60% more than the next-highest driver, agriculture. Fire is however the least
well-understood of the four drivers, with by far the widest range between minimum and maximum
estimates (from zero to 450,000 tonnes).
On a per hectare basis, agriculture accounts for the most carbon loss, since it clears forest entirely,
with an estimated loss of 20 tonnes/ha, four times the figure for charcoal production. Timber
harvesting is highly selective in Kilwa District, targeting high value hardwoods, and as a result it
results in only 0.01 tonnes/ha of forest carbon loss.
Driver
Total Carbon Losses (tonnes C) Losses per Ha
Min Estimate Max Min Estimate Max
Timber 12,000 28,000 64,000 0.00 0.01 0.03
Charcoal 2,000 4,000 9,000 2.5 5.0 10.1
Agriculture 20,000 44,000 93,000 10.0 20.0 30.0
Fire 0 74,000 450,000 0.0 0.5 1.2
Total 34,000 150,000 616,000 12.5 25.5 41.3
Table 18: Estimated annual total carbon losses, and losses per hectare, from the four main drivers of forest carbon loss
through deforestation and degradation in Kilwa District.
Drivers of Deforestation in Kilwa
- 29 -
4.6 Anticipated Losses in Community Forests
The above exercise estimated the total forest carbon losses across the whole of Kilwa District (c.
13,000km2). The quantification exercise was undertaken at this scale since it was the only one for
which any reliable data were available.
However, the aim of MCDI’s REDD pilot project is to cover transaction costs of expanding its
successful PFM plus FSC certification scheme. The forest areas typically suggested by communities
for inclusion tend to be fairly remote. This is sensible since communities will benefit principally from
the sale of sustainably logged timber; more accessible forests will have been mostly logged out
already.
In time, if proven timber sales rise sharply, communities may be tempted to constrain their agriculture
in the interests of maximising forest revenue. For the present, however, MCDI’s pitch to communities
is based around a fairly simple proposition; that they should simply profit from those areas they intend
to keep forested, rather than ceding potentially good agricultural land for forest conservation. The low
population densities in rural Kilwa make this an entirely feasible approach; with large areas of forest
on relatively dry lands not currently targeted for farming.
However, this approach rules out two of the major drivers of deforestation: shifting cultivation and
agricultural extensification will primarily take place only on land zoned for those purposes under
participatorily derived Village Land Use Plans, while charcoal production is mostly confined to the
most accessible forests in order to minimise costs of bringing to market6.
That leaves only one driver of deforestation with significant losses per hectare: fire. MCDI will
therefore need to construct their REDD project principally around minimising carbon losses from
uncontrolled bush fires if they are going to generate sufficient revenue from sales of carbon offsets.
6 There is an element to which charcoal production, which is mostly quasi-legal at best, takes place a little distance from
roads and tracks so as to conceal the process from law enforcement officials, but this requires charcoal producers to go
only a little distance into the forest, and not nearly as far as the more remote areas typically proposed by communities to
go into their respective Village Land Forest Reserves.
Drivers of Deforestation in Kilwa
- 30 -
5 CONCLUSIONS & RECOMMENDATIONS
5.1 Conclusions
In conclusion the forest in Kilwa District face a range of human-induced threats that lead to varying
levels of deforestation and forest degradation. Despite the shortage of available data and limited time
to conduct this study, the findings give a clear view of the threats threatening forests in the district.
The main threats come from human population increase and resultant increases in demand for
agricultural land, improved infrastructure and accessibility to the district and forests, and the external
stimulation of socio-economic development. Forest degradation in the district is widespread, caused
mostly by shifting agriculture, logging and fires. Efforts need to be taken to combat shifting farming
practices and illegal logging and activities that lead to the spread of fires on an annual or even more
frequent basis.
For many years the district has been isolated due to poor infrastructure and inaccessibility, which has
been a factor in the existing high level of forest cover. More recent efforts to open up the district and
make it accessible have resulted in an influx of exploitation of natural resources. The over-
exploitation of natural resources such as timber and charcoal is shifting southward from Dar es
Salaam as the district gets more and more accessible. Lessons should be learned from these trends and
the district and the government need to prepare to address these issues by involving the communities
and building on the National programmes of Participatory Forest Management to combat
deforestation and forest degradation problems.
5.2 Commoditising Carbon Losses
The carbon markets will only pay for avoided deforestation (and avoided forest degradation) that
addresses current carbon losses. In contrast the principle conservation argument for protecting the
forests of Kilwa now is that in a decade or so charcoal production can be expected to increase
exponentially in line with the predictions of Ahrends et al. (2010). However, if one were to wait until
2020 or later to implement a REDD project in Kilwa it would face a huge challenge in taking upon a
well-established economic force with proven returns to individuals engaging in the charcoal trade.
Conversely, the lack of strong market demand for charcoal in Kilwa currently creates the space in
which to experiment with community forestry initiatives to determine what configuration will deliver
the maximum benefits to participating communities. MCDI’s pitch to communities asks them to set
aside forested land they have no other purpose for, i.e. their opportunity costs are almost zero.
Communities can easily afford to be generous, and MCDI has noted communities increasing
confidence in PFM as evidenced in the ever larger areas of forest they are proposing to set aside as
VLFRs.
These arguments are contradictory. REDD makes most sense – i.e. will generate the most revenue for
forest owners – where current levels of deforestation are high, but high levels of deforestation suggest
strong economic forces and thus a higher probability of project failure. Potential no doubt exists in
Kilwa for a REDD project that focused on constraining agricultural extensification and shifting
cultivation. However, it would need to deliver a strong, reliable revenue stream (currently doubtful in
view of recent slow progress in UNFCCC negotiations) in order to compensate communities for the
considerable opportunity costs they would incur. In a district that remains heavily forested it may also
meet considerable local opposition on the basis that there needs to be a balance between forestry and
other land uses.
Drivers of Deforestation in Kilwa
- 31 -
Thus we conclude that an initial focus on fire management in remoter forests is a sensible strategy to
introduce REDD to Kilwa. In time a broader range of project approaches may be applicable.
Drivers of Deforestation in Kilwa
- 32 -
6 REFERENCES
Ahrends A, Burgess ND, Milledge SAH, Bulling MT, Fisher B, Smart JCR, Clarke GP, Mhoro BE &
Lewis SL (2010) Predictable waves of sequential forest degradation and biodiversity loss spreading
from an African city. PNAS 107(33): 14556-14561.
Backeus I, Borge P, Stromquist L & Ruffo C (2006) Tree Communities and structural dynamics in
Miombo (Brachystegia-Julbernardia) Woodland, Tanzania. Forest Ecology and Management 230:
171–178
Burgess ND, Clarke GP & Rodgers WA (1998) Coastal Forests of Eastern Africa: Status, Endemism
patterns and their potential causes. Biological Journal of the Linnaean Society 64 (3): 337-367.
Chidumayo EN (1997) Miombo Ecology and Management – An Introduction. Stockholm
Environment Institute, Stockholm, Sweden.
DADPS (2009) Kilwa Progress Report for 2nd Quarter Oct-Dec 2009.
Dallu AIM (2006) Forest Resources Management in Tanzania. Forestry and Beekeeping Division,
Ministry of Natural Resources and Tourism. 17pp.
FAO (2004) Small scale cashew nut Processing. Rome, Italy. [Accessed on 17 May 2010 Available
at: http://www.fao.org/inpho/content/documents/vlibrary/ac306e/ac306e00.htm]
FAO (2005) Extent of forest resources. Available at:
ftp://ftp.fao.org/docrep/fao/008/A0400E/A0400E03.pdf
FBD (2000) National Forest Programme Workshop Proceedings (Volumes 1-3). Task Force on Land
Management. National Forest Programme Formulation in Tanzania. Forestry and Beekeeping
Division, Dar es Salaam, Tanzania.
FBD (2001) National Forest Programme in Tanzania, 2001-2010. Forestry and Beekeeping Division,
Ministry of Natural Resources and Tourism. 134pp.
Furley PA, Ryan CM & Saiz G (2008) Savanna burning and the assessment of long-term fire
experiments with particular reference to Zimbabwe. Progress in Physical Geography 32(6): 611–634.
Luoga EJ, Witkowski ETF & Balkwill K (2000) Economics of charcoal production in miombo
woodlands of eastern Tanzania: some hidden costs associated with commercialization of the
resources. Ecological Economics, 35(2): 243-257
MACEMP (2009) MACEMP Project on Land Capability. Final Draft Report Kilwa District.
Malimbwi RE, Shemwetta DTK, Zahabu E, Kingazi SP, Katani JZ & Silayo DA (2005a) Kilwa
District Forestry Inventory Report. FORCONSULT / Forestry and Beekeeping Division, Ministry of
Natural Resources and Tourism.
Malimbwi RE, Shemwetta DTK, Zahabu E, Kingazi SP, Katani JZ & Silayo DA (2005b) Liwale
District Forestry Inventory Report. FORCONSULT / Forestry and Beekeeping Division, Ministry of
Natural Resources and Tourism.
Drivers of Deforestation in Kilwa
- 33 -
Malimbwi RE, Shemwetta DTK, Zahabu E, Kingazi SP, Katani JZ & Silayo DA (2005c)
Nachingwea District Forestry Inventory Report. FORCONSULT / Forestry and Beekeeping Division,
Ministry of Natural Resources and Tourism.
Malimbwi RE, Shemwetta DTK, Zahabu E, Kingazi SP, Katani JZ & Silayo DA (2005d) Tunduru
District Forestry Inventory Report. FORCONSULT / Forestry and Beekeeping Division, Ministry of
Natural Resources and Tourism.
Malimbwi RE, Shemwetta DTK, Zahabu E, Kingazi SP, Katani JZ & Silayo DA (2005e) Rufiji
District Forestry Inventory Report. FORCONSULT / Forestry and Beekeeping Division, Ministry of
Natural Resources and Tourism.
Mariki S, Shechambo F & Salehe J (2003). The Contribution of Environmental Goods and Services to
Tanzania’s Economy: with reference to poverty reduction. IUCN – The World Conservation Union.
Policy Brief No. 5. IUCN Eastern Africa Regional Office, Nairobi, Kenya.
Mbonde GPL (2005). Namna ya kuboresha usimamizi wa misitu. Mada iliyotolewa katika mkutano
wa wadu wa sekta ya misitu 28/1/2005, Royal Palm Hotel, Dar es Salaam.7pp.
MCP (2006) Background Information on Kilwa District. Mpingo Conservation Project, Tanzania.
Menke JW(1992) Grazing and fire management for native perennial grass restoration in california
grasslands, FREMONTIA A Journal of the California Native Plant Society, 1992, Vol. 20(2):22-25
Milledge SAH & Elibariki R (2005). The status of logging in Southern Tanzania. A technical report
submitted to the WWF East Africa Coastal Forests Ecoregion Programme. Project number:
IP0002/2005. TRAFFIC East/Southern Africa.
Milledge SAH, Gelvas IK & Ahrends A (2007). Forestry, Governance and National Development:
Lessons Learned from a Logging Boom in Southern Tanzania. TRAFFIC East/Southern Africa
/Tanzania Development Partners Group / Ministry of Natural Resources and Tourism, Dar es Salaam,
Tanzania. 252pp.
Monela GC, Zahabu E, Malimbwi RE, Jambiya G & Misana S (2001). Socio-economics of charcoal
extraction in Tanzania: a case of eastern part of Tanzania. CHAPOSA – Socio-Economics of Charcoal
Extraction in Tanzania. 13pp.
Monela GC, O’Kting’ati A, Kiwele PM (1993). Socioeconomic aspects of charcoal consumption and
environmental consequences along the Dar Es Salaam–Morogoro highway, Tanzania. Forest Ecology
and Management 58:249–258.
Mponda OKK (1996) Involving Farmers in the Design of Low-input Control Programme for Sesame
Flea beetles, Alocypha bimaculata Jacoby, in S.E. Tanzania. Phd Thesis. School of Development
Studies, University of East Anglia, Norwich, U.K.
Ngusaru AS, Mgaya YD, Francis J & Sosovele H (2001) Root Causes of Biodiversity Loss in Rufiji-
Kilwa-Mafia and Mnazi Bay Ruvuma Estuary Tanzania A Report Prepared for the WWF East African
Marine Ecoregion (EAME) Programme, UNIVERSITY OF DAR ES SALAAM, TANZANIA
Norconsult (2002) The True Cost of Charcoal: a rapid appraisal of the potential economic and
environmental benefits of substituting LPG for charcoal as an urban fuel in Tanzania. Tanzania
Association of Oil Marketing Companies (LPG Committee)
Drivers of Deforestation in Kilwa
- 34 -
Penman J, Gytarsky M, Hirashi T, Krug T, Kruger D, Pipatti R(eds) (2003) Good Practice Guidance
for Land Use, Land-Use Change and Forestry Intergovernmental Panel on Climate Change Working
Group—National Greenhouse Gas Inventories Programme, Kanagawa, Japan.
Ryan CM & Williams M (2011) How does fire intensity and frequency affect miombo woodland tree
populations and biomass? Ecological Applications 21:48–60.
Sawe E (2004). An overview of charcoal industry in Tanzania-issues and challenges; prepared for the
national R&D committee on industry and energy. Tanzania Traditional Energy Development and
Environment Organization (TaTEDO), Dar es Salaam.
Stronach N (2009) A review of the impact of fire on the carbon content, dynamics and biodiversity
value of miombo woodlands. Report for Fauna & Flora International, Cambridge, UK.
TaTEDO (2002). The true cost of charcoal. Tanzania Traditional Energy Development and
Environment Organization (TaTEDO), Dar es Salaam.
UNFCCC (2007) Investment and financial flows to address Climate Change. UNFCCC.
Van Beukering P, Kahyarara G, Massey E, Prima S, Hess S, Makundi V & Van der Leeuw K (2007).
Optimization of the charcoal chain in Tanzania; PREM working Paper, Amsterdam, The Netherlands.
VPO (2002) National Report to the Earth Summit on Sustainable Development: Implementation of
Agenda 21. Vice President’s Office. Dar es Salaam, Tanzania. 57pp.