Drilling Deeper - A Reality Check of the Shale Gas ...
18
PART 1: EXECUTIVE SUMMARY J. DAVID HUGHES A REALITY CHECK ON U.S. GOVERNMENT FORECASTS FOR A LASTING TIGHT OIL & SHALE GAS BOOM DRILLING DEEPER
Transcript of Drilling Deeper - A Reality Check of the Shale Gas ...
PART 1: EXECUTIVE SUMMARY
J. DAVID HUGHES
A REALITY CHECK ON U.S. GOVERNMENT FORECASTSFOR A LASTING TIGHT OIL & SHALE GAS BOOM
DRILLING DEEPER
Visit postcarbon.org/drilling-deeper
for more information and related resources.
About the Author
David Hughes is a geoscientist who has studied the energy resources of Canada for four decades, including 32 years with the
Geological Survey of Canada as a scientist and research manager. He developed the National Coal Inventory to determine the
availability and environmental constraints associated with Canada’s coal resources. As Team Leader for Unconventional Gas on
the Canadian Gas Potential Committee, he coordinated the publication of a comprehensive assessment of Canada’s
unconventional natural gas potential. Over the past decade, Hughes has researched, published, and lectured widely on global
energy and sustainability issues in North America and internationally.
In 2011, Hughes authored a series of papers on the production potential and environmental impacts of U.S. natural gas. In
early 2013, he authored Drill, Baby, Drill: Can Unconventional Fuels Usher in a New Era of Energy Abundance?, which took a
far-ranging and painstakingly researched look at the prospects for various unconventional fuels to provide energy abundance
for the United States in the 21st century. In late 2013 he authored Drilling California: A Reality Check on the Monterey Shale,
which critically examined the U.S. Energy Information Administration’s (EIA) estimates of technically recoverable tight oil in the
Monterey Shale, which the EIA claimed constituted two-thirds of U.S. tight oil; the EIA subsequently wrote down its resource
estimate for the Monterey by 96%. In early 2014 he authored BC LNG: A Reality Check, which examined the issues surrounding
the proposed massive scale up of shale gas production in British Columbia for LNG export.
Hughes is president of Global Sustainability Research, a consultancy dedicated to research on energy and sustainability issues.
He is also a board member of Physicians, Scientists & Engineers for Healthy Energy (PSE Healthy Energy) and is a Fellow of
Post Carbon Institute. Hughes contributed to Carbon Shift, an anthology edited by Thomas Homer-Dixon on the twin issues of
peak energy and climate change, and his work has been featured in Nature, Canadian Business, Bloomberg, USA Today, as
well as other popular press, radio, and television.
About Post Carbon Institute
Post Carbon Institute’s mission is to lead the transition to a more resilient, equitable, and sustainable world by providing
individuals and communities with the resources needed to understand and respond to the interrelated economic, energy, and
ecological crises of the 21st century.
Acknowledgements
The author would like to thank geoscientist David Dean for his insightful review and helpful comments from the perspective of
a long-term industry insider. Asher Miller and Daniel Lerch provided in-depth reviews and many helpful comments and
suggestions. Daniel Lerch also provided tireless editorial services. John Van Hoesen provided GIS services and prepared the
maps for each play. The report also benefited from contributions and exchanges with many other colleagues on all aspects of
energy—usually on a daily basis.
Drilling Deeper: A Reality Check on U.S. Government Forecasts for a Lasting Tight Oil & Shale Gas Boom
By J. David Hughes
In association with Post Carbon Institute
Copyright © 2014 by J. David Hughes. All rights reserved. Published October 2014.
For reprint requests and other inquiries, contact:
Post Carbon Institute, 613 Fourth St., Suite 208, Santa Rosa, California, 95404
DRILLING DEEPER 1 PART 1: EXECUTIVE SUMMARY
PART 1: EXECUTIVE SUMMARY By Asher Miller, Executive Director, Post Carbon Institute
DRILLING DEEPER 2 PART 1: EXECUTIVE SUMMARY
PART 1: EXECUTIVE SUMMARY - CONTENTS 1.1 Introduction .......................................................................................................................................... 3
1.2 About the Report .................................................................................................................................. 4
1.3 Key Findings ......................................................................................................................................... 6
1.3.1 Tight Oil ................................................................................................................................................ 7
1.3.1.1 General Findings .......................................................................................................................... 7
1.3.1.2 Forecasts for Bakken & Eagle Ford Tight Oil Plays .................................................................... 8
1.3.1.3 Forecasts for Other Tight Oil Plays .............................................................................................. 9
1.3.2 Shale Gas ......................................................................................................................................... 11
1.3.2.1 General Findings ........................................................................................................................ 11
1.3.2.2 Forecasts for Shale Gas Plays................................................................................................... 14
1.4 Implications ........................................................................................................................................ 16
PART 1: EXECUTIVE SUMMARY - FIGURES Figure 1-1. History and EIA reference case forecast of U.S. oil and natural gas production, 1960 to 2040. .............. 3
Figure 1-2. Bakken and Eagle Ford plays projected cumulative oil production from 2012 to 2040 and daily oil
production in 2040, EIA projection versus this report’s projection. .......................................................... 8
Figure 1-3. “Most Likely” scenario projections of oil production for the Bakken and Eagle Ford plays with the
remaining amount of production that would be required from other plays to meet the EIA’s total
reference case forecast. .............................................................................................................................. 9
Figure 1-4. Estimated ultimate recovery (EUR) of oil and gas per well of reviewed plays, on a “barrels of oil
equivalent” basis. ...................................................................................................................................... 10
Figure 1-5. Average first-year gas production per well in 2013 from horizontal wells both play-wide and in the
top-producing county for the plays analyzed in this report. .................................................................... 12
Figure 1-6. Average production over first twelve months per well for major U.S. shale gas plays. ........................... 13
Figure 1-7. Totaled “Most Likely Rate” scenarios for the seven plays analyzed in this report, compared to the
EIA’s reference case forecast for these plays and for all plays., ............................................................ 14
Figure 1-8. Projected cumulative gas production to 2040 and daily gas production in 2040, EIA projection
versus this report’s projection. ................................................................................................................. 15
DRILLING DEEPER 3 PART 1: EXECUTIVE SUMMARY
1.1 INTRODUCTION
In recent years Americans have been hearing that the United States is poised to regain its role as the world’s
premier oil and natural gas producer, thanks to the widespread use of horizontal drilling and hydraulic
fracturing (“fracking”). This “shale revolution,” we’re told, will fundamentally change the U.S. energy picture
for decades to come—leading to energy independence, a rebirth of U.S. manufacturing, and a surplus supply
of both oil and natural gas that can be exported to allies around the world. This promise of oil and natural gas
abundance is influencing climate policy, foreign policy, and investments in alternative energy sources.
The primary source for these rosy expectations of future production is the U.S. Department of Energy (DOE).
Each year the DOE’s Energy Information Administration (EIA) releases its Annual Energy Outlook (AEO)1,
which provides a range of forecasts for energy production, consumption, and prices.
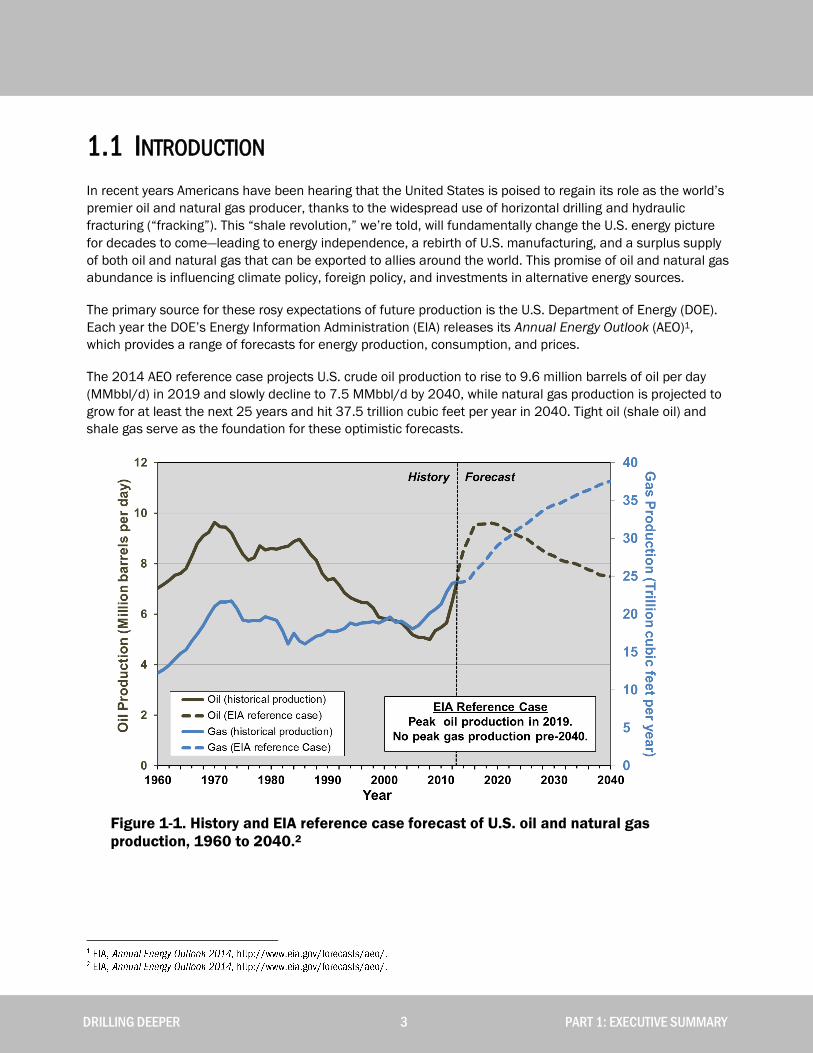
The 2014 AEO reference case projects U.S. crude oil production to rise to 9.6 million barrels of oil per day
(MMbbl/d) in 2019 and slowly decline to 7.5 MMbbl/d by 2040, while natural gas production is projected to
grow for at least the next 25 years and hit 37.5 trillion cubic feet per year in 2040. Tight oil (shale oil) and
shale gas serve as the foundation for these optimistic forecasts.
Figure 1-1. History and EIA reference case forecast of U.S. oil and natural gas
production, 1960 to 2040.2
DRILLING DEEPER 4 PART 1: EXECUTIVE SUMMARY
This report provides an extensive analysis of actual production data from the top seven tight oil and seven
shale gas plays in the U.S. (These plays account for 89% of current tight oil production and 88% of current
shale gas production, and serve as the primary sources of future production in the EIA’s forecasts—82% of
forecast tight oil and 88% of forecast shale gas production through 2040.) It concludes that the current
boom in domestic oil and gas production is unsustainable at the rates projected by the EIA, and that the EIA’s
tight oil and shale gas forecasts to 2040 are extremely optimistic. What this means is that the country's
current energy policy—which is largely based on the expectation of domestic oil and natural gas abundance
far into the future—is badly misguided and is setting the country up for a painful, costly, and unexpected
shock when the boom ends.
1.2 ABOUT THE REPORT
Drilling Deeper: A Reality Check on U.S. Government Forecasts for a Lasting Shale Boom was authored by J.
David Hughes on behalf of Post Carbon Institute. The report investigates whether the EIA’s expectation of
long-term domestic oil and natural gas abundance is founded. It aims to gauge the likely future of U.S. tight
oil and shale gas production based on an in-depth assessment of actual well production data from the major
shale plays. The primary source of data for this analysis is Drillinginfo, a commercial database of well
production data widely used by industry and government, including the EIA.3 Drillinginfo also provides a
variety of analytical tools which proved essential for the analysis.
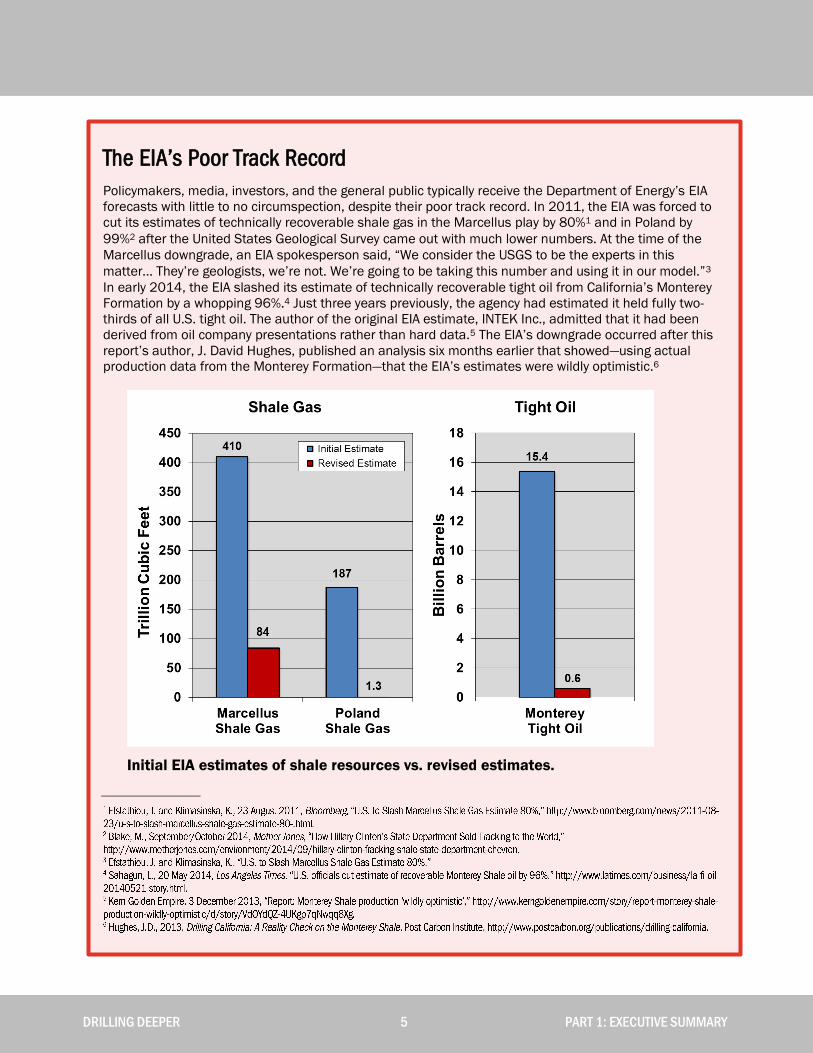
This analysis is based on all drilling and production data available through early- to mid-2014. The report
determined future production profiles given assumed rates of drilling, average well quality by area, well- and
field-decline rates, and the estimated number of available drilling locations. The plays analyzed (which
collectively account for 89% of current tight oil production and 88% of current shale gas production) are as
follows:
Tight Oil Plays4 Shale Gas Plays
Bakken (North Dakota and Montana)
Eagle Ford (Texas)
Spraberry (Texas)
Wolfcamp (Texas and New Mexico)
Bone Spring (Texas and New Mexico)
Austin Chalk (Gulf Coast Region)
Niobrara (Colorado and Wyoming)
Barnett (Texas)
Haynesville (Louisiana and Texas)
Fayetteville (Arkansas)
Woodford (Oklahoma)
Marcellus (Pennsylvania and West Virginia)
Bakken (North Dakota and Montana;
associated gas)
Eagle Ford (Texas; associated gas)
DRILLING DEEPER 5 PART 1: EXECUTIVE SUMMARY
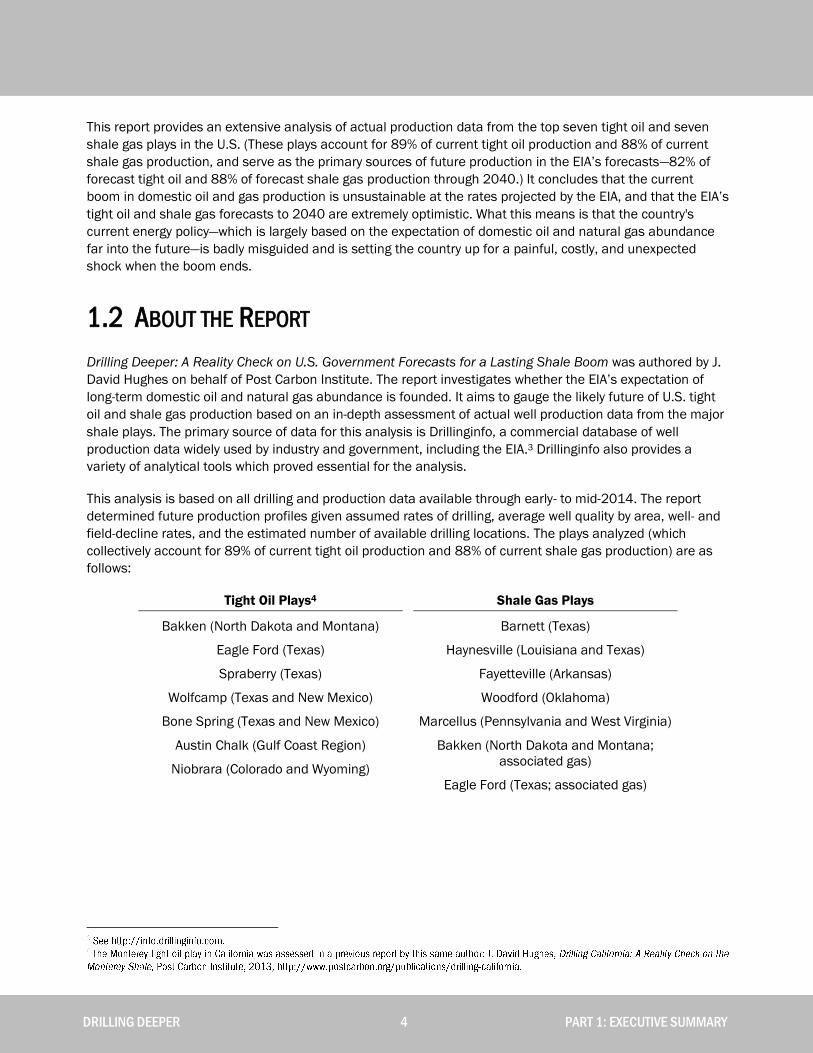
The EIA’s Poor Track Record
Policymakers, media, investors, and the general public typically receive the Department of Energy’s EIA
forecasts with little to no circumspection, despite their poor track record. In 2011, the EIA was forced to
cut its estimates of technically recoverable shale gas in the Marcellus play by 80%1 and in Poland by
99%2 after the United States Geological Survey came out with much lower numbers. At the time of the
Marcellus downgrade, an EIA spokesperson said, “We consider the USGS to be the experts in this
matter… They’re geologists, we’re not. We’re going to be taking this number and using it in our model.”3
In early 2014, the EIA slashed its estimate of technically recoverable tight oil from California’s Monterey
Formation by a whopping 96%.4 Just three years previously, the agency had estimated it held fully two-
thirds of all U.S. tight oil. The author of the original EIA estimate, INTEK Inc., admitted that it had been
derived from oil company presentations rather than hard data.5 The EIA’s downgrade occurred after this
report’s author, J. David Hughes, published an analysis six months earlier that showed—using actual
production data from the Monterey Formation—that the EIA’s estimates were wildly optimistic.6
Initial EIA estimates of shale resources vs. revised estimates.
DRILLING DEEPER 6 PART 1: EXECUTIVE SUMMARY
1.3 KEY FINDINGS
The seven tight oil plays and seven shale gas plays analyzed in this report account for 82% of projected tight
oil production and 88% of projected shale gas production through 2040 in the EIA’s Annual Energy Outlook
2014 reference case forecast. A detailed analysis of well production data from these plays resulted in these
key findings:
1) Tight oil production from major plays will peak before 2020. Barring major new discoveries on the
scale of the Bakken or Eagle Ford, production will be far below EIA’s forecast by 2040.
a) Tight oil production from the two top plays, the Bakken and Eagle Ford, will underperform EIA’s
reference case oil recovery by 28% from 2013 to 2040, and more of this production will be front-
loaded than the EIA estimates.
b) By 2040, production rates from the Bakken and Eagle Ford will be less than a tenth of that
projected by EIA.
c) Tight oil production forecast by the EIA from plays other than the Bakken and Eagle Ford is in
most cases highly optimistic and unlikely to be realized at the rates projected.
2) Shale gas production from the top seven plays will likely peak before 2020. Barring major new
discoveries on the scale of the Marcellus, production will be far below EIA’s forecast by 2040.
a) Shale gas production from the top seven plays will underperform EIA’s reference case forecast
by 39% from 2014 to 2040 period, and more of this production will be front-loaded than EIA
estimates.
b) By 2040, production rates from these plays will be about one-third that of the EIA forecast.
c) Production from shale gas plays other than the top seven will need to be four times that
estimated by EIA in order to meet its reference case forecast.
3) Over the short term, U.S. production of both shale gas and tight oil is projected to be robust—but a
thorough review of the production data indicate that this will be unsustainable in the longer term.
These findings have clear implications for current domestic and foreign policy discussions, which
generally assume decades of U.S. oil and gas abundance.
Other factors that could limit production are public pushback as a result of health and environmental
concerns, and capital constraints that could result from lower oil or gas prices or higher interest rates. As
such factors have not been included in this analysis, the findings of this report represent a “best case”
scenario for market, capital, and political conditions.
DRILLING DEEPER 7 PART 1: EXECUTIVE SUMMARY
1.3.1 Tight Oil
The analysis shows that U.S. tight oil production cannot be maintained at the levels assumed by the EIA
beyond 2020. The top two plays—Bakken and Eagle Ford—which account for more than 60% of current
production, are likely to peak by 2017 and the remaining plays will make up considerably less of future
production than has been forecast by the EIA. Rather than a peak in 2021 followed by a gradual decline to
slightly below today’s levels by 2040, total U.S. tight oil production is likely to peak before 2020 and decline
to a small fraction of today’s production levels by 2040.
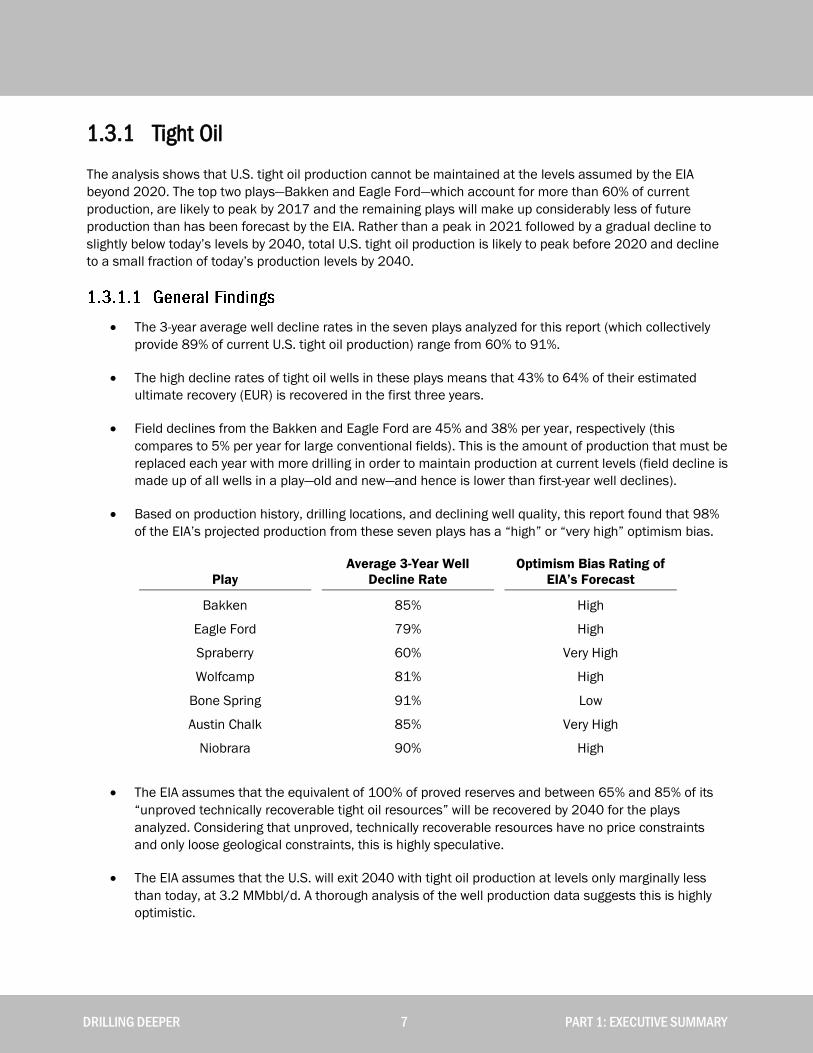
The 3-year average well decline rates in the seven plays analyzed for this report (which collectively
provide 89% of current U.S. tight oil production) range from 60% to 91%.
The high decline rates of tight oil wells in these plays means that 43% to 64% of their estimated
ultimate recovery (EUR) is recovered in the first three years.
Field declines from the Bakken and Eagle Ford are 45% and 38% per year, respectively (this
compares to 5% per year for large conventional fields). This is the amount of production that must be
replaced each year with more drilling in order to maintain production at current levels (field decline is
made up of all wells in a play—old and new—and hence is lower than first-year well declines).
Based on production history, drilling locations, and declining well quality, this report found that 98%
of the EIA’s projected production from these seven plays has a “high” or “very high” optimism bias.
Play
Average 3-Year Well
Decline Rate
Optimism Bias Rating of
EIA’s Forecast
Bakken 85% High
Eagle Ford 79% High
Spraberry 60% Very High
Wolfcamp 81% High
Bone Spring 91% Low
Austin Chalk 85% Very High
Niobrara 90% High
The EIA assumes that the equivalent of 100% of proved reserves and between 65% and 85% of its
“unproved technically recoverable tight oil resources” will be recovered by 2040 for the plays
analyzed. Considering that unproved, technically recoverable resources have no price constraints
and only loose geological constraints, this is highly speculative.
The EIA assumes that the U.S. will exit 2040 with tight oil production at levels only marginally less
than today, at 3.2 MMbbl/d. A thorough analysis of the well production data suggests this is highly
optimistic.
DRILLING DEEPER 8 PART 1: EXECUTIVE SUMMARY
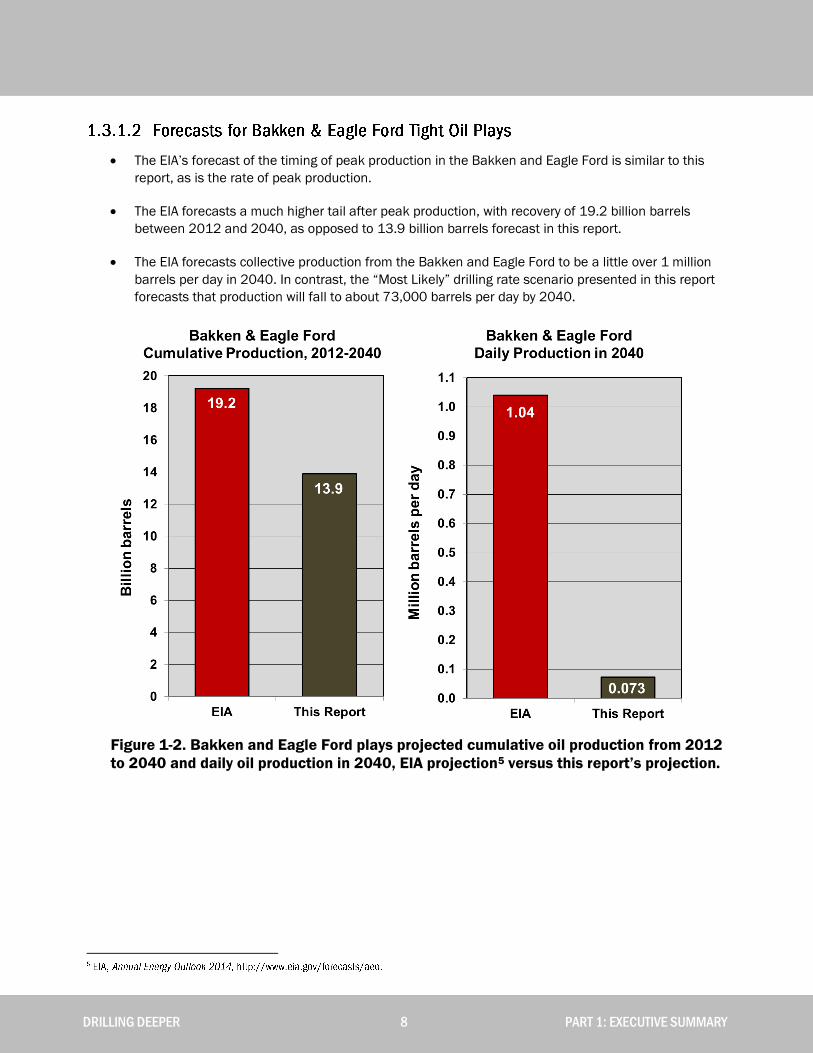
The EIA’s forecast of the timing of peak production in the Bakken and Eagle Ford is similar to this
report, as is the rate of peak production.
The EIA forecasts a much higher tail after peak production, with recovery of 19.2 billion barrels
between 2012 and 2040, as opposed to 13.9 billion barrels forecast in this report.
The EIA forecasts collective production from the Bakken and Eagle Ford to be a little over 1 million
barrels per day in 2040. In contrast, the “Most Likely” drilling rate scenario presented in this report
forecasts that production will fall to about 73,000 barrels per day by 2040.
Figure 1-2. Bakken and Eagle Ford plays projected cumulative oil production from 2012
to 2040 and daily oil production in 2040, EIA projection5 versus this report’s projection.

DRILLING DEEPER 9 PART 1: EXECUTIVE SUMMARY
To meet the EIA’s forecasts, all other plays together would need to produce over twice as much
through 2040 as what is projected for the Bakken and Eagle Ford.
Figure 1-3. “Most Likely” scenario projections of oil production for the Bakken and
Eagle Ford plays6 with the remaining amount of production that would be required from
other plays to meet the EIA’s total reference case forecast.7
The EIA forecasts 43.6 billion barrels of U.S. tight oil will be recovered from 2012 to 2040. After subtracting
the 13.9 billion barrels projected by this report for the Bakken and Eagle Ford, 29.7 billion barrels would
remain to be produced from all other tight oil plays—5.3 billion barrels more than the EIA’s already optimistic
forecast for these plays.
DRILLING DEEPER 10 PART 1: EXECUTIVE SUMMARY
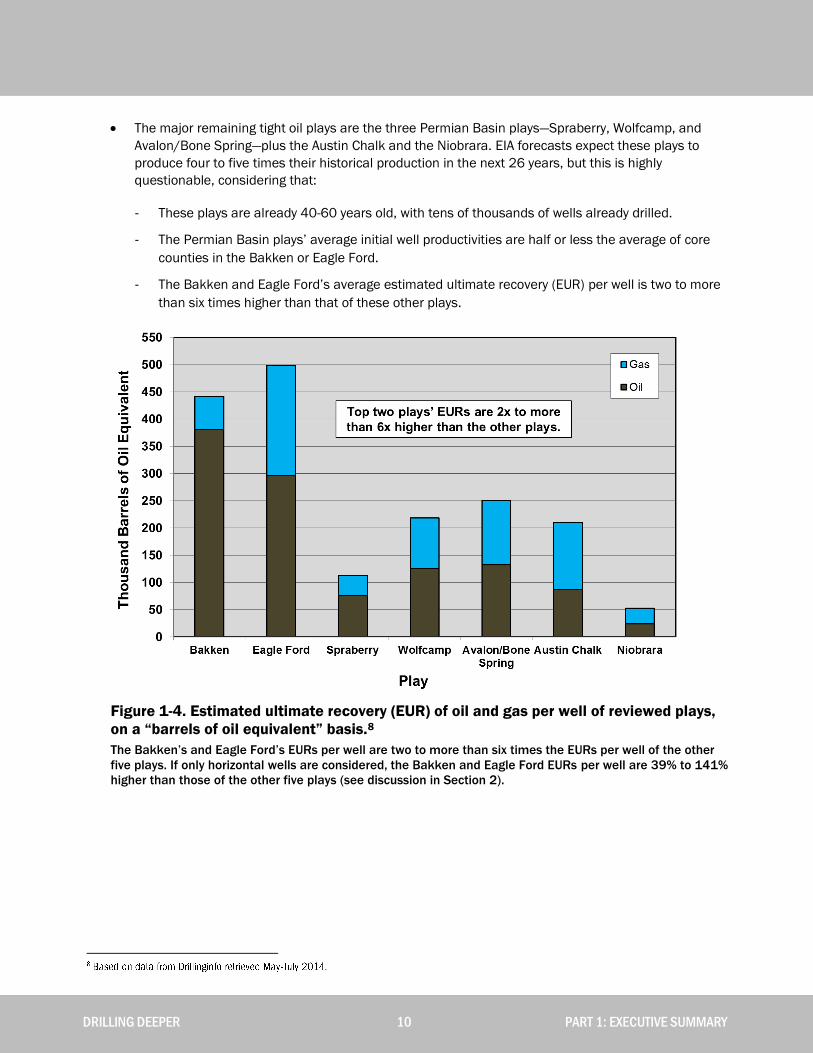
The major remaining tight oil plays are the three Permian Basin plays—Spraberry, Wolfcamp, and
Avalon/Bone Spring—plus the Austin Chalk and the Niobrara. EIA forecasts expect these plays to
produce four to five times their historical production in the next 26 years, but this is highly
questionable, considering that:
- These plays are already 40-60 years old, with tens of thousands of wells already drilled.
- The Permian Basin plays’ average initial well productivities are half or less the average of core
counties in the Bakken or Eagle Ford.
- The Bakken and Eagle Ford’s average estimated ultimate recovery (EUR) per well is two to more
than six times higher than that of these other plays.
Figure 1-4. Estimated ultimate recovery (EUR) of oil and gas per well of reviewed plays,
on a “barrels of oil equivalent” basis.8
The Bakken’s and Eagle Ford’s EURs per well are two to more than six times the EURs per well of the other
five plays. If only horizontal wells are considered, the Bakken and Eagle Ford EURs per well are 39% to 141%
higher than those of the other five plays (see discussion in Section 2).
DRILLING DEEPER 11 PART 1: EXECUTIVE SUMMARY
1.3.2 Shale Gas
The EIA now projects domestic gas production to reach nearly 38 trillion cubic feet per year by 2040, which is
55% above 2013 levels. The bulk of this production growth would come from shale gas.
This analysis shows that simply maintaining U.S. shale gas production in the medium term—let alone
increasing production at rates forecast by the EIA through 2040—will be problematic. Four of the top seven
shale gas plays are already in decline. Of the major plays, only the Marcellus, Eagle Ford, and Bakken (the
latter two are tight oil plays producing associated gas) are growing; and yet, the EIA reference case gas
forecast calls for plays currently in decline to grow to new production highs, at moderate future prices.
Although significantly higher gas prices needed to justify higher drilling rates could temporarily reverse
decline in some of these plays, the EIA forecast is unlikely to be realized.
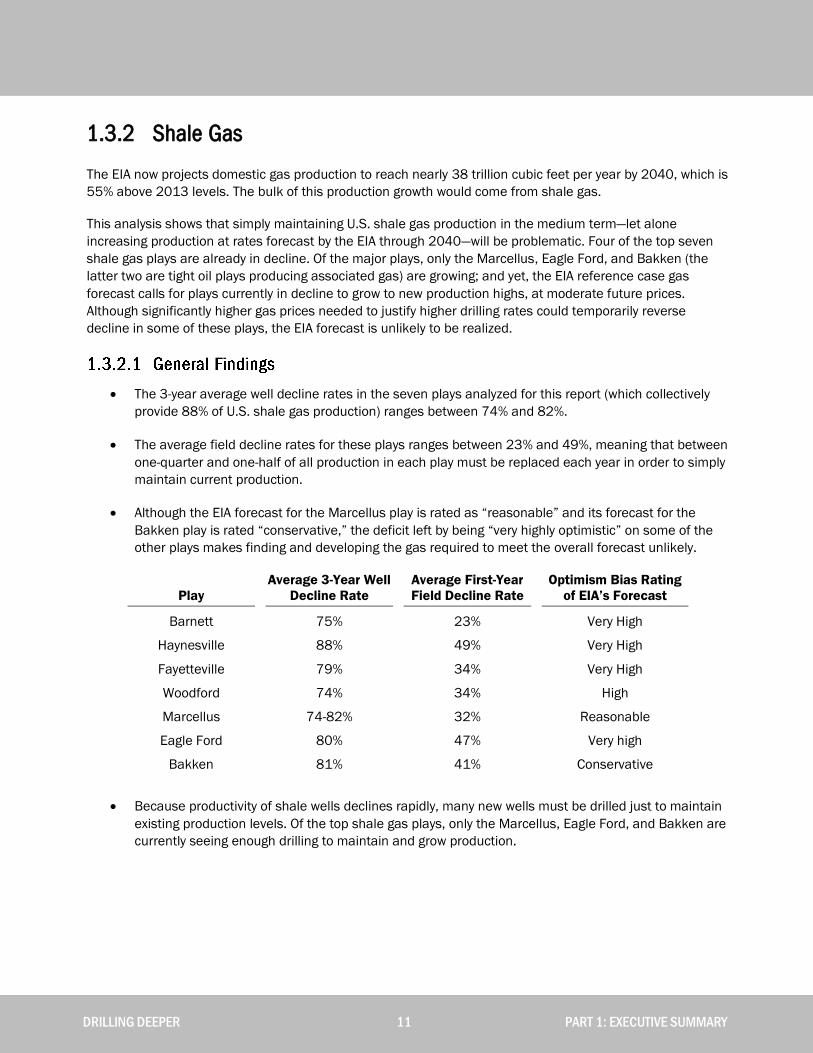
The 3-year average well decline rates in the seven plays analyzed for this report (which collectively
provide 88% of U.S. shale gas production) ranges between 74% and 82%.
The average field decline rates for these plays ranges between 23% and 49%, meaning that between
one-quarter and one-half of all production in each play must be replaced each year in order to simply
maintain current production.
Although the EIA forecast for the Marcellus play is rated as “reasonable” and its forecast for the
Bakken play is rated “conservative,” the deficit left by being “very highly optimistic” on some of the
other plays makes finding and developing the gas required to meet the overall forecast unlikely.
Play
Average 3-Year Well
Decline Rate
Average First-Year
Field Decline Rate
Optimism Bias Rating
of EIA’s Forecast
Barnett 75% 23% Very High
Haynesville 88% 49% Very High
Fayetteville 79% 34% Very High
Woodford 74% 34% High
Marcellus 74-82% 32% Reasonable
Eagle Ford 80% 47% Very high
Bakken 81% 41% Conservative
Because productivity of shale wells declines rapidly, many new wells must be drilled just to maintain
existing production levels. Of the top shale gas plays, only the Marcellus, Eagle Ford, and Bakken are
currently seeing enough drilling to maintain and grow production.
DRILLING DEEPER 12 PART 1: EXECUTIVE SUMMARY
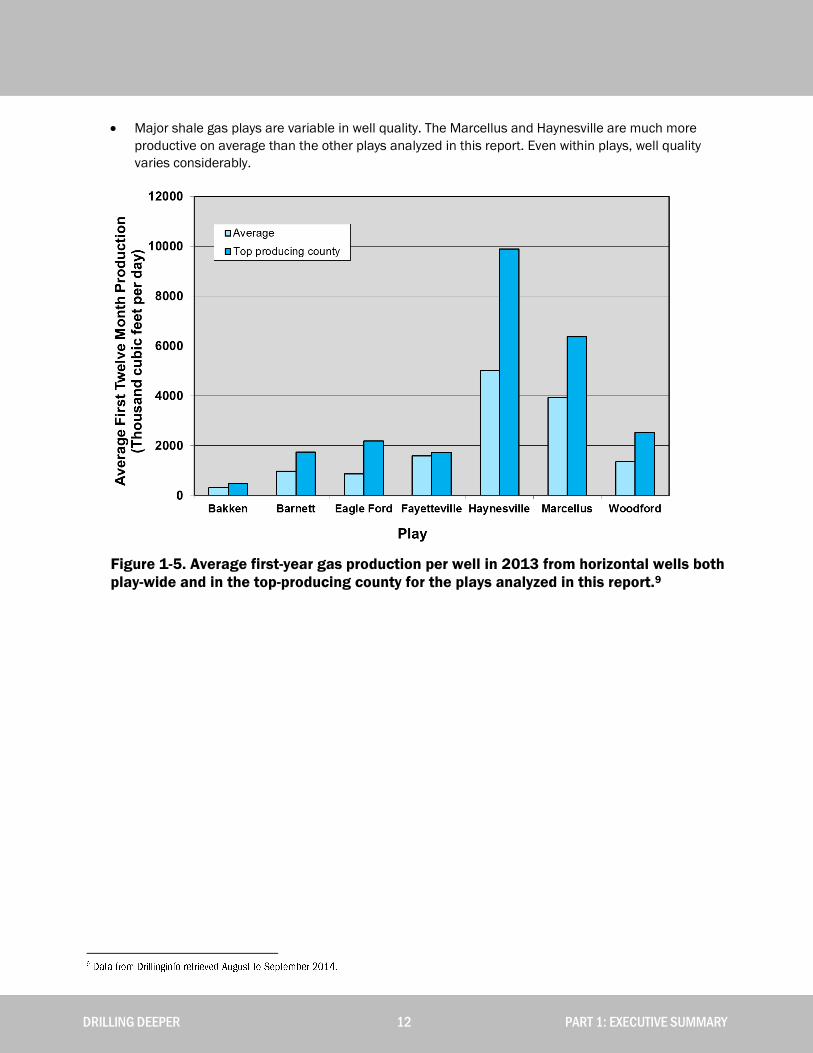
Major shale gas plays are variable in well quality. The Marcellus and Haynesville are much more
productive on average than the other plays analyzed in this report. Even within plays, well quality
varies considerably.
Figure 1-5. Average first-year gas production per well in 2013 from horizontal wells both
play-wide and in the top-producing county for the plays analyzed in this report.9

DRILLING DEEPER 13 PART 1: EXECUTIVE SUMMARY
Despite years of concerted efforts and claims that technological innovation can overcome steep well
decline rates and the move from “sweet spots” to lower quality parts of plays, average well
productivity has gone flat in all major shale gas plays except the Marcellus.
Figure 1-6. Average production over first twelve months per well for major U.S. shale gas
plays.10
Approximately 130,000 additional shale gas wells will need to be drilled by 2040 to meet the
projections of this report, on top of the 50,000 wells drilled in these plays through 2013. Assuming
an average well cost of $7 million, this would require $910 billion of additional capital input by 2040,
not including leasing, operating, and other ancillary costs.
DRILLING DEEPER 14 PART 1: EXECUTIVE SUMMARY
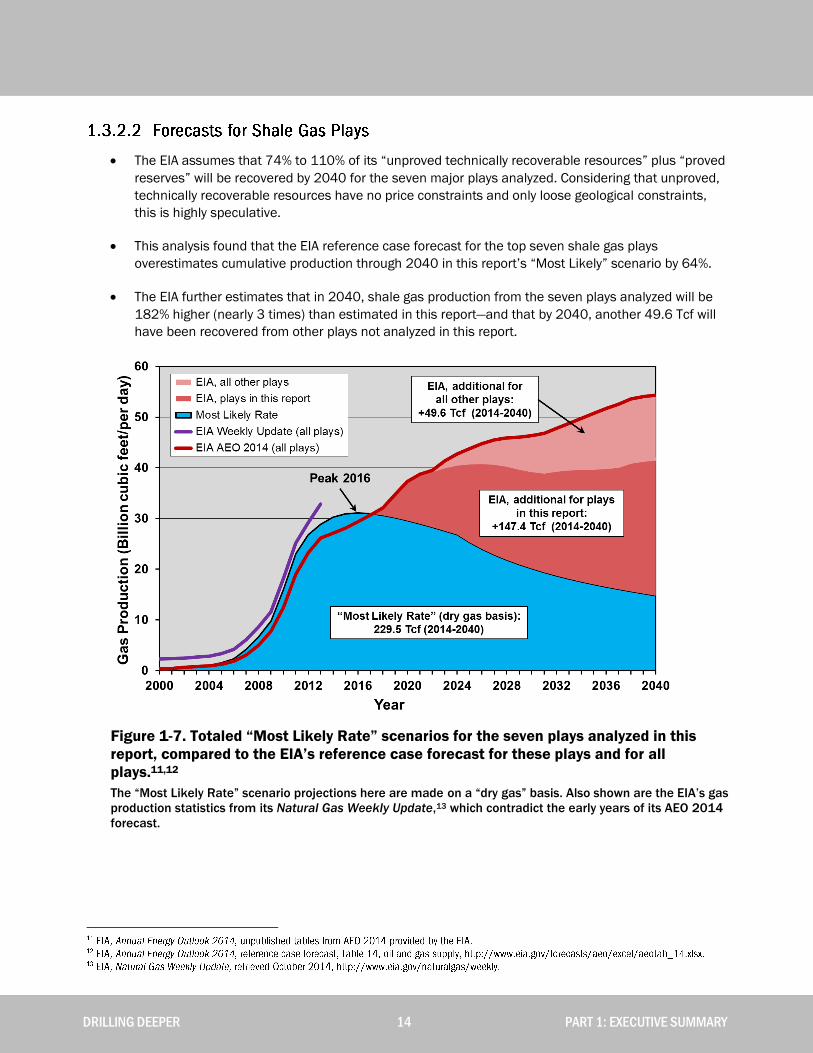
The EIA assumes that 74% to 110% of its “unproved technically recoverable resources” plus “proved
reserves” will be recovered by 2040 for the seven major plays analyzed. Considering that unproved,
technically recoverable resources have no price constraints and only loose geological constraints,
this is highly speculative.
This analysis found that the EIA reference case forecast for the top seven shale gas plays
overestimates cumulative production through 2040 in this report’s “Most Likely” scenario by 64%.
The EIA further estimates that in 2040, shale gas production from the seven plays analyzed will be
182% higher (nearly 3 times) than estimated in this report—and that by 2040, another 49.6 Tcf will
have been recovered from other plays not analyzed in this report.
Figure 1-7. Totaled “Most Likely Rate” scenarios for the seven plays analyzed in this
report, compared to the EIA’s reference case forecast for these plays and for all
plays.11,12
The “Most Likely Rate” scenario projections here are made on a “dry gas” basis. Also shown are the EIA’s gas
production statistics from its Natural Gas Weekly Update,13 which contradict the early years of its AEO 2014
forecast.
DRILLING DEEPER 15 PART 1: EXECUTIVE SUMMARY
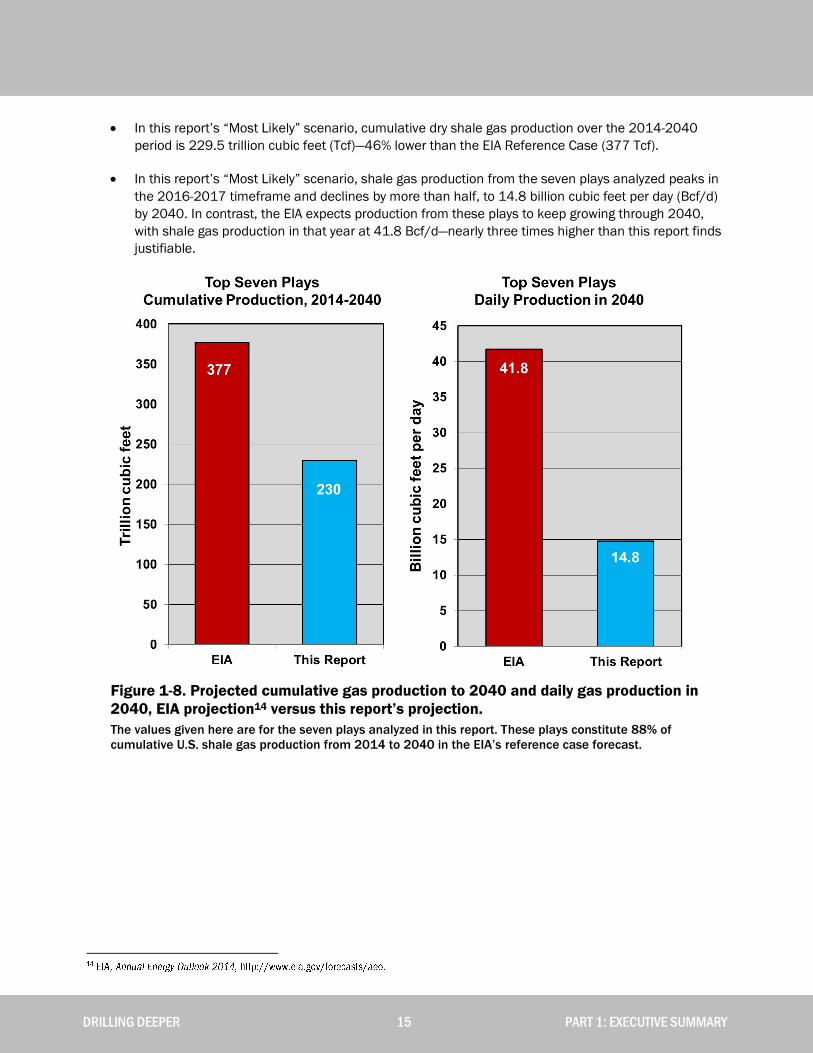
In this report’s “Most Likely” scenario, cumulative dry shale gas production over the 2014-2040
period is 229.5 trillion cubic feet (Tcf)—46% lower than the EIA Reference Case (377 Tcf).
In this report’s “Most Likely” scenario, shale gas production from the seven plays analyzed peaks in
the 2016-2017 timeframe and declines by more than half, to 14.8 billion cubic feet per day (Bcf/d)
by 2040. In contrast, the EIA expects production from these plays to keep growing through 2040,
with shale gas production in that year at 41.8 Bcf/d—nearly three times higher than this report finds
justifiable.
Figure 1-8. Projected cumulative gas production to 2040 and daily gas production in
2040, EIA projection14 versus this report’s projection.
The values given here are for the seven plays analyzed in this report. These plays constitute 88% of
cumulative U.S. shale gas production from 2014 to 2040 in the EIA’s reference case forecast.
DRILLING DEEPER 16 PART 1: EXECUTIVE SUMMARY
1.4 IMPLICATIONS
This report shows that the EIA’s optimistic forecasts for future U.S. tight oil and shale gas production are
based on a set of false premises, namely that:
High-quality shale plays are ubiquitous, and there will be always be new discoveries and production
from emerging plays to fill the gap left by declining production from major existing plays.
Technological advances can overcome steep decline rates and declining well quality as drilling
moves from sweet spots to poorer quality rock, in order to maintain high production rates.
Large estimated resources underground imply high and durable rates of extraction over decades.
Actual production data from the past decade of shale gas and tight oil drilling clearly do not support these
assumptions. Unfortunately, the EIA’s rosy forecasts have led policymakers and the American public to
believe a number of false promises:
That cheap and abundant natural gas supplies can create a domestic manufacturing resurgence and
millions of new jobs over the long term.15
That abundant domestic oil and natural gas resources justify lifting the oil export ban (imposed 40
years ago after the Arab oil embargo)16 and fast-tracking approval of liquefied natural gas (LNG)
export terminals.17
That the U.S. can use its newfound energy strength to shift geopolitical trends in our long-term
favor.18
That we can easily limit carbon dioxide emissions from power plants as a result of natural gas
replacing coal as the primary source of electricity production.19
The promises associated with the expectation of robust and relatively cheap shale gas and high-cost but
rising tight oil production have also led to a tempering of investments in renewable energy and nuclear
power.20 If, as this report shows, these premises and promises are indeed false, the implications are
profound. It calls into question plans for LNG and crude oil exports and the benefits of the shale boom in light
of the amount of drilling and capital investment that would be required, along with the environmental and
health impacts associated with it. Conventional wisdom holds that the shale boom will last for decades,
leaving the U.S. woefully unprepared for a painful, costly, and unexpected shock when the shale boom winds
down sooner than expected. Rather than planning for a future where domestic oil and natural gas production
is maintained at current or higher levels, we would be wise to harness this temporary fossil fuel bounty to
quickly develop a truly sustainable energy policy—one that is based on conservation, efficiency, and a rapid
transition to distributed renewable energy production.