
Drift performance of point fixed glass façade systems · Abstract: Glass façade systems in...
17
1. INTRODUCTION Glass façade systems in buildings are subject to racking actions caused by inter storey drift from earthquakes and wind action. The performance of façade systems is dependent on the amount of imposed drift and the interaction of the glass panels with the façade structural support frames. There are two major concerns related to the glass façade system performance during and immediately after a seismic event; hazards to people Advances in Structural Engineering Vol. 17 No. 10 2014 1481 Drift Performance of Point Fixed Glass Façade Systems S. Sivanerupan 1,* , J.L. Wilson 1 , E.F. Gad 1 and N.T.K. Lam 2 1 Faculty of Engineering and Industrial Sciences, Swinburne University of Technology, Victoria 3122, Australia 2 Melbourne School of Engineering, the University of Melbourne, Parkville 3010, Australia (Received: 9 April 2013; Received revised form: 25 September 2013; Accepted: 19 May 2014) Abstract: Glass façade systems in buildings are subject to racking actions caused by inter storey drifts from earthquakes and wind action. The performance of façade systems is dependent on the amount of imposed drift and the interaction of the glass panels with the façade structural support frames. There are two major concerns related to the glass façade system performance during and immediately after a seismic event; hazards to people from falling glass and the cost associated with building down time and repair. It was observed that earthquake damage to glass façade systems resulting from in-plane racking actions is increasingly common and yet there has been limited research published in this field. The research completed to date has mainly focused on traditional framed glass façade systems; however, the racking performance of point fixed glass façade system (PFGFS) is likely to be quite different. Therefore, the aim of the research presented in this paper is to assess the in-plane racking performance of PFGFS which is a façade system gaining popularity worldwide. Two unique full scale in-plane racking laboratory tests on typical PFGFS with different types of connections were conducted and specific racking mechanisms were identified. Sophisticated non-linear finite element models (FE models) were developed and benchmarked against experimental results with excellent correlation. Further detailed FE analyses were conducted to evaluate the individual drift contributions of each racking mechanism such as rigid body translation of the glass panels at the oversize holes for construction tolerance, spider arm rotation and spider arm deformation. It was found that most of the drift capacity is attributed to the rigid body translation at the oversize holes. In this paper, the laboratory test setup and the experimental results are discussed together with the confirmatory FE analysis results to assess the in-plane racking performance of the PFGFS. Key words: point fixed glass façade system, in-plane drift capacity, façade systems, earthquakes. from falling glass and the cost associated with building down time and repair. Glass façade systems can be classified into two types namely, framed glass façade system and point fixed glass façade system (PFGFS). It was observed that earthquake damage to glass façade systems resulting from in-plane racking actions is increasingly common and yet there has been limited number of research published available in this field. The research conducted * Corresponding author. Email address: [email protected].
Transcript of Drift performance of point fixed glass façade systems · Abstract: Glass façade systems in...

1. INTRODUCTIONGlass façade systems in buildings are subject to rackingactions caused by inter storey drift from earthquakesand wind action. The performance of façade systems isdependent on the amount of imposed drift and theinteraction of the glass panels with the façade structuralsupport frames. There are two major concerns related tothe glass façade system performance during andimmediately after a seismic event; hazards to people
Advances in Structural Engineering Vol. 17 No. 10 2014 1481
Drift Performance of Point Fixed Glass
Façade Systems
S. Sivanerupan1,*, J.L. Wilson1, E.F. Gad1 and N.T.K. Lam2
1Faculty of Engineering and Industrial Sciences, Swinburne University of Technology, Victoria 3122, Australia2Melbourne School of Engineering, the University of Melbourne, Parkville 3010, Australia
(Received: 9 April 2013; Received revised form: 25 September 2013; Accepted: 19 May 2014)
Abstract: Glass façade systems in buildings are subject to racking actions caused byinter storey drifts from earthquakes and wind action. The performance of façadesystems is dependent on the amount of imposed drift and the interaction of the glasspanels with the façade structural support frames. There are two major concerns relatedto the glass façade system performance during and immediately after a seismic event;hazards to people from falling glass and the cost associated with building down timeand repair. It was observed that earthquake damage to glass façade systems resultingfrom in-plane racking actions is increasingly common and yet there has been limitedresearch published in this field. The research completed to date has mainly focused ontraditional framed glass façade systems; however, the racking performance of pointfixed glass façade system (PFGFS) is likely to be quite different. Therefore, the aimof the research presented in this paper is to assess the in-plane racking performance ofPFGFS which is a façade system gaining popularity worldwide.
Two unique full scale in-plane racking laboratory tests on typical PFGFS withdifferent types of connections were conducted and specific racking mechanisms wereidentified. Sophisticated non-linear finite element models (FE models) weredeveloped and benchmarked against experimental results with excellent correlation.Further detailed FE analyses were conducted to evaluate the individual driftcontributions of each racking mechanism such as rigid body translation of the glasspanels at the oversize holes for construction tolerance, spider arm rotation and spiderarm deformation. It was found that most of the drift capacity is attributed to the rigidbody translation at the oversize holes. In this paper, the laboratory test setup and theexperimental results are discussed together with the confirmatory FE analysis resultsto assess the in-plane racking performance of the PFGFS.
Key words: point fixed glass façade system, in-plane drift capacity, façade systems, earthquakes.
from falling glass and the cost associated with buildingdown time and repair.
Glass façade systems can be classified into two typesnamely, framed glass façade system and point fixedglass façade system (PFGFS). It was observed thatearthquake damage to glass façade systems resultingfrom in-plane racking actions is increasingly commonand yet there has been limited number of researchpublished available in this field. The research conducted
* Corresponding author. Email address: [email protected].

to date has mainly focused on traditional framed glassfaçade systems; however, the in-plane rackingperformance of PFGFS is likely to be quite different. Inthe structural design of glass façades both out-of-planeand in-plane actions are considered by the façadeengineer. Self-weight, thermal expansion, spandrelbeam deflection and in-plane building movements dueto wind and seismic loadings are considered for in-planedesign whilst wind load is the main design action forout-of-plane performance of façade systems(Sivanerupan et al. 2011).
A substantial number of laboratory and analyticalstudies related to the simulated seismic performance offramed glass façade systems have been performed overthe past few decades. The most extensive testingprograms were performed on framed glass façades at theUniversity of Missouri-Rolla (UMR) and University ofPennsylvania (Behr 1998; Behr and Belarbi 1996; Behret al. 1995; Memari et al. 2003, Memari et al. 2004).ASCE7-10 (2010) provides a general expression based onthese tests for assessing architectural framed glass façadesystems under in-plane loading as expressed by Eqn 1.The drift capacity (∆fallout) should exceed the drift demandwhich is a function of relative seismic displacement (Dp)and the occupancy importance factor (I)
∆fallout >– 1.25IDp or 13 mm whichever is greater (1)
However, the seismic performance of a PFGFS isdifferent from conventional framed glass façadesystems and there are no standards or design guidelinesavailable to evaluate the in-plane drift capacity ofPFGFS. Spider arms are used in PFGFS to connect theglass to the support structure whilst the glass to thespider arms are connected using special bolt fittings asshown in Figure 1. Despite their growing popularity,there is very limited published research on the behaviourof PFGFS under in-plane racking action.
Recently, a PFGFS with large horizontal slottedholes in arms was designed and constructed in a highseismic region of California and the in-plane rackingperformance was verified using mock-up tests. Desaiet al. (2005) and Gowda and Heydari (2009) assessedthe seismic performance of PFGFS with differenttypes of structural support frames for use as claddingfacades of buildings in areas of high seismicity.Mock-up tests were conducted to address the driftlimit criteria of 2.0% to 2.5% for cladding systems asper the seismic provisions of the California BuildingCode (CBC 2002). The function of the proposedfaçade systems is to isolate the glass from thestructural support frame for in-plane deformations andloads while supporting the system for vertical loads
and for out-of-plane loads. Specially designed spiderarms with large horizontally slotted holes (Figure 2)were used to accommodate the drift by allowingisolated horizontal translation of glass panels. Thesizes of the slotted holes were calculated according tothe height of the glass façade and the drift demandfrom the building.
A unique research project has been undertaken by theauthors to assess the racking performance ofcontemporary PFGFS for regions of lower seismicity toovercome the paucity of data in this area. The researchinvolved laboratory experimental testing and analyticalmodelling of PFGFS with toughened glass panels. Twounique full scale in-plane racking laboratory tests ontypical PFGFS with different types of spider arms wereconducted (Test #1 and Test #2). Specific rackingmechanisms were attributed to the in-plane driftcapacity in each test. Sophisticated non-linear finiteelement models (FE models) were developed andconservatively benchmarked against experimentalresults with excellent correlation. Detailed FE analyseswere carried out to evaluate individual contributionsfrom each racking mechanism. The analyses showedthat a significant amount of the drift capacity wasattributed to the rigid body translation at the oversizeholes provided for construction tolerance. This paperprovides an overview of the racking performance ofPFGFS systems and describes the laboratoryexperimental test setup (Section 2), experimental results(Section 3), confirmatory finite element modelling(Section 4) and conclusions (Section 5).
1482 Advances in Structural Engineering Vol. 17 No. 10 2014
Drift Performance of Point Fixed Glass Façade Systems
Figure 1. Typical PFGFS at Perth Convention Centre, Australia

2. LABORATORY EXPERIMENTAL TESTSETUP
Two unique full scale in-plane racking laboratory tests(Test #1 and Test #2) representing typical point fixedglass façade systems (PFGFS) were conducted. Thetests utilised contemporary connections to attach theglass panels to the structural support frame consisting ofspider arms and special bolt fittings. The in-planeracking performance of PFGFS was dependent on threemain components; the glass panels, the connectiondetails and the structural support frame. In these tests the structural façade support frame representing the building superstructure was articulated so that the racking performance of the glass panels and theconnection details could be directly assessed. The spiderarms were configured as pinned X-type withcountersunk bolt fittings for Test #1 (Figure 3) and fixedK-type with button head bolt fittings (Figure 4).
2.1. Test #1 Specimen Description
Test #1 was conducted on a typical PFGFS as shown inFigure 5, which consisted of four 1200 mm x 1200 mmtoughened 12 mm thick glass panels joined with 8 mmthick silicon weather sealant. A structural façade supportframe was designed to support the glass panels throughthe spider arms. It was fabricated using 180PFC sectionsand bolted together using M24 bolts which were snugtightened to allow a racking mechanism to develop.
The flanges of the vertical PFC were removed at eachend to facilitate pin connections between the verticalwebs and the horizontal PFC members. The bottomflange of the horizontal PFC at the floor level wasrigidly connected to the laboratory strong floor usingM24 bolts. X-type spider arms and countersunk boltfittings were used in this experimental test. The X-type
spider arms were connected to the structural façadesupport frame using a single snug tightened M10 bolt toallow in-plane rotation of the glass panels at the spiderarm-to-structural support frame connection, as typicallyoccurs in industry.
2.2. Test #2 Specimen Description
The 2x2 glass panel test specimen was constructed withK-type spider arms and button head bolt fittings is shownin Figure 6. The specimen description and theexperimental setup was the same as described in Section2.1 for Test #1. However, the structural façade supportframe was modified by welding some ‘T’ sections thuscreating fixed cleats, to which the K-type spider armswere connected with two snug tightened M10 bolts. Thisreplicated a fixed spider arm connection that did not
Advances in Structural Engineering Vol. 17 No. 10 2014 1483
S. Sivanerupan, J.L. Wilson, E.F. Gad and N.T.K. Lam
Slot width based onglass panel height
Figure 2. Spider arms with horizontally slotted holes (Desai et al. 2005)
Figure 3. Test #1 - Pinned X-type spider arm with countersunk
bolt fittings

allow the glass panels to rotate at the spider arm-to-structural support frame connection but allowed sliding atthe base slotted hole connection in the vertical directionwhich is often used in practice as shown in Figure 1.
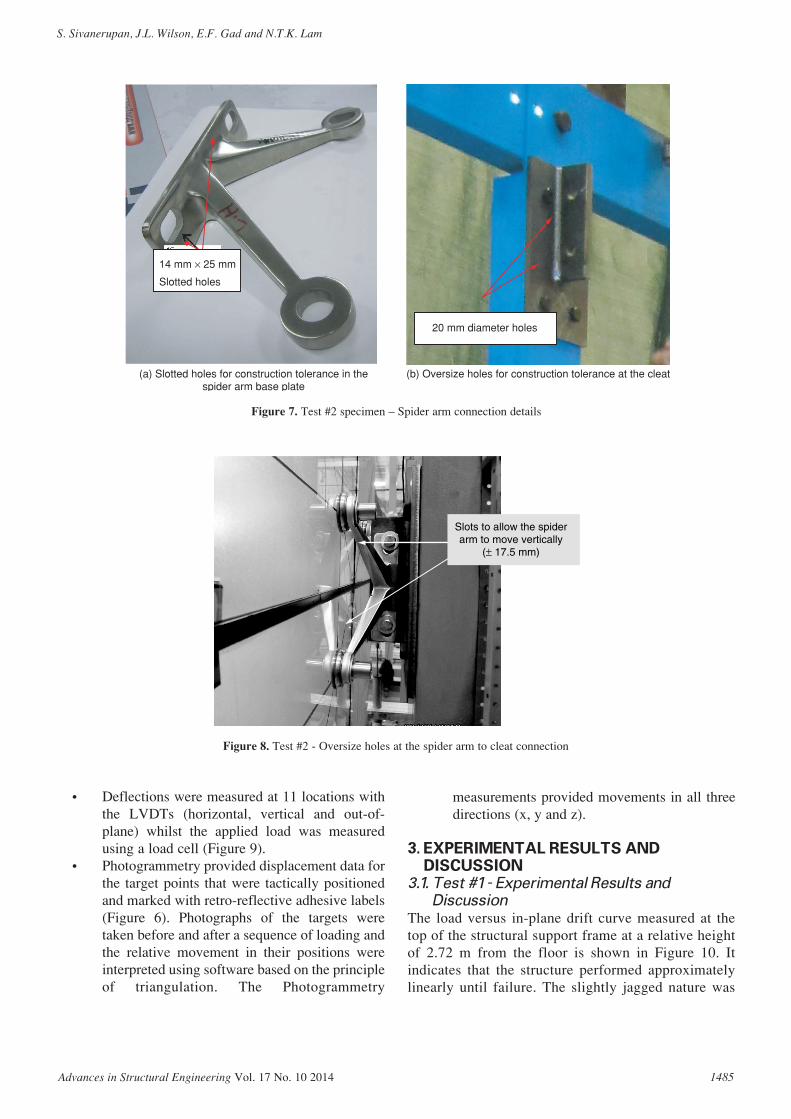
The spider arm base had two vertical slots measuring14 mm x 25 mm for the M10 bolts [Figure 7(a)] to allowfor construction tolerance. In addition, the representativeoversize holes for construction tolerance wereprovided by drilling 20 mm diameter holes in the cleat to accommodate the M10 bolts as shown inFigure 7(b). This provided ±7 mm horizontal (in the out-
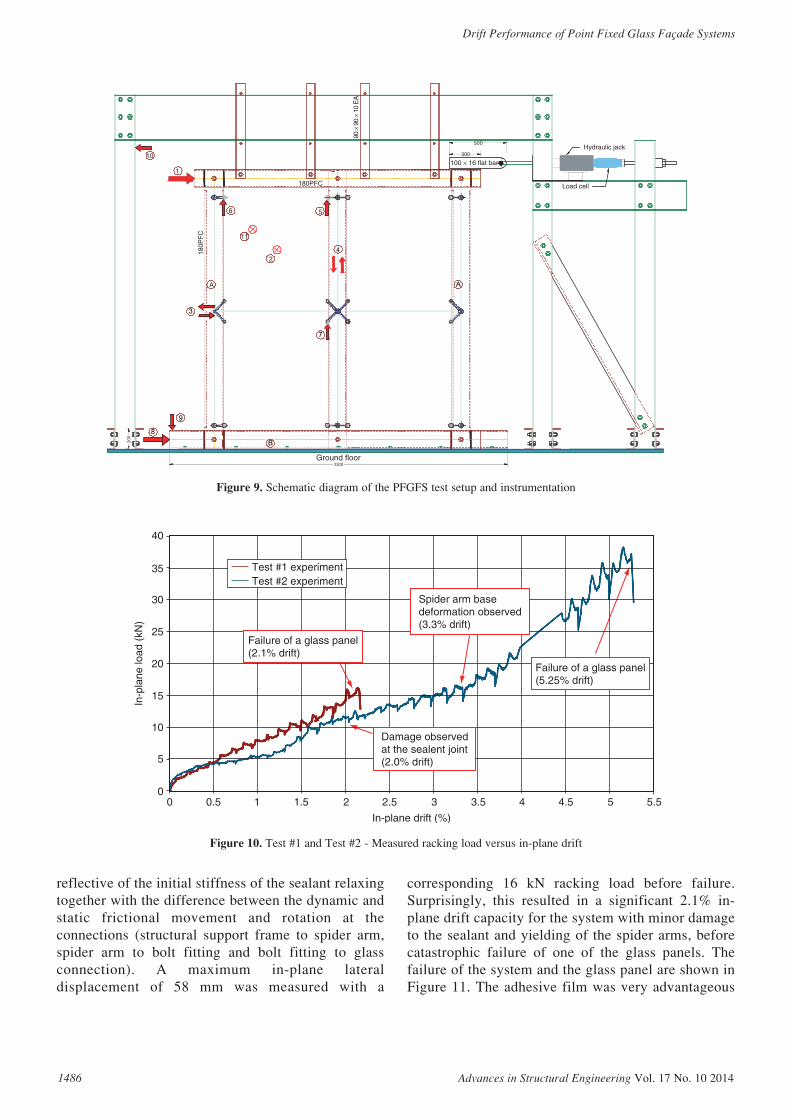
of-plane direction of the glass panels) and ±17.5 mmvertical gaps for the M10 bolted connections. The K-typespider arms to cleat connection details are illustrated inFigure 8, which is representative of industry practice.
2.3. Instrumentation and Test Procedure
The reaction frame and hydraulic jacking system wascapable of applying 100 kN in-plane lateral load and morethan 150 mm in-plane displacement. The structural façadesupport frame was prevented from moving in the out-of-plane direction by four sets of rollers mounted at the topand the rollers ensured that the structural façade supportframe was aligned with the loading direction. A schematicof the test setup and the arrangement of the instrumentationare illustrated in Figure 9. Once the structural supportframe was assembled, glaziers fixed the spider arms, glasspanels and applied the weather sealant and a specialtransparent adhesive film was applied to the glass panels toprevent the glass fragments scattering following any glassfracture (Figures 4 and 5). In addition, the test area wasenveloped with nets to capture any flying glass fragmentsfollowing fracture and to ensure safety in the lab.
The racking test procedure and instrumentation setupwere as follows:
• A lateral load was applied to the top right handcorner in a step by step manner withdisplacement increments of 5 mm until failure.
• Two systems of displacement measurementwere recorded to measure global and localmovements:• Linear Voltage Displacement Transducers
(LVDTs)• Photogrammetry
1484 Advances in Structural Engineering Vol. 17 No. 10 2014
Drift Performance of Point Fixed Glass Façade Systems
Figure 4. Test #2 - Fixed K-type spider arm with button head bolt
fittings
Figure 5. Test #1 specimen - glass panels with and transparent
adhesive film
Figure 6. Test #2 specimen - Glass panels with, transparent
adhesive film and photogrammetry targets
• Deflections were measured at 11 locations withthe LVDTs (horizontal, vertical and out-of-plane) whilst the applied load was measuredusing a load cell (Figure 9).
• Photogrammetry provided displacement data forthe target points that were tactically positionedand marked with retro-reflective adhesive labels(Figure 6). Photographs of the targets weretaken before and after a sequence of loading andthe relative movement in their positions wereinterpreted using software based on the principleof triangulation. The Photogrammetry
measurements provided movements in all threedirections (x, y and z).
3. EXPERIMENTAL RESULTS ANDDISCUSSION
3.1. Test #1 - Experimental Results and
Discussion
The load versus in-plane drift curve measured at thetop of the structural support frame at a relative heightof 2.72 m from the floor is shown in Figure 10. Itindicates that the structure performed approximatelylinearly until failure. The slightly jagged nature was
Advances in Structural Engineering Vol. 17 No. 10 2014 1485
S. Sivanerupan, J.L. Wilson, E.F. Gad and N.T.K. Lam
14 mm × 25 mm
Slotted holes
20 mm diameter holes
(a) Slotted holes for construction tolerance in thespider arm base plate
(b) Oversize holes for construction tolerance at the cleat
Figure 7. Test #2 specimen – Spider arm connection details
Slots to allow the spiderarm to move vertically
(± 17.5 mm)
Figure 8. Test #2 - Oversize holes at the spider arm to cleat connection
reflective of the initial stiffness of the sealant relaxingtogether with the difference between the dynamic andstatic frictional movement and rotation at theconnections (structural support frame to spider arm,spider arm to bolt fitting and bolt fitting to glassconnection). A maximum in-plane lateraldisplacement of 58 mm was measured with a
corresponding 16 kN racking load before failure.Surprisingly, this resulted in a significant 2.1% in-plane drift capacity for the system with minor damageto the sealant and yielding of the spider arms, beforecatastrophic failure of one of the glass panels. Thefailure of the system and the glass panel are shown inFigure 11. The adhesive film was very advantageous
1486 Advances in Structural Engineering Vol. 17 No. 10 2014
Drift Performance of Point Fixed Glass Façade Systems
Load cell
Hydraulic jack300
500
100 × 16 flat bar
90 ×
90
× 10
EA
180P
FC
180PFC
A
11
2
6
1
10
5
4
Ground floor
Figure 9. Schematic diagram of the PFGFS test setup and instrumentation
00
5
10
15
20
25
30
35
40
In-p
lane
load
(kN
)
0.5 1 1.5 2 2.5
In-plane drift (%)
3 3.5 4 4.5 5 5.5
Failure of a glass panel(2.1% drift)
Failure of a glass panel(5.25% drift)
Spider arm basedeformation observed(3.3% drift)
Damage observedat the sealent joint(2.0% drift)
Test #1 experimentTest #2 experiment
Figure 10. Test #1 and Test #2 - Measured racking load versus in-plane drift
in preventing the shattered glass fragments fromspreading all around the laboratory.
It was observed during the racking test that theglass panels and the spider arms all translated asrigid bodies whilst the sealant deformed at theinterface followed by spider arms deformation andyielding at one location. The X-type spider armsused in this experiment had a frictional momentcapacity (torsional) after which rotation wouldoccur. Rigid body translation in both the horizontaland vertical directions was observed at the oversizeholes for construction tolerance (gaps) at theconnection details (structural support frame to spiderarm, spider arm to bolt fitting and bolt fitting to glassconnection).
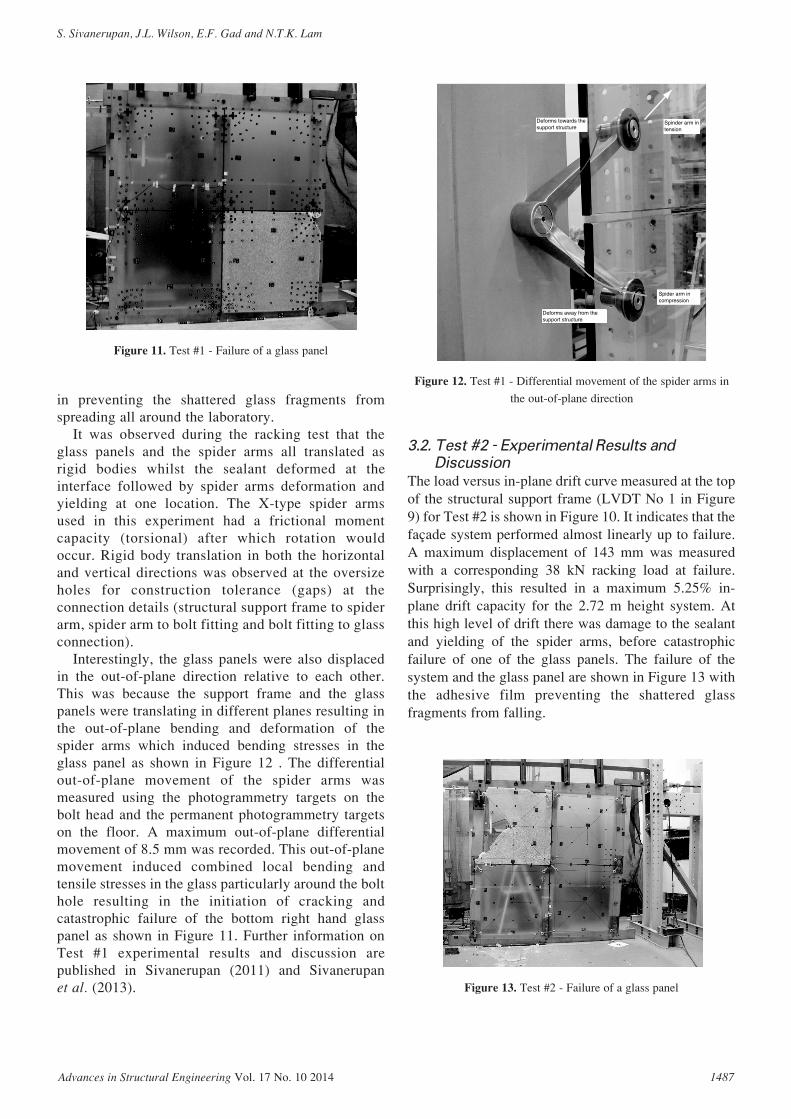
Interestingly, the glass panels were also displacedin the out-of-plane direction relative to each other.This was because the support frame and the glasspanels were translating in different planes resulting inthe out-of-plane bending and deformation of thespider arms which induced bending stresses in theglass panel as shown in Figure 12 . The differentialout-of-plane movement of the spider arms wasmeasured using the photogrammetry targets on thebolt head and the permanent photogrammetry targetson the floor. A maximum out-of-plane differentialmovement of 8.5 mm was recorded. This out-of-planemovement induced combined local bending andtensile stresses in the glass particularly around the bolthole resulting in the initiation of cracking andcatastrophic failure of the bottom right hand glasspanel as shown in Figure 11. Further information onTest #1 experimental results and discussion arepublished in Sivanerupan (2011) and Sivanerupanet al. (2013).
3.2. Test #2 - Experimental Results and
Discussion
The load versus in-plane drift curve measured at the topof the structural support frame (LVDT No 1 in Figure9) for Test #2 is shown in Figure 10. It indicates that thefaçade system performed almost linearly up to failure.A maximum displacement of 143 mm was measuredwith a corresponding 38 kN racking load at failure.Surprisingly, this resulted in a maximum 5.25% in-plane drift capacity for the 2.72 m height system. Atthis high level of drift there was damage to the sealantand yielding of the spider arms, before catastrophicfailure of one of the glass panels. The failure of thesystem and the glass panel are shown in Figure 13 withthe adhesive film preventing the shattered glassfragments from falling.
Advances in Structural Engineering Vol. 17 No. 10 2014 1487
S. Sivanerupan, J.L. Wilson, E.F. Gad and N.T.K. Lam
Figure 11. Test #1 - Failure of a glass panel
Spider arm in compression
Deforms away from the support structure
Deforms towards the support structure
Spinder arm intension
Figure 12. Test #1 - Differential movement of the spider arms in
the out-of-plane direction
Figure 13. Test #2 - Failure of a glass panel

It was observed during the racking test that the glasspanels translated and the spider arms moved verticallywithin the slotted hole connection to the structuralsupport frame cleat. Damage along the vertical siliconsealant was noticed at a 2.0% drift. Beyond a drift of3.3% there was no capability for further rigid bodytranslations as the spider arms were almost bearing onthe edges of the circular and slotted holes andconsequently the spider arms began to deform toaccommodate further drift. This resulted in both in-plane and out-of-plane deformations of the spider armfixings, and created excessive bending and tensilestresses in the glass, before catastrophic failure at a largedrift 5.25%.
A simple truss analysis was carried out to determinethe loading actions (tension or compression) in thepanels as shown in Figure 14 (where ‘PA’ is panel ‘A’and B4 is bolt 4) together with the possible verticalmovement direction of the spider arms. The initial (red)and the final (blue) locations of the panels are shown toscale in Figure 15 and demonstrate the translations androtations that occurred in the glass panels before failure.The vertical displacement of the spider arm to glassbolted connection is plotted in Figure 16 whilst therelative vertical measurement of the internal spider armis shown in Figure 17 after failure of the system. Theout-of-plane deformation of the glass panel is plotted inFigure 18 and illustrated in Figure 19 whilst the damageand yielding of the spider arm fixings at failure is shownin Figure 20.
The racking load applied to the structural supportframe was transferred to the glass panel via the spiderarms resulting in diagonal axial tension andcompression forces as shown in Figure 14. Similar toTest #1, the support frame and glass panels weretranslating in different planes, which caused the out-of-plane deformation of the spider arms which theninduced bending stresses in the glass panels in thevicinity of the point fixed connections. The inducedcombined local bending and axial tensile stresses in theglass panels, particularly around the bolt holes, causedthe catastrophic failure at a large drift 5.25%.
3.3. Ultimate Fracture Strength of Toughened
Glass
During glass failure, the crack front propagates throughthe material, creating fracture features known as themirror, mist, and hackle (Figure 21). The crack frontinitially produces the smooth mirror region. However,as the crack accelerates it becomes more unstable,creating a dimpled surface known as mist. Thisinstability eventually causes the crack to branch out,producing the rough hackle region. The hackle region ischaracterised by elongated markings that proceed in thedirection of crack propagation. The hackle markingspoint back to the flaw origin (Frechette 1990).
The ultimate fracture strength of glass can bemeasured using an empirical expression. The radius ofthe mirror is inversely proportional to the square of thestress when the mirror was formed and it may be used tocalculate the stress at the instant of fracture. Fromfracture mechanics analysis, the radius of the mirror alsorelates to the critical size of the flaw and the time to
1488 Advances in Structural Engineering Vol. 17 No. 10 2014
Drift Performance of Point Fixed Glass Façade Systems
B2
B4
B4 B4
B3B3
B3 B3
B4
B2 B1B1 B2
B2B1B1
Tension
Glass panel (PA)
Glass panel (PC)
Glass panel (PB)
Glass panel (PD)
Compression
Figure 14. Test #2 - Glass panels and spider arms configuration
including the sliding directions of the spider arms bases
Translation of the glass panels at the drill holes2500
2000
1500
1000
500
00 500 1000 1500
Width (mm)
2000 2500
Hei
ght (
mm
)
Figure 15. Test #2 - Translation of the glass panels at the bolt holes

catastrophic failure under fatigue conditions (Shinkai1994). The stress that initiates the fracture, fr can befound from the Eqn 2 (Shand 1959):
(2)
In this equation, fr is the tensile stress in MPa and ‘r’is the ‘mirror radius’ in metres. This equation has beenfound to be reasonable for a variety of sample sizes andsurface conditions. Measurement of the mirror radiusparallel to the surface of the sample has been found toproduce the most reliable results (Brungs and Sugeng1995). In Test #2 the broken glass panel wasinvestigated and the fracture origin was identified. The‘mirror radius’ was measured to be r = 6 mm at the glasshole where the crack originated as illustrated in Figure 22
frr =
2 14.
and the effective tensile stress at the edge of the holewhere the fracture originated was approximately 28 MPa (Eqn 2). Conservatively, the minimum pre-compressive stress at the edge of the hole should be 69 MPa which is the minimum toughening stress givenin AS1288 (2006). Therefore, the applied tensile stressdue to the racking loads to overcome the pre-compression and cause tensile failure could beestimated to be around 97 MPa. This was approximatelyequal to the 94 MPa nominal strength of 12 mm thicktoughened glass panel at the bolt hole specified in theAustralian standard AS1288 (2006).
4. ANALYTICAL MODELLINGDetailed three-dimensional non-linear finite elementmodels (FE models) were developed using ANSYSfinite element software and benchmarked against thelaboratory experimental results. FE models were created(Figure 23) with a number of features to represent thein-plane racking behaviour, including;
• The structural façade support frame, spider armsand M10 bolts to connect the spider arms to theglass panels were modelled using beamelements,
• Non-linear spring elements were used to modelthe frictional torsional moment versus rotation atthe spider arm connection,
• The translations between (a) bolt fittings andspider arm and (b) spider arm and supportstructure were modelled using non-linearsprings,
Advances in Structural Engineering Vol. 17 No. 10 2014 1489
S. Sivanerupan, J.L. Wilson, E.F. Gad and N.T.K. Lam
Ver
tical
mov
emen
t (m
m)
35
30
25
20
15
10
5
In-plane drift (%)
0
–5
–10
–15
PAB1
PAB2
PAB3
PAB4
PBB2
PBB4
PCB3
PCB4
PDB3
PDB4
Figure 16. Test #2 - Displacement and yielding of the spider arms in the vertical direction
PAB4PAB4PBB3
PBB3
Figure 17. Test #2 - Relative movement between adjacent glass
panels

• Spring properties were specified with non-linearload versus deflection curves to represent theoversize holes for construction tolerance and thebearing effects (gaps closed),
1490 Advances in Structural Engineering Vol. 17 No. 10 2014
Drift Performance of Point Fixed Glass Façade Systems
0 0.5
In-plane drift (%)
1 1.5 2 2.5 3 3.5 4 4.5 5
11
10
9
8
7
6
5
Def
orm
atio
n (m
m)
4
3
2
1
0
PDB2 to PBB4
PAB3 to PCB1
Figure 18. Test #2 - Differential out-of-plane movement of the spider arms measured
PAB1
PAB3
Figure 19. Test #2 - Out-of-plane deformation of the spider arm
PAB3 and PCB1
PCB3
Spider arm baseplate yielded
PDB4
(a) Yielded spider arm PCB3 due to compression
(b) Yielded spider arm and base plate PDB4 due to tension
Figure 20. Test #2 – Spider arm deformations
2r
Flaworigin
Mirror
Mist
Hackle
Figure 21. Schematic diagram of a typical glass failure or crack
origin (Castilone et al. 2002)
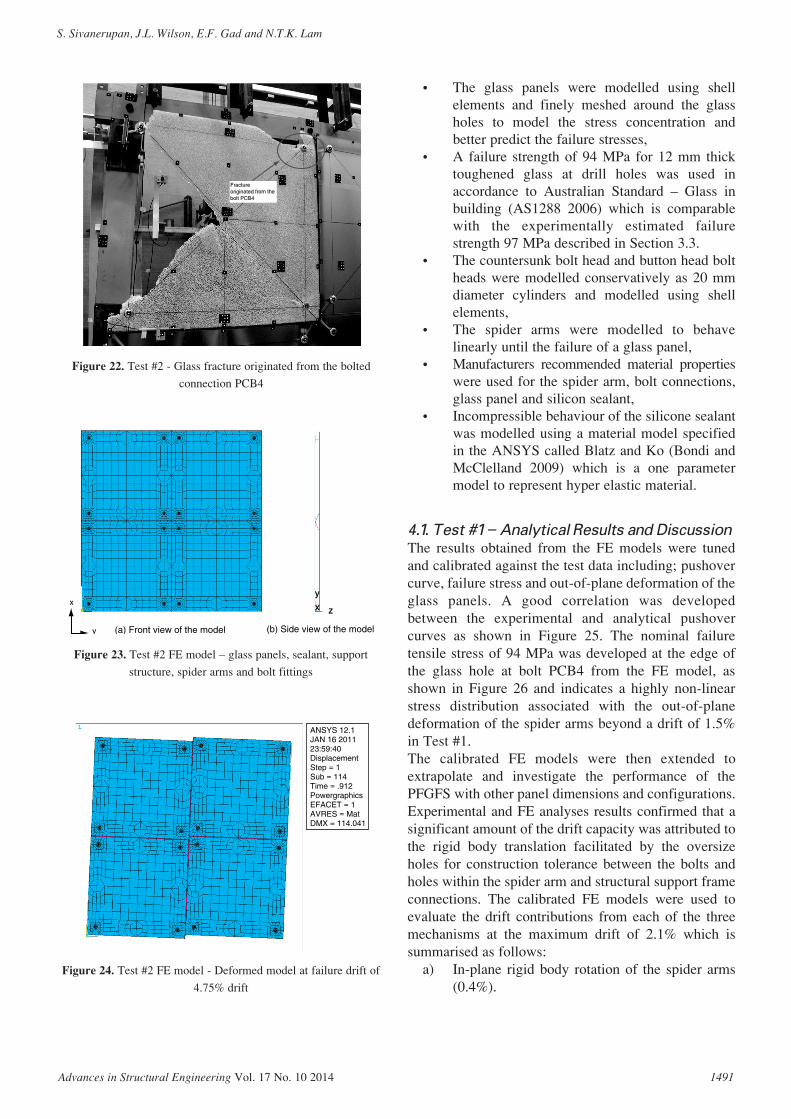
• The glass panels were modelled using shellelements and finely meshed around the glassholes to model the stress concentration andbetter predict the failure stresses,
• A failure strength of 94 MPa for 12 mm thicktoughened glass at drill holes was used inaccordance to Australian Standard – Glass inbuilding (AS1288 2006) which is comparablewith the experimentally estimated failurestrength 97 MPa described in Section 3.3.
• The countersunk bolt head and button head boltheads were modelled conservatively as 20 mmdiameter cylinders and modelled using shellelements,
• The spider arms were modelled to behavelinearly until the failure of a glass panel,
• Manufacturers recommended material propertieswere used for the spider arm, bolt connections,glass panel and silicon sealant,
• Incompressible behaviour of the silicone sealantwas modelled using a material model specifiedin the ANSYS called Blatz and Ko (Bondi andMcClelland 2009) which is a one parametermodel to represent hyper elastic material.
4.1. Test #1 – Analytical Results and Discussion
The results obtained from the FE models were tunedand calibrated against the test data including; pushovercurve, failure stress and out-of-plane deformation of theglass panels. A good correlation was developedbetween the experimental and analytical pushovercurves as shown in Figure 25. The nominal failuretensile stress of 94 MPa was developed at the edge ofthe glass hole at bolt PCB4 from the FE model, asshown in Figure 26 and indicates a highly non-linearstress distribution associated with the out-of-planedeformation of the spider arms beyond a drift of 1.5%in Test #1.The calibrated FE models were then extended toextrapolate and investigate the performance of thePFGFS with other panel dimensions and configurations.Experimental and FE analyses results confirmed that asignificant amount of the drift capacity was attributed tothe rigid body translation facilitated by the oversizeholes for construction tolerance between the bolts andholes within the spider arm and structural support frameconnections. The calibrated FE models were used toevaluate the drift contributions from each of the threemechanisms at the maximum drift of 2.1% which issummarised as follows:
a) In-plane rigid body rotation of the spider arms(0.4%).
Advances in Structural Engineering Vol. 17 No. 10 2014 1491
S. Sivanerupan, J.L. Wilson, E.F. Gad and N.T.K. Lam
Fractureoriginated from thebolt PCB4
Fractureoriginated from thebolt PCB4
Figure 22. Test #2 - Glass fracture originated from the bolted
connection PCB4
(a) Front view of the model (b) Side view of the model
x
y
YY
XX ZZ
yy
xx
Figure 23. Test #2 FE model – glass panels, sealant, support
structure, spider arms and bolt fittings
ANSYS 12.1JAN 16 201123:59:40DisplacementStep = 1Sub = 114 Time = .912PowergraphicsEFACET = 1AVRES = MatDMX = 114.041
Figure 24. Test #2 FE model - Deformed model at failure drift of
4.75% drift
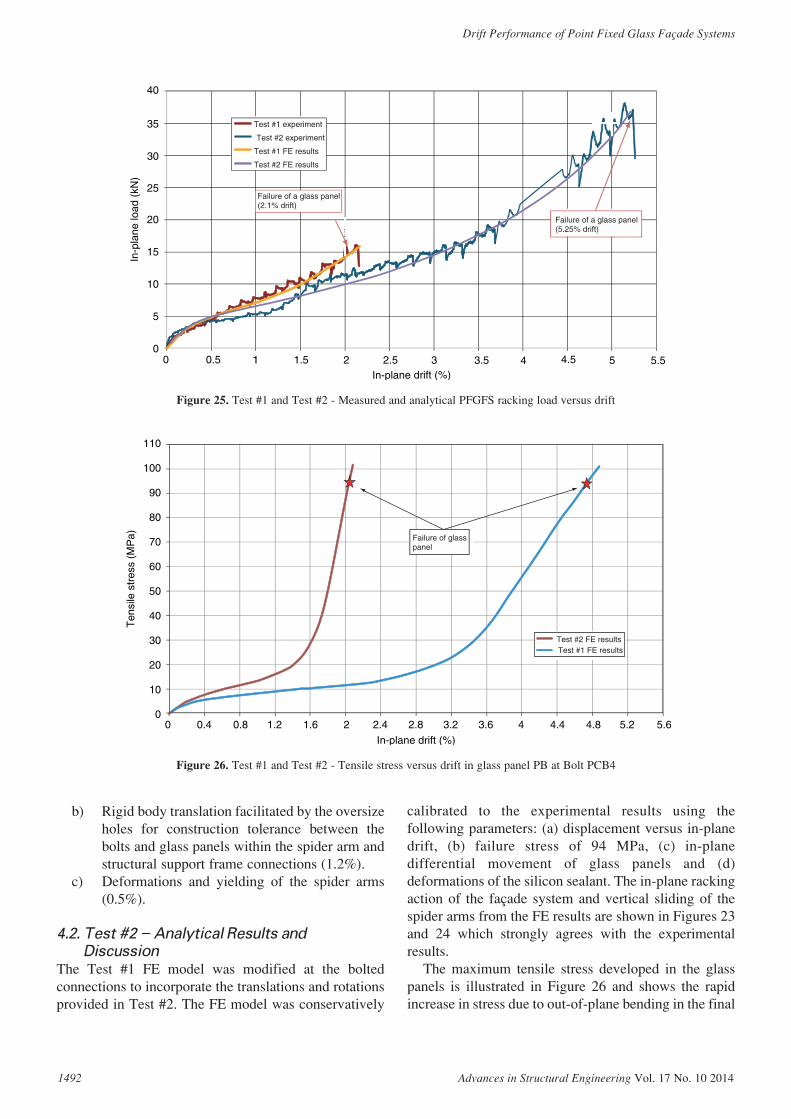
b) Rigid body translation facilitated by the oversizeholes for construction tolerance between thebolts and glass panels within the spider arm andstructural support frame connections (1.2%).
c) Deformations and yielding of the spider arms(0.5%).
4.2. Test #2 – Analytical Results and
Discussion
The Test #1 FE model was modified at the boltedconnections to incorporate the translations and rotationsprovided in Test #2. The FE model was conservatively
calibrated to the experimental results using thefollowing parameters: (a) displacement versus in-planedrift, (b) failure stress of 94 MPa, (c) in-planedifferential movement of glass panels and (d)deformations of the silicon sealant. The in-plane rackingaction of the façade system and vertical sliding of thespider arms from the FE results are shown in Figures 23and 24 which strongly agrees with the experimentalresults.
The maximum tensile stress developed in the glasspanels is illustrated in Figure 26 and shows the rapidincrease in stress due to out-of-plane bending in the final
1492 Advances in Structural Engineering Vol. 17 No. 10 2014
Drift Performance of Point Fixed Glass Façade Systems
40
35
30
25
20
15
10
5
00 0.5 1 1.5 2 2.5 3 3.5 4.5 5 5.54
Test #1 experiment
Test #2 experiment
Test #1 FE results
Test #2 FE results
Failure of a glass panel(2.1% drift)
Failure of a glass panel(5.25% drift)
In-plane drift (%)
In-p
lane
load
(kN
)
Figure 25. Test #1 and Test #2 - Measured and analytical PFGFS racking load versus drift
Failure of glasspanel
Test #2 FE resultsTest #1 FE results
In-plane drift (%)
Ten
sile
str
ess
(MP
a)
0 0.4 0.8 1.2 1.6 2
110
100
90
80
70
60
50
40
30
20
10
02.4 2.8 3.2 3.6 4 4.4 4.8 5.2 5.6
Figure 26. Test #1 and Test #2 - Tensile stress versus drift in glass panel PB at Bolt PCB4

25% of the drift capacity. Interestingly, as observed inthe experimental test, the maximum tensile stressoccurred at PCB4. The failure stress in the glass paneldeveloped at a lateral displacement of 114 mm (4.75%drift) compared to 5.25% drift in the experiment with alateral force of 35 kN as shown in Figure 25. Furtherdetailed FE analyses were conducted to proportion theracking capacity from each mechanism.
The FE results showed that the applied racking driftof 4.7% was accommodated by three mechanisms:
a) Rigid body vertical translation of the spiderarms at the base slotted hole connection to thesupport frame (2.9%).
b) Rigid body translation facilitated by the oversizehole connections between the spier arm and theglass panels (1.3%).
c) Deformations and yielding of the spider arms(0.5%).
The FE results showed that the major contribution ofthe drift capacity was obtained from the verticaltolerance of the spider arm slotted hole connections tothe support frame. This rigid body translation isequivalent to a rocking mechanism as shown in Figure27. Trigonometric expressions were used to verify thedrift capacities ‘γ’ and the horizontal displacements ‘∆’associated with the rigid body translation of the glasspanels resulting from the vertical translations at thespider arm base slotted hole connections as follows:
(3a)∆ = h . Tan = h.s
bθ
(3b)
where, “h” is the height of the PFGFS, “s” is themaximum possible vertical tolerance in the spider armbase slotted hole and ‘b’ is the width of a glass panel.
The drift in Test #2 can be calculated from Eqn 3b:
A maximum 2.92% drift can be attributed to the rigidbody translation at the spider arm base slotted holewhich is very similar to the FE results of 2.9% drift.From Eqn 3b the drift contribution from the verticaltranslation at the spider arm base hole depends on thedimensions ‘s’ and ‘b’. Clearly, if wider panels are usedwith the same spider arm the drift capacity of the systemwill be reduced whilst if narrower panels are used thedrift capacity can be increased. Further detailedparametric study and in-plane drift calculationprocedures for the façade system using FE models arepresented in Sivanerupan (2011).
5. SUMMARY AND CONCLUSIONSA unique research project has been undertaken by theauthors to evaluate the in-plane racking performance ofstandard PFGFS in the lower seismic regions. Theresearch involved both experimental and analyticalracking studies of PFGFS with toughened glass panelsto develop a push-over or load versus in-plane driftcapacity for the system. The two tests completedindicated that the PFGFS with pinned X-type and fixedK-type spider arms had surprisingly large in-plane driftcapacities caused by rigid body translation of the glasspanels at the oversize holes for construction tolerance ,spider arm rotation (Test #1), spider arm verticaltranslation (Test #2) and deformation of the spider armcomponents. Overall the drift capacities for Test #1(pinned X-type spider arm) and Test #2 (fixed K-typespider arm) were 2.1% and 5.25% respectively.
In Test #1, the maximum drift of 2.1% was muchlarger than initially anticipated and demonstrated thatthe 2x2 system was surprisingly able to sustain highlevel of in-plane drift. The glass panel rigid bodytranslation, spider arms rotation and deformationsallowed the system to move laterally and created theincreased drift capacity. A significant amount of out-of-plane movement was observed with a maximumdifferential movement of approximately 8.5 mm. Thisout-of-plane movement induced combined localbending and tensile stresses in the glass particularlyaround the spider arm bolted connection to the glasspanel resulting in the initiation of cracking andcatastrophic failure of a glass panel.
γ = × =35
1200100 2 92% . %
γ = ×s
b100%
Advances in Structural Engineering Vol. 17 No. 10 2014 1493
S. Sivanerupan, J.L. Wilson, E.F. Gad and N.T.K. Lam
Glass panel (PB)Glass panel (PA)
Glass panel (PC) Glass panel (PD)
Sθ
θθ
s
Sθ θ
θ
h
∆
Figure 27. Test #2 – Rigid body mechanism of the glass panels
under in-plane racking load

In Test #2, the maximum drift of 5.25% (143 mm)was much larger than initially anticipated anddemonstrated that the 2x2 system had significant driftcapacity. Damage along the vertical silicon sealant wasnoticed at 2.0% drift whilst the spider arms began todeform at 3.3% drift with the base plate of the spiderarms commencing to yield. The system continued todeform until failure of a glass panel at 5.25% drift dueto excessive bending stresses (from out-of-planedisplacement of the spider arms) combined with the in-plane diagonal tensile stresses.
Sophisticated non-linear finite element models weredeveloped and conservatively benchmarked against theexperimental results with excellent correlation in terms ofload-deflection behaviour, failure stress and out-of-planedeformation of the glass panels. FE results confirmed thatin all 2x2 façade grid systems the applied rackingdisplacement was accommodated by three mechanismswith the majority of the drift facilitated by the built-inoversize holes in the spider arm connections to the glassand the support frame. The calculated drift contributionsfrom each of the three mechanisms for Test #1 at themaximum drift of 2.1% is summarised as follows:
a) In-plane rigid body rotation of the spider arms(0.4%).
b) Rigid body translation associated with theoversize holes of the spider arm connections(1.2%).
c) Deformations and yielding of the spider arms(0.5%).
The calculated drift contributions from each of thethree mechanisms for Test #2 at the maximumcalculated drift of 4.7% is summarised below:
a) Rigid body translation associated with theslotted holes of the connections to the supportframe (2.9%).
b) Rigid body translation associated with theoversize holes of the spider arm to glassconnections (1.3%).
c) Deformations and yielding of the spider arms(0.5%).
Trigonometric expressions were used to verify the driftcapacities from the significant rigid body translation atthe spider arm slotted hole connections to the supportframe for Test #2. The expressions can be confidentlyextrapolated to undertake parametric studies and evaluatethe in-plane drift capacity of other PFGFS systems withdifferent panel dimensions and configurations. Theperformance of the façade system under extremeearthquake or wind loads can then be assessed bycomparing the drift demand from analytical studies of thebuilding superstructure with the performance driftcapacity curves of PFGFS described in this paper.
ACKNOWLEDGEMENTSSupport funding by the Australian Research Councilthrough DP0772088 ‘Collapse modelling of soft storeybuildings’ is gratefully acknowledged. The authors arevery grateful to the Australian Earthquake EngineeringSociety for a financial contribution towards the testingprogram, to the industry sponsors Australian GlassAssemblies and Viridian World Glass for supplying thespider arm fittings and the glass panels, to Dr DavidHeath for his assistance with the photogrammetrymeasurement and to the Melbourne Testing Services forassistance with testing.
REFERENCESAS1288 (2006). Glass in Buildings - Selection and Installation,
Australian Standard, Standards Australia Limited, Sydney, Austalia.
ASCE7-10 (2010). Minimum Design Loads for Buildings and Other
Structures, The American Society of Civil Engineers, Virginia,
USA.
Behr, R.A. (1998). “Seismic performance of architectural glass in
mid-rise curtain wall”, Journal of Architectural Engineering,
Vol. 4, No. 3, pp. 94–98.
Behr, R.A. and Belarbi, A. (1996). “Seismic test methods for
architectural glazing systems”, Earthquake Spectra, Vol. 12, No.
1, pp 129–143.
Behr, R.A., Belarbi, A. and Brown, T.A. (1995). “Seismic performance
of architectural glass”, Earthquake Spectra, Vol. 11, No. 3.
Bondi, S. and McClelland, N. (2009). “Capturing structural silicone
non-linear behaviour via the finite element method”, Glass
Processing Days 2009, Tampere, Finland, pp. 183–185.
Brungs, M.P. and Sugeng, X.Y. (1995). “Some solutions to the
nickel sulphide problem in toughened glass”, Glass Technology,
Vol. 36, No. 4.
Castilone, R.J., Glaesemann, G.S. and Hanson, T.A. (2002).
“Relationship between mirror dimensions and failure stress for
optical fibers”, Optical Fiber and Fiber Component Mechanical
Reliability and Testing II, Proceedings of SPIE, Vol. 4639 (2002).
CBC (2002). California Building Code: California Code of
Regulations, Title 24, Part 2 ,Vol. 1, Californaia Building
Standards Commission and the International Conference of
Bulding Officials, Californaia, USA.
Desai, P., Golmohammadi, A., Garlipp, R. and Gowda, B. (2005).
“New point supported glass seismic system”. Proceedings of the
First International Conference on Advances in Experimental
Structural Engineering (AESE 2005), Nagoya, Japan.
Frechette, V. (1990). Failure Analyses of Brittle Material; Advances
in Ceramics, The American Ceramic Society, Westerville, USA.
Gowda, B. and Heydari, N. (2009). “High displacement glass
seismic systems”, Practice Periodical on Structural Design and
Construction, ASCE, Vol. 15, No. 2, pp. 170–176.
Memari, A.M., Behr, R.A. and Kremer, P.A. (2003). “Seismic
behaviour of curtain walls containing insulating glass units”,
Journal of Architectural Engineering, Vol. 9, No. 2, pp, 70–85.
1494 Advances in Structural Engineering Vol. 17 No. 10 2014
Drift Performance of Point Fixed Glass Façade Systems

Memari, A.M., Behr, R.A. and Kremer, P.A. (2004). “Dynamic
racking crescendo tests on architectural glass fitted with anchored
pet film”, Journal of Architectural Engineering, Vol. 10, No. 1,
pp. 5–14.
Sivanerupan, S. (2011). In-Plane Seismic Performance of Glass
Facade Systems, PhD Thesis, Swinurne University of Technolgy,
Victoria, Australia.
Shand, E.B. (1959). “Breaking stress of glass determined from
dimensions of fracture mirrors”, Journal of the American
Ceramic Society, Vol. 42, No. 10, pp. 474–477.
Shinkai, N. (1994). The Nature and Fractography of Flat Glass,
Fractography of Glass, Plenum Press, New York, USA, pp.
253–297.
Sivanerupan, S., Wilson, J., Gad, E. and Lam, N. (2014). “In-plane
drift capacity of contemporary point fixed glass façade
systems”, Journal of Architectural Engineering, Vol. 20, No. 1,
pp. 1–9.
Sivanerupan, S., Wilson, J.L. and Gad, E.F. (2011). “Structural
analysis and design of glazed curtain wall systems”, Australian
Journal of Structural Engineering, Vol. 12, No. 1, pp. 57–67.
Advances in Structural Engineering Vol. 17 No. 10 2014 1495
S. Sivanerupan, J.L. Wilson, E.F. Gad and N.T.K. Lam


Copyright of Advances in Structural Engineering is the property of Multi-Science PublishingCo Ltd and its content may not be copied or emailed to multiple sites or posted to a listservwithout the copyright holder's express written permission. However, users may print,download, or email articles for individual use.


