Dealing With Concept Drifts in Process Mining · crucial to discover and understand such concept...
23
R.P. Jagadeesh Chandra Bose, Wil M.P. van der Aalst, I. ˇ Zliobait˙ e and M. Pechenizkiy Department of Mathematics and Computer Science, Eindhoven University of Technology, The Netherlands. Abstract. Although most business processes change over time, contem- porary process mining techniques tend to analyze these processes as if they are in steady-state. Processes may change suddenly or gradually. The drift may be periodic (e.g. due to seasonal influences) or one-of-a- kind (e.g., the effects of new legislation). For process management it is crucial to discover and understand such concept drifts in processes. In this paper, we present a case study of analyzing concept drifts in three different processes within a large Dutch municipality. 1 Introduction In recent years process mining techniques have matured. Provided that the pro- cess is stable and enough example traces have been recorded in the event log, it is possible to discover a high-quality process model that can be used for perfor- mance analysis, compliance checking, and prediction. Unfortunately, most pro- cesses are not in steady-state. In today’s dynamic marketplace, it is increasingly necessary for enterprises to streamline their processes so as to reduce costs and to improve performance. Moreover, today’s customers expect organizations to be flexible and adapt to changing circumstances. New legislations such as the WABO act [1] and the Sarbanes-Oxley Act [2], extreme variations in supply and demand, seasonal effects, natural calamities and disasters, deadline esca- lations [3], etc., are also forcing organizations to change their processes. For example, governmental and insurance organizations reduce the fraction of cases being checked when there is too much work in the pipeline. In case of a disaster, hospitals and banks change their operating procedures etc. It is evident that the economic success of an organization is more and more dependent on its ability to react and adapt to changes in its operating environment. Concept drift refers to the situation in which the process is changing while being analyzed. There is a need for techniques that deal with such second order dynamics. Analyzing such changes is of utmost importance when supporting or improving operational processes and to get an accurate insight on process executions at any instant of time. The remainder of this paper is organized as follows. Section 2 provides the background on change detection techniques based on hypothesis tests. The case Dealing With Concept Drifts in Process Mining IEEE TRANSACTIONS ON NEURAL NETWORKS AND LEARNING SYSTEMS VOL:25 NO:1 YEAR 2014
-
Upload
truongxuyen -
Category
Documents
-
view
217 -
download
0
Transcript of Dealing With Concept Drifts in Process Mining · crucial to discover and understand such concept...

R.P. Jagadeesh Chandra Bose, Wil M.P. van der Aalst, I. Zliobaite andM. Pechenizkiy
Department of Mathematics and Computer Science,Eindhoven University of Technology, The Netherlands.
Abstract. Although most business processes change over time, contem-porary process mining techniques tend to analyze these processes as ifthey are in steady-state. Processes may change suddenly or gradually.The drift may be periodic (e.g. due to seasonal influences) or one-of-a-kind (e.g., the effects of new legislation). For process management it iscrucial to discover and understand such concept drifts in processes. Inthis paper, we present a case study of analyzing concept drifts in threedifferent processes within a large Dutch municipality.
1 Introduction
In recent years process mining techniques have matured. Provided that the pro-cess is stable and enough example traces have been recorded in the event log, itis possible to discover a high-quality process model that can be used for perfor-mance analysis, compliance checking, and prediction. Unfortunately, most pro-cesses are not in steady-state. In today’s dynamic marketplace, it is increasinglynecessary for enterprises to streamline their processes so as to reduce costs andto improve performance. Moreover, today’s customers expect organizations tobe flexible and adapt to changing circumstances. New legislations such as theWABO act [1] and the Sarbanes-Oxley Act [2], extreme variations in supplyand demand, seasonal effects, natural calamities and disasters, deadline esca-lations [3], etc., are also forcing organizations to change their processes. Forexample, governmental and insurance organizations reduce the fraction of casesbeing checked when there is too much work in the pipeline. In case of a disaster,hospitals and banks change their operating procedures etc. It is evident that theeconomic success of an organization is more and more dependent on its abilityto react and adapt to changes in its operating environment. Concept drift refersto the situation in which the process is changing while being analyzed. Thereis a need for techniques that deal with such second order dynamics. Analyzingsuch changes is of utmost importance when supporting or improving operationalprocesses and to get an accurate insight on process executions at any instant oftime.
The remainder of this paper is organized as follows. Section 2 provides thebackground on change detection techniques based on hypothesis tests. The case
Dealing With Concept Drifts in Process Mining
IEEE TRANSACTIONS ON NEURAL NETWORKS AND LEARNING SYSTEMS VOL:25 NO:1 YEAR 2014

study of analyzing concept drifts in three processes of a large Dutch municipalityis presented in Section 3. Section 4 concludes the paper.
2 Background
Processes can change in with respect to the three main process perspectives, viz.,control-flow, data, and resource. Such changes are perceived to induce a drift inthe concept (process behavior), e.g., in the way which activities are executedwhen, how, and by whom. There are three topics when dealing with conceptdrifts in process mining.
1. Change Point Detection: The first and most fundamental problem is to de-tect concept drift in processes, i.e., to detect that a process change has takenplace. If so, the next step is to identify the time periods at which changeshave taken place. For example, by analyzing an event log from an organiza-tion (deploying seasonal processes), one should be able to detect that processchanges happen and that the changes happen at the onset of a season.
2. Change Localization and Characterization: Once a point of change has beenidentified, the next step is to characterize the nature of change, and identifythe region(s) of change (localization) in a process. Uncovering the natureof change is a challenging problem that involves both the identification ofchange perspective (e.g., control-flow, data, resource, sudden, gradual, etc.)and the identification of the exact change itself. For example, in the exampleof a seasonal process, the change could be that more resources are deployedor that special offers are provided during holiday seasons.
3. Change Process Discovery: Having identified, localized, and characterizedthe changes, it is necessary to put all of these in perspective. There is a needfor techniques/tools that exploit and relate these discoveries. Unraveling theevolution of a process should result in the discovery of the change processdescribing the second order dynamics. For example, in the example of a sea-sonal process, one could identify that the process recurs every season. Also,one can show an animation on how the process evolved over a period of timewith annotations showing several perspectives such as the performance met-rics (service levels, throughput time, etc.) of a process at different instancesof time.
One can consider an event log L as a time series of traces (traces orderedbased on the timestamp of the first event). The basic premise in handling conceptdrifts is that the characteristics of the traces before the change point differ fromthe characteristics of the traces after the change point. The problem of change(point) detection is then to identify the points in time when the process haschanged, if any. Change point detection involves two primary steps: (i) capturingthe characteristics of the traces, and (ii) identifying when these characteristicschange.
The control-flow perspective of a process characterizes the relationships be-tween activities. Dependencies between activities in an event log can be cap-
2
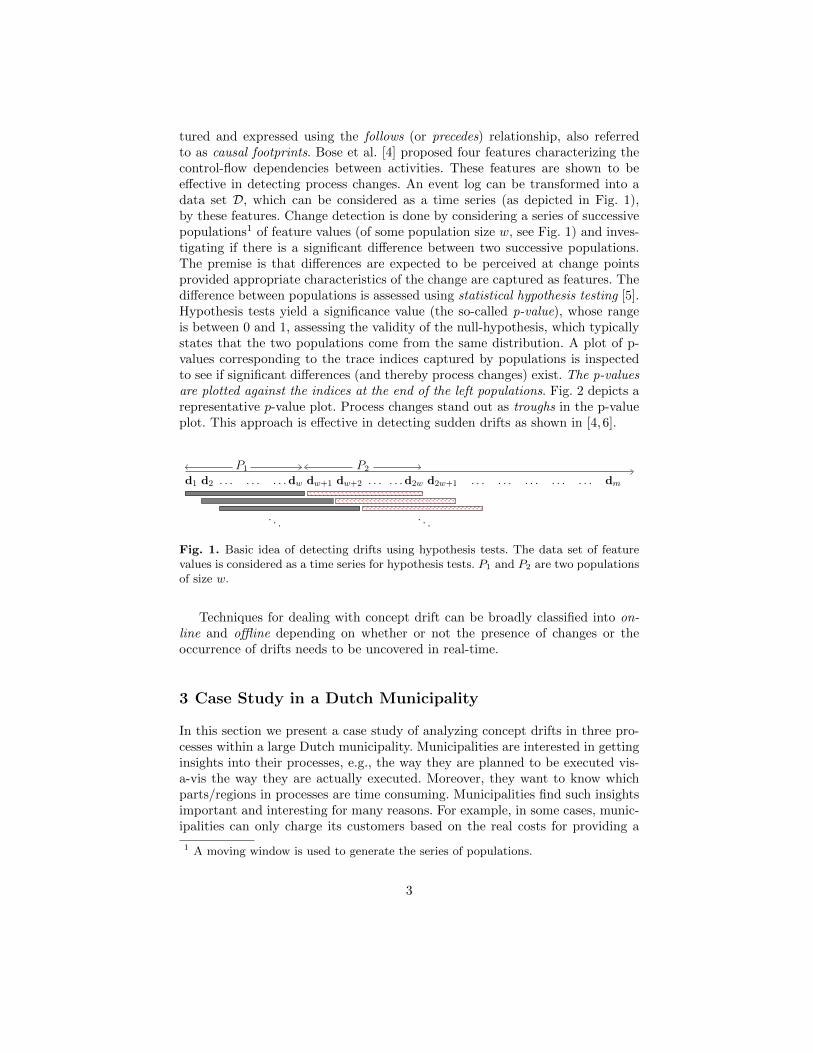
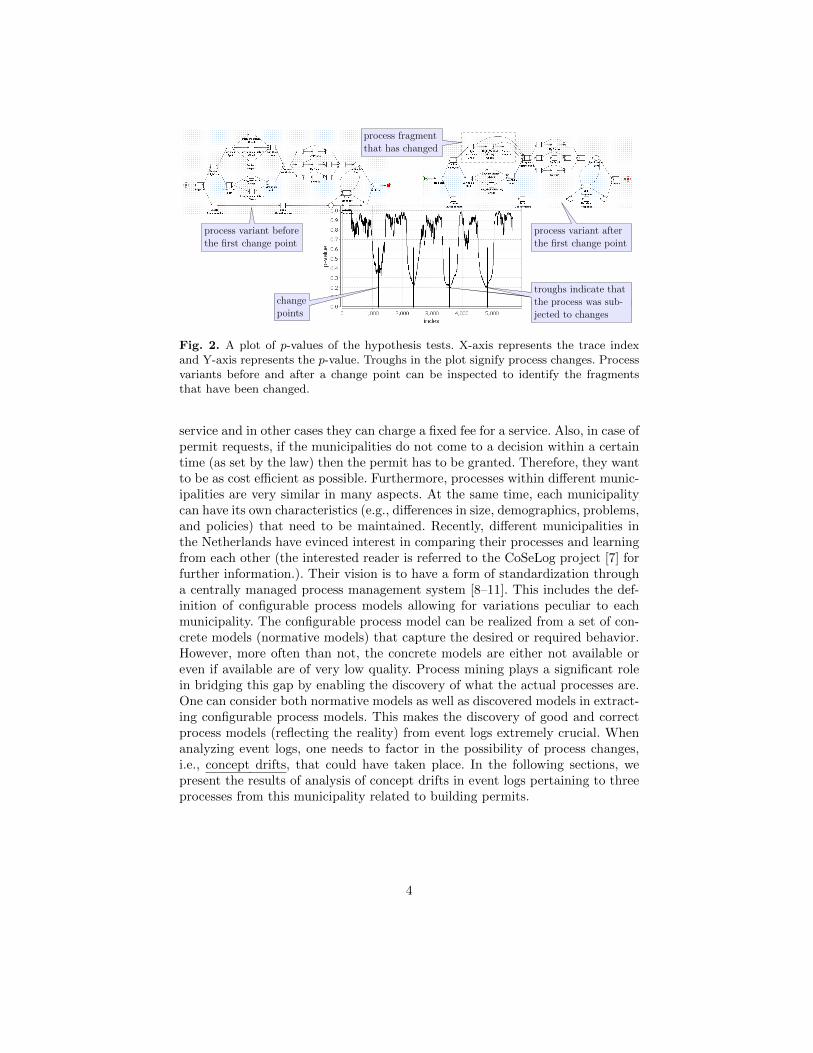
tured and expressed using the follows (or precedes) relationship, also referredto as causal footprints. Bose et al. [4] proposed four features characterizing thecontrol-flow dependencies between activities. These features are shown to beeffective in detecting process changes. An event log can be transformed into adata set D, which can be considered as a time series (as depicted in Fig. 1),by these features. Change detection is done by considering a series of successivepopulations1 of feature values (of some population size w, see Fig. 1) and inves-tigating if there is a significant difference between two successive populations.The premise is that differences are expected to be perceived at change pointsprovided appropriate characteristics of the change are captured as features. Thedifference between populations is assessed using statistical hypothesis testing [5].Hypothesis tests yield a significance value (the so-called p-value), whose rangeis between 0 and 1, assessing the validity of the null-hypothesis, which typicallystates that the two populations come from the same distribution. A plot of p-values corresponding to the trace indices captured by populations is inspectedto see if significant differences (and thereby process changes) exist. The p-valuesare plotted against the indices at the end of the left populations. Fig. 2 depicts arepresentative p-value plot. Process changes stand out as troughs in the p-valueplot. This approach is effective in detecting sudden drifts as shown in [4, 6].
d1 d2 . . . . . . . . .dw dw+1 dw+2 . . . . . .d2w d2w+1 . . . . . . . . . . . . . . . dm
P1 P2
. . . . . .
Fig. 1. Basic idea of detecting drifts using hypothesis tests. The data set of featurevalues is considered as a time series for hypothesis tests. P1 and P2 are two populationsof size w.
Techniques for dealing with concept drift can be broadly classified into on-line and offline depending on whether or not the presence of changes or theoccurrence of drifts needs to be uncovered in real-time.
3 Case Study in a Dutch Municipality
In this section we present a case study of analyzing concept drifts in three pro-cesses within a large Dutch municipality. Municipalities are interested in gettinginsights into their processes, e.g., the way they are planned to be executed vis-a-vis the way they are actually executed. Moreover, they want to know whichparts/regions in processes are time consuming. Municipalities find such insightsimportant and interesting for many reasons. For example, in some cases, munic-ipalities can only charge its customers based on the real costs for providing a
1 A moving window is used to generate the series of populations.
3
troughs indicate thatthe process was sub-jected to changes
changepoints
process variant beforethe first change point
process variant afterthe first change point
process fragmentthat has changed
Fig. 2. A plot of p-values of the hypothesis tests. X-axis represents the trace indexand Y-axis represents the p-value. Troughs in the plot signify process changes. Processvariants before and after a change point can be inspected to identify the fragmentsthat have been changed.
service and in other cases they can charge a fixed fee for a service. Also, in case ofpermit requests, if the municipalities do not come to a decision within a certaintime (as set by the law) then the permit has to be granted. Therefore, they wantto be as cost efficient as possible. Furthermore, processes within different munic-ipalities are very similar in many aspects. At the same time, each municipalitycan have its own characteristics (e.g., differences in size, demographics, problems,and policies) that need to be maintained. Recently, different municipalities inthe Netherlands have evinced interest in comparing their processes and learningfrom each other (the interested reader is referred to the CoSeLog project [7] forfurther information.). Their vision is to have a form of standardization througha centrally managed process management system [8–11]. This includes the def-inition of configurable process models allowing for variations peculiar to eachmunicipality. The configurable process model can be realized from a set of con-crete models (normative models) that capture the desired or required behavior.However, more often than not, the concrete models are either not available oreven if available are of very low quality. Process mining plays a significant rolein bridging this gap by enabling the discovery of what the actual processes are.One can consider both normative models as well as discovered models in extract-ing configurable process models. This makes the discovery of good and correctprocess models (reflecting the reality) from event logs extremely crucial. Whenanalyzing event logs, one needs to factor in the possibility of process changes,i.e., concept drifts, that could have taken place. In the following sections, wepresent the results of analysis of concept drifts in event logs pertaining to threeprocesses from this municipality related to building permits.
4
3.1 Permit Process for Advertisements
In this section, we present the results of analysis of concept drifts in event logspertaining to one of the processes related to permits for advertisements. If aperson/organization wants to advertise on a building in the Netherlands, forexample on a billboard or an illuminated sign, a permit is needed in most cases,which can be obtained from the local municipality. The municipality may chargean advertising tax or municipal tax on encroachments on or above public space(precariorechten) for advertisements visible from the public road.
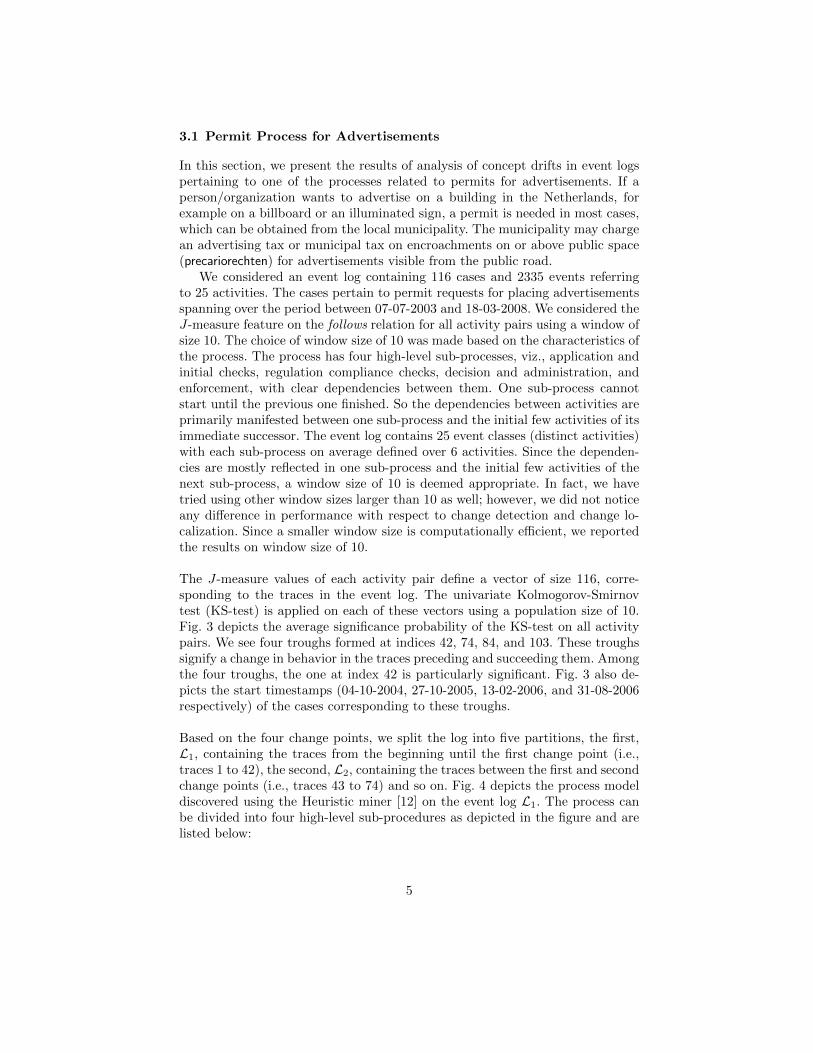
We considered an event log containing 116 cases and 2335 events referringto 25 activities. The cases pertain to permit requests for placing advertisementsspanning over the period between 07-07-2003 and 18-03-2008. We considered theJ-measure feature on the follows relation for all activity pairs using a window ofsize 10. The choice of window size of 10 was made based on the characteristics ofthe process. The process has four high-level sub-processes, viz., application andinitial checks, regulation compliance checks, decision and administration, andenforcement, with clear dependencies between them. One sub-process cannotstart until the previous one finished. So the dependencies between activities areprimarily manifested between one sub-process and the initial few activities of itsimmediate successor. The event log contains 25 event classes (distinct activities)with each sub-process on average defined over 6 activities. Since the dependen-cies are mostly reflected in one sub-process and the initial few activities of thenext sub-process, a window size of 10 is deemed appropriate. In fact, we havetried using other window sizes larger than 10 as well; however, we did not noticeany difference in performance with respect to change detection and change lo-calization. Since a smaller window size is computationally efficient, we reportedthe results on window size of 10.
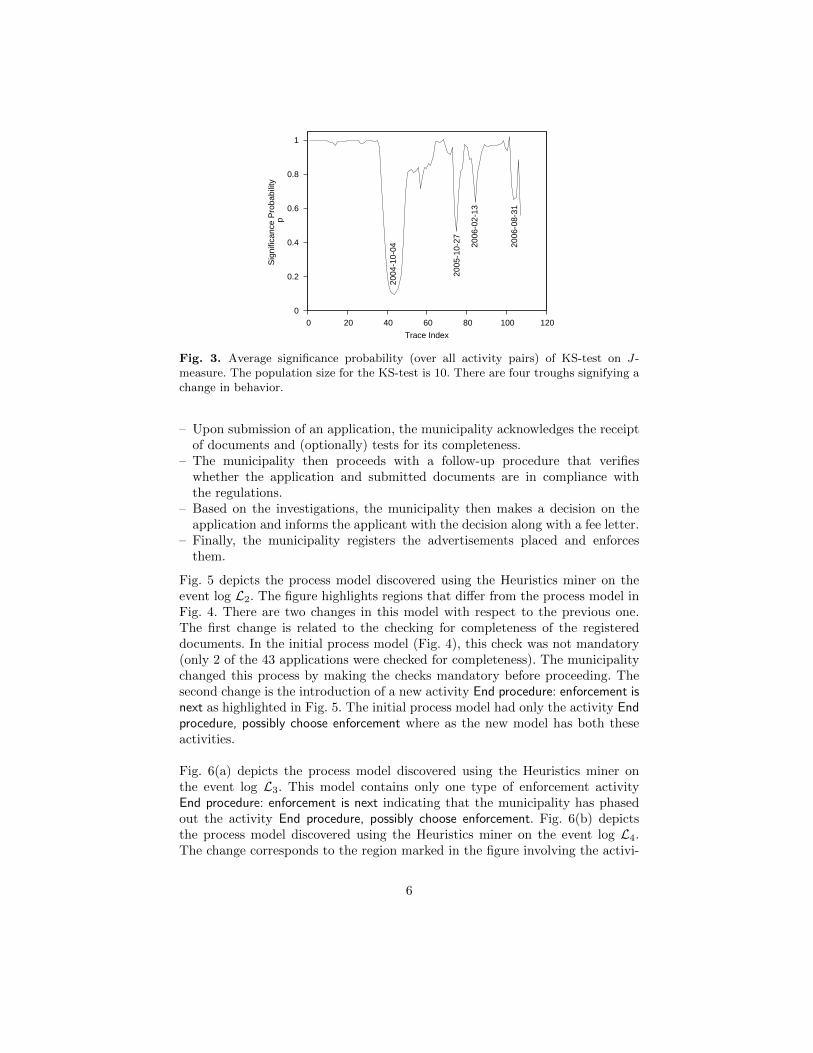
The J-measure values of each activity pair define a vector of size 116, corre-sponding to the traces in the event log. The univariate Kolmogorov-Smirnovtest (KS-test) is applied on each of these vectors using a population size of 10.Fig. 3 depicts the average significance probability of the KS-test on all activitypairs. We see four troughs formed at indices 42, 74, 84, and 103. These troughssignify a change in behavior in the traces preceding and succeeding them. Amongthe four troughs, the one at index 42 is particularly significant. Fig. 3 also de-picts the start timestamps (04-10-2004, 27-10-2005, 13-02-2006, and 31-08-2006respectively) of the cases corresponding to these troughs.
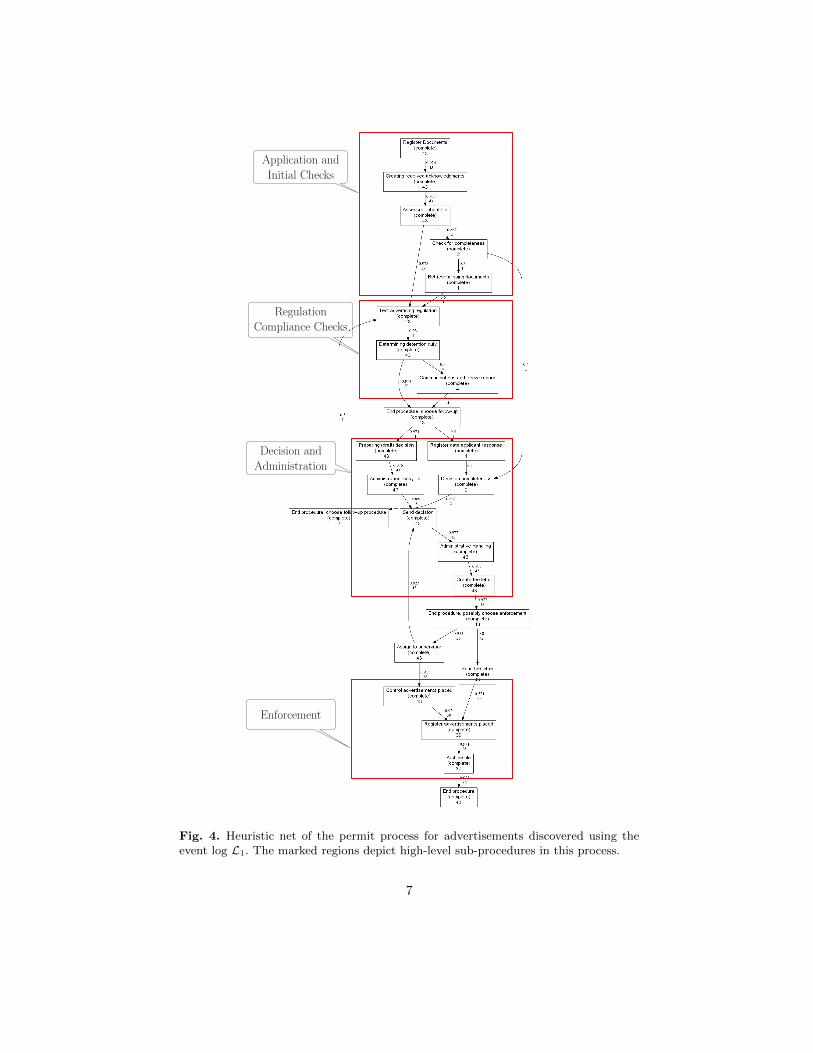
Based on the four change points, we split the log into five partitions, the first,L1, containing the traces from the beginning until the first change point (i.e.,traces 1 to 42), the second, L2, containing the traces between the first and secondchange points (i.e., traces 43 to 74) and so on. Fig. 4 depicts the process modeldiscovered using the Heuristic miner [12] on the event log L1. The process canbe divided into four high-level sub-procedures as depicted in the figure and arelisted below:
5
0
0.2
0.4
0.6
0.8
1
0 20 40 60 80 100 120
Sig
nific
ance
Pro
babi
lity
p
Trace Index
2004
-10-
04
2005
-10-
27 2006
-02-
13
2006
-08-
31
Fig. 3. Average significance probability (over all activity pairs) of KS-test on J-measure. The population size for the KS-test is 10. There are four troughs signifying achange in behavior.
– Upon submission of an application, the municipality acknowledges the receiptof documents and (optionally) tests for its completeness.
– The municipality then proceeds with a follow-up procedure that verifieswhether the application and submitted documents are in compliance withthe regulations.
– Based on the investigations, the municipality then makes a decision on theapplication and informs the applicant with the decision along with a fee letter.
– Finally, the municipality registers the advertisements placed and enforcesthem.
Fig. 5 depicts the process model discovered using the Heuristics miner on theevent log L2. The figure highlights regions that differ from the process model inFig. 4. There are two changes in this model with respect to the previous one.The first change is related to the checking for completeness of the registereddocuments. In the initial process model (Fig. 4), this check was not mandatory(only 2 of the 43 applications were checked for completeness). The municipalitychanged this process by making the checks mandatory before proceeding. Thesecond change is the introduction of a new activity End procedure: enforcement isnext as highlighted in Fig. 5. The initial process model had only the activity Endprocedure, possibly choose enforcement where as the new model has both theseactivities.
Fig. 6(a) depicts the process model discovered using the Heuristics miner onthe event log L3. This model contains only one type of enforcement activityEnd procedure: enforcement is next indicating that the municipality has phasedout the activity End procedure, possibly choose enforcement. Fig. 6(b) depictsthe process model discovered using the Heuristics miner on the event log L4.The change corresponds to the region marked in the figure involving the activi-
6
Application and
Initial Checks
Regulation
Compliance Checks
Decision and
Administration
Enforcement
Fig. 4. Heuristic net of the permit process for advertisements discovered using theevent log L1. The marked regions depict high-level sub-procedures in this process.
7

Fig. 5. Heuristic net of the permit process for advertisements discovered using the eventlog L2. The marked regions depict regions corresponding to the change in the processwhen compared to the model in Fig. 4. The municipality has now made the checks forcompleteness mandatory and introduced a new activity End procedure, enforcement isnext.
8

ties Administration: copy file and Assign to supervisor. Unlike the previous modelwhere these activities happen in a sequence, they can now be executed concur-rently. Fig. 7 depicts the process model discovered using the Heuristics mineron the event log L5. In all of the previous models, the activity Control adver-tisements placed is executed after the initiation of the enforcement procedure.However, in the model based on L5, this activity can execute concurrently withthe administrative activities once a decision has been taken.
3.2 Permit Process for Temporary Rental of Vacant Dwellings
This process corresponds to obtaining permits for temporary rental of vacantdwellings. If a person wants to rent out unoccupied dwellings, a permit fromthe municipal authorities is required. A permit is sanctioned, usually valid for aperiod of two years, if they satisfy a number of conditions.
We considered an event log containing 35 cases and 315 events referring to 10activities. The cases pertain to permit requests for temporary rental of vacantdwellings spanning over the period between 16-04-2009 and 05-01-2011. We con-sidered the window count feature on the follows relation for all activity pairsusing a window of size 4. Since the mean trace length is small (9), we consid-ered a smaller window size for feature extraction. The window count feature ofeach activity pair defines a vector of size 35, corresponding to the traces in theevent log. The univariate Kolmogorov-Smirnov test (KS-test) is applied on eachof these vectors using a population size of 6 (since we have only 35 traces, weconsidered smaller populations). Fig. 8 depicts the average significance proba-bility of the KS-test on all activity pairs. We see two troughs formed at indices11 and 17. These troughs signify a change in behavior in the traces precedingand succeeding them. Fig. 8 also depicts the start timestamps (24-11-2009 and12-02-2010 respectively) of the cases corresponding to these troughs.
Considering the two change points, we split the log into three partitions, thefirst, L1, containing the traces from the beginning until the first change point(i.e., traces 1 to 11), the second, L2, containing the traces between the firstand second change points (i.e., traces 12 to 17), and the third, L3, containingthe traces from the second change point until the end (i.e., traces 18 to 35).Fig. 9 depicts the process model discovered using the Heuristics miner [12] onthe event log L1. The documents submitted by the applicant are first registeredat the municipality (by an employee). The municipality notifies the applicant ofthe receipt of the documents and tests for its completeness. The municipalityrequests for the lease (rental agreement) of the vacant dwelling (if needed) anda decision is taken and communicated to the applicant. A fee letter is also pre-pared and sent. The preparation of the fee letter can happen before/after thedecision is sent; this is captured in the parallel construct in Fig. 9. The sendingof the fee letter can happen before/after the End procedure activity.
Fig. 10(a) depicts the process model discovered using the Heuristics miner on
9

(a) event log L3 (b) event log L4
Fig. 6. Heuristic nets of the permit process for advertisements discovered using theevent logs L3 and L4. The activity End procedure, possibly choose enforcement has beenphased out in (a) when compared to the model in Fig. 5. Unlike the model in (a), theactivities Administration: copy file and Assign to supervisor can be executed in parallelin (b).
10

Fig. 7. Heuristic net of the permit process for advertisements discovered using theevent log L5. Unlike the previous model in Fig. 6(b), the controlling of advertisementsplaced can now happen in parallel with the administrative activities once a decisionhas been taken.
11

0
0.2
0.4
0.6
0.8
1
0 5 10 15 20 25 30
Sig
nific
ance
Pro
babi
lity
p
Trace Index
2009
-11-
24
2010
-02-
12
Fig. 8. Average significance probability (over all activity pairs) of KS-test on win-dow count measure. The population size for the KS-test is 6. There are two troughssignifying a change in behavior.
Fig. 9. Heuristic net of the permit process for temporary rental of vacant dwellingsdiscovered using the event log L1.
12
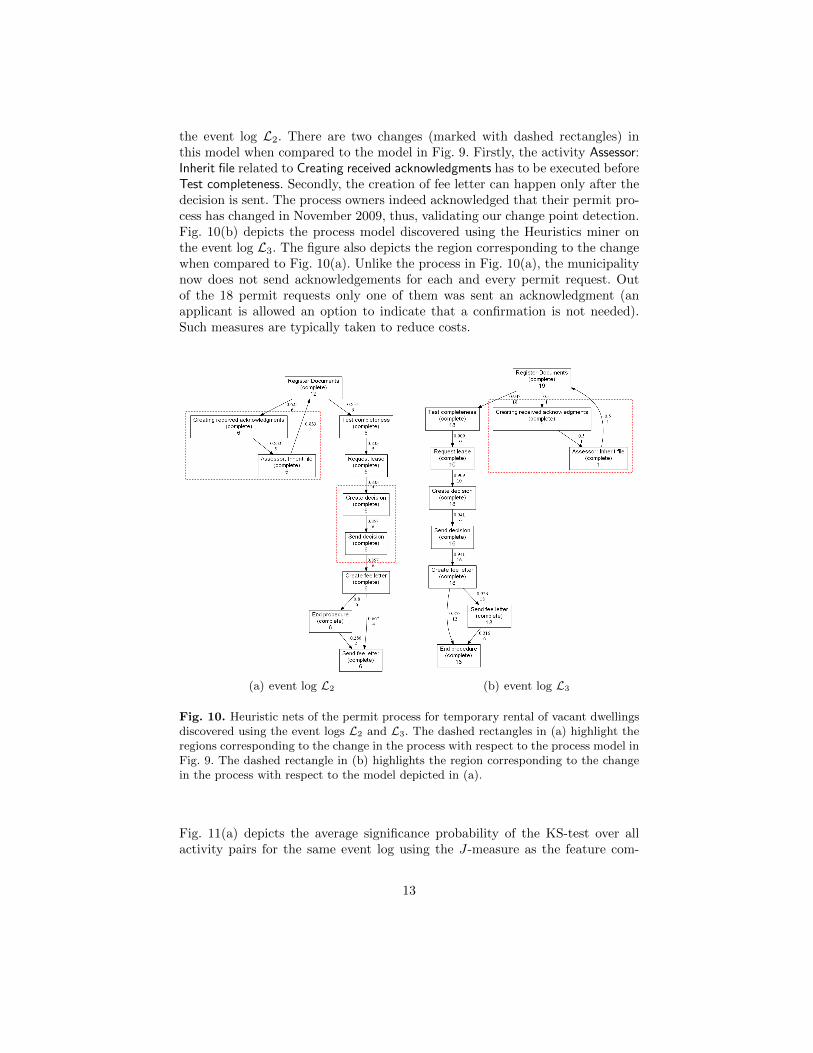
the event log L2. There are two changes (marked with dashed rectangles) inthis model when compared to the model in Fig. 9. Firstly, the activity Assessor:Inherit file related to Creating received acknowledgments has to be executed beforeTest completeness. Secondly, the creation of fee letter can happen only after thedecision is sent. The process owners indeed acknowledged that their permit pro-cess has changed in November 2009, thus, validating our change point detection.Fig. 10(b) depicts the process model discovered using the Heuristics miner onthe event log L3. The figure also depicts the region corresponding to the changewhen compared to Fig. 10(a). Unlike the process in Fig. 10(a), the municipalitynow does not send acknowledgements for each and every permit request. Outof the 18 permit requests only one of them was sent an acknowledgment (anapplicant is allowed an option to indicate that a confirmation is not needed).Such measures are typically taken to reduce costs.
(a) event log L2 (b) event log L3
Fig. 10. Heuristic nets of the permit process for temporary rental of vacant dwellingsdiscovered using the event logs L2 and L3. The dashed rectangles in (a) highlight theregions corresponding to the change in the process with respect to the process model inFig. 9. The dashed rectangle in (b) highlights the region corresponding to the changein the process with respect to the model depicted in (a).
Fig. 11(a) depicts the average significance probability of the KS-test over allactivity pairs for the same event log using the J-measure as the feature com-
13
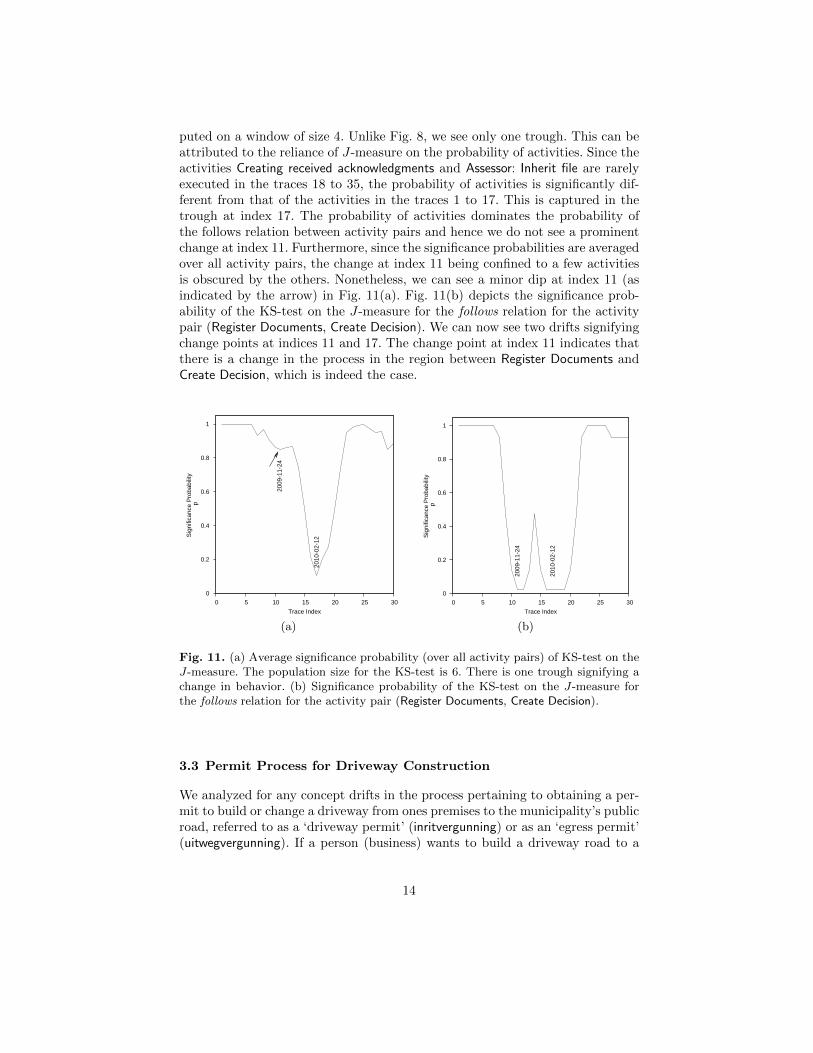
puted on a window of size 4. Unlike Fig. 8, we see only one trough. This can beattributed to the reliance of J-measure on the probability of activities. Since theactivities Creating received acknowledgments and Assessor: Inherit file are rarelyexecuted in the traces 18 to 35, the probability of activities is significantly dif-ferent from that of the activities in the traces 1 to 17. This is captured in thetrough at index 17. The probability of activities dominates the probability ofthe follows relation between activity pairs and hence we do not see a prominentchange at index 11. Furthermore, since the significance probabilities are averagedover all activity pairs, the change at index 11 being confined to a few activitiesis obscured by the others. Nonetheless, we can see a minor dip at index 11 (asindicated by the arrow) in Fig. 11(a). Fig. 11(b) depicts the significance prob-ability of the KS-test on the J-measure for the follows relation for the activitypair (Register Documents, Create Decision). We can now see two drifts signifyingchange points at indices 11 and 17. The change point at index 11 indicates thatthere is a change in the process in the region between Register Documents andCreate Decision, which is indeed the case.
0
0.2
0.4
0.6
0.8
1
0 5 10 15 20 25 30
Sig
nific
ance
Pro
babi
lity
p
Trace Index
2009
-11-
24
2010
-02-
12
(a)
0
0.2
0.4
0.6
0.8
1
0 5 10 15 20 25 30
Sig
nific
ance
Pro
babi
lity
p
Trace Index
2009
-11-
24
2010
-02-
12
(b)
Fig. 11. (a) Average significance probability (over all activity pairs) of KS-test on theJ-measure. The population size for the KS-test is 6. There is one trough signifying achange in behavior. (b) Significance probability of the KS-test on the J-measure forthe follows relation for the activity pair (Register Documents, Create Decision).
3.3 Permit Process for Driveway Construction
We analyzed for any concept drifts in the process pertaining to obtaining a per-mit to build or change a driveway from ones premises to the municipality’s publicroad, referred to as a ‘driveway permit’ (inritvergunning) or as an ‘egress permit’(uitwegvergunning). If a person (business) wants to build a driveway road to a
14

provincial highway, permission from the provincial authority is needed. The mu-nicipality or provincial authority considers issues such as safe and efficient roaduse, protection of green spaces, and protection of the ambience of the surroundingareas before sanctioning a permit. The permit application must be accompaniedwith the necessary fees and documentation, including design plans, photos, andpertinent reports.
We considered an event log containing 315 cases and 3968 events referring to21 activities. The cases pertain to permit requests for driveway constructionspanning over the period between 03-01-2006 and 12-01-2011. We consideredthe J-measure feature on the follows relation for all activity pairs using a win-dow of size 10. The J-measure values of each activity pair define a vector of size315, corresponding to the traces in the event log. The univariate Kolmogorov-Smirnov test (KS-test) is applied on each of these vectors using a population sizeof 20. Fig. 12 depicts the average significance probability of the KS-test on allactivity pairs. We see seven troughs formed at indices 21, 91, 125, 168, 213, 237,and 291 respectively. These troughs signify a change in behavior in the tracespreceding and succeeding them. Based on these change points, we split the loginto 8 partitions as depicted in the figure.
L1 L2 L3 L4 L5 L6 L7 L8
Fig. 12. Average significance probability (over all activity pairs) of KS-test on J-measure. The population size for the KS-test is 20. There are seven troughs signifyinga change in behavior. These are used to partition the log into L1, L2, . . . , L8.
Fig. 13 depicts the process model discovered using the Heuristics miner [12] onthe event log L1. Upon submission of an application, the municipality acknowl-edges the receipt of documents and (optionally) tests for its completeness. A feeletter is also prepared and sent to the applicant. The municipality then proceedswith a follow-up procedure where an opinion from the department of planning
15

Fig. 13. Heuristic net of the permit process for driveway construction discovered usingthe event log L1.
and management is sought. If needed, the municipality may ask for the originaldrawings of the planned driveway. Based on the investigations, the municipalitythen makes a decision on the application and publishes them. The municipal-ity may refuse the permission in which case a fee refund letter is sent to theapplicant. For some requests that have been authorized, the municipality maysend an invoice for driveway construction and contract the BUI division for con-struction. The BUI division may in turn confirm its decision to the municipality.
Fig. 14 depicts the process model discovered using the Heuristics miner on theevent log L2. There are two primary changes (marked by the dashed rectangles)in this process model when compared to the model in Fig. 13. Firstly, the check-ing for completeness of the registered documents is no longer optional. Also,
16

Fig. 14. Heuristic net of the permit process for driveway construction discovered usingthe event log L2. The dashed rectangles indicate regions where changes had taken placewhen compared to the previous model. When compared to the model in Fig. 13, thetests for completeness is now made mandatory and the confirmation of requests is nolonger sent to applicants.
17
unlike the previous model where there are two activities related to creating ofa fee letter, viz., Create fee letter/send conf. of request received and Drafting feeletter, we now have only one activity Drafting fee letter. In addition, the con-firmation of requests is no longer sent to the applicants. The second changecorresponds to the omission of the activity Publishing application. Fig. 15 de-picts the process model discovered using the Heuristics miner on the event logL3. There is one behavioral change in this model when compared to the one inFig. 14. The municipality has now enforced a stricter need for confirmation fromthe BUI division. In Fig. 14, only 5 of the 24 contracts submitted to the BUI di-vision were confirmed where as in Fig. 15, 13 of the 14 contracts were confirmed.
Fig. 16 depicts the process model discovered using the Heuristics miner on theevent log L4. There are two primary changes (as indicated by the dashed rect-angles) in this model when compared to the previous model in Fig. 15. Firstly,a refund is recorded only to some selected cases in case of refusal of a permit.Secondly, the number of contracts given to the BUI division has drastically re-duced. Fig. 17(a) depicts the process model discovered using the Heuristics mineron the event log L5. There are no further contracts to the BUI division in thisprocess. Furthermore, the activities Advice Dept. Planning and Management andB & I request original drawing happen more often in parallel with the activitiesSend fee letter and End procedure, select follow-up procedure when compared tothe previous model. Fig. 17(b) depicts the process model discovered using theHeuristics miner on the event log L6. In this model, the activities Drafting feeletter and Send request pending can be executed in parallel when compared to theprevious models where they happen in a sequence. Furthermore, refunds havebeen stopped for all applicants in case of permit refusal.
Fig. 18(a) depicts the process model discovered using the Heuristics miner onthe event log L7. This model differs from the model in Fig. 17(b) in that theactivity Send fee letter has to happen before the End procedure, select follow-upprocedure. Fig. 18(b) depicts the process model discovered using the Heuristicsminer on the event log L8. The change in this model pertains to the activitySend fee letter. Unlike all of the previous models, the fee letter is sent only tosome of the applicants (for just 6 of the 24 permit requests was a fee letter sent).Due to this, the probability of activities differ in the traces in L8 when comparedto the traces in L7. The J-measure elegantly captures this and reflects this as achange in behavior.
4 Conclusions
In this paper, we analyzed event logs of three processes from a large Dutch mu-nicipality for the presence of concept drifts (i.e., process changes). The detectionof such change points can help us put the results of process mining in a rightperspective and enables an organization to take appropriate measures when achange in behavior is perceived. Using the framework proposed in [4] for dealing
18

Fig. 15. Heuristic net of the permit process for driveway construction discovered usingthe event log L3. There is a stricter need for confirmation from the BUI division in thismodel when compared to the model in Fig. 14.
19

Fig. 16. Heuristic net of the permit process for driveway construction discovered usingthe event log L4. Refunds are done only for selected cases in case of permit refusaland the number of contracts given to the BUI division has reduced drastically whencompared to the model in Fig. 15.
20

(a) event log L5 (b) event log L6
Fig. 17. Heuristic nets of the permit process for driveway construction discoveredusing the event logs L5 and L6. The marked regions signify the regions where changesare perceived when compared to the previous model. In the model in (a), the activitiesAdvice Dept. Planning and Management and B & I request original drawing happen moreoften in parallel with Send fee letter and End procedure, select follow-up procedure, unlikethe model in Fig. 16. Furthermore, the municipality no longer assigns contracts to theBUI division. The activities Drafting fee letter and Send request pending can be executedin parallel in (b) when compared to the model in (a).
with concept drifts in process mining, we are able to detect changes in real-lifeevent logs even with a small number of cases.
21

(a) event log L7 (b) event log L8
Fig. 18. Heuristic nets of the permit process for driveway construction discoveredusing the event logs L7 and L8. The sending of fee letter has to happen before theactivity End procedure, select follow-up procedure in (a) while the activity is optional in(b).
22

References
1. van Infrastructuur en Milieu, M.: All-in-one permit for physical aspects: (omgev-ingsvergunning) in a nutshell (2010)
2. Sarbanes, P., G. Oxley et. al.: Sarbanes-Oxley Act of 2002 (2002)3. van der Aalst, W.M.P., Rosemann, M., Dumas, M.: Deadline-based Escalation
in Process-Aware Information Systems. Decision Support Systems 43(2) (2011)492–511
4. Bose, R.P.J.C., van der Aalst, W.M.P., Zliobaite, I., Pechenizkiy, M.: HandlingConcept Drift in Process Mining. In Mouratidis, H., Rolland, C., eds.: InternationalConference on Advanced Information Systems Engineering (CAiSE 2011). Volume6741 of Lecture Notes in Computer Science., Springer-Verlag, Berlin (2011) 391–405
5. Sheskin, D.: Handbook of Parametric and Nonparametric Statistical Procedures.Chapman & Hall/CRC (2004)
6. Bose, R.P.J.C.: Process Mining in the Large: Preprocessing, Discovery, and Diag-nostics. PhD thesis, Eindhoven University of Technology (2012)
7. CoSeLog: Configurable Services for Local Governments Project Home Page. www.win.tue.nl/coselog.
8. Buijs, J.C.A.M., van Dongen, B.F., van der Aalst, W.M.P.: Towards Cross-Organizational Process Mining in Collections of Process Models and thier Exe-cutions. In Daniel, F., Barkaoui, K., Dustdar, S., eds.: Business Process Manage-ment Workshops. Volume 100 of Lecture Notes in Business Information Processing.,Springer-Verlag, Berlin (2012) 2–13
9. van der Aalst, W.M.P.: Configurable Services in the Cloud: Supporting VariabilityWhile Enabling Cross-Organizational Process Mining. In Meersman, R., Dillon,T., Herrero, P., eds.: On the Move to Meaningful Internet Systems: OTM 2010.Volume 6426 of Lecture Notes in Computer Science., Springer-Verlag, Berlin (2010)8–25
10. van der Aalst, W.M.P.: Intra– and Inter–Organizational Process Mining: Discov-ering Processes Within and Between Organizations. In Johannesson, P., Krogstie,J., Opdahl, A.L., eds.: The Practice of Enterprise Modeling (PoEM). Volume 92 ofLecture Notes in Business Information Processing., Springer-Verlag, Berlin (2011)1–11
11. Vogelaar, J.J.C.L., Verbeek, H.M.W., Luka, B., van der Aalst, W.M.P.: ComparingBusiness Processes to Determine the Feasibility of Configurable Models: A CaseStudy. In Daniel, F., Barkaoui, K., Dustdar, S., eds.: Business Process ManagementWorkshops. Volume 100 of Lecture Notes in Business Information Processing.,Springer-Verlag, Berlin (2012) 50–61
12. Weijters, A.J.M.M., van der Aalst, W.M.P.: Rediscovering Workflow Models FromEvent-based Data Using Little Thumb. Integrated Computer-Aided Engineering10(2) (2003) 151–162
23