Draft - University of Toronto T-Space · Draft Estimating peak oxygen uptake based on ... Institut...
35
Draft Estimating peak oxygen uptake based on postexercise measurements in swimming Journal: Applied Physiology, Nutrition, and Metabolism Manuscript ID apnm-2015-0524.R1 Manuscript Type: Article Date Submitted by the Author: 10-Dec-2015 Complete List of Authors: Chaverri, Diego; Institut Nacional d’Educació Física de Catalunya, Universitat de Barcelona, INEFC-Barcelona Sport Sciences Research Group Iglesias, Xavier; Institut Nacional d’Educació Física de Catalunya, Universitat de Barcelona, INEFC-Barcelona Sport Sciences Research Group Schuller, Thorsten; Deutsche Sporthochschule Köln, Institut für Physiologie und Anatomie Hoffmann, Uwe; Deutsche Sporthochschule Köln, Institut für Physiologie und Anatomie Rodríguez, Ferran; Institut Nacional d'Educació Física de Catalunya, University of Barcelona, INEFC-Barcelona Sport Sciences Research Group Keyword: VO2max, oxygen kinetics, heart rate, backward extrapolation, modelling https://mc06.manuscriptcentral.com/apnm-pubs Applied Physiology, Nutrition, and Metabolism
-
Upload
phunghuong -
Category
Documents
-
view
223 -
download
1
Transcript of Draft - University of Toronto T-Space · Draft Estimating peak oxygen uptake based on ... Institut...

Draft
Estimating peak oxygen uptake based on postexercise
measurements in swimming
Journal: Applied Physiology, Nutrition, and Metabolism
Manuscript ID apnm-2015-0524.R1
Manuscript Type: Article
Date Submitted by the Author: 10-Dec-2015
Complete List of Authors: Chaverri, Diego; Institut Nacional d’Educació Física de Catalunya, Universitat de Barcelona, INEFC-Barcelona Sport Sciences Research Group Iglesias, Xavier; Institut Nacional d’Educació Física de Catalunya, Universitat de Barcelona, INEFC-Barcelona Sport Sciences Research Group Schuller, Thorsten; Deutsche Sporthochschule Köln, Institut für Physiologie und Anatomie Hoffmann, Uwe; Deutsche Sporthochschule Köln, Institut für Physiologie und Anatomie Rodríguez, Ferran; Institut Nacional d'Educació Física de Catalunya, University of Barcelona, INEFC-Barcelona Sport Sciences Research Group
Keyword: VO2max, oxygen kinetics, heart rate, backward extrapolation, modelling
https://mc06.manuscriptcentral.com/apnm-pubs
Applied Physiology, Nutrition, and Metabolism

Draft
1
Estimating peak oxygen uptake based on postexercise measurements in swimming
Diego Chaverri. INEFC-Barcelona Sport Sciences Research Group, Institut Nacional
d’Educació Física de Catalunya, Universitat de Barcelona. Av. de l’Estadi, 12-22,
08038 Barcelona (Spain). Tel.: +34 934255445. E-mail: [email protected]
Xavier Iglesias. INEFC-Barcelona Sport Sciences Research Group, Institut Nacional
d’Educació Física de Catalunya, Universitat de Barcelona. Av. de l’Estadi, 12-22,
08038 Barcelona (Spain). Tel.: +34 934255445. E-mail: [email protected]
Thorsten Schuller. Institut für Physiologie und Anatomie, Deutsche Sporthochschule
Köln, Am Sportpark Müngersdorf 6, 50933 Köln (Germany).Tel.: +49 17682135050. E-
mail: [email protected]
Uwe Hoffmann. Institut für Physiologie und Anatomie, Deutsche Sporthochschule
Köln, Am Sportpark Müngersdorf 6, 50933 Köln (Germany).Tel.: +49 17682135050. E-
mail: [email protected]
Ferran A. Rodríguez. INEFC-Barcelona Sport Sciences Research Group, Institut
Nacional d’Educació Física de Catalunya, Universitat de Barcelona. Av. de l’Estadi, 12-
22, 08038 Barcelona (Spain). Tel.: +34 934255445. E-mail: [email protected]
Corresponding author:
Page 1 of 34
https://mc06.manuscriptcentral.com/apnm-pubs
Applied Physiology, Nutrition, and Metabolism
Draft
2
Prof. Ferran A. Rodríguez. INEFC-Barcelona Sport Sciences Research Group, Institut
Nacional d’Educació Física de Catalunya, Universitat de Barcelona. Av. de l’Estadi, 12-
22, 08038 Barcelona (Spain). Tel.: +34 934255445. E-mail: [email protected]
Page 2 of 34
https://mc06.manuscriptcentral.com/apnm-pubs
Applied Physiology, Nutrition, and Metabolism
Draft
3
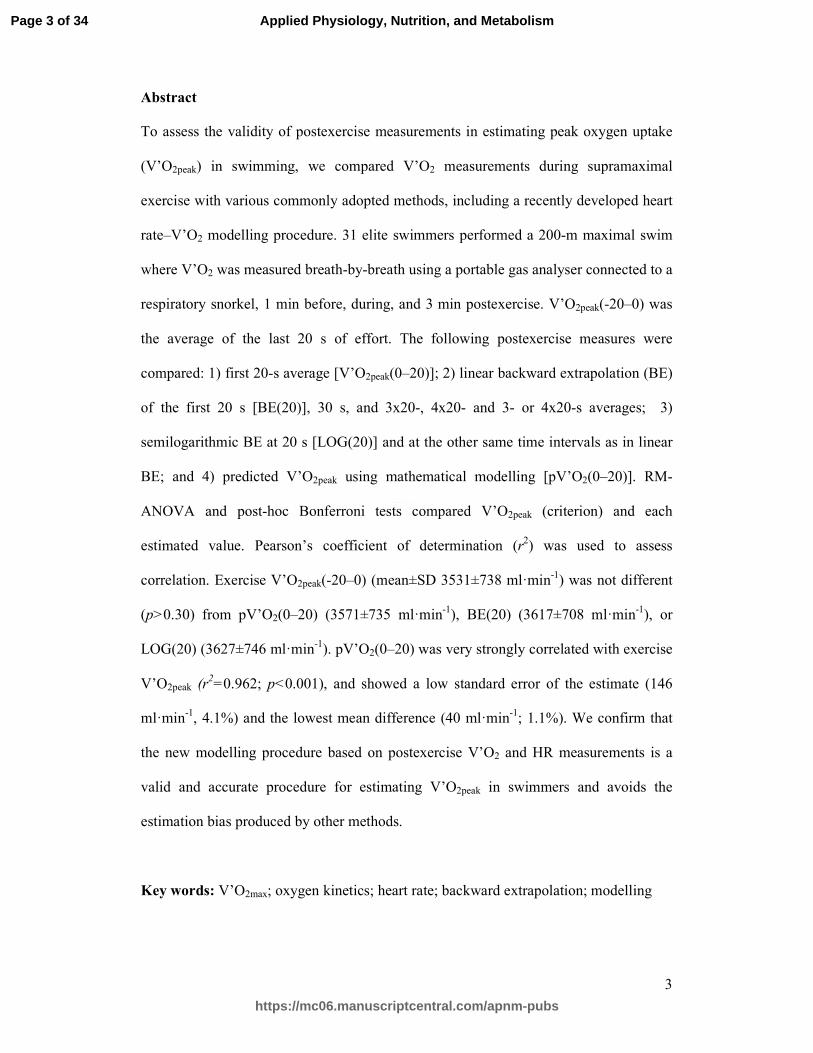
Abstract
To assess the validity of postexercise measurements in estimating peak oxygen uptake
(V’O2peak) in swimming, we compared V’O2 measurements during supramaximal
exercise with various commonly adopted methods, including a recently developed heart
rate–V’O2 modelling procedure. 31 elite swimmers performed a 200-m maximal swim
where V’O2 was measured breath-by-breath using a portable gas analyser connected to a
respiratory snorkel, 1 min before, during, and 3 min postexercise. V’O2peak(-20–0) was
the average of the last 20 s of effort. The following postexercise measures were
compared: 1) first 20-s average [V’O2peak(0–20)]; 2) linear backward extrapolation (BE)
of the first 20 s [BE(20)], 30 s, and 3x20-, 4x20- and 3- or 4x20-s averages; 3)
semilogarithmic BE at 20 s [LOG(20)] and at the other same time intervals as in linear
BE; and 4) predicted V’O2peak using mathematical modelling [pV’O2(0–20)]. RM-
ANOVA and post-hoc Bonferroni tests compared V’O2peak (criterion) and each
estimated value. Pearson’s coefficient of determination (r2) was used to assess
correlation. Exercise V’O2peak(-20–0) (mean±SD 3531±738 ml·min-1) was not different
(p>0.30) from pV’O2(0–20) (3571±735 ml·min-1), BE(20) (3617±708 ml·min-1), or
LOG(20) (3627±746 ml·min-1). pV’O2(0–20) was very strongly correlated with exercise
V’O2peak (r2=0.962; p<0.001), and showed a low standard error of the estimate (146
ml·min-1, 4.1%) and the lowest mean difference (40 ml·min-1; 1.1%). We confirm that
the new modelling procedure based on postexercise V’O2 and HR measurements is a
valid and accurate procedure for estimating V’O2peak in swimmers and avoids the
estimation bias produced by other methods.
Key words: V’O2max; oxygen kinetics; heart rate; backward extrapolation; modelling
Page 3 of 34
https://mc06.manuscriptcentral.com/apnm-pubs
Applied Physiology, Nutrition, and Metabolism
Draft
4
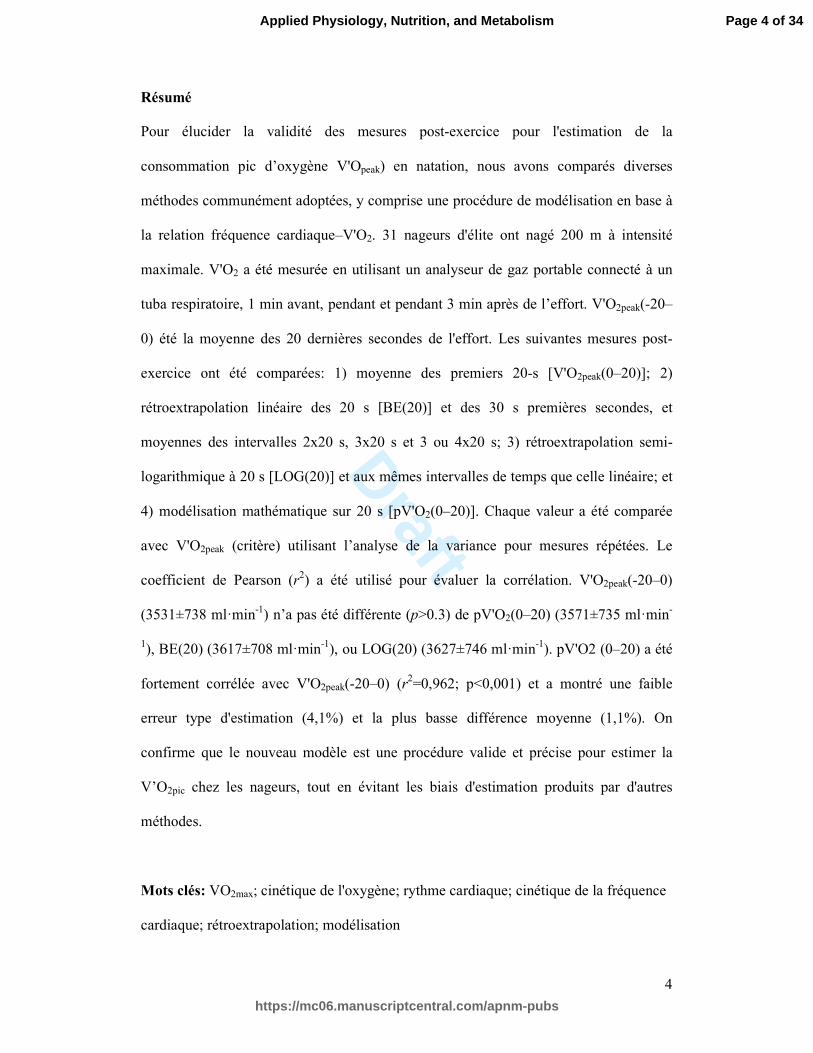
Résumé
Pour élucider la validité des mesures post-exercice pour l'estimation de la
consommation pic d’oxygène V'Opeak) en natation, nous avons comparés diverses
méthodes communément adoptées, y comprise une procédure de modélisation en base à
la relation fréquence cardiaque–V'O2. 31 nageurs d'élite ont nagé 200 m à intensité
maximale. V'O2 a été mesurée en utilisant un analyseur de gaz portable connecté à un
tuba respiratoire, 1 min avant, pendant et pendant 3 min après de l’effort. V'O2peak(-20–
0) été la moyenne des 20 dernières secondes de l'effort. Les suivantes mesures post-
exercice ont été comparées: 1) moyenne des premiers 20-s [V'O2peak(0–20)]; 2)
rétroextrapolation linéaire des 20 s [BE(20)] et des 30 s premières secondes, et
moyennes des intervalles 2x20 s, 3x20 s et 3 ou 4x20 s; 3) rétroextrapolation semi-
logarithmique à 20 s [LOG(20)] et aux mêmes intervalles de temps que celle linéaire; et
4) modélisation mathématique sur 20 s [pV'O2(0–20)]. Chaque valeur a été comparée
avec V'O2peak (critère) utilisant l’analyse de la variance pour mesures répétées. Le
coefficient de Pearson (r2) a été utilisé pour évaluer la corrélation. V'O2peak(-20–0)
(3531±738 ml·min-1) n’a pas été différente (p>0.3) de pV'O2(0–20) (3571±735 ml·min-
1), BE(20) (3617±708 ml·min-1), ou LOG(20) (3627±746 ml·min-1). pV'O2 (0–20) a été
fortement corrélée avec V'O2peak(-20–0) (r2=0,962; p<0,001) et a montré une faible
erreur type d'estimation (4,1%) et la plus basse différence moyenne (1,1%). On
confirme que le nouveau modèle est une procédure valide et précise pour estimer la
V’O2pic chez les nageurs, tout en évitant les biais d'estimation produits par d'autres
méthodes.
Mots clés: VO2max; cinétique de l'oxygène; rythme cardiaque; cinétique de la fréquence
cardiaque; rétroextrapolation; modélisation
Page 4 of 34
https://mc06.manuscriptcentral.com/apnm-pubs
Applied Physiology, Nutrition, and Metabolism
Draft
5
Introduction
In swimming, measuring oxygen uptake (�� o�) is a complex and unwieldy procedure.
Recently, portable gas analysers connected to face masks (e.g. (Rodríguez 1995;
Rodriguez 2000b) or swimming snorkels (e.g. (Keskinen et al. 2003; Rodríguez et al.
2008; Baldari et al. 2013) have facilitated this task providing the investigators with an
acceptable level of practicality and accuracy. Nevertheless, measuring �� o� using a
swimming snorkel might involve changes in stroke kinematics (Keskinen et al. 2001;
Barbosa et al. 2010), swimming technique (e.g. reducing body rolling), and normal
breathing pattern, and make impossible diving starts and flip turns (Kjendlie et al. 2003;
Kapus et al. 2006).
To solve this problem, Montpetit et al. proposed to use postexercise
measurements and the backward extrapolation (BE) methodfirst described by di
Prampero et al. (Di Prampero et al. 1976) and later validated by Léger et al. (Léger et al.
1980) for treadmill runningto swimming, and validated this technique against
Douglas bag measures in a multistage free-swimming and treadmill running (Montpetit
et al. 1981). In their original study, directly measured exercise �� o���� was compared
with values estimated through the linear BE of the �� o� recovery curve at time zero
using semilogarithmic single exponential least squares regression on the first three or
four 20-s bag content values. No significant differences were found between �� o����
measured and estimated by BE and the standard error of the estimate (SEE) was 3.7%.
From then, BE is often used for estimating �� o� during swimming (Léger et al. 1980;
Montpetit et al. 1981; Ricci et al. 1983; Ribeiro et al. 1990; Zamparo et al. 2008;
Zamparo et al. 2012), but an error can derive from a delay at the onset of the �� o�
recovery curve after supramaximal exercise, which has been consistently described as
lasting 5-35 s for maximal exercise to up to 1 min (Di Prampero et al. 1973). In fact,
Page 5 of 34
https://mc06.manuscriptcentral.com/apnm-pubs
Applied Physiology, Nutrition, and Metabolism

Draft
6
Lavoie et al. suggested that this time-variable delay was responsible for the ~20%
overestimation of peak �� o� (�� o��� ) when using BE after an unimpeded 400-m
maximal swim and, to circumvent this problem, they were the first to propose a single
20-s postexercise gas collection during recovery as a good and practical indicator of
�� o��� in swimming (Lavoie et al. 1983). Two years later, Costill et al. (Costill et al.
1985) further validated this simplified method in tethered breastroke swimming and
found a high correlation (r2=0.96) between exercise and 20-s recovery �� o��� ,
although observing a decline in �� o� (~6%) during the first 20 s of recovery. Later, using
continuous breath-by-breath (BxB) postexercise measurements, Rodríguez corroborated
the existence of a time delay after an all-out 400-m swimming exercise at about 3-10 s
at the onset of the �� o� recovery phase (Rodríguez 1999). Sousa et al. modelled the �� o�
kinetics response during and after a square-wave maximal swim at 100% of �� o���
using a double-exponential function and reported an average time delay of 11 s (Sousa
et al. 2015). A very recent study reported a time delay of 14.2±4.7 s during an all-out
100-m swim, which was longer in female (15.1 s) compared with male swimmers (13.8
s), (Rodríguez et al. 2015, in press).
Recently, a new evaluation procedure based on heart rate (HR) and postexercise
�� o� measurements for estimating �� o��� at the end of a swimming exercise has been
implemented (Chaverri et al. 2015, in press). This method showed very highly
correlated (r2=0.963) and practically identical values compared with �� o� measured
using a swimming snorkel during supramaximal swimming (mean ∆=17 ml·min-1),
hence solving the problem of overestimation. The study also showed an underestimation
when �� o��� was calculated using a single postexercise 20-s measurement (3.3±1%).
Page 6 of 34
https://mc06.manuscriptcentral.com/apnm-pubs
Applied Physiology, Nutrition, and Metabolism

Draft
7
Therefore, to elucidate the validity of postexercise �� o� measurements in
estimating �� o��� in swimming, we compared direct �� o� BxB measurements during
supramaximal exercise with various procedures for estimating exercise �� o� from
measurements during the recovery period, including a recently developed HR-�� o�
modelling procedure based on the Fick’s principle.
Methods
Participants
Thirty-one elite swimmers, all members of national and Olympic teams, including 18
females and 13 males (table 1), gave their written informed consent to participate in the
study, which had received approval from the Ethics Committee for Clinical Sport
Research of Catalonia and follow the legal requirements and the Declaration of Helsinki
(Harriss et al. 2013).
-- Table 1--
Testing
After a ~30-min standard warm-up, the subjects rested outside the water while the
respiratory equipment was set up and calibrated for the measurements. Afterwards the
swimmers performed an all-out 200-m front crawl swim using the swimming snorkel
(table 1). During the test, an assistant carried the respiratory equipment walking beside
the swimmer at the edge of the pool. After exercise the swimmers remained for 3
minutes in an upright position and immersed into the water to the mid-sternum. All tests
were conducted at a 50-m indoor pool (altitude 190 m a.s.l.; water temperature 26-27º
C; air temperature 27-28º C).
Data collection and processing
Page 7 of 34
https://mc06.manuscriptcentral.com/apnm-pubs
Applied Physiology, Nutrition, and Metabolism

Draft
8
�� o� was measured using a telemetric portable gas analyser (K4 b2, Cosmed, Italy)
connected to the swimmer by a previously validated low hydrodynamic resistance
respiratory snorkel and valve system (Keskinen et al. 2003; Rodríguez et al. 2008).
Pulmonary gas exchange values during the maximal swim were measured 1 min before,
during, and 3 min after exercise. HR was continuously measured using beat-by-beat
monitors (CardioSwim, Freelap, Switzerland). Measured �� o� and HR data were time-
aligned to the start of the measurements, 1-s interpolated, and plotted against time.
Measured �� o��� during exercise
Two �� o��� values during exercise were identified: 1) �� o����−20 − 0�: averaged
values measured within the last 20 s of exercise (t-20–t0); these values were taken as the
criterion value for all comparisons; and 2) �� o��� nonlinear regression
(�� o����NLR�): pulmonary �� o� values during swimming were measured BxB, time-
aligned to the start of exercise, and plotted against time. No smoothing procedures were
applied to avoid distortion of the underlying signal at the transient phase. �� o�data were
fitted using a nonlinear least-square regression technique (Matlab R2010b, Mathworks,
USA). For the analysis of �� o� kinetics, the first two phases of the generally adopted 3-
phase model were identified, since the exercise duration and intensity constrained the
appearance of the slow component (Scheuermann et al. 2003). Phase I (cardiodynamic
component) was determined as the time from the onset of exercise to a point of sharper
increase in �� o� , and its duration was computed as a time delay for the primary
component (TDp). Phase II (principal component) parameters were estimated using a
monoexponential model according to the following equation:
�� o���� = �� +�� ∙ �1 − e����� !"∕$!" (Eq. 1)
where t (s) is the time from the onset of exercise; A0 is the baseline amplitude; Ap is the
amplitude of the principal component; TDp (s) is the time delay of the first exponential
Page 8 of 34
https://mc06.manuscriptcentral.com/apnm-pubs
Applied Physiology, Nutrition, and Metabolism
Draft
9
term and equals the duration of phase I (cardiodynamic component); and τp is the time
constant of the principal component. The total amplitude (Atot) was calculated as Atot =
A0 + Ap. The reliability of �� o��� measurements was characterized by a typical error
(TE) of 3.1% (95% confidence interval, 95% CI: 1.1–5.1%; n = 9).
Estimated �� o��� from post-exercise measurements
Three different techniques were used to estimate �� o��� from HR and/or �� o� kinetics
during recovery period: 1) lineal BE, 2) semilogarithmic BE, and 3) modelling
procedures. First, six different procedures were used to estimate �� o��� using the
linear BE technique: 1) �� o����20 − 0�: average values measured within the first 20 s
of recovery (t0 – t20); 2) BE(20): estimated value calculated by BE to time zero (t0) of
the first 20-s values of the �� o� recovery curve; 3) BE(30): estimated �� o��� by BE to
t0 of the first 30-s values of the �� o� recovery curve; 4) BE(3x20): BE value calculated
from the first three 20-s average values of the �� o�recovery curve; 5) BE(4x20): BE
value calculated from the first four 20-s average values of the �� o�recovery curve; and
6) BE(3∪4x20): estimated value calculated by BE to t0 of the best linear regression fit
(3x20-s or 4x20-s) of the �� o� recovery curve.
Second, the same estimations were performed using the semilogarithmic
procedure (LOG), i.e. plotting the logarithms of the �� o� measured values as a function
of recovery time and backward extrapolating to t0 as in the original paper of Léger et al.
(Léger et al. 1980). Using analogous notation, five different calculations were computed
to estimate �� o���: 1) LOG(20); 2) LOG(30); 3) LOG(3x20); 4)LOG(4x20); and 5)
LOG(3∪4x20).
Third, �� o��� was estimated using a modelling technique: %�� o��0 − 20�: 20-
s averaged values of the predicted �� o� based on the HR and �� o� kinetics during the
Page 9 of 34
https://mc06.manuscriptcentral.com/apnm-pubs
Applied Physiology, Nutrition, and Metabolism

Draft
10
recovery period following the procedure previously described by Chaverri et al.
(Chaverri et al. 2015, in press). Based on the Fick’s principle, the model calculates a
predicted �� o� at a given time of recovery (t) using changes in HR as a proxy for
changes in cardiac output, and the oxygen pulse as a proxy for the arterio-venous O2
difference according to the equation:
%�� o���� = �� o���� ∙ HR'(��)*+, ∕ HR��� (Eq. 2)
with, %�� o���� as the predicted (modelled) postexercise �� o� at time t; �� o���� as the
postexercise 1-s interpolated �� o� at time t; HR(t) as the postexercise 1-s interpolated
HR value at time t; and HRend-exercise as the highest HR value of the last 10 s of exercise
(single peaks higher than 5 bpm than the last 10-s HR average excluded).
Statistical analysis
Descriptive data are expressed as mean and standard deviations (±SD), and mean
differences (mean ∆). The normality of the distributions and homogeneity of variance
were checked by the Shapiro-Wilks and Levene tests, respectively. A one-way analysis
of variance with repeated measures (RM-ANOVA) and post-hoc Bonferroni test when
appropriate were used for multiple comparisons between exercise (criterion value) and
each of the postexercise measured and estimated values. Sphericity was checked by
Mauchly’s sphericity test. The Pearson's coefficient of determination (r2) was used to
assess correlation between variables and the goodness-of-fit of regression models,
which was further assessed by using a cross-validation (CV) procedure. Data were split
into two half sub-samples (CV1, CV2) and their regression parameters were calculated
and then used to estimate a set of predicted values for the other sub-sample. r2 for the
observed and predicted data for each sub-sample (r2CV1, r
2CV2) were then computed. The
standard error of the estimation (SEE), expressed as absolute values and % of the mean,
and the limits of the 95% confidence interval (95% CI) were calculated. Differences
Page 10 of 34
https://mc06.manuscriptcentral.com/apnm-pubs
Applied Physiology, Nutrition, and Metabolism
Draft
11
between measured and estimated �� o��� and the level of agreement (mean ∆±1.96SD)
were analysed graphically using Bland-Altman difference plots (Bland et al. 1986).
Under- and overestimation are defined as the difference between estimated and criterion
mean values expressed in percentage of the criterion’s mean. The level of significance
was set at P<0.05. Statistical analyses were conducted using SPSS 18.0 for Windows.
Results
Figure 1 shows �� o� measured during the all-out 200-m swim and during recovery, and
�� o��� estimated during recovery using the various linear BE techniques. The same
time intervals were used for the logarithmic BE methods. Irrespectively of the
calculation procedure, all BE techniques overestimated exercise �� o��� as a
consequence of the time-variable delay at the immediate recovery (9.1±4.8 s; range=2-
22 s; 95% IC=7.3-10.9 s).
-- Figure 1 --
As shown in table 2, �� o����NLR� and �� o����−20 − 0� values were very
strongly correlated (r2=0.977; p<0.001), although �� o����NLR� gave nonsignificant,
slightly lower values as compared with the criterion (mean ∆=-1.5%; p=1.000). All
estimated �� o��� values differed from the criterion, except BE(20) (p=0.393),
LOG(20) (p=0.301), and %�� o����0 − 20� (p=1.000). %�� o����0 − 20� predicted
values were almost identical (mean ∆=1.1%) and very strongly correlated with criterion
measurements (r2= 0.962; p<0.001; SEE= 4.1%). The r2 calculated by cross-validation
confirms the robustness of the estimations and the validity of the comparisons.
-- Table 2--
Page 11 of 34
https://mc06.manuscriptcentral.com/apnm-pubs
Applied Physiology, Nutrition, and Metabolism

Draft
12
The regression and different plots in figure 2 show a strong correlation
(r2=0.962; p<0.001) and a good level of agreement between criterion-exercise �� o���
and model-predicted %�� o����0 − 20� values.
-- Figure 2 –
Figure 3 shows the regression and difference plots for the estimated �� o�values
using linear BE techniques (see table 1 for statistics). All BE methods except
�� o����0 − 20� (figure 3.A) overestimated exercise �� o���. Larger mean differences
and 95% limits of agreement were common to BE(3x20), BE(4x20), and BE(3∪4x20)
(figures 3.D-F), whereas BE(20) and BE(30) showed the lowest mean difference and
best level of agreement with criterion values (figures 3.A-C). From these parameters,
only BE(20) was not significantly different from the criterion (p=0.393).
-- Figure 3 --
Figure 4 shows the regression and difference plots for the estimated �� o�values
using semilogarithmic BE techniques. Again, all techniques overestimated �� o���
measured during exercise. Only LOG(20) and LOG(30) (figures 3.A, 3.B) showed a
satisfactory level of agreement and high correlations with criterion values (r2=0.949 and
r2=0.958, respectively).
-- Figure 4 --
Discussion
To assess the validity of postexercise measurements for estimating �� o��� in
swimming we compared measured �� o��� during a 200-m all-out swim using a
respiratory snorkel and �� o��� estimated from postexercise values during the same test
according to various commonly adopted procedures. The main findings were: 1) post-
Page 12 of 34
https://mc06.manuscriptcentral.com/apnm-pubs
Applied Physiology, Nutrition, and Metabolism

Draft
13
exercise �� o� measurements allowed to estimate exercise �� o��� in elite competitive
swimmers with good accuracy; 2) the overestimation of �� o��� exhibited by the BE
methods can be explained by a slower decay of the �� o� curve at the onset of the
recovery period (~10 s on average); 3) the present results confirm our previous
observations that the new modelling method based on HR kinetics and postexercise �� o�
measurements is the most valid and accurate procedure for estimating �� o��� after a
maximal swim.
Two procedures were used to quantify �� o��� during swimming:
�� o����−20 − 0� was the 20-s average at the end of the swim, and �� o����NLR� was
obtained by non-linear double exponential regression. Confirming previous results
(Rodríguez et al. 2015), both values did not differ and were nearly perfectly correlated
(r2=0.977), albeit �� o����−20 − 0� showed slightly greater values (mean ∆=1.5%).
We chose �� o����−20 − 0� as the reference criterion for all comparisons for a number
of reasons (Chaverri et al. 2015, in press): 1) to ensure that only last swimming lap data
were used; 2) to minimize inter-breath fluctuations; 3) to prevent overestimation of
�� o��� values frequently obtained with shorter time intervals (de Jesus et al. 2014); 4)
to maintain exercise and recovery temporal equality according to the on/off symmetry in
the �� o�kinetic response (Sousa et al. 2011a); and 5) previous work showed that 20-s
average values produced the same �� o��� as the total amplitude obtained by nonlinear
fitting of the �� o� on-kinetics during 200-m maximal swims (Rodríguez et al. 2015).
Concerning the different approaches used to estimate �� o��� using postexercise
�� o� measurements, they have in common the advantage of allowing the athlete to swim
completely unimpeded (i.e. without mouthpiece, snorkel, and tubing) and to attain
maximal exertion without any modification of the swimmer’s technique and
Page 13 of 34
https://mc06.manuscriptcentral.com/apnm-pubs
Applied Physiology, Nutrition, and Metabolism
Draft
14
hydrodynamics (i.e. breathing pattern, diving starts and turns and subsequent
underwater gliding phase, and body position and drag). This is particularly relevant at
high velocity swimming, as in time trials to determine �� o���. It has been shown that
maximal velocity attained in 100-m (Barbosa et al. 2010) or 400-m all-out tests (Lavoie
et al. 1983) is faster when swimming unimpeded (~13-16% and ~5-6%, respectively),
the disparity being explained by the longer distance and the subsequent cumulative
effect of altered conditions along the swim. During multistage continuous tests, mean
differences of ~10% in maximal velocity (Keskinen et al. 2001) and in maximal
velocity at �� o���� (Montpetit et al. 1981) were also found.
Notwithstanding, the key issue is whether estimated values from postexercise
measurements are in good agreement with those directly measured during exercise. The
most straightforward method is collecting expired air during the first 20 s of the
immediate recovery (Lavoie et al. 1983; Costill et al. 1985; Ribeiro et al. 1990). In the
present study, �� o����0 − 20� underestimated exercise values by 4.5% (table 2, figure
3.A), which is in agreement with the original findings of Costill et al., who reported
~6% lower values using a 20-s single measure as compared to directly measured
�� o��� after 5-7 min of tethered swimming at maximal intensity (Costill et al. 1985).
A greater underestimation (~7.6%) was found by Lavoie et al. after an all-out
unimpeded 400-m swim (Lavoie et al. 1983). Here, contrary to these earlier studies,
�� o� was directly measured BxB, thus allowing to confirm that the bias is caused mainly
by a quick decrease of the �� o� curve at the onset of the recovery as previously
documented in the literature (Di Prampero et al. 1973; Roberts et al. 1978; Rodríguez
1999; Sousa et al. 2011a). In contrast, the other two methods used in the present study
and based in short collection periods yet using the BE techniquei.e. linear and
semilogarithmic regression from 20- and 30-s continuous measurements,
Page 14 of 34
https://mc06.manuscriptcentral.com/apnm-pubs
Applied Physiology, Nutrition, and Metabolism
Draft
15
respectivelyoverestimated �� o��� by 2.4 to 4.2%, though only BE(20) and LOG(20)
offered values which were not different from the criterion method (table 1; figures 3.B,
4.A). Thus, BE of continuously measured values during 20 s, whether in absolute values
or transformed into their logarithms, appears to provide better �� o��� estimates than
20-s average of BxB postexercise measurements or the equivalent 20-s bag sample
classical technique.
Backward extrapolation methods
As to the classical BE methods (i.e. extrapolation to to of the recovery of average values
obtained during 60 to 80 s), they all provided values which differed (p<0.001) and
systematically overestimated (6.2 to 19.7%) exercise measurements despite showing
relatively good correlation with criterion values (r2=0.688 to 0.950) (table 2, figures 1
and 2). Lavoie et al. reported a similar overestimation (~20%) when using the
semilogarithmic BE method (linear regression of three or four 20-s bag samples) after a
maximal 400-m swim, and attributed this substantial discrepancy to a time delay in the
�� o� recovery curve (Lavoie et al. 1983). This phenomenon was first reported by di
Prampero et al. who observed that, contrary to steady state aerobic exercise, �� o�
remains practically at exercise levels for about 12-35 s after cessation of supramaximal
leg-cycling exercise of very short duration (11-51 s) (Di Prampero et al. 1973), and was
later corroborated for 1-min all-out cycling exercise and quantified in 5-10 s (Tural et
al. 2014). An indirect proof is offered by the work of Costill et al. who observed a close
correlation between post exercise 20-s �� o� values and �� o��� (r2=0.96), with a
relatively small mean difference (~6%), but decreasing correlation during subsequent
recovery periods (20-40 s, r2=0.94; 40-60 s, r
2=0.52; 60-80 s, r2=0.59) (Costill et al.
1985). Later, using BxB equipment, Rodríguez confirmed the existence of a time delay
after an all-out 400-m swimming exercise of about 3-10 s at the onset of the �� o�
Page 15 of 34
https://mc06.manuscriptcentral.com/apnm-pubs
Applied Physiology, Nutrition, and Metabolism
Draft
16
recovery curve in competitive swimmers (Rodríguez 1997; 1999). Using the same
procedure and discarding the individual time delay no significant differences were
found between �� o���� determined with continuous postexercise single 30-s
measurements after a maximal 400-m swimming test compared with �� o���� measured
during maximal incremental cycle ergometer and treadmill tests (Rodriguez 2000a). On
a study in which the �� o� on- and off-kinetics response was measured after a square-
wave swimming exercise at the severe intensity domain (i.e. 100% of �� o���� )
sustained during 3.3±0.4 min and modelled using a double-exponential regression
function, the time delay of the fast component was 10.9±6.4 s (Sousa et al. 2015).
Finally, a recent study reported a time delay of 14.2±4.7 s during an all-out 100-m
swim, being longer in female (15.1 s) compared with male swimmers (13.8 s)
(Rodríguez et al. 2015, in press). The present results corroborate that the overestimation
observed when BE of 20 to 80 s values are used to predict �� o��� during
supramaximal exercise is caused by the time delay during the immediate recovery being
that: 1) as evidenced in figure 1, there is slower decay of the �� o� curve at the onset of
the recovery period; 2) visual inspection of each �� o� curves confirmed a time-variable
delay in most swimmers (9.1±4.8 s); and 3) there were no differences from the criterion
when �� o��� was calculated using 20-s sampling averages (i.e. BE(20) and LOG(20)),
whereas differences existed in all BE methods when longer sampling times were used.
Moreover, a previous validation study using the same mathematical modelling
procedure showed that sampling times up to 20 s offered the smallest estimation bias of
�� o��� after maximal 200-m tests (Chaverri et al. 2015, in press).
Mathematical modelling procedure
To avoid the problem of under- and overestimation in BE methods our group developed
a mathematical modelling procedure based on �� o� off-kinetics and HR on- and off-
Page 16 of 34
https://mc06.manuscriptcentral.com/apnm-pubs
Applied Physiology, Nutrition, and Metabolism

Draft
17
kinetics which gave satisfactory results in predicting end-exercise �� o��� following an
all-out 200-m swim (Chaverri et al. 2015, in press). In that study, the best end-exercise
�� o��� estimates were provided by %�� o����0 − 20�, i.e. values modelled during the
first 20 s of the recovery (r2=0.963; mean ∆=0.5%; SEE=3.8%). Using the same HR-�� o�
modelling procedure, the present study corroborates its validity and accuracy, as almost
identical results were obtained (r2=0.962; mean ∆=1.1%; SEE=4.1%) (table 2, figure 2).
Altogether, the present study provides evidence that most methods for determining
�� o��� from postexercise measurements following a supramaximal swimming effort
are most likely to under- or overestimate exercise values as a consequence of the kinetic
characteristics of the �� o� off-response. As previously discussed, the main reason for the
underestimation of the single postexercise 20-s measurement (~5-8%) is the rapid decay
of �� o� during the immediate recovery (i.e. fast component), characterized by a time
constant of ~60-70 s on average (Sousa et al. 2011a; Sousa et al. 2015). On the other
hand, the main cause for the overestimation incurred by all BE techniques (~6-20%) is
the time-variable delay of the same fast component which has been quantified in ~11±6
s for all-out swimming exercise (Sousa et al. 2015) and found to be (9.1±4.8 s) in this
study. Differently, the HR-�� o� modelling procedure is based on the Fick’s principle and
calculates a predicted �� o� at a given time of recovery using the HR as a proxy for
changes in cardiac output, and the oxygen pulse as a proxy for the arterio-venous O2
difference (Chaverri et al. 2015, in press). This procedure has shown to provide valid
and accurate estimations of exercise �� o��� without significant bias (mean ∆=0.5-
1.1%; p=1.0).
Study limitations
Despite the fact that 200-m maximal swims have been widely adopted in studies with
competitive swimmers (Reis et al. 2010; Sousa et al. 2010; Figueiredo et al. 2011;
Page 17 of 34
https://mc06.manuscriptcentral.com/apnm-pubs
Applied Physiology, Nutrition, and Metabolism

Draft
18
Sousa et al. 2011a; Sousa et al. 2011b; Fernandes et al. 2012; Chaverri et al. 2015;
Rodríguez et al. 2015), namely because of the very strong activation of both the aerobic
and anaerobic energy metabolism (Rodríguez et al. 2011) and its average duration (~2-
2.5 min on average), sufficient to elicit �� o���� in most cases (Morgan et al. 1989;
Rossiter et al. 2006), it needs to be acknowledged that the present study focused on this
particular distance and on the extreme intensity domain. Although we do not anticipate
relevant outcome modifications from changes in these two factors, further studies
focusing another distances or durations and submaximal intensities are warranted.
Likewise, since this study involved elite swimmers, it seems of interest to investigate
swimmers of lower competitive level and younger age.
Practical applications
The use of BxB respiratory equipment at the poolside has improved the feasibility and
validity of gas exchange assessment in swimming. Using specifically designed snorkels,
despite the advantage of allowing continuous measurements during exercise and
recovery, still faces some limitations such as precluding diving starts and flip turns,
changing stroke kinematics, modifying the breathing pattern and causing a sometimes
unbearable discomfort. Using postexercise �� o� measurements allows the swimmers to
exercise completely unimpeded and to exploit their maximal potential with any undue
limitation caused by the equipment whatsoever. Nevertheless, as the present results
show, the BE technique results in substantial overestimation of �� o��� (~6-20%).
Using regression techniques on BxB data is likely to reduce measurement error (2-3%;
p=0.3-0.4), hence providing a greater level of accuracy in �� o��� measurements.
Considering that the swimmers typically vary their individual performance in the range
of about ∼3% across the competitive season (Pyne et al. 2001; Anderson et al. 2006),
the large measurement error reported by BE techniques (linear and semilogarithmic)
Page 18 of 34
https://mc06.manuscriptcentral.com/apnm-pubs
Applied Physiology, Nutrition, and Metabolism
Draft
19
compromise their ability to monitor progress in elite swimmers. Instead, using the
proposed model minimizes the error in predicting �� o��� (1.1%) and provides a valid
and accurate method to measure progress in high-level athletes. Moreover, these HR
measurements, can be taken without any interference to the normal swimming pattern
and can provide scientific and coaches additional informatione.g. training load
(García-Ramos et al. 2014). Important to note that some technical conditions are
required to ensure the validity of the results (Chaverri et al. 2015, in press): 1) obtaining
quality beat-to-beat HR recordings, 2) obtaining the first BxB �� o� values as fast as
possible while avoiding missing breaths and hyperventilation, and 3) monitoring HR
and �� o� during the recovery period for at least 20 s.
Conclusions
Measurement accuracy is key to postexercise gas exchange assessment in pool
conditions for estimating exercise �� o���. From the present study, in which measured
�� o��� during 200-m maximal swimming exercise was compared with �� o���
estimations from postexercise measurements according to various commonly adopted
procedures in elite swimmers, we may derive the following conclusions: 1) some (but
not all) postexercise �� o� estimation techniques allowed to predict exercise �� o���
with good accuracy; 2) the large overestimation exhibited by the classical BE methods
(~6-20%) can be explained by a time-variable delay of the fast component of the �� o�
off-kinetic response (~10 s on average); 3) BE methods using linear and
semilogarithmic regression of shorter measurement periods (0-20 s) provided more
accurate results, but still overestimate �� o��� by ~2-3%, respectively; 4) the widely
adopted 20-s average method underestimates �� o��� by ~5% because of the rapid
Page 19 of 34
https://mc06.manuscriptcentral.com/apnm-pubs
Applied Physiology, Nutrition, and Metabolism

Draft
20
decrease of �� o� during the immediate recovery (fast component); and 5) the HR-�� o�
modelling technique, based on continuous beat-to-beat HR and postexercise breath-by-
breath �� o� measurements during 20 s, is confirmed as a valid and accurate procedure
for estimating �� o��� in competitive swimmers without significant bias (0.5-1.1%).
Therefore, the HR- modelling technique appear as the method of choice for assessing
cardiorespiratory and metabolic fitness in competitive swimmers when postexercise
measurements are chosen to avoid the burden of respiratory equipment during
swimming exercise.
Conflict of interest
The authors declare that there are no conflicts of interest.
Acknowledgements
We gratefully acknowledge the coaches, staff and all the swimmers who participated in
the study and gave their valuable time and effort. Special thanks are given to Dr. Belén
Feriche (Universidad de Granada), Dr. Carmen Calderón (High Performance Centre of
Sierra Nevada), Dr. Esa Hynynen (KIHU–Research Institute for Olympic Sports of
Finland), Dr. Marek Anestik (Scottish Institute of Sport), and Prof. Boro Štrumbelj
(Univerzi v Ljubljani, Slovenia) for their help in data collection.
This work was supported by grants awarded by the Ministry of Science and
Innovation of Spain (Ministerio de Ciencia e Innovación, DEP2009-09181) and the
Higher Sports Council of Spain (Consejo Superior de Deportes 35/UPB/10,
005/UPB10/11, 112/UPB10/12). Support was granted by the Institut Nacional
d’Educació Física de Catalunya (INEFC), Generalitat de Catalunya. Diego Chaverri was
supported by research grants awarded by the Agency for Management of University and
Page 20 of 34
https://mc06.manuscriptcentral.com/apnm-pubs
Applied Physiology, Nutrition, and Metabolism

Draft
21
Research Grants of the Catalan Government (AGAUR, Generalitat de Catalunya,
PRE/2730/2012) and the Higher Sports Council of Spain (Consejo Superior de Deportes
005/UPB10/11, 112/UPB10/12).
References
Anderson, M.E., Hopkins, W.G., Roberts, A.D., and Pyne, D.B. 2006. Monitoring
seasonal and long-term changes in test performance in elite swimmers. Eur J Sport
Sci 6: 145-154.
Baldari, C., Fernandes, R.J., Meucci, M., Ribeiro, J., Vilas-Boas, J.P., and Guidetti, L.
2013. Is the new AquaTrainer(R) snorkel valid for VO2 assessment in swimming?
Int J Sports Med 34: 336-44.
Barbosa, T., Silva, A.J., Reis, A.M., Costa, M., Garrido, N., Policarpo, F., and Reis,
V.M. 2010. Kinematical changes in swimming front crawl and breaststroke with
the AquaTrainer snorkel. Eur J Appl Physiol 109: 1155-62.
Bland, J.M. and Altman, D.G. 1986. Statistical methods for assessing agreement
between two methods of clinical measurement. The Lancet 327: 307-310.
Chaverri, D., Schuller, T., Iglesias, X., Hoffmann, U., and Rodríguez, F.A. 2015. A new
model for estimating peak VO2 based on post-exercise measurements in
swimming. Int J Sports Physiol Perform: [Epub ahead of print].
Costill, D.L., Kovaleski, J., Porter, D., Kirwan, J., Fielding, R., and King, D. 1985.
Energy expenditure during front crawl swimming: predicting success in middle-
distance events. Int J Sports Med 6: 266-70.
de Jesus, K., Guidetti, L., de Jesus, K., Vilas-Boas, J.P., Baldari, C., and Fernandes, R.J.
2014. Which are the best VO2 sampling intervals to characterize low to severe
swimming intensities? Int J Sports Med 35: 1030-1036.
Page 21 of 34
https://mc06.manuscriptcentral.com/apnm-pubs
Applied Physiology, Nutrition, and Metabolism

Draft
22
Di Prampero, P.E., Cortili, G., Mognoni, P., and Saibene, F. 1976. Energy cost of speed
skating and efficiency of work against air resistance. J Appl Physiol 40: 584-91.
Di Prampero, P.E., Peeters, L., and Margaria, R. 1973. Alactic O 2 debt and lactic acid
production after exhausting exercise in man. J Appl Physiol 34: 628-32.
Fernandes, R.J., de Jesus, K., Baldari, C., de Jesus, K., Sousa, A.C., Vilas-Boas, J.P.,
and Guidetti, L. 2012. Different VO2max time-averaging intervals in swimming.
Int J Sports Med 33: 1010-5.
Figueiredo, P., Zamparo, P., Sousa, A., Vilas-Boas, J.P., and Fernandes, R.J. 2011. An
energy balance of the 200 m front crawl race. Eur J Appl Physiol 111: 767-77.
García-Ramos, A., Feriche, B., Calderón, C., Iglesias, X., Barrero, A., Chaverri, D.,
Schuller, T., and Rodríguez, F.A. 2014. Training load quantification in elite
swimmers using a modified version of the training impulse method. Eur J Sport Sci
15(2): 85-93.
Harriss, D.J. and Atkinson, G. 2013. Ethical standards in sport and exercise science
research: 2014 update. Int J Sports Med 34: 1025-1028.
Kapus, J., Strumbelj, B., Usaj, A., and Kapus, V. 2006. The breathing frequency
changes during swimming by using respiratory valves and tubes. Port J Sport Sci
(Biomechanics and Medicine in Swimming X) 6: 229-231.
Keskinen, K., Keskinen, O., and Rodríguez, F.A. 2001. Effect of a respiratory snorkel
and valve system on front crawl kinematics during standardised pool testing.In: J.
Mester, G. King, H. Strüder, E. Tsolakidis, and A. Osterburg (Eds.), 6th Annual
Congress of the European College of Sport Science, p. 538. Cologne: Sport und
Buch Strauss.
Page 22 of 34
https://mc06.manuscriptcentral.com/apnm-pubs
Applied Physiology, Nutrition, and Metabolism

Draft
23
Keskinen, K.L., Rodríguez, F.A., and Keskinen, O.P. 2003. Respiratory snorkel and
valve system for breath-by-breath gas analysis in swimming. Scand J Med Sci
Sports 13: 322-329.
Kjendlie, P.L., Stallman, R., and Stray-Gundersen, J. 2003. Influences of a breathing
valve on swimming technique.In: J.C. Chatard (Eds.), Biomechanics and Medicine
In Swimming IX, pp. 69-73. Saint-Étienne: Publications de l'Université de Saint-
Étienne.
Lavoie, J.-M., Léger, L.A., Montpetit, R.R., and Chabot, S. 1983. Backward
extrapolation of VO2 from the O2 recovery curve after a voluntary maximal 400m
swim.In: A.P. Hollander, P.A. Huijing, andG. De Groot (Eds.), Biomechanics and
Medicine in Swimming, pp. 222-227: Human Kinetics, Champaign, Illinois.
Léger, L.A., Seliger, V., and Brassard, L. 1980. Backward extrapolation of VO2max
values from the O2 recovery curve. Med Sci Sports Exerc 12: 24-7.
Montpetit, R.R., Léger, L.A., Lavoie, J.M., and Cazorla, G. 1981. VO2 peak during free
swimming using the backward extrapolation of the O2 recovery curve. Eur J Appl
Physiol Occup Physiol 47: 385-91.
Morgan, D.W., Baldini, F.D., Martin, P.E., and Kohrt, W.M. 1989. Ten kilometer
performance and predicted velocity at VO2max among well-trained male runners.
Med Sci Sports Exerc 21: 78-83.
Pyne, D.B., Lee, H., and Swanwick, K.M. 2001. Monitoring the lactate threshold in
world-ranked swimmers. Med Sci Sports Exerc 33: 291-7.
Reis, V.M., Marinho, D.A., Policarpo, F.B., Carneiro, A.L., Baldari, C., and Silva, A.J.
2010. Examining the accumulated oxygen deficit method in front crawl swimming.
Int J Sports Med 31: 421-427.
Page 23 of 34
https://mc06.manuscriptcentral.com/apnm-pubs
Applied Physiology, Nutrition, and Metabolism

Draft
24
Ribeiro, J.P., Cadavid, E., Baena, J., Monsalvete, E., Barna, A., and De Rose, E.H.
1990. Metabolic predictors of middle-distance swimming performance. Br J Sports
Med 24: 196-200.
Ricci, J. and Leger, L.A. 1983. VO2max of cyclists from treadmill, bicycle ergometer
and velodrome tests. Eur J Appl Physiol Occup Physiol 50: 283-9.
Roberts, A.D. and Morton, A.R. 1978. Total and alactic oxygen debts after
supramaximal work. Eur J Appl Physiol Occup Physiol 38: 281-9.
Rodríguez, F., Lätt, E., Jürimäe, J., Maestu, J., Purge, P., Rämson, R., Haljaste, K.,
Keskinen, K.L., and Jürimäe, T. 2015. VO2 kinetics in all-out arm stroke, leg kick
and whole stroke front crawl 100-m swimming. Int J Sports Med: [Epub ahead of
print].
Rodríguez, F.A. 2000. Maximal oxygen uptake and cardiorespiratory response to
maximal 400-m free swimming, running and cycling tests in competitive
swimmers. J Sports Med Phys Fitness 40: 87-95.
Rodríguez, F.A. 1995. Peak oxygen uptake after a 400-m test as a measure of maximal
aerobic power in competitive swimmers. Glyfada, Athens, Greece, p. 44: FINA.
Rodríguez, F.A. 1997. Metabolic evaluation of swimmers and water polo players.
Kinesiology. Journal of Biology of Exercise 2: 19-29.
Rodríguez, F.A. 1999. Cardiorespiratory and metabolic field testing in swimming and
water polo: from physiological concepts to practical methods. In: K.L. Keskinen,
P.V. Komi, and A.P. Hollander (Eds.), Biomechanics and Medicine in Swimming
VIII, pp. 219-226. University of Jyväskylä, Finland: Gummerus Printing.
Rodríguez, F.A., Iglesias, X., Feriche, B., Calderon-Soto, C., Chaverri, D., Wachsmuth,
N.B., Schmidt, W., and Levine, B.D. 2015. Altitude training in elite swimmers for
sea level performance (Altitude Project). Med Sci Sports Exerc 47: 1965-78.
Page 24 of 34
https://mc06.manuscriptcentral.com/apnm-pubs
Applied Physiology, Nutrition, and Metabolism

Draft
25
Rodríguez, F.A., Keskinen, K.L., Kusch, M., and Hoffmann, U. 2008. Validity of a
swimming snorkel for metabolic testing. Int J Sports Med 29: 120-8.
Rodríguez, F.A. and Mader, A. 2011. Energy systems in swimming. In: L. Seifert, D.
Chollet, and I. Mujika (Eds.), World Book of Swimming: From Science to
Performance, pp. 225-240. Hauppauge, New York: Nova Science Publishers.
Rossiter, H.B., Kowalchuk, J.M., and Whipp, B.J. 2006. A test to establish maximum
O2 uptake despite no plateau in the O2 uptake response to ramp incremental
exercise. J Appl Physiol 100: 764-70.
Scheuermann, B.W. and Barstow, T.J. 2003. O2 uptake kinetics during exercise at peak
O2 uptake. J Appl Physiol 95: 2014-22.
Sousa, A., Figueiredo, P., Keskinen, K.L., Rodríguez, F.A., Machado, L., Vilas-Boas,
J.P., and Fernandes, R.J. 2011. VO2 off transient kinetics in extreme intensity
swimming. J Sports Sci Med 10: 546-52.
Sousa, A., Figueiredo, P., Oliveira, N., Oliveira, J., Keskinen, K., Vilas-Boas, J., and
Fernandes, R. 2010. Comparison between swimming VO2peak and VO2max at
different time intervals. Open Sports Sci J 3: 22-24.
Sousa, A., Rodriguez, F.A., Machado, L., Vilas-Boas, J.P., and Fernandes, R.J. 2015.
Exercise modality effect on VO off-transient kinetics at VO intensity. Exp Physiol.
100(6): 719-29.
Sousa, A.C., Figueiredo, P., Oliveira, N.L., Oliveira, J., Silva, A.J., Keskinen, K.L.,
Rodríguez, F.A., Machado, L.J., Vilas-Boas, J.P., and Fernandes, R.J. 2011b. VO2
kinetics in 200-m race-pace front crawl swimming. Int J Sports Med 32: 765-70.
Zamparo, P., Lazzer, S., Antoniazzi, C., Cedolin, S., Avon, R., and Lesa, C. 2008. The
interplay between propelling efficiency, hydrodynamic position and energy cost of
front crawl in 8 to 19-year-old swimmers. Eur J Appl Physiol 104: 689-99.
Page 25 of 34
https://mc06.manuscriptcentral.com/apnm-pubs
Applied Physiology, Nutrition, and Metabolism

Draft
26
Zamparo, P. and Swaine, I.L. 2012. Mechanical and propelling efficiency in swimming
derived from exercise using a laboratory-based whole-body swimming ergometer. J
Appl Physiol (1985) 113: 584-94.
Page 26 of 34
https://mc06.manuscriptcentral.com/apnm-pubs
Applied Physiology, Nutrition, and Metabolism
Draft
27
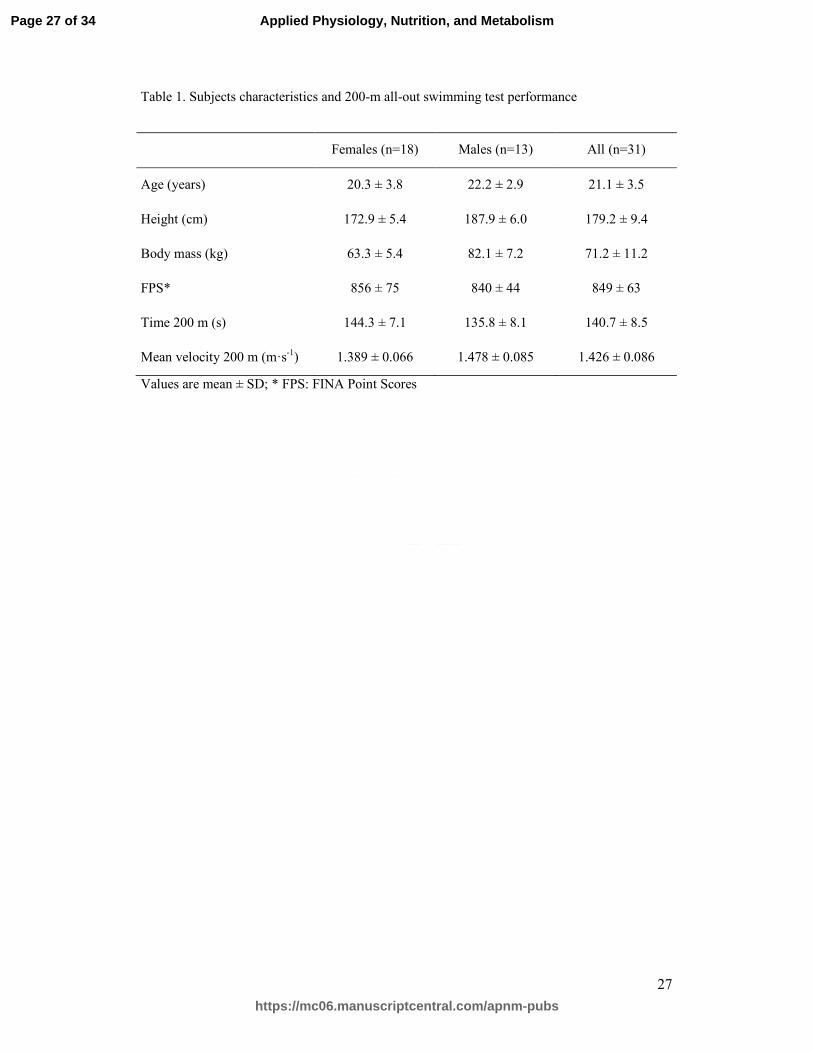
Table 1. Subjects characteristics and 200-m all-out swimming test performance
Females (n=18) Males (n=13) All (n=31)
Age (years) 20.3 ± 3.8 22.2 ± 2.9 21.1 ± 3.5
Height (cm) 172.9 ± 5.4 187.9 ± 6.0 179.2 ± 9.4
Body mass (kg) 63.3 ± 5.4 82.1 ± 7.2 71.2 ± 11.2
FPS* 856 ± 75 840 ± 44 849 ± 63
Time 200 m (s) 144.3 ± 7.1 135.8 ± 8.1 140.7 ± 8.5
Mean velocity 200 m (m·s-1) 1.389 ± 0.066 1.478 ± 0.085 1.426 ± 0.086
Values are mean ± SD; * FPS: FINA Point Scores
Page 27 of 34
https://mc06.manuscriptcentral.com/apnm-pubs
Applied Physiology, Nutrition, and Metabolism

Draft
28
Table 2. Peak measured during exercise and peak values measured and estimated by different procedures during recovery.
Technique Procedure Peak 95% CI Mean diff. r2 CV r
2 SEE Significance*
(ml·min-1) (ml·min-1) (ml·min-1) (%) r2
CV1 r2
CV2 (ml·min-1) (%) (p-value)
Exercise (criterion)
�� o����−20 − 0� 3531 ± 738 3260 3802 - - - - - - - -
�� o����NLR� 3479 ± 727 3213 3746 -52 -1.5 0.977 0.966 0.991 113.5 3.2 1.000
Lineal BE �� o����0 − 20� 3378 ± 698 3122 3635 -153 -4.5 0.969 0.969 0.974 132 3.7 <0.001*
BE(20)
3617 ± 708 3357 3876 86 2.4 0.956 0.959 0.962 216 5.6 0.393
BE(30)
3658 ± 719 3394 3921 127 3.5 0.967 0.968 0.972 136 3.6 0.001*
BE(3x20) 3828 ± 762 3549 4107 297 7.8 0.950 0.954 0.953 169 4.8 <0.001*
BE(4x20) 3763 ± 780 3477 4049 232 6.2 0.924 0.947 0.928 207 5.9 <0.001*
BE(3∪4X20) 3823 ± 746 3549 4096 292 7.6 0.946 0.957 0.944 175 5.0 <0.001*
Semilogarithmic LOG(20) 3627 ± 711 3366 3888 96 2.6 0.949 0.950 0.959 169 4.8 0.301
BE LOG(30) 3686 ± 722 3421 3951 155 4.2 0.958 0.956 0.970 154 4.3 <0.001*
LOG(3x20) 4175 ± 768 3894 4457 644 15.4 0.863 0.874 0.864 278 7.9 <0.001*
LOG(4x20) 4400 ± 884 4076 4724 869 19.7 0.688 0.852 0.616 420 11.9 <0.001*
LOG(3∪4x20) 4302 ± 819 4002 4602 771 17.9 0.772 0.885 0.694 358 10.1 <0.001*
Modelling %�� o����0 − 20� 3571 ± 735 3301 3841 40 1.1 0.962 0.955 0.977 146 4.1 1.000
Values are mean ±SD. 95% CI, 95% confidence interval; %, percent of criterion value; Mean diff., mean difference with criterion value; r2,
Pearson’s coefficient of determination; CV, double cross-validation (CV1 and CV2 are half-split subsamples used for CV); SEE, standard error
of estimate; Significance, ANOVA RM and post-hoc Bonferroni when appropriate was used to compare each procedure with the criterion value;
*Significantly different from criterion value (p< 0.05.
2oV& 2oV&
2oV&
Page 28 of 34
https://mc06.manuscriptcentral.com/apnm-pubs
Applied Physiology, Nutrition, and Metabolism

Draft
29
Figure Captions
Figure 1. Schematic diagram of �� o� (grey line, average 1-s values for the entire group
of swimmers) measured during exercise (shadowed area) and recovery at a 200-m all-
out swim. Discontinuous grey lines illustrate time limits (s) in which �� o� values were
averaged (black dots, mean ± SD) or where regression was applied. The regression lines
(both linear and semilogarithmic) projected on the t0 of recovery, were used to estimate
�� o��� using the different BE procedures. Only linear BE regressions are shown here
for clarity. See text for definitions and details.
Figure 2. Relationship between exercise �� o��� values i.e. �� o����−20 − 0�, x-
axisand �� o��� estimated using the HR- �� o� modelling procedurei.e
%�� o����0 − 20� , y-axis) Males (grey dots) and females (black dots) are shown
separately. In the left panel, regression line (solid back) and equality line (dashed grey)
are shown. Linear regression equation and coefficient of determination are shown in the
left panel. In the right panel, the x-axis represents mean �� o� (ml·min-1) and the y-axis
shows the differences with exercise �� o�. Lines are equality (solid), mean difference
(long-dashed), and ±95% limits of agreement (short-dashed). All data are expressed in
mlO2·min-1.
Figure 3. Relationship between exercise �� o��� values i.e. �� o����−20 − 0� , x-
axis)and estimated using different linear BE methods: A) �� o����0 − 20� ,
B) BE(20), C) BE(30), D) BE(2x20), E) BE(4x20), and F) BE(3∪4x20). Regression
and difference Bland-Altman plots are presented as in figure 2. See text for definitions
and details.
2peakoV&
Page 29 of 34
https://mc06.manuscriptcentral.com/apnm-pubs
Applied Physiology, Nutrition, and Metabolism

Draft
30
Figure 4. Relationship between exercise �� o��� values i.e. �� o����−20 − 0�, x-
axis)and �� o��� estimated using different linear semilogarithmic BE methods: A)
LOG(20), B) LOG(30), C) LOG(3x20), D) LOG(4x20), and E) LOG(3∪4x20).
Regression and difference Bland-Altman plots are presented as in figures 2 and 3. See
text for definition and details.
Page 30 of 34
https://mc06.manuscriptcentral.com/apnm-pubs
Applied Physiology, Nutrition, and Metabolism

Draft
Figure 1. Schematic diagram of V'O2 (grey line, average 1-s values for the entire group of swimmers) measured during exercise (shadowed area) and recovery at a 200-m all-out swim. Discontinuous grey lines illustrate time limits (s) in which V'O2 values were averaged (black dots, mean ± SD) or where regression
was applied. The regression lines (both linear and semilogarithmic) projected on the t0 of recovery, were used to estimate V'O2peak using the different BE procedures. Only linear BE regressions are shown here for
clarity. See text for definitions and details. 166x134mm (300 x 300 DPI)
Page 31 of 34
https://mc06.manuscriptcentral.com/apnm-pubs
Applied Physiology, Nutrition, and Metabolism

Draft
Figure 2. Relationship between exercise V'O2peak values ⎯i.e. V'O2peak, x-axis⎯and V'O2peak estimated using the
HR-V'O2 modelling procedure⎯i.e. pV'O2peak, y-axis). Males (grey dots) and females (black dots) are shown
separately. In the left panel, regression line (solid back) and equality line (dashed grey) are shown. Linear regression equation and coefficient of determination are shown in the left panel. In the right panel, the x-axis represents mean V'O2 (ml·min
-1) and the y-axis shows the differences with exercise V'O2. Lines are equality (solid), mean difference (long-dashed), and ±95% limits of agreement (short-dashed). All data are
expressed in mlO22·min-1.
79x35mm (300 x 300 DPI)
Page 32 of 34
https://mc06.manuscriptcentral.com/apnm-pubs
Applied Physiology, Nutrition, and Metabolism

Draft
Figure 3. Relationship between exercise V'O2peak values ⎯i.e. V'O2peak(-20-0) , x-axis)⎯and estimated using
different linear BE methods: A) V'O2peak(0-20) , B) BE(20), C) BE(30), D) BE(2x20), E) BE(4x20), and F) BE(3∪4x20). Regression and difference Bland-Altman plots are presented as in figure 2. See text for
definitions and details. 318x540mm (300 x 300 DPI)
Page 33 of 34
https://mc06.manuscriptcentral.com/apnm-pubs
Applied Physiology, Nutrition, and Metabolism

Draft
Figure 4. Relationship between exercise V'O2peak values ⎯i.e. V'O2peak(-20–0), x-axis)⎯and V'O2 estimated
using different linear semilogarithmic BE methods: A) LOG(20), B) LOG(30), C) LOG(3x20), D) LOG(4x20), and E) LOG(3U4x20). Regression and difference Bland-Altman plots are presented as in figures 2 and 3. See
text for definition and details.
189x260mm (300 x 300 DPI)
Page 34 of 34
https://mc06.manuscriptcentral.com/apnm-pubs
Applied Physiology, Nutrition, and Metabolism