DRAFT TOWN PLAN UPDATE June 6, 2017 Mark-Up...
126
1 TOWN OF NORWICH DRAFT TOWN PLAN UPDATE June 6, 2017 Mark-Up Version Norwich Planning Commission Norwich Planning Office [email protected]
Transcript of DRAFT TOWN PLAN UPDATE June 6, 2017 Mark-Up...

1
TOWN OF NORWICH
DRAFT TOWN PLAN UPDATE
June 6, 2017
Mark-Up Version
Norwich Planning Commission
Norwich Planning Office

2
introduction
The Norwich Town Plan provides a framework to guide decision-making related to the
future growth and development that takes into account: existing conditions, trends and
resources within the town; the regional and global forces that will affect the town both in
the near- and long-term future; the vision of a sustainable future for the town; and the
goals and objectives of town residents.

3
About Our Town
Norwich is a town in Windsor County, Vermont with a population of around 3,8003,400 people.
Norwich lies on the western bank of the Connecticut River (Vermont’s boundary with New
Hampshire) and has close ties with its neighboring town, Hanover, New Hampshire. The
Ledyard Bridge connects the two communities. Norwich is part of the bi-state Upper Valley
region, which includes towns along the Connecticut River in Vermont and New Hampshire.
Norwich is approximately 45 square miles in area. The Ompompanoosuc River flows into the
Connecticut River in the northeastern part of the town. The level floor of the river valley is fairly
narrow and most of the town’s landscape is hilly and wooded uplands.
Major transportation routes, which run in parallel through the Connecticut River valley, include
Interstate 91, U.S. Highway 5 and the former Boston and Maine Railroad right-of-way, now
owned by the State of Vermont.

4
About Our Plan
Purpose and Authority This plan for the Town of Norwich states the community’s goals and objectives, and offers
recommendations for future action to achieve those aims. The plan will help the Selectboard,
Planning Commission, Conservation Commission, and Norwich residents define and direct the
future growth and development of Norwich over the next five to ten years and will serve as the
foundation for revising the town’s land use regulations. It is a guide and a resource for any
proposed community development programs, and for the direction and content of other local
initiatives.
The plan may be used by Vermont’s District Environmental Commission for review of
development projects in Norwich under the jurisdiction of Act 250. It will also be a source of
information and a long-term guide by which to measure and evaluate public and private
proposals that affect the physical, social, and economic environment of the community.
The Vermont Municipal and Regional Planning and Development Act, Title 24 of the Vermont
Statutes Annotated, Chapter 117, enables Vermont municipalities to establish Planning
Commissions and to prepare municipal plans. Through the Act, the Planning Commission is
empowered to implement the plan once the Town of Norwich legally adopts it.
Planning History and Process This town plan builds on previous planning efforts that involved considerable public input over
the course of the past 40 years.
1968: First Town Plan adopted 1971: Zoning Regulations adopted 1975: Town Plan adopted 1975: Zoning Regulations adopted 1980: Town Plan adopted 1981: Zoning & Subdivision Regulations adopted 1986: Town Plan adopted 1990: Zoning & Subdivision Regulations adopted 1992: Zoning & Subdivision Regulations amended 1996: Town Plan adopted 2001: Town Plan re-adopted 2002: Subdivision Regulations adopted 2006: Town Plan re-adopted 2008: Zoning Regulations adopted 2009: Zoning Regulations amended 2011: Town Plan adopted
Norwich first adopted a plan in 1968, which was revised and readopted four times over the next
18 years. In 1989, the town embarked on a project to redraft the plan, largely from scratch. The
process took seven years and resulted in the 1996 adoption of a new town plan. In 2005,
Norwich again tackled the challenge of re-examining its plan, resulting in the adoption of this
2011 town plan. These most two recent planning processes are described in greater detail here.
1996 Plan. The process for preparing Norwich’s fifth Town Plan began in 1989 with the
formation of seven committees to create a vision statement, gather information, make

5
inventories, and propose goals, objectives, policies, and recommended actions. The committees
were Land Use, Transportation, Community Facilities, Town Services, Community Development,
Environmental and Natural Resources, and Capital Budget. More than 200 Norwich residents
participated on these committees, attending regular meetings and spending many hours
collecting data and researching issues.
In 1990, a four-page questionnaire was distributed to Norwich residents to determine their
attitude towards various town growth issues. There were 546 responses, which helped guide
the work of the planning committees. The final reports and inventories of the committees were
presented to the Planning Commission in 1991. The Planning Commission began an evaluation
of the reports in conjunction with committee chairpersons.
In the process of evaluating this information, particularly regarding growth and property tax
issues, the Planning Commission decided more information and research were needed and
retained Douglas Kennedy & Associates to prepare a report utilizing 1990 U.S. Census data
and other data that had not been available to the committees. Several chapters in the plan were
based on that report, while the others were based on the reports of the Town Plan committees.
2011 Plan. In 2005, the Norwich Planning Commission began the process of updating the 1996
plan by distributing another survey to residents addressing a range of planning and growth
issues in town. The results were overwhelming, with 990 surveys returned. Summaries of the
survey results are found throughout this plan, and the complete results are available from the
town’s Planning Office and on the town web site. Also in 2005, the town held a charrette (design
workshop) to explore residents’ preferences and concerns related to mixed-use development.
The input from the charrette was used to develop preliminary design guidelines for
consideration as the land use section of this plan was revised.
In 2006, Norwich again sought assistance from Douglas Kennedy’s firm, LandVest, to collect
and present updated demographic, housing, economic, land use and fiscal statistics for use in
the town planning process. In 2007, the town contracted with PlaceSense to facilitate a series of
public workshops and assist the Planning Commission in gathering all the data and input into a
first draft of the revised plan. The Planning Commission then distributed the draft plan to various
town committees, staff and organizations, as well as to a series of working groups made up of
interested citizens. The recommendations of these groups and individuals were used by the
Planning Commission to develop the 2011 plan.
Format of the Town Plan The plan is organized into chapters, which include the statutorily required elements of a town
plan. A summary of goals, objectives and actions is included at the end of most chapters. The
use of these terms is defined as:
Goals. Statements of aspirations that have an attainable end.
Objectives. Specific, measurable targets for accomplishing goals within prescribed
periods of time.
Actions. Ongoing activities consistent with courses of action set forth in policy
statements and designed to achieve specific objectives.

6
About Our Neighbors and Region
Introduction The Norwich Town Plan expresses a vision by the residents of Norwich for the future of their
town. Although many issues are within the control of the town through its town meeting, elected
and appointed officials, and private groups, others are dependent on outside regional events
and forces and may need regional solutions. The town has participated in regional decision-
making whenever possible. Some areas of regional cooperation have included transportation,
solid waste disposal, mutual aid fire protection, recreation, protection of natural resources, and
transportation.
Region Norwich is a member of the Two Rivers-Ottauquechee Regional Commission (TRORC). The
Regional Planning Commission creates a Regional Plan and coordinates transportation
planning in addition to offering planning support services to the 30 Vermont member towns.
The Two Rivers-Ottauquechee Regional Plan was most recently adopted in May 2007. The land
use section of the Regional Plan and this plan are compatible. The Regional Plan recognizes
Norwich Village as a town center in the region. Both plans call for guiding growth towards
traditional settlement areas, encouraging quality development at interchanges and along main
highway corridors, and preserving open space, working lands and environmental quality in
outlying rural areas.
Although Norwich is a Vermont town, due to its location on the border, there is significant
interaction with New Hampshire Upper Valley towns. Norwich is one of the four core Upper
Valley towns along with Hartford, Lebanon, and Hanover. Norwich, being smaller - population of
3,500 versus 10,000 to 13,000 in the other towns - and primarily residential, relies on these
larger towns for employment opportunities, services, and cultural events. As reflected in the
following list, there is cooperation between Vermont and New Hampshire towns in emergency
response, transportation, recreation, education and cultural events.
Other regional planning and mutual aid groups with which Norwich participates include:
Upper Valley Regional Emergency Services Association. A fire and rescue mutual aid
system for surrounding towns.
Local Emergency Planning Committee District 12 (LEPC 12). A multi-town group
to support emergency planning in each community.
Vermont Ambulance District 9. Provides EMS training.
Orange and Windsor Counties Public Works Emergency/Non Emergency
Mutual Aid. A compact to provide a framework through which nine municipalities
assist each other in times of extraordinary need or emergency circumstances.
Greater Upper Valley Solid Waste District (GUVSWD). A 10-town municipal
district that provides solid waste management authority, services, and planning to its
member towns in Vermont.
Upper Valley Recreation Association (UVRA). A 16-town bi-state association that
schedules games, organizes coaching clinics, sets rules, and coordinates any other
issues related to youth sports.

7
Upper Valley Trails Alliance. Advocates for the use, maintenance and development
of trails in the region to connect communities.
Linking Lands Alliance. A 14-town project sponsored by the Vermont Agency of
Natural Resources that is mapping wildlife habitat blocks, corridors, and crossings.
Connecticut River Joint Commission. A bi-state commission created to preserve
and protect the resources of the Connecticut River (Norwich is represented at the
Upper Valley Subcommittee).
Dresden School District. A bi-state school district consisting of Hanover and
Norwich, and providing facilities for middle and high school students and
administrative support for all grades, including elementary.
Vital Communities. A regional nonprofit organization based in White River Junction,
VT, that works to engage citizens, organizations, and communities in creating
solutions to our region’s challenges.
Upper Valley Transportation Management Association (UVTMA). A bi-state
partnership of five upper valley municipalities, major employers and regional
planning commissions that works to mitigate traffic congestion and reduce reliance
on single occupant vehicle commuting.
Upper Valley Lake Sunapee Regional Planning Commission. A regional planning
commission serving 27 municipalities in western New Hampshire including Hanover
and Lebanon (although Norwich is no longer a member town, we participate with
UVLSRC in many transportation and planning programs).
Neighboring Towns There are no significant conflicts between this plan and municipal plans either adopted or
proposed in neighboring towns. At this time, no major growth is planned in neighboring towns
that would impact Norwich, although slow, incremental development could have effects over
time, such as increased traffic on Norwich’s roads or increased stormwater run-off and water
quality degradation from developed land.
Hartford. Hartford has a Municipal Plan, most recently adopted in June of 2007. Hartford
classifies the land near the boundary with Norwich primarily as rural, except for the land near
U.S. Route 5 planned for commercial/industrial use. Further, some land along the town line in
Hartford is protected from development through conservation easements or public ownership.
The protected and rural lands in Hartford are very compatible with this plan’s vision for
Norwich’s outlying lands. The significant changes to Hartford’s zoning made in the mid-2000s
have increased compatibility with the changes that Norwich made several years earlier, as both
towns have reduced residential development densities in their rural areas and increased
protection of natural resources in their development review processes.
The land near Route 5 in Hartford is already substantially developed, and the 2010 designation
of a growth center in Hartford suggests that much of the town’s growth over the next 20 years
will be focused on the areas in and around the villages of Wilder, Hartford and White River
Junction, south of the town line with Norwich. This plan envisions the Route 5 corridor in
Norwich as a suitable location for higher-density or -intensity uses, including commercial
activities, while recognizing that a lack of wastewater disposal capacity continues to be a limiting
factor to development in this area. This plan recognizes that Hartford, Hanover and Lebanon will
continue to be the employment and service centers of the Upper Valley. While Norwich desires
a more sustainable future, including increasing the town’s jobs-to-residents ratio and decreasing
8
miles driven for daily activities, the goal is not self-sufficiency at the town level.
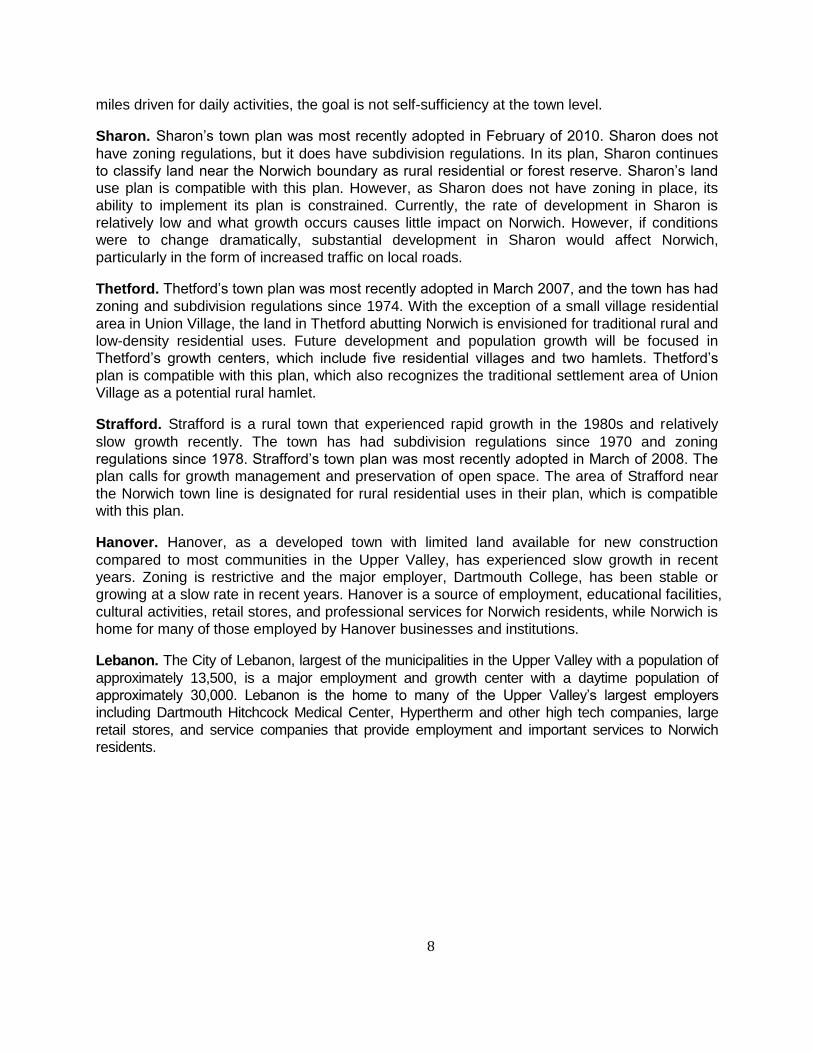
Sharon. Sharon’s town plan was most recently adopted in February of 2010. Sharon does not
have zoning regulations, but it does have subdivision regulations. In its plan, Sharon continues
to classify land near the Norwich boundary as rural residential or forest reserve. Sharon’s land
use plan is compatible with this plan. However, as Sharon does not have zoning in place, its
ability to implement its plan is constrained. Currently, the rate of development in Sharon is
relatively low and what growth occurs causes little impact on Norwich. However, if conditions
were to change dramatically, substantial development in Sharon would affect Norwich,
particularly in the form of increased traffic on local roads.
Thetford. Thetford’s town plan was most recently adopted in March 2007, and the town has had
zoning and subdivision regulations since 1974. With the exception of a small village residential
area in Union Village, the land in Thetford abutting Norwich is envisioned for traditional rural and
low-density residential uses. Future development and population growth will be focused in
Thetford’s growth centers, which include five residential villages and two hamlets. Thetford’s
plan is compatible with this plan, which also recognizes the traditional settlement area of Union
Village as a potential rural hamlet.
Strafford. Strafford is a rural town that experienced rapid growth in the 1980s and relatively
slow growth recently. The town has had subdivision regulations since 1970 and zoning
regulations since 1978. Strafford’s town plan was most recently adopted in March of 2008. The
plan calls for growth management and preservation of open space. The area of Strafford near
the Norwich town line is designated for rural residential uses in their plan, which is compatible
with this plan.
Hanover. Hanover, as a developed town with limited land available for new construction
compared to most communities in the Upper Valley, has experienced slow growth in recent
years. Zoning is restrictive and the major employer, Dartmouth College, has been stable or
growing at a slow rate in recent years. Hanover is a source of employment, educational facilities,
cultural activities, retail stores, and professional services for Norwich residents, while Norwich is
home for many of those employed by Hanover businesses and institutions.
Lebanon. The City of Lebanon, largest of the municipalities in the Upper Valley with a population of
approximately 13,500, is a major employment and growth center with a daytime population of
approximately 30,000. Lebanon is the home to many of the Upper Valley’s largest employers
including Dartmouth Hitchcock Medical Center, Hypertherm and other high tech companies, large
retail stores, and service companies that provide employment and important services to Norwich
residents.
9
About Our Future
Sustainability Over the next 50 years, the Town of Norwich will continue to experience local forces of change
such as population growth and changing demographics, and global forces of change such as
rising commodity prices and climate change. Therefore, we recognize the need to plan for a
sustainable future for Norwich. Sustainability can be defined as meeting our needs in the
present without compromising the ability of future generation to meet their needs.
Sustainability is a philosophy that involves long-term thinking and balanced decision-making.
Now, and in 50 years, we want Norwich to be a community with the following characteristics:
Strong municipal leadership, citizen involvement in government, and transparency in
government decision-making;
Meaningful and productive partnerships with adjoining towns, regional organizations
and other stakeholders;
The ability to attract and retain a diverse and healthy mix of residents;
Viable local employment options;
Opportunities for involvement in cultural and recreation activities;
Clean air, land and water including reduced greenhouse gas emissions;
A high degree of walkability and alternative modes of transport besides personal
passenger vehicles;
Protected natural features and a compact settlement pattern;
Strong social ties and a common identity;
Solid investments in infrastructure; and
Affordable places to live.
It is not Norwich’s intent to strive for self-sufficiency, but to join with its neighbors in the region to
work toward a sustainable future together. A number of formal and informal regional efforts are
already underway that are improving sustainability in the region – Advance Transit, Upper
Valley Transportation Management Association (TMA), Local First Alliance, Upper Valley
Localvores, Valley Food and Farm, Upper Valley Land Trust, the regional planning commissions
and other organizations, governments, employers and individuals are taking part. This plan
focuses on specific actions for Norwich as a town, but it must be recognized that achieving our
vision for a sustainable future will involve both individual and coordinated regional action.
To achieve our vision of a sustainable community, we need to ensure that sustainable decision-
making is supported across the town. Therefore, we commit to incorporate the following
considerations during the implementation of this plan:
Ensuring that we leave a positive legacy for future generations.
Making decisions that balance environmental, social, cultural and economic trade-
offs over at least a 50-year time frame.
Reducing our ecological footprint by using our land, resources and energy efficiently.
Encouraging all residents to be actively involved in their community.

10
Smart Growth Central to achieving a sustainable future is the need to change our land use development
practices and patterns. Smart growth describes a pattern of land development that uses land
efficiently, reinforces community vitality and protects natural resources. Smart growth is about
ensuring that development is good for the economy, community and the environment.
The concept of smart growth establishes principles for a more sustainable community that
include:
Revitalization of, and directing of new development towards, existing settlement
areas.
Mixed land uses.
Compact building design.
A range of housing opportunities and choices.
Walkable neighborhoods.
A variety of transportation choices.
Distinctive, attractive communities with a strong sense of place.
Preserved open space, farmland, natural beauty and critical environmental areas.
Predictable, fair and cost-effective development review and decision-making process.
Community and stakeholder collaboration in development decisions.
Our land use plan for Norwich, as presented in Chapter 12, incorporates these smart growth
principles. The land use plan establishes the framework for Norwich’s land use regulations and
this plan includes recommended changes to those regulations to better support the smart
growth and sustainability principles outlined above.
Themes Each chapter of this plan ends with a series of goals and objectives. To achieve a sustainable
future for Norwich, these policies need to be considered as a whole, rather than taken
individually, with an understanding of the connections and potential conflicts that exist between
them. The following over-arching themes provide a framework for understanding the
relationships between the goals and objectives of this plan and our vision for a sustainable
future:
[TABLE]
Each of the goals and objectives of this plan support one or more of these sustainability themes.
These relationships are highlighted through the keyed symbols associated with each theme that
appear in the policy section at the end of each chapter of this plan. The sustainability themes
are also woven into the Implementation Program, which follows this section and which is
organized around four focus areas: sustainability, housing, natural and historic resources, and
energy efficiency.
11
implementation program
The Norwich Town Plan is a guide that does not make decisions or create mandates.
The long-term vision of the town, as reflected in the goals, objectives, and policies of
this plan, will be realized by implementing recommended actions listed at the end of
each chapter. As conditions change, the implementation process must remain flexible.
Existing zoning and subdivision regulations in Norwich may need to be revised to reflect
the plan’s objectives and policies. Other regulations governing roads, traffic, sewage
disposal, health, etc., may also need to be revised. Non-regulatory implementation
programs may include capital budgeting, public facilities planning, and natural resource
inventories. Programs combining public and private activity may include housing, land
conservation, historic preservation, and economic development. Decisions will be made
on the priorities of recommended actions; some programs may demand immediate
attention, others may not. Some changes to regulations should and can be made
immediately; others may need more research and discussion within the community.
While the Planning Commission, Conservation Commission, ad hoc committees, and
other public and private groups including the Fire District Prudential Committee may
take an active role in the implementation of the Town Plan by drafting changes in
regulations or creating specific programs, decisions involving town funds or changing
regulations will be made by the voters of Norwich, either directly at a Town Meeting vote
or by their elected representatives on the Selectboard or School Board.
[TABLE]

12
historic perspective
It is necessary to know where we have been and where we are now in order to
determine where we should be headed in the future. This basic principle applies to
charting our future course not only as individuals, but also as a town. The following is a
brief sketch of Norwich’s history, which provides insight into how the town arrived at its
current situation.
18th
Century
Formation and Founders
Norwich is one of four adjoining towns in the Upper Connecticut River Valley to receive
charters granted on July 4, 1761, by Governor Benning Wentworth. The other towns are
Hanover and Lebanon, New Hampshire, and Hartford, Vermont. Norwich’s first settlers
came, as did those of the other towns, principally from north-central Connecticut. They
traveled northward almost 200 miles up the Connecticut River and, in many cases, named
their new towns for their previous ones.
Generally, the men whose names appear on the charters – the grantees or proprietors –
were not the ones who settled the new land, but were the older and more established
inhabitants of their Connecticut towns. The younger men, those with the strength and skills
to be pioneers, to build sawmills and gristmills, to clear the forests, were the ones to
undertake the hardships of the move. In 1763, a few settlers came to Norwich and located
close to the river and in the Pompanoosuc area. The first clearing in the township was made
by John Fenton and Ebenezer Smith, both proprietors, and Fenton’s nephew, John Slafter,
son of proprietor Samuel Slafter.
The exploration and “sizing up” of the chartered township, which was “to contain six miles
square, and no more” began in 1764. Jacob Burton of Preston, encouraged by the
proprietors in Connecticut, made the journey north. He had the knowledge and the ability to
build and operate a mill, take the measure of the region and survey the town. He
determined suitable spots on Blood Brook for a sawmill and a gristmill. The location of
roads and lots needed to be planned, and there were other conditions laid out in the
Norwich town charter with which the settlers would have to comply. Burton’s own
permanent dwelling was constructed in 1767.
Among other early comers to Norwich were Samuel and John Hutchinson, who arrived in
1765. They cleared an island in the Connecticut River, planted corn on it, then returned to
Connecticut; the next year they came to stay. Nathan Messenger also arrived in 1765. His
13
cabin is thought to have been located near the Norwich end of the Ledyard Bridge.
Historic Settlement Areas
The confluence of the Ompompanoosuc and the Connecticut Rivers came to be known as
Pompanoosuc. Union Village in the northeastern part of the town is also on the
Ompompanoosuc. By 1795, a gristmill had been established there. Beaver Meadow (West
Norwich), now a small community, had its beginning in 1780 when its first settler, Conant B.
Sawyer, came from Hebron, Connecticut.
Lewiston, of which little remains, was located near the west end of the Ledyard Bridge. Dr.
Joseph Lewis settled here near the bank of the Connecticut River in 1767 and owned much
of the surrounding land. It was here that an early ferry provided transportation to the
Hanover side of the river. John Sargeant, the original operator (at least as early as 1771 and
probably in 1770) had a continuing conflict with Dartmouth College founder Eleazar
Wheelock over the ferry, and because Sargeant’s tavern apparently provided liquor for
Wheelock’s students. Lewiston’s demise came with the construction of the Wilder Dam in
1950 and Interstate 91 in 1968.
Norwich Center must be remembered for several reasons. It was here, on Meeting House
Hill, that Peter Olcott built his first house and barn in 1773. Olcott was a leading citizen of
the town, serving in various town and state offices, including that of lieutenant governor; he
was also a trustee of Dartmouth College. The first church in Norwich was built at the Center
on land given by Olcott. Begun in 1778, it was finally finished in 1785. For about two weeks
that same year, the Center Church served as the meeting place of the Vermont legislature.
All that remains now of Norwich Center is the burial ground on Meeting House Hill and
whatever archeological evidence remains of some 10 homes, shops, and offices.
Union Village, Pompanoosuc, Beaver Meadow and Lewiston are all rather clearly defined
places, but in addition there are settlements that did not develop business or commercial
places. Rather, they are distinctive and more nearly neighborhoods: Podunk, New Boston
and Tiger Town.
19th
Century
Population and Migration
Norwich now has a population of more than 3,500 people. Historically, the growth of the
town reflects trends elsewhere in the state and in the New England region, and has been
influenced by events throughout the country. Norwich grew quickly from the early settlers
to a peak population of 2,316 in 1830. After that date population slowly declined to a low of
1,092 in 1920. The 1830 figure was not reached or surpassed again in a decennial census
until 1980 when a count of 2,398 people was registered. (See Chapter 4)
While Norwich was becoming increasingly settled, land in the northern part of the state was
being opened up to development. The movement that brought settlers from Connecticut to
the region we now know as “the Upper Valley” was repeated, as residents of Norwich set

14
out to settle new lands further north. The movement actually began quite early; for
example, in 1803, after having lived in Norwich for some 20 years, Captain Benjamin Burton
with his family moved on to Irasburg in Orleans County.
Though they might not have always moved, Norwich residents were also active in
organizing other towns. Thus, we find that the proprietors of Randolph, Vermont, were in
large part from Hanover and Norwich. A History of Norwich, Vermont (1905) by M. E.
Goddard and H.V. Partridge notes that (p. 135) “the evidences of depopulation and
disappearance of houses in Norwich seem to be especially marked at Beaver Meadow, and
along the ‘turnpike,’…”
In the earlier portion of the 19th century, agricultural and forestry practices shared in
creating the conditions that made people living in Norwich seek new and unused lands. The
importance of good resource management had not yet been realized to any extent either
locally or nationwide. In 1840, for example, more than 13,000 sheep grazed in Norwich.
Sheep are close croppers and can quickly reduce the value of a hillside.
Just as local people left the town for places further north in the state, so residents were
enticed by the opening of the West with its vast natural resources. Jasper Murdock set out
as early as 1801 with his family, including his father-in-law, the Reverend Lyman Pottaer,
who had been the town’s first settled Congregational minister, to journey to Ohio (then the
Northwest Territory). The move of settlers westward whether into New York State,
Pennsylvania or beyond continued into the early-20th century and to such an extent that
emigrant aid societies were frequently formed and guidebooks were published for those
undertaking the trek.
Education
Looking at Norwich’s 200 years of history, a concern for education can be identified from
the beginning. The Vermont Constitution of 1777 had specified that each county should
have a grammar school. Windsor County built the first in 1785, located in Norwich. Between
1785 and 1841, 20 school districts were formed and these can still be identified on maps
such as the one in the Beers’ Atlas of Windsor County (1869). Some of the old schoolhouses
survive as present-day dwellings.
In 1819, Captain Alden Partridge, a graduate of the U.S. Military Academy at West Point and
its superintendent from 1815 to 1817, returned to his native town of Norwich and
established the American Literary, Scientific and Military Academy. From 1825 to 1829,
Partridge moved the school to Middletown, Connecticut, where he hoped to find a greater
potential and larger financial base; the school, however, returned to Norwich.
In 1834, it was incorporated as Norwich University. During the next 30 years, the university
had its ups and downs for apparently Partridge was not as good a businessman as educator;
he also quarreled with Truman B. Ransom, who succeeded him as president. Then, in 1866,
the South Barracks building was destroyed by fire. When the Town of Northfield, Vermont
offered both a location and buildings, the university accepted the invitation to move there.

15
The Norwich Classical and English Boarding School, a relatively short-lived enterprise,
occupied the North Barracks after the university’s departure. It operated from 1867 to
1877. The North Barracks burned in 1898, thus ending a dominating presence on the
Norwich Green.
Economy
Industry was supported by natural resources in Norwich. Business partnerships developed
along the river; the trade of timber and its by-product, potash, in exchange for rum,
molasses and sundries was especially lucrative between Norwich landowners and
merchants in Springfield, Massachusetts and Hartford, Connecticut.
As merchantable lumber dwindled, however, emphasis shifted to agriculture based on
wheat and other grains. In 1810, merino sheep were brought to Vermont and, by 1830,
Norwich, like many other New England towns, was raising them by the thousands. The wool
and the breeding stock itself were eagerly sought and easily transported elsewhere; wool
commanded high prices, particularly during the Civil War when the supply of cotton was cut
off and armies had to be clothed. During this time, wool was valued at $1.00 per pound
versus today’s value of about 25¢ per pound. That boom was over in the late 1860s,
complicated by tariff manipulations and unbeatable competition, first from western states,
then from Australia.
When dairy herds were introduced at the end of the century, the pastures yielded new
productivity. Though not clean sweepers like sheep, cattle demanded more silage (thus
more hay fields) and larger barns. The growth of the milk industry was gradual in the late
1800s, but, once secure, it caused a visual revolution in the landscape and helped slow
down the rate of population decline. A typical mid-19th century Norwich farm consisted of
about 150 acres, of which 125 were cleared and 25 forested.
Railroad
The Connecticut and Passumpsic Railroad, finished in 1848, connected the Upper
Connecticut River Valley to tracks across the country. When White River Junction became
the region’s principal railhead, Norwich farmers and merchants had a faster means of
transporting their produce and wares, by boxcar rather than wagon load. The railroad
replaced the Connecticut River as a trade route, eliminating the disadvantages of seasonal
transportation.
The sharply increasing demand of growing cities for fresh milk, cream, and butter brought
prosperity for those who had successfully shifted from shearing sheep to milking cows.
Already established communities like Lewiston and Pompanoosuc grew around railroad
depots. The former boasted its own store, post office, and coal and lumber yards.

16
20th
Century
Education
In 1963, Norwich and Hanover joined together in the first interstate school district in the
country, forming the Dresden School District. Its first annual report noted that the two
towns had “been impelled by common difficulties toward a cooperative solution of school
problems.” The district was established as an interstate compact by Public Law 88-177.
Infrastructure
In the 20th century, two technological advances affected the history of Norwich:
construction of the Wilder Dam and Interstates 91 and 89.
Wilder Dam, built south of town in 1950, is part of a network of water power dams that
altered farming patterns along the Connecticut River and its tributaries. Many of Norwich’s
fertile flood plains were submerged, including those in Pompanoosuc.
Perhaps the building of Interstates 91 and 89 most dramatically influenced the course of
Norwich history. Completed in the late-1960s, the four-lane highways connected Norwich
overnight to the entire East Coast and to the rest of the country. Travel time between
Norwich and Boston or New York City was cut in half. Dilapidated or abandoned houses
quickly became summer and retirement homes (a trend already evident in Beaver Meadow
in the 1940s), replacing working farms but rescuing some rural architecture.
Land Use
The second half of the 20th century saw Norwich transition from an agricultural to a
bedroom community. In 1940, it is estimated that one-half of the town’s land was cleared.
The trend away from agriculture is reflected by the fact that currently less than 30 percent
of the land is cleared.
Only a few people in town can remember seeing cattle being driven down Main Street to
their barns from pastures further out. While Norwich did exist for many years as a quiet
farming community, longtime residents have seen it change into a bedroom community for
nearby employment centers.
Those who work elsewhere choose to live in Norwich because of the town’s good school and
its proximity to Hanover, Dartmouth College, and the Dartmouth-Hitchcock Medical Center.
They come here for the kind of life that has disappeared elsewhere and which they perceive
can be found here. The Dartmouth presence is strong and the college and its library have
long drawn both summer people and permanent residents. Academics from other
institutions have been coming here since the 1940s, and many of them settled in the Upper
Valley after fleeing Europe during World War II. Others see Norwich as a place for
retirement; frequently these are alumni of Dartmouth College. All of these trends are agents
of change for Norwich.

17
town profile
With an understanding of recent growth trends, current community makeup, and likely
future change, a planning effort can better respond to residents’ needs, and better
account for the impacts and opportunities of growth. To develop a realistic set of growth
projections, a community profile accomplishes the following:
1) it documents the growth trends that have brought the town to its current
situation;
2) it assesses the current makeup of the town from demographic, economic and
social perspectives; and
3) it assesses the range of growth factors affecting the town.
In addition, the pace and form of land development has a great deal of significance to
the fiscal health of communities. Virtually any form of land development has two related
effects:
1) the generation of additional revenues in the form of property taxes; and
2) the generation of need for additional community services, which have
associated costs.
Accordingly, this chapter presents a variety of data that profile Norwich’s residents and
provide a basis upon which to move forward with planning efforts. It also provides
background on the town’s recent and current fiscal situation, and provides a basis upon
which to project Norwich’s fiscal future based on development trends.
Community Demographics
Historic Population Change
A review of historic population data for Norwich indicates that growth in the past few
decades has surpassed that of any previous period. The 1960s, ’70s and ’80s, in particular,
were periods of strong growth for the town, as a factor of both in-migration and natural
increase. This is shown in Figures 4-1 and 4-2, which trace Norwich’s population from the
first federal census in 1791 through the 2010 Census.

18
After a strong period of growth between 1791 and 1830, when the town reached a
population of more than 2,300 residents, a long period of population decline occurred. In
1920, Norwich reached a low population point of fewer than 1,100 residents. After some
slow growth in the 1930s and ’40s, population levels have increased at a rapid pace.
Between 1960 and 2006, Norwich’s population nearly doubled. Clearly, the past 50 years
have been a time of tremendous change in the town.
Recent Population Trends
For the 30 years from 1970 to 2000, Norwich’s growth rate outpaced state and regional
averages as shown in Figure 4-3. It was during the 1980s that Norwich experienced its
greatest absolute population growth. Figure 4-4 shows recent population figures for the
town. Trends indicate that the rate of growth, which slowed during the 1990s, has
continued that trajectory and has actually declined in the last decade. Norwich’s recent
growth trends mirror those of the state and region, which are driven by economic and
demographic factors.
Components of Population Growth. Population growth in any geographic area can be
broken down into two major components: natural increase and net migration. Natural
increase can be calculated by subtracting the number of resident deaths during any period
from the number of births to town residents. Net migration can be calculated by comparing
the number who move into a town with the number who move out of a town during any
period. These two components of Norwich’s recent population growth are shown in Figure
4-5. During periods of rapid growth, in-migration is typically the dominant factor, while
during periods of slower growth natural increase usually accounts for the larger share.
Overall, Norwich’s recent population growth occurred primarily in response to net
migration (new people moving into town).
Age Distribution. Distribution of the population by age group helps us to understand more
about the demographics of a town. Figures 4-7 and 4-8 contain a graphic comparison of the
distribution of Norwich’s population by age group, as well as data showing absolute changes
in each of these age groups.
Looking at how the town’s age profile has changed in recent decades suggests one major
factor in Norwich’s growth trends. The echo baby boom, which spurred population growth
beginning in the 1970s, peaked in the 1980s and ended in the 1990s. This is evidenced by
the large cohorts of children counted in the 1980 and 1990 census, and the town’s vital
statistics. The large baby boom generation has passed out of its childbearing years and
boomers are beginning to reach retirement age, as shown in the 2000 Census. The
generations that have followed the boomers are smaller, are having fewer children and are
waiting longer to start families.
The current age distribution in Norwich is a clear reflection of the aging of the baby
boomers, as well as the type of household that has migrated to Norwich over the years. In
many instances, new Norwich households are well-established families, with two parents
and older children. This is a reflection of Norwich’s attraction to families, as well as the

19
economic requirements of purchasing a home in town.
The 2012 Upper Valley Lake Sunapee Regional Housing Needs Assessment estimates that by
2030 more than one-third of the region’s population will be age 65 or older and nearly half
of all households will be headed by someone age 65 or older. Many seniors will want to “age
in place” but they will face challenges because the homes they are occupying today may not
meet their long-term accessibility, mobility and/or affordability needs. There is an
inadequate supply of housing located, designed and priced to meet future demand
Households
For planning purposes, growth trends in households are more relevant than population
change. It is households, rather than individual residents, that drive the need for housing,
infrastructure and services. Norwich, like communities around Vermont, has experienced a
declining household size in recent decades, coupled with population increases. This has led
to a growth rate for households that exceeds the population growth rate.
Household Size. In 1970, the average household size in Norwich was approximately three
people. That average had declined to 2.59 people per household by 2000. Average
household sizes in Norwich have consistently been larger than those in the region or state.
However, given the current age distribution of the town’s population, average household
sizes should be expected to decline further in future years unless there are changes in the
housing and economic factors that are currently preventing younger couples from moving
into Norwich. Regionally, nearly all the net growth in households during the past 20 years
has occurred in one- and two-person households.
Household Composition. The composition of households provides additional evidence
that Norwich is an attractive place for families to raise children. In 2000, approximately
one-third of Norwich’s households were married couples with children at home. This
percentage has been largely stable since the 1980 Census. By comparison, only 20 percent
of households in Windsor County are married couples with children. Nationally, households
composed of married families with children have declined as a percentage of the total
during the past few decades. Windsor County and Vermont as a whole have reflected this
trend.
Household Income. An investigation of income levels in Norwich suggests that the town is
home to relatively high-income households. Between 1980 and 2000, the median household
income in Norwich more than doubled to nearly $80,000 after adjusting for inflation, while
in Windsor County and statewide median household income rose by less than $10,000.
Figure 4-11 illustrates the income profile of Norwich households as documented in the
2000 Census.
During the 1990s, both the actual numbers and percentage of households in the lower
income brackets living in Norwich declined. The percentage of households in the middle

20
income brackets remained stable, while the town added households in the upper income
brackets. This reflects the cost of land and housing in Norwich, which is prohibitively
expensive for lower-income and many moderate-income households.
Growth Projections
Norwich’s profile is incomplete without an estimate of potential future growth in the town.
In a small community like Norwich, population and growth projections can be difficult. In
recent decades, Norwich has become a popular place for families to build or purchase a
home. This migration to Norwich has clearly ebbed and flowed in concert with the regional
economy. Nevertheless, it is reasonable to project that people will continue to find Norwich
an attractive place to live. It is the pace at which this migration to the town will occur that is
difficult to estimate.
Over the long term, the projections suggest that Norwich’s population will grow at an
average annual rate of less than one percent a year. However, the 2010 Census found
instead that the town’s population declined slightly below the 2000 level, making
projections for the near future problematic. As detailed above, the demographic
composition of residents is trending older, so substantial population growth due to natural
increase is not anticipated in the near term. Changes in the regional economy, however,
could quickly and dramatically change the anticipated rate of growth in town through in- or
out-migration.
The projection in Figure 4-13 breaks population growth out by age group, based on the
assumption that fertility and migration rates will remain at their current rates. The
projection shows the demographic profile of town residents shifting, as a larger proportion
of the population will be age 65 or older each period. These trends will not change unless
the factors, most notably the high cost of housing, that are discouraging younger couples
from choosing to live in Norwich change.
Fiscal Impacts of Growth As state tax and education policies in Vermont have changed over time, the fiscal impacts of
residential and business development on municipalities, school districts and taxpayers have
also shifted. This fact complicates any assessment of whether specific types of development
are fiscal “winners” or “losers” – that is, whether they bring more tax revenue into the
municipality than they cost in services, especially over the long term.
Vermont’s ongoing efforts to equitably fund education across the state have, over the past
decade, significantly changed the property tax system from one in which commercial
development was commonly perceived to reduce residential tax bills to one in which some
municipalities are encouraging family-friendly residential development as a way to lower
school taxes. Acts 60 and 68 changed Vermont’s school funding formula and implemented a
statewide system to redistribute education tax revenue based on spending per pupil. Under
the current education funding system, the argument can no longer be made that commercial

21
development will result in tax benefits for residential property owners.
Town and School Budgets
Town and school budgets continue to increase, as shown in Figure 4-14. Not surprisingly,
municipal and educational expenditures have reflected population and housing growth
trends. Increases in budgets have been accompanied by real increases in the tax burden
carried by Norwich property owners, as shown in Figure 4-15.
While budgets have increased, the distribution of municipal expenditures has remained
relatively stable. Approximately one-third of the town budget pays for highways. Public
safety costs, as a percentage of the total budget, have slowly risen over the past 20 years
and currently represent about one-quarter of the municipal expenses. Much of the increase
in the municipal budget is directly linked to increases in personnel-related costs such as
insurance, which are difficult to contain at the local level. Employee costs have impacted
school budgets similarly. For further discussion of Norwich’s education system, see Chapter
7.
Cost of Community Services
Despite the future uncertainty of the state education funding formula, the fiscal implications
of growth can be assessed based on current budgets, land uses and tax policies. A Cost of
Community Services (CoCS) study analyzes the financial demands of public services and
shows how much it costs to provide these services to residential, commercial and industrial,
working lands and open space, and public land uses.
Such a study, using the methodology developed by the American Farmland Trust (AFT), was
completed for Norwich based on the town’s 2007 Grand List and actual FY2007 budget.
CoCS studies in rural communities around the country have consistently shown that
residential development costs municipalities more in services than it pays in taxes while
working lands and open space pay more than they require in services. As shown in Figure 4-
16, residential land uses in Norwich break even on the municipal side of the budget, but
when school costs are considered they require $1.14 in services for every $1 in taxes paid.
This figure is close to AFT’s national average of $1.09 in services for every $1.00 reported in
their 2006 Cost of Community Services Studies Fact Sheet. Norwich’s open lands are a fiscal
“winner” for the town for both municipal and school budgets.
This CoCS study could be further refined by a detailed analysis of town revenues and
expenditures in order to more accurately allocate them between land use categories. Where
revenues or expenditures could not be directly attributed to a single land use (e.g.,
recreation to residential land uses), they were allocated based on the percentage of the
town’s total real property value in each land use category. The results of a CoCS analysis are
only a single-year snapshot. The study can be repeated on a regular basis to track changes
in the fiscal impacts of land use changes within the town.
Fiscal Impact Assessment
A common approach to assessing the fiscal impact of development relies on cost averaging,
22
which assumes that each new increment of growth will have the same costs as existing
development of the same type in the town. While useful as a general planning tool, this
method does not reflect the reality of how budgets are impacted by development. Most
municipal or school costs if graphed against population growth would look more like a set
of stairs than a straight line. Facilities and services are generally able to accommodate some
additional demand at their current size, staffing or funding level. Then a significant increase
in expenditure, such as to put an addition on a school or hire more police officers, is needed
to accommodate further growth.
It is often assumed that any development that does not increase the number of school-age
children living in town will be a fiscal winner. However, as the CoCS study shows, that is an
over-simplification of the fiscal impact of new development. Non-residential development
may not pay its own way on the municipal level, due to secondary impacts that vary
depending on the characteristics of the use. Non-residential uses may create substantial
traffic, which would increase highway expenses, or may require increased public safety
expenditures. Uses that create jobs may draw more residents. Under current state
education tax policies, an increase in school-age children would have a positive affect on the
education tax rate especially with under-utilized school facilities by increasing the per pupil
payments to the town from the state education fund.
As shown in the CoCS study, undeveloped land is the real fiscal winner. While in relative
terms undeveloped land does not contribute much in revenues, it generates very little
demand for services. Thus, it is important to consider the fiscal implications of the future
use of undeveloped land. It may be more fiscally prudent to retain undeveloped land,
particularly when land is remote, or would require expensive extensions of service systems
were development to occur.
Goals, Objectives and Actions
Goal A Protect the town’s fiscal health by guiding the location, form and pace of development
to make best use of existing facilities and services.
Objective A.1 Limit the rate of residential and commercial development to not exceed
the capacity of existing and planned municipal infrastructure, facilities, and
services.
Action A.1.a Enact a capital budget so that the pace of residential development can be tied to reasonable expansions of, and improvements to, service systems.
Action A.1.b Utilize capital planning and budgeting to minimize future tax increases and maintain a predictable fiscal situation for the town and its taxpayers.
Action A.1.c Continue to explore the possibility of providing municipal sewage disposal or other alternatives to individual on-site septic systems within the fire district area to support a more concentrated pattern of development.

23
Action A.1.d Incorporate fiscal impact assessment into the review and permitting of development projects to determine the appropriateness of a project within the context of overall planning for the town.
Objective A.2 Encourage development patterns that will minimize expected future tax
increases for Norwich’s taxpayers.
Action A.2.a Use the town’s land use regulations to guide future growth toward locations where it can make use of existing facilities and services.
Action A.2.b Determine what forms and in what locations non-residential development is appropriate for Norwich.
Action A.2.c Enact regulations to encourage reasonable amounts of non-residential development appropriate in scale for Norwich to occur in designated areas.
Action A.2.d Take measures to guide the location, form and pace of residential growth in order to encourage housing to be located in areas that are easily accessible to good roads, town services, schools and public transportation. .
Action A.2.e Designate growth centers, such as the existing village and potential outlying hamlets, as locations where higher-density growth will be encouraged to occur.
Action A.2.f Support development that can utilize existing service systems, including small extensions, in preference to development that would require new or greatly expanded infrastructure.extensions.
Action A.2.g Support increasing the supply of affordable and workforce housing suitable for familities with school-age children.
Objective A.3 Encourage the preservation of land in agricultural, wooded, or
undeveloped state, particularly in areas of town not well connected to
service systems.
Action A.3.a Use tax reduction techniques, such as 24 V.S.A. 2741, to stabilize and reduce taxes on agricultural land.
Action A.3.b Recognize the reduced value of conserved lands by ensuring their assessments reflect the fact that they will not be developed in the future.

24
housing plan
This section presents a perspective on current and future housing in Norwich. Housing
markets and related issues change over time, along with the economy and other
external factors; however, people will always need adequate shelter. It will be important
to consider the housing needs of residents of all ages, financial situations, and life-
styles. Concerns about climate change, renewable energy, and sustainability are also
considerations in planning for the future housing stock in Norwich. Regional economic
forces will continue to dominate the housing market in Norwich. No matter how active
the town may be in housing issues, it is unlikely to make any significant change in the
prevailing market. However, by recognizing local and regional housing needs, Norwich
can play a role in providing an adequate housing stock for a variety of population groups.
Housing Profile
Housing Construction Trends
Norwich’s housing trends directly reflect population growth trends. Because Norwich is a
primarily residential town that, in part, serves as a bedroom community for nearby job
centers, the town’s housing stock is focused on single-family homes, used on a year-round
basis. The town also has a small, but active, rental housing market that includes both single-
family and multi-family homes. Finally, there are some seasonal and second homes in the
town.
Since the first Census count of dwellings in 1940, the number of homes in Norwich has more
than doubled. The post-war housing boom and interstate highway construction fueled
demand in the 1950s and ‘60s. Over the next several decades, the region’s growing economy
drew new residents to Norwich, many of them young couples starting families. The 1970s
and 1980s saw more than 650 homes built. The pace of development slowed in the 1990s,
when less than 125 homes were added to the town’s housing stock. Between 2000 and 2010,
the town issued permits for 114 additional dwelling units.
Housing Types and Tenure
Norwich’s housing stock is strongly oriented toward single-family homes, as shown in
Figure 5-4. According to the 2000 Census, more than 85 percent of homes in Norwich are
single-family, detached units as compared to 67 percent of homes regionally or statewide.
During the 1990s, the town experienced a reduction in the number of attached dwellings
and mobile homes as shown in Figure 5-5. When compared with the county and state,
Norwich has fewer housing units in multi-unit buildings or in mobile homes.

25
Approximately 70 percent of Norwich’s homes were owner-occupied, according to the 2000
Census. The town’s owner-occupancy rate has been higher than state and regional averages
for many years. Norwich added rental units during the 1980s, but there was actually a small
decrease in the number of rentals during the 1990s. Norwich’s location near Dartmouth
College in Hanover and the Dartmouth-Hitchcock Medical Center in Lebanon, both of which
generate a substantial number of transient residents, suggests that there may be unmet
demand in the rental market.
Housing Values
Housing value is a good indicator of the dynamics of a town’s housing stock, and the kind of
activity that occurs within the housing market. As shown in Figure 5-8, a much larger
percentage of Norwich’s homes are high-value as compared to the larger region. With more
than half of its owner-occupied units having values exceeding $250,000, Norwich’s housing
stock is clearly in a high price range when compared with regional and statewide averages.
Further, less than 10 percent of owner-occupied units in town were valued at less than
$100,000, according to the 2000 Census. Norwich has an image as an expensive place to
live. Housing data confirms that this image is accurate.
Home Sales. The dynamics of the local housing market can also be summarized by a
review of numbers of sales and average sale values. Figure 5-7 shows the number of sales of
primary residences each year and the median value of those transactions. Primary
residences include single-family homes, condominiums and mobile homes with land where
the seller had 100 percent interest in the property, with transactions that were not deemed
to be arm’s length (such as transfers between family members) excluded.
Trends in Norwich’s housing market over the past two decades have been similar to those
throughout the northeast. The strong market in the mid- to late 1980s gave way to a weak
housing market in the early ‘90s. Housing prices began to rise sharply in the mid- to late-
1990s in response to a tight market. During 2006, the period of escalation in housing values
ended as the national economy began slowing and serious problems in the mortgage
market started to emerge. Over the past 20 years, the median sale price of a primary
residence in Norwich has increased more than $140,000 after adjusting for inflation. The
plummet in housing prices in 2009 is a reflection of the current economic and real estate
crisis and sale prices at that level are not expected to be sustained.
Housing Market Conditions
In assessing housing issues, it is important to maintain a regional perspective. In this region,
the housing stock and pricing can vary significantly from town to town. However, no
community is a closed system, where future housing needs can be projected based on an
analysis of the current population alone. Housing markets are always regional in nature;
regional demographic trends and in-migration/out-migration will affect demand levels and
pricing in Norwich. The town is part of a regional market, as many Norwich residents
commute out of the town for employment. Norwich is part of the Hartford-Hanover-
Lebanon labor market area (LMA), which includes 25 municipalities in Vermont and New
Hampshire.
26
The housing statistics presented above document that the town’s housing stock is heavily
weighted toward higher-priced, single-family homes. While these homes tend to be owner-
occupied, there is also an active rental market. Figure 5-8 contains a comparison of
Norwich’s housing stock with similar data for the larger region.
Not surprisingly, Norwich’s owner-occupied housing stock is more expensive than the
region’s. This reflects the predominance of expensive homes. Norwich’s housing stock
contains a small percentage of mobile homes, which offer an affordable housing option.
Condominiums, which offer an affordable housing option in other parts of the state, are also
not well represented in the local housing stock.
From a real estate sales perspective, sales of single-family homes dominate the Norwich
market. Recently, however, there are more frequent examples of these homes being
marketed as investment units to serve the rental market created by employees and students
of nearby Dartmouth College and the medical center.
Housing Needs
The demographics of a regional housing market can be used to assess general housing
needs. While a range of factors including individual preferences affect housing needs,
housing market analyses have made clear that age and income tell us quite a bit about the
kind of housing people want. With data regarding the current and projected mix of
households by age of household head and income, it is possible to make broad assessments
about housing needs.
For instance, a household with a head aged between 25 and 34 years, and an annual income
of $40,000 to $60,000, will probably be seeking, or have recently purchased, its first home.
Markets with a substantial number of households in this category will need affordable
starter homes. Similarly, most households with incomes below $40,000 are most likely to be
renters, while households with incomes of $60,000 or more are likely to be established
single-family homeowners.
In Norwich, the largest age/income household category is that with heads aged 35 to 54
years, with an income of $50,000 or more. This is, in part, a factor of housing availability.
These are the only households that can afford the kind of housing typically available in
Norwich. In contrast, the region’s mix of households is more diverse, as shown in Figure 5-9.
Since only a segment of all households will be seeking housing at any time, it is helpful to
assess the propensity to move of those in age/income categories, to estimate the size of
housing markets. Households in various age and income groups have markedly varied
propensities to move within the course of a year. Most significantly, the propensity to move
declines with increasing age and income. Younger, lower-income households are the most
likely to move, while older, higher-income households are the least likely.
Affordability of Housing
The State of Vermont defines housing as being affordable if households with incomes at or

27
below 80 percent of the county median family income spend no more than 30 percent of
their incomes on housing costs. Housing costs for homeowners include mortgage costs,
property taxes, and property insurance. Housing costs for renters include rent and utilities
(heat, hot water, trash removal and electric). The county median family income is set
annually by the federal Department of Housing and Urban Development (HUD) along with
income limits for households of various sizes (see Figure 5-10). HUD further classifies
income levels for its housing programs as follows:
Extremely low income = 30% or less of the median
Very low income = >30% to 50% of the median
Low income = >50% to 80% of the median
Moderate income = >80% to 100% of the median.
The 2015 plan for East Central Vermont, What We Want, states that “We must address the lack of affordable housing near jobs and service centers. By ‘affordable’ we’re talking about more than subsidized housing for low-income residents; we’re talking also talking about housing for skilled workers and professionals whose talents we need for a thriving community.” More than 1 out of 3 households in the region have a high housing cost burden (more than 30% if their income) and nearly 1 out of 6 households have a severe housing cost burden (more than 50% of their income).
Home Ownership. Based on the state’s definition, affordable housing levels for Norwich
have been determined as shown in Figure 5-10. Figure 5-10 calculates affordable monthly
housing costs and the amount of affordable homes available in town based on the assessed
value of residential properties. Currently, less than 10 percent of Norwich’s residences
would be affordable to a four-person household earning the median annual income for
Windsor County of $61,600. Even for households earning twice the median income, a large
percentage of the town’s homes would be unaffordable.
Housing affordability affects not only those trying to purchase a home, but households who
have already bought or own a home outright, especially when escalating sale prices result in
higher assessments of residential properties. According to the 2000 Census, 35 percent of
Norwich’s home-owning households had housing costs that exceeded 30 percent of their
income.
Rentals. While little data exists on current rents in Norwich, the pool of rental units is small
and the regional demand for rental housing is strong. Given these facts, rents are likely not
affordable for low-income households. The fair market rent for a one-bedroom apartment
in Windsor County in 2007 was $650 per month, which would be unaffordable to many of
the households seeking such units. According to the 2000 Census, 37 percent of Norwich’s
renting households had housing costs that exceeded 30 percent of their income.
Regional studies have found that rental housing affordable those earning entry-level
wages ($9-$20 per hour) in the area is virtually non-existent in the private, unsubsidized
market. They suggest that a larger share of future housing construction will need to be
rental and multi-family for the region to attract the necessary younger workers and to

28
serve an increasing demand from seniors for down-sized, more affordable or more
accessible housing units. The 2015 What We Want plan calls upon towns to identify land
in core areas and on transit routes that is suitable for development of new, energy-
efficient housing.
Future Housing
Diversity of Housing
A diversity of housing types, styles, and sizes meeting the needs of residents of all ages,
financial situations, and life-styles may require flexibility in land use regulations. Housing
types may include single-family homes, duplexes, multi-unit buildings, accessory
apartments, accessory or guest houses, and planned unit developments with higher-density
housing. Smaller homes, such as bungalows and cottages, built at higher densities can
provide moderate-priced housing. Open space and resource protection incorporated into
the site plan designs for multi-unit developments will balance the need for higher-density
housing with maintaining rural character.
Energy-Efficient Housing
Energy-efficient homes may cost more to build but will lower the cost of ownership and
consume fewer resources over time. Using energy-efficient building materials and
techniques, and incorporating of renewable energy sources for heat and power should be
encouraged and, in some cases mandated, for new homes. These concepts are discussed
more fully in the Energy Chapter.
Accessibility of Future Housing to Services
As discussed in the Land Use Chapter, most new housing should be easily accessible to town
facilities and services, including good roads and public transportation. Land use regulations
should allow for higher density housing in areas more accessible to these services and
facilities. Not only is this more convenient for residents, it lowers energy consumption for
transportation.
Future Affordability of Housing
Housing in Norwich is too expensive to purchase and maintain for many working
individuals and families who have traditionally lived and worked in town. “Moderate-priced
housing,” also known as “workforce housing” (120% or less of median income in Windsor
County), and “affordable housing” (80% or less of median income in Windsor County) are
both in short supply.
The town recognizes the need for a range of housing to meet demand at all income levels,
including those families earning below the county median income. Provisions for increases
of both workforce and affordable housing are critical given the housing market and related
rise in property values over the last decade. In addition, maintaining a supply of affordable

29
housing suitable for families with school-age children will benefit all taxpayers based on
current state education funding policies.
Increasing the supply of affordable housing in Norwich will not be accomplished by town
regulations alone. Although regulations allowing flexibility in housing types, site design,
mixed uses, and density in the appropriate areas are critical, additional non-regulatory
action supporting affordable housing funding through grant programs, public-private
partnerships, and other innovative programs are necessary due to the high cost of land and
construction in the town.
Housing for Seniors
Many older residents, wishing to continue to live in Norwich, look for housing that is
affordable and meets their changing needs. Considerations for senior housing, in addition to
cost, are locations that are easily accessible to basic services, stores, and public
transportation. Ownership options may include rentals, condominiums, “shared-housing,”
accessory houses and apartments, and smaller single-family homes such as bungalows and
cottage style housing. All of these may be designed to be more cost-efficient and meet the
needs of older residents. The existing HUD-funded 24-unit Norwich Senior Housing near the
Norwich Public Library on Dorrance Drive is an example of successful lower-cost housing in
Norwich that is accessible to public transportation and village services and stores.
Goals, Objectives and Actions
Goal B Provide for sustainable housing for residents of all income levels and ages.
Objective B.1 Encourage a diversity of housing types to accommodate all ages,
financial situations, and life-styles.
Action B.1.a Adopt land use regulations that recognize and allow for a diversity of housing types to meet the needs of all ages, financial situations, and life-styles.
Action B.1.b Maintain a supply of affordable housing suitable for families with school-age children.
Objective B.2 Encourage safe, energy-efficient housing.
Action B.2.a Consider adopting local building codes to maintain energy efficiency, personal safety, and sustainability.

30
Objective B.3 Allow growth in the housing stock to occur at a rate that is consistent with
the town’s ability to provide services in a fiscally sound manner.
Action B.3.a Determine Base future housing density in specific areas of town based on the area’s proximity and access to town facilities and services, including roads, public transportation, schools, and emergency services.
Objective B.4 Quantify the need for additional affordable housing in Norwich by
categories: “subsidized,” “affordable,” and “work-force.”
Action B.4.a Maintain updated statistics on demographic trends and housing for the town and the region to better evaluate the actual housing needs of the community on an ongoing basis.
Objective B.5 Make provisions for and facilitate the creation of different types of
affordable housing as needed.
Action B.5.a Explore and evaluate multiple strategies for encouraging the creation of affordable housing including, but not limited to:
1. Higher density bonuses for PUDs with affordable units.
2. Mixed-use development such as commercial/retail first floor with apartments on upper floors.
3. Density incentives for smaller houses, bungalows, or cottages, and accessory apartments or houses in or adjacent to existing houses.
4. Innovative construction techniques to reduce costs.
5. Inclusionary zoning.
6. Removing unnecessary provisions in the land use regulations that may limit affordable housing.
7. Support of public and private programs to provide financial support for affordable housing.
8. Finding funds for affordable housing through grants, government funding, and private partnerships.
Objective B.6 Participate in regional solutions for affordable housing.
Action B.6.a Determine Norwich’s “fair share” of the regional housing need for households of low and moderate income.
Action B.6.b Coordinate affordable housing programs with neighboring towns and share support services such as maintaining covenants for perpetual affordability of properties.

31
Objective B.7 Quantify the need for additional senior housing in Norwich.
Action B.7.a Maintain updated statistics on demographic trends and housing for the town and the region to better evaluate the actual housing needs for seniors of the community on an ongoing basis.
Objective B.8 Make provisions for and facilitate the creation of different types of senior
housing as needed.
Action B.8.a Accommodate more housing for seniors near the Village Center or in other areas accessible to services, public transit, and stores.
Action B.8.b Provide waivers in land use regulations for parking and density that reflect the needs of seniors.
Action B.8.c Allow for varying forms of ownership for senior housing: apartments, condominiums, “shared housing” (single-family home shared by unrelated residents), or single-family homes.
Action B.8.d Find funds for senior housing through grants, government funding, and private partnerships.

32
Economic development
A local economy can be viewed in two ways:
1) What economic activities occur within the town; and
2) In what local or regional economic activities are the town’s residents involved?
While Norwich is often regarded as a bedroom community, the data make it apparent
that there is local economic activity. However, it does not appear that the business
community has experienced much growth during recent years.
Profile
Labor Force
The Vermont Department of Labor reported that 2,070 Norwich residents were in the labor
force in 2008 and the unemployment rate was 2.1 percent (well below the state average of
4.5 percent). According to the 2000 Census, 60 percent of the local labor force was
composed of private wage and salary workers, 19 percent worked for government and 21
percent were self-employed or business owners.
The percentage of Norwich residents who are self-employed was higher than in the county
or state as a whole. According to the 2000 Census, 31 percent of Norwich households
reported earning self-employment income, compared to 20 percent of county residents. The
number and percentage of town residents who were self-employed increased during the
1990s and has likely continued to increase during the 2000s. Over the years, home
businesses have been started in Norwich only to outgrow their locations and then move to
one of the nearby communities where suitable locations and the infrastructure needed to
support larger business are more readily available.
Norwich residents are a part of the regional economy, and find jobs in a variety of industries
and occupations. Figure 6-2 compares the distribution of Norwich residents’ employment
by industry and occupation with similar breakdowns for Windsor County and Vermont.
Clearly, Norwich residents’ jobs show a different distribution by industry than county and
state averages. These differences reflect the importance of Dartmouth College and the
Dartmouth-Hitchcock Medical Center as sources of employment for Norwich residents.
Additionally, a high percentage of town residents work in a professional specialty.
Employment
The analysis of employment trends that follows is based on employment data provided by

33
the Vermont Department of Labor; however, the department only reports information on
jobs covered by unemployment, which excludes the self-employed, most business owners
and some farm employees. Therefore, it is likely that the “covered employment” numbers
underestimate the total number of jobs in town by 25 to 35 percent.
Employment trends in Norwich have largely mirrored regional economic cycles. Job
creation was strong during the early-1980s and from the mid-1990s through the early
2000s. The recent recession has had a significant impact in Vermont.
Figure 6-1 shows comparative “covered employment” increases in Norwich, Windsor
County, and Vermont between 1978 and 2010. Note that the figures refer to the number of
people employed in each of these geographic areas, rather than employed residents.
Over the past 30 years, the total number of establishments (employers) in Norwich has
more than doubled. In 2008, this included 123 private businesses and five public sector
employers. While accounting for a small percentage of employers, the public sector
provides 13 percent of the jobs in town. The private businesses in Norwich are generally
very small, with an average of six workers. Most of these private businesses are in the
service sector, reflecting the importance of the retail stores, professional and business
services in the village area. Norwich does not have any single large employer.
While Norwich does maintain a healthy employment base, the town is not a significant
regional job center. Three local communities (Hartford, Hanover and Lebanon) provide a
substantial amount of employment. A substantial number of Norwich residents commute to
these other communities for their jobs (see Figure 6-4).
Wages
Wages paid by Norwich employers (see Figure 6-1) have increased more quickly than state
and county averages over the past three decades, but they remain slightly lower (due to the
fact that many of the town’s jobs are in lower-wage sectors like retail and other services)
than state or county averages.
Livable Wage. Given the income levels of Norwich households, as documented by state
income tax returns and Census data, very few are dependent on a single wage-earner
earning average wages (see Figure 6-5). However, there is growing concern in the state
regarding the ability of full-time workers to earn an income sufficient to meet a family’s
basic needs, commonly referred to as a “livable wage.”
The Vermont Joint Fiscal Office reported that an annual livable wage for a family of four
with two working parents in 2009 was around $80,000, while for a single person with no
children it was around $35,000. In all cases, the livable wage is higher than the state’s
minimum wage. Given that these numbers are based on state averages, the cost of housing
in Norwich would result in a higher livable wage locally.
Focusing economic development activities on the creation of well-paying jobs is especially
34
critical in Norwich to ensure that residents can meet their basic needs, especially in light of
local housing costs discussed in Chapter 5 and other costs like health care, food and energy
that are anticipated to increase in future years.
Business Receipts
In addition to employment and wages, another useful measure of economic activity may be
found in the receipts generated by local businesses. Figure 6-3 shows total tax receipts
reported by Norwich businesses for each fiscal year between 2001 and 2010. Gross receipts
are for all reported retail sales, including those that are not subject to the Vermont sales tax
(e.g., groceries, medicine, etc.). Gross business receipts increased by 96 percent between
2001 and 2010, after adjusting for inflation, to more than $119 million.
Sustainable Development
External changes suggest that it may become increasingly important to develop a
sustainable local economy that focuses on local markets and local resources, and that serves
to strengthen the local community as a means of responding to global uncertainty.
Sustainable economic development may be characterized by activities and industries that:
F Maximize use of local resources in a manner that does not deplete those resources;
F Are energy efficient, and emphasize the use of local renewable energy sources;
F Maintain high standards of environmental health and don’t degrade the quality of our
water, air and soils or the viability of native wildlife populations;
F Provide goods and services that are needed locally, and provide an alternative to goods
produced outside of our community or region;
F Reinforce traditional settlement patterns;
F Employ local residents and pay a livable wage;
F Are locally owned and controlled, and reinvest in the community; and
F Contribute to the vitality of our community, including the social fabric and well being of
residents.
Economic development that emphasizes sustainability should take precedence over other
economic activities that do not exhibit the characteristics listed above.
Goals, Objectives and Actions
Goal C Build a sustainable local economy and create jobs that pay wages sufficient for
workers to afford to live in Norwich.
Objective C.1 Guide commercial development in accordance with the land use policies
of this plan, in particular Objective K.3 and its associated actions, and
identify appropriate locations where mixed-use development patterns
would be encouraged.

35
Objective C.2 Offer broadband service to all homes and businesses in town to support
residents’ ability to work from home and allow entrepreneurs who live in
Norwich to locate their businesses in town.
Objective C.3 Allow for home businesses throughout Norwich to the extent that they do
not affect the quality of life in their neighborhood or unduly burden
community infrastructure such as roads.
Objective C.4 Ensure that the scale or rate of commercial or industrial development in
Norwich does not exceed the town’s ability to provide facilities and services,
or increase costs for current taxpayers.
Objective C.5 Recognize that creation of livable-wage jobs is a necessary component of
achieving the town’s objectives related to maintaining a diverse, multi-
generational population and a high-quality, affordable local school system.
36
education
Education is an important aspect of the Norwich community. For many years, the town’s
reputation for having an excellent school system made it a popular choice for families,
both those new to the Upper Valley and those wishing to relocate as their children reach
school age. As is true statewide, declining enrollment in recent years poses a fiscal
challenge.
Primary and Secondary Education
Background
The Norwich school system is made up of two school districts. The Norwich School District
is responsible for educating children from kindergarten through grade six at the Marion
Cross School in Norwich. The Dresden School District, which includes the towns of Norwich
and Hanover, New Hampshire, serves Norwich children from grades seven through twelve
in the Richmond Middle School and the Hanover High School, both in Hanover.
The Dresden School District was formed in 1965, and was the first interstate school district
in the country. Before that time, Norwich educated students through eighth grade and high
school students were tuitioned to other towns, primarily Hanover.
Enrollment Trends
The Marion Cross School has seen major facility expansions, in the 1950s and most recently
in 1989. The more recent addition was in response to dramatic increases in the school age
population in the latter half of the 1980s as a result of the “echo baby boom.”
Enrollment peaked in 1995 when 487 students were enrolled at the elementary school, as
shown in Figure 7-1, and then declined sharply through the early 2000s. Between 2003 and
2007, enrollment stayed fairly stable at between 300 to 310 students. Enrollment fell below
300 students in 2008, slipped further in 2009 and rebounded to 305 in 2010.
In 2011 through 2015, enrollment is expected to vary between 296 and 358 students (see
Figure 7-1). Declining enrollment numbers create a financial strain on taxpayers because
state education funds returned to the town are based on spending per pupil. Many of the
fixed expenses of operating the school cannot be reduced when the enrollment drops.
Educational Facilities
The 1989 Marion Cross School expansion increased classroom capacity to a theoretical
maximum of 420 students. While this suggests that there is substantial excess capacity at
37
current enrollment levels, it should be noted that the school is using space much differently
today than it did 20 years ago. Interdisciplinary curricula, cooperative group learning,
inclusion of students with disabilities, inclusion of technology in day-to-day classroom
learning (rather than solely in a computer lab), differentiation, full-day kindergarten, etc., all
require more space for a smaller number of students. That said, it is clear that Marion Cross
has accommodated, and could accommodate, substantially more students than it does
today.
While the Marion Cross School does not participate in the federal school lunch and
breakfast programs, it does provide a lunch or breakfast to any student in need. In Vermont,
the state legislature passed Act 22 in 2003, which requires that public schools participate in
the National School Lunch Program and the School Breakfast Program unless the school
board votes to exempt the district from the requirement. The purpose of the program is to
ensure that all students receive healthy meals so they are better able to learn. The program
has many federal record-keeping requirements and would be an additional expense for the
school. The need for Norwich to participate in this program is evaluated annually by
administrators, teachers, and the School Board. In addition, the draft long-range plan for
the Marion Cross School includes as a sub-goal “ensure that all students’ nutritional needs
are met” and the subcommittee tasked with implementing this section of the long-range
plan will be considering different ways to meet this challenge.
While the last major renovation to the Marion Cross School was completed in 1989, the
building and grounds have been kept in excellent condition through the dedicated efforts of
the school’s maintenance staff. During the summer of 2009, the building’s exterior was
painted green. This was especially appropriate, given a number of other building initiatives
of the past few years. According to Vermont’s School Energy Management Program, Marion
Cross uses 35 percent less energy per square foot than the average school in the state (see
Figure 7-2). Investments in lighting, insulation and solar panels are paying off in terms of
lower fuel bills for both electricity and heating oil.
Major capital programs at both the Richmond Middle School and Hanover High School were
completed in the past few years. The Richmond Middle School, which was formerly located
on the same campus as the high school, moved to a new building on Lyme Road in 2005. The
facility, which cost $18 million, is just one reason why the Richmond school is widely
recognized as one of the best middle schools in New England. Last year, Richmond Middle
School was selected as a spotlight school for the New England League of Middle Schools.
This designation is based on test scores, academics, the overall atmosphere of the school
and a number of other criteria and is awarded based on a review by peer educators.
A $24 million renovation of Hanover High School was completed in 2007. This renovation
effectively resulted in a new school, with a new auditorium, gymnasium, cafeteria, library
and classroom spaces. Hanover High School is widely regarded as one of the best public
high schools in the country. It was rated in the top 200 high schools in the nation by U.S.
News & World Report, and was also highlighted by Business Week as a top-performing
school.

38
School Missions and Philosophy
Marion Cross School. “The Marion Cross School Community values a tradition of
educational excellence and is committed to nurturing the whole child in a climate of respect.
We promote excellence and encourage a love of learning; we demonstrate and encourage
mutual respect among students, parents, faculty and community members; we provide
opportunities for every child to develop his/her full potential; and we cherish our traditions
and our school’s place in the community.”
Richmond Middle School. “Our mission is to provide a challenging, comprehensive and
developmentally appropriate education for all of our students. Our broad goal during these
three years is to ensure that our students are provided with the skills to become successful
and thoughtful adults in a highly competitive and complex world. It is the task of our middle
school to bridge the growth gap between childhood and adulthood, from dependence to
independence, and from understanding the world in a simple and concrete manner to
comprehending it in its multifaceted, multi-layered configuration. The educational
community represented by the Dresden Board, parents and community members, and the
Richmond staff has identified important concrete goals which guide our school in its pursuit
of the effective and compassionate education of children in their middle years.”
Hanover High School. “Hanover High School is an active learning community that
provides broad academic and co-curricular programs. We engage students’ minds, hearts,
and voices so that they become educated, caring, and responsible adults. All students are
given the opportunity and encouragement to use their:
Minds to pursue excellence, academic challenge, and personal success.
Hearts to respect and care for the emotional and physical well being of themselves
and others, and for the environment.
Voices to contribute to the democratic process and the common good.”
Cost of Education
Costs related to the education of Norwich children are borne directly by the taxpayers of
Norwich, in full for the Marion Cross School and in proportion to the number of Norwich
children for the middle and high schools.
In recent years the proportion of Norwich students at the Richmond Middle School and
Hanover High School has dropped, from more than 40 percent to currently about one-third.
Accordingly, Norwich’s assessment for the cost of the middle and high schools has been
reduced in recent years. This proportion is not expected to change materially in the next
five years.
Costs for Marion Cross grew more substantially between 1999 and 2003, but have
moderated in recent years. In 1999, the per-pupil cost as defined by Vermont’s “allowable
tuition” (current per-pupil expenditures excluding tuition, transportation, debt and special
education) was $6,382 and Norwich ranked 56th in the state by this measure (with the
school ranked first having the highest per pupil expenditures). By 2003 the per-pupil cost

39
was $9,579 and Norwich ranked 21st in the state (out of more than 200 elementary
schools). Five years later, in 2008, the per-pupil cost had increased to $10,042 and Marion
Cross ranked 98th in the state. Over this five-year period, the rate of increase was less than
one percent per year.
Figure 7-3 shows the tax paid or projected to be paid on a house with a value of $410,000 in
2005. In the initial year, the tax paid was $5,894. For 2010, the tax had increased to $6,289.
By 2014, the end of the five-year planning period, the tax is projected to be $6,611.
However, it should be noted that 30 percent of Norwich taxpayers receive some reduction
based on their income level.
Private Schools and Home Study
Private schools in the area include The Waldorf School, Crossroads Academy, Willow
School, Cardigan Mountain, Mid-Vermont Christian, Sharon Academy, and Kimball Union
Academy. A handful of Norwich students are home-schooled.
Issues
The following issues are likely to be faced by the educational system in the near future:
State and federal requirements concerning facilities and special needs are likely to
continue to increase. This will require modifications to the building to accommodate
special-needs students as well as more space for fewer students.
State and federal requirements concerning employment of Special Educators.
Need to remain current in technology.
Rising cost of employee benefits.
Continuing regional decline in enrollment.
Long-Range Planning
The Norwich School Board is engaged in a long-range planning process that will develop a
three- to five-year Long-Range Plan to look at educational goals and ensure that students
have an excellent education that meets the future needs of society. This plan will deal with
such concerns as maintaining high academic standards, an excellent faculty, appropriate
building space for an outstanding curriculum, a commitment to the growth and
development of the individual student, a positive attitude toward change, and a sound
financial management program.
Post-Secondary & Adult Education Vermont Technical College, The Community College of Vermont, Granite State College and
Lebanon College--the latter two in New Hampshire--have programs in technical and post-
secondary education. Dartmouth College in Hanover provides opportunities for adult
education through its MALS (Master of Arts in Liberal Studies) and ILEAD (Institute for
Lifelong Education At Dartmouth) programs.

40
Childcare Most Norwich parents are employed and depend on childcare services for preschool-age
and older children after school, during holidays and summer vacations. According to the
2005-09 American Community Survey, 48 percent of the town’s preschool-age children and
26 percent of the school-age children had a parent who was not in the labor force.
The Marion Cross School began offering a full-day kindergarten program for all school-age
children beginning in the 2009-10 school year. Marion Cross School also provides special
education services to children starting at age three.
There are several childcare providers located in Norwich and many more in neighboring
communities. The Childcare Center in Norwich serves children aged six weeks to six years.
The Norwich Nursery School has programs for toddlers and preschoolers during the school
year. The Marion Cross school also houses an after-school program for students operated by
the Child Care Center in Norwich. The Child Care Project, housed at Dartmouth College, is
available to assist all Norwich parents in finding childcare.
Goals, Objectives and Actions
Goal D Provide cost-effective educational facilities suitable for supporting quality education
for Norwich students.
Objective D.1 Monitor population changes closely and thoroughly investigate available
options on an ongoing basis to allow the community time to react to future
needs for both the Norwich and Dresden School District schools.
Action D.1.a Schedule and publish an annual review of all pertinent statistics and updated projections relative to changes in future school populations of both Norwich and Dresden that might have significant tax implications for Norwich.
Action D.1.b Evaluate annually any long-range needs for the Norwich School District that pertain to projected enrollments, future land needs and future capital expenditures.
Action D.1.c Explore whether the present arrangement is still the fairest manner to apportion Dresden School District costs between Hanover and Norwich.
Objective D.2 Continue to pursue sustainability and reduced energy usage in the
operation of school facilities and programs.
Note: Goals from the long-range plan will be added when that plan is adopted.

41
community facilities & services
This chapter addresses the operation of town government and the delivery of services.
Many of the policies and guidelines for the work that is done are covered in the
transportation, natural resources, land use, and financial policy chapters. This chapter
contains an overview of town facilities and services from two perspectives:
(1) The current state of the facility or service and whether there are issues to
resolve; and
(2) Changes expected over the next 5 to 10 years relating to facilities and
services.
It is the goal of this chapter to encourage the town to plan for changes in future years,
and to establish priorities for facility and service improvements in conjunction with a
Capital Improvement Plan (CIP) for funding for these improvements.
Introduction Municipal government provides and maintains facilities and services. These include solid
waste disposal and recycling, roads and sidewalks, emergency services (including police,
fire protection, and emergency medical response), recreation, and administration of these
functions. In order to pay for these services and the schools, the town assesses property and
collects taxes.
During the past 30 years, both population growth and the increasing expectations of
Norwich residents have resulted in significant facility and service expansions and
improvements. Town budgets have reflected these changes. As shown in Figure 4-3, the rate
of growth has slowed since the late 1980s, even during periods of a strong economy. This
slower growth rate probably continues as a result of changes in land use and wastewater
regulations.
Although most aspects of town services have become more efficient through technology and
better planning, there have been expansions of town administration budgets due to
decisions to turn to professional management to take charge of town operations formerly
run by volunteers. These decisions include the addition of a part-time professional assessor
in 2001, the switch to a town manager/selectboard form of government in 2002, and the
addition of a part-time paid fire chief in 2008. Another source of increased municipal
expenses has been unfunded mandates by the state, requiring the town to perform
additional services at its own expense.

42
Facilities
Public Works Buildings
The existing Department of Public Works Garage, built in 1976, is an 80-foot by 50 foot (4,000 square foot) steel frame building with five bays and limited additional space for storage, and administration. There are no offices or break rooms separate from the garage work area. A 2012 report listed many functional deficiencies, code compliance issues, and additional operational space needs. Proposals to double the size of the building and address the deficiencies were presented to the town along with bond votes including a Public Safety building for fire and police twice in 2015 and defeated. In January of 2016, the town submitted an application to FEMA to use $ 432,968 of Alternative Funds from the loss of the Norwich Pool Dam in Irene to add a 4,000 square foot addition on to the building to house office space and other necessary enclosed spaces. The project also addresses energy efficiency and indoor heated storage for additional vehicles and equipment. Funding was approved in February 2017 and construction is scheduled for the summer and fall of 2017.
Fire Police Public Safety Building
The existing Fire Department Building was originally built in 1925 as a wood frame building and was replaced in 1980 with a steel frame 4,096 square foot garage with a brick veneer façade, and a wood framed training / meeting room. The building is marginally heated and there was an exhaust extraction system for the fire apparatus installed in 2009. The building is of adequate size to house the fire apparatus and equipment but does not have enough room for essential support activities.
The current Police Department office, adjacent to the Fire Department Building, was built as a private residence in 1957. The town acquired the building in 1994 as a short term solution for housing the Police Department. The plywood sheathed ranch style house on a slab was never designed to accommodate the complex requirements of a modern police department and with minimal maintenance over the past 25 years, the building has structural, insect, rodent problems and many code deficiencies.
Proposals to build a new Public Safety building for fire and police adjacent to the existing Fire Department building were presented to voters, along with bond funding, twice in 2015 and were defeated. The voters approved a third plan and bond for $ 1,400,000 in November 2016. Construction for the new building is scheduled to start late spring of 2017.
Tracy Memorial Hall (Town Hall)
Tracy Hall, completed in 1939, contains seven town offices, record vaults, a gym/auditorium, and two meeting rooms. The building underwent major interior and structural renovations in 1994–5, including an installation of an elevator, new electric service, wiring for IT services, new HVAC, and reconfiguration of spaces. The cost was approximately $850,000 funded with a 20-year bond, which was retired in 2016. All spaces are used by town offices, recreation, and, when available, by outside groups.
Capital Planning and Budgeting
43
Since 1994, major renovations and new buildings have been funded with bonding. Repairs, maintenance and and minor improvements are funded from reserve accounts established for each building. The reserve accounts are funded annually based on the age of the building and anticipated major repairs. The amount for the Tracy Hall reserve account has been increased in recent years in anticipation of replacement of HVAC equipment, flooring and major repairs. Funding of reserve accounts for buildings being replaced with new ones will be reduced.
Public Works Department In 2007, the Highway Department, Solid Waste and Recycling Department, and a new
Buildings and Grounds Department were combined into the new Public Works Department
under the Public Works Director (the former Highway Administrator). This created a more
efficient arrangement promoting the sharing of resources. Buildings and Grounds now
maintains recreation fields, town-owned open space along highways, and the grounds
associated with town buildings and facilities, and performs other maintenance projects that
were formerly contracted out in a piecemeal manner.
The Public Works Director, who reports to the Town Manager, oversees department
operations and staff and also prepares budgets, bids for major purchases, multi-year paving
and bridge repair plans, and grant applications. As with most town departments, federal
and state policies and regulations have greatly increased the administrative work-load at
the town level.
Highway and Bridge Maintenance
The Highway Crew, comprised of five full-time employees and a seasonal employee,
maintains the roads, bridges, and equipment. Major equipment includes:
5 plow/dump trucks
1 mid-sized truck for in-town use
1 pickup truck
1 loader
1 backhoe loader
2 graders
Replacement of equipment is funded from a designated equipment fund supported with
annual budgeted payments determined by long-range equipment replacement needs. Major
equipment purchases have also been paid by low-interest, short-term bonds. Public Works
Equipment is included in the 2006 Norwich Capital Budget Plan and Report (known as
Norcap).
Smaller road maintenance projects and maintenance of the unpaved roads are performed
by the highway crew in the summer season. Major projects, including re-treatment of paved
roads and bridge replacement, are contracted out. Re-treatment of paved roads represents a
44
significant portion of the Public Works Budget (20% in 20092017), and according to a study
done in 2005 known as the Marcon Report, should be closer to 30 percent % in order to
prevent the roads from deteriorating over time. The long-term costs of fixing deteriorated
roads far exceed those of maintaining the road surface on a regular basis. In addition to
maintaining roads, the town Town of Norwich has 69 major bridges and stream crossings,
822 road crossing culverts, and 326 driveway culverts to maintain. The town receives some
state funds for maintaining roads based on mileage and also receives special grants for
major paving projects. In past years, the town received state funds for bridge replacement
and repair. In the future these funds are to be allocated regionally based on importance to
the region and condition of the bridge. This will reduce funds available for smaller bridge
projects.
In addition to ongoing equipment replacement needs, the Public Works Department’s main
garage is in need of either replacement or major renovation and expansion. Additional bays
and work space are needed in order to protect the investment in expensive equipment and
maintain a safe environment for town workers. Preliminary plans are in place for this
project and it is included in the 2006 Norwich Capital Budget Plan and Report (Norcap).
The impact of future growth on the highway and bridge maintenance budgets is primarily
dependent on the location of development, rather than how many new houses are built.
Development in areas accessed from state highways may have a minimal effect on the town
highway budget, as opposed to development in areas far from the village on narrow town
highways at higher elevations. Land use policies will affect future highway and bridge
budgets.
Buildings and Grounds
The Buildings and Grounds Department, established in 2008, includes one full-time
employee responsible for maintaining the grounds of all town property, maintaining
sidewalks during the winter, repair and maintenance of town buildings, and maintaining
recreation fields and facilities. The department’s equipment includes a Holder articulated
tractor (used for removing snow from sidewalks and for mowing), additional mowers, and
other tools.
The need for the Buildings and Grounds Department was precipitated by agreements with
the state requiring the town to maintain some areas adjacent to state highways in exchange
for the state constructing enhancements. The department also lowers the cost of
maintaining town property by eliminating the use of multiple outside contractors. The
department maintains recreation fields, town-owned open space along highways, and the
grounds associated with town buildings and facilities, and performs other maintenance
projects that were formerly contracted out in a piecemeal manner.
Solid Waste and Recycling
Norwich residents use the transfer station off New Boston Road for most of their solid
waste disposal and recycling needs. The station is managed by the Public Works
Department and is staffed by three part-time attendants and volunteers. Residents have the

45
option of using a private hauler or taking their trash and recyclables to the transfer station.
Over the years, there has been a steady increase in the types of materials accepted for
recycling. Resale of recycled materials helps to fund the facility, but is subject to
unpredictable fluctuations in the marketplace.
The town’s membership in the Greater Upper Valley Solid Waste Management District
provides residents with additional options for disposing of hazardous waste at special
collections in the district, and access to the Hartford Solid Waste/Recycling Transfer Center,
where construction and demolition waste may be disposed of along with recycled materials
and trash.
The district, consisting of 10 towns, owns a permitted site for a new landfill in Hartland,
which may be constructed and opened in the near future. This new facility is projected to
receive the district waste for more than 50 years. Additional solid waste from other regions
of Vermont and New Hampshire will provide substantial funding for the facility.
Reduction of the volume of solid waste through recycling and the purchase by residents of
goods with less packaging has been a goal of the town and the district. Education of
residents and businesses has been an effective tool for reducing the amount of solid waste.
Utilities
Water Supply
The Town of Norwich currently has no direct role in public water supply. All properties,
except for those within the Norwich Fire District, obtain potable water from on-site wells or
small, state-regulated water systems. The district, managed by the Prudential Committee,
operates a public water system serving the historic village center and some outlying areas.
This water system was substantially improved in the late 1980s. A 1988 well rehabilitation
program resulted in substantial water capacity beyond current needs. The Prudential
Committee foresees no major changes to the system during the next few years, but is
considering possible connection to the Hanover system as a backup service measure.
The water service area has undergone only minor geographic expansions over the past 20
years. The last major expansion in the water service area was the addition of the McKenna
Road properties. More recent expansions have been incremental in nature, and have
included only one or two buildings at a time. No significant expansions to the system are
anticipated at present. The district’s policy for expansion requires a developer to provide
complete funding for any system improvements. However, in most instances, the absence of
municipal water is not a limiting factor on development capability in Norwich.
The Norwich Fire District (not to be confused with the Norwich Fire Department) was
created in 1922 and operates as a municipal entity within the town with its own right to tax
and create ordinances. A three-member Prudential Committee elected by the voters of the
district governs the district, which includes the Village Business and Residential Districts
and some additional properties along Route 5 North.

46
Over the years, the Fire District has performed various governmental services for its
constituents and the residents of Norwich, including zoning ordinances (before town-wide
zoning was adopted), operating the volunteer fire department prior to the town taking over,
installing sidewalks, and enacting specific ordinances regarding hunting and canine control.
Since the 1971 purchase of the privately owned Norwich Water Supply Company, the
district has operated the municipal water department.
Of the 974 acres of the Fire District’s land, 917 acres are in the watershed of the Charles
Brown Brook, the former source of water for the municipal system. In 1995, 350 acres of
the watershed land were placed under an agreement between the town and the district, and
in 2001 an additional 567 acres were added to the agreement. The district retains title to
the property with a conservation easement given to the town in exchange for an exemption
from town property taxes.
Forestry, educational, and recreational uses of the property are under the control of a Land
Management Council, composed of three voting members appointed by the Prudential
Committee and the Selectboard and four non-voting members representing the
Conservation Commission, Prudential Committee, Recreation Council, and Selectboard.
Timber sales from the property support the management activities.
As the town grows and faces additional development and service issues, it is possible that
the goals of the Town of Norwich and Norwich Fire District will be better served by
merging. This issue should be considered and evaluated periodically.
Sewage Treatment
There is no municipal sewage disposal system in Norwich. The need for a municipal sewage
treatment system has been considered several times in the past, most recently in 2005
when the Selectboard charged a committee with reconsidering the need for a municipal
sewer system and the feasibility of building one, either with a new treatment facility or
through hooking up to the existing systems in Hanover or Hartford. The report found
that:The findings of the report include:
There is no area-wide failure of existing systems that would indicate a need for a
municipal system.
A conventional municipal wastewater treatment system would be prohibitively
expensive.
Tying into another municipal system, most likely Hartford, may be feasible.
The report acknowledged that a municipal system would allow for more growth, but did not
take a position on whether this was good or bad. The full report is available from the Town
Manager’s Office or on the town web site.
Concern has been expressed about a municipal sewage treatment system allowing too much
development in areas it would serve, however, higher-density development in designated
areas closer to existing roads and facilities may be more beneficial in the long term than
sprawl throughout the town and region. This issue is discussed more thoroughly in the Land

47
Use Chapter, and appropriate guidance for the placement and density of future
development will be included in future land use regulations based on the goals and policies
supported in this plan.
Electricity Distribution
Electricity is supplied in Norwich by Green Mountain Power (GMP) and Central Vermont
Public Service (CVPS). GMP serves all areas of town, except for sections along the western
and northern boundaries served by CVPS. There are two electrical transmission lines
originating at the Wilder Dam, one running north along Interstate-91 into Thetford (CVPS)
and another running northwest along Turnpike Road into Sharon (VELCO). There are
three-phase power lines along most of the Route 5 corridor and in Norwich Village, which
are needed to facilitate power generation at distributed, community-scale sites (as
compared to traditional utility-scale power plants or dams) closer to where the electricity
will be used.
Adoption of a “smart grid” into the systems of both electric utilities would improve the
energy efficiency of Norwich consumers. A “smart grid” delivers electricity from suppliers
to consumers using two-way digital technology to control appliances at consumers’ homes
to save energy, reduce cost and increase reliability and transparency. It also incorporates
overall digital management of the distribution system to monitor disruptions in service and
generally improve the efficiency of the system.
Telecommunications and Broadband
Cell phone service and high-speed internet access have become a necessity in our lives, just
as electricity and the telephone were in the early part of the last century. These modern
technologies utilize towers, antennas, and additional wire strung along poles. Federal
statutes mandate that these services be made available to everyone, thereby limiting the
rights of towns to review and condition these projects and, in some cases, eliminating local
review entirely.
Norwich has one 87-foot-high cell tower above Upper Loveland Road with antennas for two
providers. Due to hilly terrain and the limited number of towers, cell service in Norwich is
spotty and, in some areas of town, nonexistent. Norwich Zoning Regulations permit towers
in any district while minimizing their adverse visual impact on public areas through
conditions without limiting service.
The availability of cell service (which often also delivers Internet access) and broadband
internet access are services providing important benefits to residents including safety and
security, education, economic, health monitoring, entertainment, etc. The town should
continue to support these services while minimizing the adverse visual impact of towers,
antennas and wires to the extent possible.
Although parts of town have access to broadband internet service over cable, DSL (digital
subscriber line) or wireless providers, many areas away from the village center and main
roads cannot obtain high-speed internet connections. These areas of town are limited to

48
slow dial-up or almost as slow expensive satellite service.
A proposed “Fiber to the Home” network (ECFiber) is planned that would provides service
to the entirein portions of the town at speeds substantially faster than either cable or DSL.
Provision of broadband service to all areas of town is essential for a variety of reasons such
as:
Economic development;
Education;
Reducing travel;
Accessing medical services from home; and
General well-being of residents.
Provision of state-of-the-art broadband services to all areas of town is also an important
ingredient in attracting individuals and families wealthy enough to afford land and housing
in Norwich and potentially increase the school-age population (and thereby, under current
law, restrain school property taxes).
Emergency Services
Police
Before 1973, when the Norwich Police Department was originally established by the
appointment of a Chief of Police, police services were provided by part-time elected
constables. Since then the force has increased to a chief, three full-time officers, two part-
time officers and a full-time clerk-dispatcher. While the department is available on a 24-
hour basis, regular patrol services are now provided for an average of 16 hours each day.
The Police Department headquarters, located behind the fire station, is a former residence
converted to a “temporary” police station in 1992 that has been modified over the years to
serve the police. A new building designed to serve the specific security and operational
needs of the department has been under consideration for a decade or more, but not
funded.
The majority of the departmental budget is allocated to regular patrol operations. The
department’s major equipment includes two cruisers, a four-wheel-drive patrol vehicle,
extensive communication and video systems, firearms, and other specialized equipment.
At the 2007 Town Meeting, the town voted to reduce the Police Department from five to
four full-time officers. Feeling that this vote may have been based on a negative perception
of the department by the residents of the town, the Selectboard appointed a Norwich Police
Services Committee to review the operations of the department and its interaction with the
community. The review included extensive interviews with police, community policing
experts, and many members of the community. A public forum was held and a survey was
sent to the residents. In October 2007, a report was delivered to the Selectboard, with
findings and recommendations for improving police operations, community relations, and

49
the interaction between the Police Chief, Town Manager, and the Selectboard.
In 2009, members of the committee reviewed the performance of the department and found
it in compliance with the major recommendations of the report. The Norwich Police
Services Committee 2007 Report is a well-researched guide for the future operation of the
Norwich Police Department and is incorporated into the town plan by reference. Copies of
the report are available on the Norwich web site or from the Town Manager’s office.
The responsibilities and size of police department are not dependent on population growth
alone. Other factors may include:
Public expectations for police services
Demographics of town residents
Types and impacts of commercial businesses
State and federal mandates for services and reporting
Use of technology to increase efficiency of the existing force
Fire Protection
The Norwich Fire Department is a volunteer department consisting of a part-time (30 hours
per week) salaried fire chief and 37 members. The fire division has 27 members, some of
whom are Emergency Medical Technicians (EMTs) who work in the Emergency Medical
Services (EMS) Division. These “on-call” firefighters and EMTs are paid for time spent in
responding to fire calls and for some training time. The department has one station that
houses two engines, one tanker, one aerial ladder, one forestry truck and one mini-pumper.
The department provides fire, emergency medical service, hazardous materials response
(operations level) and rescue services.
Emergency medical services are provided by the First Aid Stabilization Team (FAST) Squad.
The Fast Squad has 18 members (9 perform EMS duties only) trained at or above the EMT-
Basic level who provide patient care prior to the arrival of an ambulance from a neighboring
fire department. The department has had a salaried career fire chief since August 2008.
The Norwich Fire Department faces challenges with recruitment and retention of members,
as do most volunteer fire departments. This is a national problem that has been the target of
numerous studies. Among the challenges identified are time demands, training
requirements, increasing call volume, state and federal requirements, high cost of housing,
an aging community, and the effects of the decline in volunteers. Daytime responses are a
particular challenge to the department, since there are a limited number of members
available during workdays. Norwich and its adjoining communities rely on mutual aid, and
multiple departments are dispatched to credible reports of building fires.
The Norwich Fire Department’s fire station on Firehouse Lane off Main Street was built in
1981 and is now inadequate for the vehicles, equipment, and training activities of the
department. Safety and environmental issues also exist. Preliminary planning for a new
Public Safety Facility for Fire, Police, and FAST Squad at the same location was started more
50
than six years ago, but there are no current plans to move ahead. The new facility was
included in the 2006 Capital Plan and Report for the Town of Norwich. The installation of a
new exhaust system, completed in February 2010, has alleviated some of the environmental
issues.
Norwich’s recent classification from the Insurance Services Office (ISO) of 4 on a scale of 1
to 10 is one of the best ratings in Vermont and the Upper Valley, resulting in lower
insurance premiums for all home owners. These ratings are based on equipment, training,
communications, dispatch time, and water supplies.
In addition to fighting fires, the Norwich Fire Department has been proactive in fire
prevention and preparedness, with the goal of significantly reducing loss from fire without
expanding the town budget. Zoning and subdivision regulations have been amended,
requiring new development to provide all-season access for fire trucks and an adequate
water supply to fight fires. In some cases, residential sprinkler systems will be required
where there is limited access to a water supply.
The town has excellent water supply for fighting fires in and near the village due to the good
pressure and capacity provided by the Norwich Water District hydrants. In outlying areas,
water is brought from the village by tankers or pumped from rivers, streams, or ponds. The
Fire Department has installed nine dry hydrants accessible to fire equipment along ponds,
streams, and rivers in the rural areas. The goal is to have water supplies for fire pumpers in
every area of the town. Landowners are encouraged to install dry hydrants when building
or renovating ponds.
Although these water supplies are effective for property protection, residential sprinkler
systems, in conjunction with smoke alarms, protect lives and property from fires in homes.
A residential sprinkler system is designed to control a fire long enough for the occupants to
escape. Some communities around the country are now requiring a residential sprinkler
system in new homes. The Norwich Fire Department highly recommends them, especially
for homes at a distance from the firehouse.
First-Response & Emergency Medical Services
Emergency medical services are provided by the First Aid Stabilization Team (FAST) Squad.
The FAST Squad has 18 members trained at or above the EMT-Basic level who provide
patient care prior to the arrival of an ambulance from the Hanover Fire Department. The
FAST Squad and Police Department have several automated external defibrillators.
First-response ambulance and emergency medical services are provided by the Town of
Hanover through a contractual agreement based on both a per-capita payment from
Norwich (in 2010, $82,000 annually) and user fees. Fees not paid by the user must be paid
by the town. Future service cost increases are likely to be covered by user fees, rather than
through the per-capita fee.
Given the investment involved in equipment and personnel, this agreement is advantageous

51
to Norwich. It is expected that this arrangement will be continued for the foreseeable future.
Emergency Dispatch and 911
All 911 calls are received by the Town of Hartford’s dispatcher, who has radio contact with
the Norwich Police and can call out Norwich firefighters through their paging system.
Ambulance call information is relayed to the Hanover dispatcher.
Assigning numbered street addresses for all occupied structures and locations where
citizens gather is an important component of quick emergency response. Norwich has
created official names for all public roads and for private roads serving three or more
residences. Street numbers based on distance from the beginning of the road have been
assigned to all residences and businesses. Landowners are required to display house
numbers visible from the road, but this has not been fully enforced.
Emergency Management
The Town Manager serves as the Emergency Management Director. The manager is assisted
by a Deputy Emergency Management Director (currently the Fire Chief) and an Emergency
Management Coordinator. The Town Emergency Management Committee, comprising
elected and appointed town officials, is a consensus group that assesses risks and prepares
the local hazard mitigation plan, basic local emergency operations plan, continuity of
government plan, and other documents in coordination with regional, state, and federal
emergency management agencies.
In addition to maintaining and updating operation plans for a coordinated emergency
response to major events, the committee also prepares pre-disaster mitigation plans for
physical and regulatory changes to minimize the damage and loss of life in a major disaster.
The types of disasters prepared for include natural disasters such as floods and ice storms,
major fires, terrorism, hazardous material spills, and health-related events such as a
pandemic outbreak of disease.
Disaster planning has evolved from focusing primarily on response and recovery to
mitigation and resilience. Resilience is a concept focused on identifying and managing risks,
proactively reducing vulnerabilities and improving response and recovery. A resilient
community has the ability to withstand, respond and adapt to challenges. The goal is to
ensure that communities are continually building capacity to adapt to a changing climate
and respond to natural disasters. A resilient community thinks long term and is able to
reorganize and renew itself, ideally in ways that put it in a stronger position than before the
disaster.
The Town of Norwich has a FEMA-approved Local Hazard Mitigation Plan, which was
adopted in 2015. The purpose of that plan is to identify hazards facing the community,
assess the likelihood and risks associated with those hazards, and develop strategies to
reduce the risks from known priority hazards. It is also a requirement for the town to
qualify for FEMA Hazard Mitigation Grants. That plan, as most recently adopted is
incorporated into this Town Plan by reference. The Town of Norwich also updates and

52
adopts a Local Emergency Operations Plan on an annual basis.
In the event of a federally-declared disaster, 75% of the eligible public costs (road repairs,
for example) are reimbursed by the federal government. The Vermont Emergency Relief
and Assistance Fund provides state funding to match that federal public assistance. Norwich
is eligible for a 12.5% match, rather than the base 7.5% match, because the town has
adopted:
1. Flood Hazard Regulations;
2. Town Road and Bridge Standards;
3. A Local Emergency Operations Plan; and
4. A Local Hazard Mitigation Plan.
If Norwich were to expand its flood hazard regulations to also limit new development
within state-mapped river corridors and to participate in FEMA’s Community Rating
System, the state match percentage would increase to 17.5%.
Town Government and Administration
Selectboard and Town Manager
The Town of Norwich has been governed by an elected Board of Selectmen (changed to
Selectboard in 1996) since the first town meeting in 1761. In 2002, the town adopted the
Selectboard/Town Manager form of government at Town Meeting by a vote of 1,187 to 267,
following a recommendation by the Town Administrative Needs Committee Report based
on extensive research. In 2007, a Committee to Review Selectboard/Town Manager Form of
Government, after extensive interviews and research, recommended the town retain the
Selectboard/Town Manager form of government. At a Special Town Meeting in June 2008,
the Town voted 644 to 285 to retain the Selectboard/Town Manager form of government.
The Town Manager reports to the Selectboard and is subject to the direction and
supervision of the Selectboard. The Town Manager’s responsibilities, as prescribed by state
statute, include the general supervision of the affairs of the town and more specifically, to be
the administrative head of all departments of town government and responsible for the
efficient administration and finances of those departments. The Selectboard is responsible
for setting town policies, adopting budgets prepared by the Town Manager, adopting
ordinances, making appointments to town boards and committees and laying out roads. The
specific responsibilities of a Town Manager and the Selectboard are found in 24 V.S.A
Chapters 33 and 37.

53
Town Clerk
The Town Clerk is an elected official with specific statutory duties, including maintaining
permanent town records of land transactions, roads, town meetings, and vital records
(births, marriages and deaths). The town clerk also supervises elections, registers voters,
issues licenses for marriages and dogs, and is the clerk for the Board of Civil Authority and
the Board of Abatement. The town clerk is assisted by at least one part-time assistant town
clerk.
Prior to the arrival of the Town Manager, the town clerk provided many additional services
related to the day-to-day operation of the town that were not part of her statutory duties,
including Tracy Hall operations and communicating resident concerns to department heads.
These services are now the responsibility of the Town Manager’s office.
The level of activity in the Town Clerk’s office is based more on the number of real estate
transactions and elections rather than the population growth, although there is some
correlation. The future transition to digital records and indexing may result in efficiencies
that will limit the need for additional personnel in the future. The 1994 renovation of Tracy
Hall created sufficient office and vault storage space for now and the foreseeable future.
Finance
The Finance Officer is responsible for the accounting functions and tax collecting of the
town. These functions include payables, receivables, payroll, fixed assets, reporting, and
preparing for the annual audit. Prior to 2002, an elected treasurer performed these duties.
With the transition to the Selectboard/Town Manager form of government, the position of
Finance Officer reporting to the Town Manager was created. The Finance Officer has a part-
time assistant. The role of the treasurer is now limited to paying orders authorized by the
Selectboard and investing funds with the approval of the Selectboard.
Increases in the responsibilities and workload of the Finance Office are as much the result of
increases in the complexities of accounting rules and government reporting requirements
as from increases in the town’s population.
Listers
Listers/Assessors
A contract assessor was hired in 2012 to take over the technical responsibilities of
inspecting and assessing properties, preparing the Grand List, and interacting with the
state. The elected Board of Listers hears and adjudicates grievances, lodges the Grand List,
and participates in Board of Civil Authority hearings. The contract assessor is engaged to
complete a town-wide reappraisal on a three year cycle, visiting a third of the properties
each year.
The Listers’ Office is staffed by three elected listers, a part-time professional appraiser, and
a part-time clerk. The Listers are responsible for drawing up a record of all taxable real
property in Norwich, the Grand List, and assessing that property at fair market value. This

54
process has been made extremely complex in recent years, in part due to the need for the
statewide education property tax to be equalized between all towns in the state. Towns are
financially penalized when the assessed values of properties drop too far below the fair
market values as reflected by actual sales.
Although Norwich has had knowledgeable listers in recent years, the responsibilities may
be becoming too complex for elected officials. The town should consider establishing a
study committee to review the operating structure of lister/assessor responsibilities to
better handle these increasingly complex responsibilities. The committee should look at the
experience of other towns and options available under the statutes.
Planning and Zoning
The Planning and Zoning Office is responsible for the regulation and permitting of land
development in Norwich. The Planning Coordinator/Zoning Administrator is two separate
positions held by the same person. The Zoning Administrator reviews all applications for
development, issuing or denying permits, or forwarding the application to the Development
Review Board for a warned public hearing. The Zoning Administrator is clerk for the
Development Review Board, preparing and warning hearings, assisting at hearings, and
issuing decisions written by the board. The Zoning Administrator is also responsible for
enforcement of the zoning and subdivision regulations.
The Planning Coordinator provides support to the Planning Commission in preparing the
Town Plan and land use regulations, and assists the Town Manager in transportation
planning and other matters. In addition to the Planning Coordinator/Zoning Administrator,
a part-time assistant was added to the office in 2007 to process the paperwork associated
with permit applications and hearings, and manage the databases. Changes in workload are
related to the economic climate for development and changes in the town’s land use
regulations requiring more permits and hearings. Both the revised subdivision regulations
in 2002 and zoning regulations at the end of 2008 increased the regulatory workload.
Cemeteries
Of the 10 cemeteries in Norwich, lots are only available at Hillside, where roads and lots
were added in 2008, providing additional space. There may be a need for additional space
in the future, and potential sites should be identified and reserved for cemetery space.
The income from the Perpetual Care Fund covers from 20 to 50 percent of the amount the
town spends on maintenance in the cemeteries. This percentage fluctuates based on
interest rates and the amount spent on restoration of headstones. The town has been
appropriating $15,000 in recent years to supplement the interest from the Perpetual Care
Trust Fund.

55
Recreation
Recreation Department
The Norwich Recreation Department manages a year-round recreation program for all
Norwich residents and non-residents as space permits. Prior to 1995, the Norwich
Recreation Council was an independent organization supported by fees, donations, and an
annual appropriation from the town. In 1995, the town assumed responsibility for the
council’s financial operations, and it became the Norwich Recreation Department. The
director became full-time in 2002. Some instructors are paid either by the hour or a
percentage of fees, while the team sports programs depend primarily on volunteers from
the community.
The number of students in Norwich has dropped substantially in the last 10 years, causing
participation in specific programs to be reduced, but the number of programs has increased.
The town’s recreation facilities include:
Huntley Meadow, with four tennis courts and six fields: two baseball diamonds, two
full-size fields and two ¾-size fields. Three of these fields were added over the last
six years.
The Norwich Green, with small fields for lacrosse, soccer and baseball.
Two gyms: Marion Cross School and Tracy Hall.
The Norwich Pool.
Barrett Meadow, with a small field for limited activities.
Indoor space at Marion Cross School for summer circus camp and other classroom
programs.
The two gyms are sufficient for current and foreseeable needs. The Norwich Pool will need
some major structural work in the near future.
Currently, the Recreation Department offers some non-athletic programs such as television
production and sponsors some special events such as dances and road races. Adult
programs include mountain biking, dance, capoeira, Chi Kung, and snowshoeing.
The Norwich Recreation Department continues to try new programs for residents of all
ages. New facilities under consideration include an access to the Connecticut River for
kayaks and canoes, and more running trails.
Other Recreation
Norwich’s trails and Class 4 roads are used for hiking, mountain biking, horseback riding,
and cross-country skiing. Town residents also have access to the Appalachian Trail, the Bill
Ballard Trail along the Charles Brown Brook on Fire District land, a network of hiking and
skiing trails on Parcel 5 on the Fire District land on the north side of Beaver Meadow Road,
the Norwich Nature Trail in the Milton Frye Nature Area southeast of the school, the Hazen
Trail south of the Montshire Museum, the Bradley Hill Trail, and the trail to Gile Mountain.
56
Many of these trails could be connected to create a network of recreational trails
throughout the town with the cooperation of private landowners. The Town and the
Norwich Fire District have negotiated an agreement for the Fire District land south of
Beaver Meadow Road to be managed for recreational use by a committee of town residents.
Bicycle and pedestrian paths, as discussed in the Transportation chapter of this plan, are
designed primarily for people going from one place to another without having to use a car,
but are also used by bicyclists, joggers, and cross-country skiers for recreation.
The Connecticut and Ompompanoosuc rivers also offer recreation for Norwich residents.
There are two access locations to the rivers for launching boats, one along River Road
owned by the town and one in Pompanoosuc owned by the state. There is no shoreline
location along the river easily available to Norwich residents for swimming.
Goals, Objectives and Actions
Goal E Provide a full range of community services and facilities in a cost-effective,
environmentally sound manner without creating an undue burden on local taxpayers.
Objective E.1 Update the capital improvement program and budget based on
projections of the needs of specific facilities and services consistent with a
moderate amount of new growth and development in Norwich.
Action E.1.a Update and adopt a Capital Improvement Program that includes all capital construction and purchases over five- and ten-year periods. The plan should be updated each year. The purpose is to spread costs evenly over time and to anticipate major construction projects.
Objective E.2 Maintain roads and bridges in the most cost-effective manner (this may
require increased maintenance at an earlier stage of deterioration).
Action E.2.a Update the pavement and bridge inventory on an annual basis.
Objective E.3 Expand access to state-of-the-art high-speed internet service to all
households and businesses in Norwich.
Objective E.4 Maintain the high quality of the Norwich Police Department in serving the
community.

57
Action E.4.a Perform regular reviews of the operations and effectiveness of the Norwich Police Department using the criteria in the 2007 Norwich Police Services Report.
Action E.4.b Review the optimum size of the force and hours of coverage based on the needs of the community.
Objective E.5 Maintain the high quality of the Norwich Fire Department and the resulting
low ISO score with continued training programs, developing new rural
water supplies, and effective pre-planning.
Action E.5.a Recommend residential sprinkler systems to all homeowners in the rural areas. Consider requiring them for new houses not readily accessible to emergency vehicles.
Action E.5.b Enforce the existing ordinance requiring all home and business owners to display E911 locatable address numbers either on the building, if visible from the road, or at the entrance to their properties.
Objective E.6 Maintain the professional staff and keep technology up to date in each
town department for the most effective and efficient delivery of services to
the residents.
Action E.6.a Provide technical support to all departments through network servers and equipment replacement programs.
Action E.6.b Establish a study committee to review the operating structure of lister/assessor responsibilities to better handle increasingly complex responsibilities.
Objective E.7 Provide recreation facilities and programs for all residents. Special
emphasis should continue on programs for youth with volunteer coaches or
instructors from the community.
Action E.7.a Maintain and continue to expand the recreational trail network.
Action E.7.b Create additional locations, with adequate parking, for access to the Connecticut and Ompompanoosuc rivers for swimming and small cartop-type water craft.
Objective E.8 Strengthen Norwich’s resilience to disaster, including floods, and ability
to sustainably adapt over time to a changing climate.
Action E.8.a Ensure that Norwich’s Local Emergency Operations Plan and Local Hazard
Mitigation Plan is kept up-to-date and re-adopted as necessary.
Action E.8.b Continue to implement the programs, projects and activities identified in the

58
Local Hazard Mitigation Plan as most recently adopted.
Goal F Provide facilities and services in a manner that reinforces the town’s land use
development, energy, and natural resource protection goals and policies.
Objective F.1 Continue to work towards long-term solutions for disposal of solid and
hazardous waste through regional cooperation, and reduction of the
volume of solid waste through recycling and consumer education.
Action F.1.a Continue to actively participate in and evaluate the Greater Upper Valley Solid Waste Management District’s plan to build a new landfill in Hartland.
Objective F.2 Maintain sources of high-quality potable water for current and future
residents of Norwich.
Action F.2.a Continue to develop contingency plans for disasters that may threaten the village water supply.
Objective F.3 Focus water supply and septic improvements on existing development
areas and areas that are designated for future growth.
Action F.3.a Determine whether a public wastewater treatment system would create a viable basis for increasing housing density in designated areas.
Action F.3.b Research options for municipal or community septic systems to serve Planned Unit Developments in areas designated for increased housing density.
Action F.3.c Encourage expansion of the municipal water system to other areas designated for higher density development.

59
transportation
Transportation facilities in Norwich include: state, town, and private roads; railroad lines;
public transit routes; bikeways; and pedestrian paths. These facilities provide
connections between homes, businesses, recreational facilities and workplaces in the
community, the region and beyond.
There is a direct relationship between land use, energy consumption and transportation.
Better roads may promote more intense land use if zoning provisions permit, and poor
roads will discourage most types of land use. Public transportation and compact, mixed-
use development will result in reduced energy use. Land use planning that creates
clusters of housing will facilitate public transit, bicycling and walking. Transportation
planning should look at all modes of travel and be coordinated with land use planning
and energy conservation.
This chapter will not only focus on the most common form of transportation – the
automobile – but will also consider alternative modes of transportation, including
bicycling, walking, and regional public transit. Other aspects of transportation planning
for Norwich include support for regional coordination and cooperation, sustainability,
energy conservation, and planning for more compact, mixed-use communities in
accordance with smart growth principles.
Roads In Norwich
Interstate and State Highways
There are 18.3 miles of state-maintained highways in Norwich. These are generally the most
heavily traveled roads in town. As shown in Figure 9-1, traffic levels on these roads
continue to increase.
Interstate 91. Interstate 91, the primary north-south thoroughfare in western New
England, was completed through Norwich in the early 1970s and runs north-south along
the town’s eastern boundary. I-91’s southern terminus is the junction with I-95 in New
Haven, Connecticut, while its northern end is at Derby Line, Vermont, at the Canadian
border. Its intersection with I-89 five miles south at White River Junction provides Norwich
with direct interstate highway access to Boston, Montreal, New York City and points
between and beyond.
In Norwich, the highway travels 7.6 miles from the Hartford to Thetford town lines with

60
Exit 13 located in Norwich less than one mile north of the Hartford line and south of
Norwich Village. In 2001, Norwich’s segment of interstate had a sufficiency rating of 95.6
out of 100. The average daily traffic between Exits 12 and 13 in 2006 was 17,100 vehicles;
between Exits 13 and 14, it was 12,500 vehicles.
U.S. Route 5. U.S. Route 5 is a two-lane rural road that parallels the Connecticut River
along much of the 8.5 miles it travels through Norwich. U.S. Route 5 is part of the bi-state
Connecticut River Scenic Byway and a popular bicycle route. South of I-91 Exit 13, Route 5
runs to the west of the interstate. From the exit in Norwich, Route 5 travels into Norwich
village and then eastward crossing under the interstate to continue north on the east (or
river) side of I-91. This segment of the highway is lightly traveled and highly scenic. South of
Exit 13, Route 5 averages 6,000 vehicles per day, while between the exit and Norwich
village the number of trips per day exceeds 9,000. North of the village traffic on Route 5 is
approximately 1,500 vehicles per day.
Vermont Route 10A. Vermont Route 10A is a 0.9-mile connector between I-91 Exit 13
southbound and the Ledyard Bridge over the Connecticut River that links Norwich to
downtown Hanover, New Hampshire. Route 10A is heavily traveled, with more than 15,000
vehicles crossing the bridge each day. This state highway had a sufficiency rating of 68.2 out
of 100 in 2001, due more to safety and traffic issues than to the physical condition of the
road. During the peak morning and afternoon commuting hours, traffic on Route 5 between
the village and Exit 13, and Route 10A from the exit to the bridge, can become congested as
vehicles become backed up between Norwich and Hanover.
The bridge connecting Norwich and Hanover has an interesting history of its own. Built in
1859, the Ledyard Free Bridge was the first, and for many years the only, non-toll bridge
over the Connecticut River. The Ledyard Bridge has been rebuilt four times due to disasters
and deterioration. Construction on the current bridge was completed in 1999.
River Road. River Road is a 0.8-mile state highway connector between Vermont Route 10A
at the Ledyard Bridge and U.S. Route 5 North along the Connecticut River. It does not have a
state route number, but is a designated state highway.
Town Highways
Background. In the late 1700s, when Norwich was first settled, in addition to the King’s
Highway and early Post Roads, many of the roads were laid out and built by original
investors/settlers to encourage development and increase the value of the land. Early
landowners allowing roads to cross their property were compensated with additional land.
Agricultural and forest products were processed in the town for local trade and export. The
commerce of the town depended on roads to move goods around town and to the river, and
later to the railroad depots in Lewiston and Pompanoosuc. By the mid 1800s, there were
more than 100 miles of roads as compared to the 85 miles currently maintained by the
town and state.
As the population moved west, many of the homesteads were abandoned and roads to less

61
productive land were no longer used or maintained. By 1931, road mileage had decreased
to 72 miles. Some of these old roads can no longer be seen on the ground but may still be
legal rights-of-way that exist in the town records (See Ancient Roads).
Even with the population now exceeding the historic peak of the 1830s, very few new town
roads have been built. Most development has occurred along existing roads. The exceptions
are roads in residential developments, such as Hawk Pine, McKenna Road, Carpenter Street,
Hazen Street, Cliff Street, and Huntley Street. There has been some interest in upgrading
sections of Class 4 roads to Class 3 to accommodate more development and provide more
interconnections between existing roads, but this has not happened.
The town maintains 76 miles of its 96 miles of public roads in Norwich with some financial
aid from the state, based on the class and mileage of the town roads.
Road Class and Function. Norwich’s 96 miles of town road are classified as follows:
Class 1: Heavily traveled roads that are extensions of the state highway system and
are assigned a state route number. Currently, there are no Class 1 town roads in
Norwich.
Class 2: Major roads that do not meet the criteria for a Class 1 road but still may
have a state route number and serve as through-roads from one town to another.
Route 132, Union Village Road and Beaver Meadow Road are Class 2 roads. Class
2 roads are usually paved. Norwich has 14.5 miles of Class 2 roads.
Class 3: Roads that are maintained to be passable at all times of the year by a
regular passenger car and are not Class 1 or Class 2. They are usually gravel roads,
although in Norwich there are 11 miles of paved Class 3 roads. Norwich has a total
of 61.2 miles of Class 3 roads.
Class 4: Non-maintained or partially maintained town roads. The town receives no
funds from the state to maintain these 19.1 miles of roads. Some Class 4 roads are
privately maintained by landowners and some are essentially trails which may or
may not be passable by a vehicle.
Legal Trails: Town-owned rights-of-way that are not maintained and may not be open
to vehicles. There are approximately 3.5 miles of legal trails in Norwich.
VTrans has also classified the town’s roads based on their function. Routes 5, 10A and 132
are major collectors; they serve primarily traffic traveling between destinations within a
region. Union Village Road, River Road and portions of Main Street are designated as minor
collectors, which connect smaller communities and collect traffic from local roads to major
collectors.
Road Maintenance and Construction. The Selectboard has responsibility for building
and maintaining town roads. The Selectboard appoints the Town Manager as Road
Commissioner. The Town Manager hires a Director of Public Works. The Town Manager is
charged with overseeing the roads and legal rights-of-way, and overall maintenance
strategies, and is the Selectboard’s liaison with the Director of Public Works. The Director of
Public Works supervises the Highway Department, the workers, and equipment. For an

62
additional discussion of the Highway Department, see Chapter 7, Community Facilities and
Services.
The town has several ordinances and policies relating to town roads. These include:
Road Specifications - 1976
Class 4 Road Policy - 2/28/89
Scenic Road Ordinance - 10/30/89
Criteria for Accepting Roads - 12/8/92
Ordinance Relating to Use of Trails - 12/8/01
Private Highway Specification Ordinance - 2/11/03
Several Speed and Parking Ordinances
Road Maintenance. Road maintenance is budgeted in three categories: winter
maintenance (snow removal and sanding), summer maintenance (grading, paving, ditching,
and replacing culverts), and capital improvements (bridge replacement, road relocation,
and widening and straightening).
Road maintenance is always a difficult balance. With a limited budget, is it better to
completely rebuild or reclaim a short section of highway versus patching or skim-coating
longer sections only to repave a few years later? On unpaved roads, is it better to add gravel
each year or to rebuild the roadbed and ditches to avoid erosion? These are the kinds of
decisions being made by the Town Manager and the Director of Public Works with budgets
approved by the Selectboard and voters. The inconveniences of badly deteriorated roads or
closed bridges are not well received by the taxpayers, nor are ever-increasing highway
budgets.
In 2007, a study, the Marcon Report, of the conditions of paved roads and the re-paving
program indicated that the town was falling behind and that roads were deteriorating at a
substantially faster rate than repairs were being made. The cost of rehabilitating a road
increases substantially as the condition worsens. Based on this report, the town increased
its paving budgets, but is still not where it needs to be to sustain its current road network at
an acceptable level over the long term. The town is now using a computerized Road Surface
Management System (RSMS) to plan for long-range maintenance and capital improvements.
Upgrading Existing Roads. The town needs to make informed decisions on whether
existing roads will need to accommodate additional traffic and, if so, whether they can or
should be upgraded. Widening, straightening, or paving may increase safety, but may also
increase the speed of traffic, encourage more development, and destroy the scenic beauty
and rural character of Norwich’s back roads. The town should find a way to provide safe
roads without improving them to typical Class 2 or 3 standards if it will adversely affect the
rural character of the town.
Class 4 Roads. Class 4 roads are town highways that are not maintained for year-round
travel. The town must replace larger culverts and repair bridges on Class 4 roads, but they
are not otherwise maintained. A landowner whose property is accessible by a Class 4 road

63
may maintain the road privately with permission from the Town Manager.
Class 4 roads form a part of a long-standing network of trails/tracks used for recreational
purposes. In the future, some Class 4 roads could be upgraded to Class 3 to increase the
efficiency and safety of the town’s road system or to allow development in suitable areas.
Many areas along the western and northern boundaries of Norwich are inaccessible from
each other without first traveling back to the center of the town. Upgrading of some existing
Class 4 roads to Class 3 would create alternative routes for emergency vehicles and allow
detours if roads are closed in major storms. In some cases, Class 4 roads provide the only
access to individual properties. Careful consideration should be given to the value of Class 4
roads and how they may contribute to the quality of life of Norwich’s residents.
Legal Trails. A legal trail is a public right-of-way that may previously have been a town
road and is open to the public for recreational use, but from which the town may exclude
motor vehicles. It may be the same width as the town highway, or a lesser width if so
designated. The Selectboard may also create a new trail with a designated width. The
Selectboard adopted an ordinance in 2001 to regulate the use of its legal trails. Most of the
3.5 miles of legal trails in Norwich are designated for recreational use and were converted
from Class 4 town highways within the last 10 years. The town’s ordinance prohibits the
use of motor vehicles, other than vehicles being used for farming and snowmobiles, on trails
unless a special permit is approved by the Selectboard. A legal trail may be upgraded to a
Class 4 or Class 3 town road in the future.
Ancient Roads. Ancient roads refer to old public rights-of-way created in the early days of
Norwich that are no longer used as roads or trails. Some of these roads, although long
forgotten, may have never been legally discontinued and may still be town rights-of-way,
creating an unanticipated cloud on the title of property. These forgotten roads could be
considered an asset of the town providing recreational trails and access. In 2006, the state
legislature passed Act 178 in order to resolve this issue by requiring towns to find
“unidentified corridors” by July 2010 and to reclassify them to trails or roads, or to
discontinue them by 2015. The Norwich Ancient Roads Committee has been working to
identify potential “unidentified corridors” to present to the Selectboard for re-classification
or discontinuance.
New Roads. In recent years, new roads in Norwich have been privately built to
accommodate specific new developments or to relocate an existing road. New private roads
constructed by developers are under the jurisdiction of the Development Review Board and
must meet private highway standards, if serving two to 10 residential lots, and Class 3 road
specifications for 11 or more lots. There is a more detailed discussion of private roads
below.
Occasionally there are requests by developers or landowners for the town to take
ownership, and thereby responsibility for maintenance, of a private road. In December
1992, the Selectboard adopted a policy for accepting ownership of private roads based on
the density of housing on the road and other uses of the road, such as connecting with other

64
town roads or accessing public lands. Farrell Farm Road, which provides access to more
than 20 homes, is the only private road to be accepted as a town highway recently. The
landowners paid to have the road improved to town highway standards prior to the town’s
acceptance in 2008.
In the future, there may be a need for additional town roads for any of the following
reasons: to reduce congestion on existing roads by creating alternative routes, to create
alternative routes for emergency access to outlying areas of the town, or to allow a specific
type or level of land use in a specific area.
Norwich Village. Norwich village, like many Vermont town centers, has been experiencing
increased traffic as the number of homes in outlying rural areas has continued to increase.
Norwich’s topography and road network has amplified this effect, as often the only way to
travel from one place to another within town is to pass through the village. Additionally, the
majority of the town’s employed population commutes through Norwich village to reach I-
91 or cross the bridge to Hanover. At the same time, parents and buses are converging on
the village to transport children to and from school.
Given that such a large percentage of Norwich commuters are headed to one of several
major employers, public transit should be able to reduce the number of people commuting
in their own cars. In fact, bus service between Norwich village and Hanover has existed for
decades. The lack of parking within the village, however, prevents many commuters from
choosing to ride the bus. Development of park-and-ride lots has been considered for a
number of years. An appropriate location has yet to be acquired that would eliminate the
need for most commuters to drive through Norwich village, although the recent
development of a park-and-ride lot at Huntley Meadows has attracted increasing use.
Concerns have also been raised that out-of-town residents would drive into Norwich, park
their cars and take the bus, thus increasing traffic entering town from the south or east.
In addition to periods of heavy traffic, limited parking and pedestrian access discourage
walking and limit the growth potential of downtown businesses.
Scenic Roads
Norwich has many beautiful rural road corridors that provide pleasant travel and vistas for
residents and visitors alike. In 1977, legislation was passed by the state that provides towns
with the authority to designate roads as scenic. In 1989, the town enacted its own Scenic
Road Ordinance in order to keep the designation local and not listed in state tourism
publications. A total of 5.2 miles of roadway, including Bragg Hill Road, Jericho Street and
Goodrich Four Corners Road, have been designated as scenic. The Scenic Road Ordinance
does not actually protect the “scenic vistas,” but it does regulate the maintenance and
removal of features within the road right-of-way (usually 50 feet wide) such as trees and
stone walls in order to preserve scenic character. Recent changes in the zoning and
subdivision regulations have offered some protection to scenic vistas along many of these
and other roads.

65
Private Roads and Driveways
Private roads in Norwich range in length from short driveways serving individual homes to
long shared drives accessing many houses. These private roads are maintained either by an
individual landowner, a group of landowners, or a landowner or condominium association.
The town has four primary concerns with private roads:
That the intersections of private roads with town roads are designed to be safe and
not cause damage to the town roads;
That roads are designed, built, and maintained so that emergency vehicles are able
to reach residences;
That new roads and drives are designed, built and maintained using appropriate stormwater management techniques and infrastructure to minimize run-off, sedimentation and flooding of downslope infrastructure, property and waterways.
That new roads are built with minimum impact on significant natural resources and
scenic views; and
That private roads are built and maintained to standards appropriate for their
intended use in order to avoid the town ultimately having to take responsibility for
hazardous, inadequate or deteriorated infrastructure.
The town has the authority and responsibility to regulate private roads with regard to these
issues, and does so with three ordinances:
The Norwich Driveway Access Ordinance, administered by the Director of Public
Works, regulates the design and location of any new private road or driveway where
it intersects with a town highway.
The Norwich Private Highway Specifications Ordinance regulates the construction of
any new private road serving from two to 10 residences or lots.
The Norwich Zoning Regulations regulate the design of new driveways serving a
single lot or residence.
Culverts
Recent studies have shown that roadway and roadside drainage systems that fail to convey
the amount of water they are receiving from adjoining property are a significant source of
flood-related damage to roads and associated infrastructure. This includes undersized or
blocked culverts. Since 2013, the Town of Norwich has maintained a bridge and culvert
inventory that assesses the condition of these structures and aids in the prioritization of
replacement and repair work each year, including upgrading of undersized culverts.
The Norwich Private Highway Specifications and the Norwich Zoning Regulations are
administered by the Zoning Administrator and the Development Review Board. Pre-existing
roads are exempt unless their use changes. The Natural and Historic Resources section
describes the type of natural and scenic areas that driveways and private roads should not
adversely impact, such as wetlands and ridgelines.

66
Access Management
Access management describes a set of strategies that can be applied by municipalities to
prevent congestion and improve safety as development occurs along road corridors. Each
new access (driveway or road) that intersects with existing roads, particularly main traffic
corridors, introduces a new potential interruption to the flow of traffic and increases the
possibility of traffic accidents. The Vermont Agency of Transportation has developed Access
Management Program Guidelines, which include recommended policies, regulations and
road design standards aimed at minimizing the number of new access points and improving
the safety of access points.
Currently, shared driveways are the most commonly used access management technique in
Norwich. Not only do shared driveways reduce the number of new access points
intersecting town roads, they also have numerous environmental benefits due to reduced
construction and maintenance requirements and a reduction in the amount of impervious
surface needed to serve new development.
Public Transportation
Norwich residents’ access to public transportation includes taxis, a regional bus system
(Advance Transit), a van for seniors based at the senior center in White River Junction and a
district school bus system. There is also inter-city bus service to major cities and airports
(Vermont Transit and Dartmouth Coach), train service (Amtrak), and a regional airport in
West Lebanon connecting the region to New York, Boston and beyond.
There are a number of difficulties in serving a rural community such as Norwich with local
public transportation, the primary one being that typically, there are relatively few people
going to the same place at the same time on a regular basis. In addition, with relatively
uncongested highways and the general availability of parking, there is little motivation for
drivers to give up the convenience of a personal vehicle. The cost of providing service
convenient enough to entice a large percentage of drivers out of their cars and onto public
transit may far exceed the benefits of less pollution and greater energy conservation.
However, as fuel prices and traffic have increased, and parking in Hanover has become
scarcer, more commuters are using public transit, bicycles and car pools.
The current Advance Transit bus system connects Norwich village with hospitals,
employment centers, and retail shopping areas throughout the Upper Valley. Advance
Transit’s Brown Route makes several stops in Norwich village, in downtown Hanover and
around the Dartmouth campus, with service approximately twice an hour between 6:30
a.m. and 5:30 p.m. on weekdays. During peak commuting hours, the Brown Route includes a
stop at Norwich’s new park-and-ride lot, north of the village at Huntley Meadow. From
Hanover, connections to other Advance Transit routes can take passengers to destinations
around the region, including connections on Stagecoach to points north and northwest
including Bradford and Randolph and connections on Connecticut River Transit to points
south as far as Brattleboro. Norwich’s riders are mostly commuters going to Dartmouth
College or the Dartmouth-Hitchcock Medical Center, where they do not need personal
vehicles during the day and parking is limited.

67
Bus ridership has been growing steadily in Norwich for many years. Over the past five
years, however, several economic factors have spurred use of transit in the Upper Valley,
including the decision to make Advance Transit service free for riders, the escalation in
gasoline prices, and the economic downturn. In 2007, 9,545 passengers boarded Advance
Transit buses in Norwich. This compared to 2,168 in 1992 – a 340 percent increase in 15
years.
The most efficient form of public transit in the community should be the school bus system,
with groups of passengers (students) going to the same destination at the same time. Still,
many parents choose to drive their children to and from school, contributing to traffic
congestion in the village and on Route 10A to Hanover at the beginning and end of the
school day.
A van operated by the White River Council on Aging provides transportation for seniors to
the Bugbee Senior Center in White River Junction, medical appointments and shopping
trips. Although donations are accepted, this service is largely supported by local and federal
funding.
Directing future development in Norwich into village centers and “rural clusters or hamlets”
rather than “low-density sprawl” will facilitate the future expansion of public transportation
by creating population centers within walking or bicycling distance to pick-up points.
Park-and-Ride Lots. Siting park-and-ride lots outside of the village to intercept commuter
traffic at key points will support the use of public transportation and car pooling. These lots
may be serviced by regular bus service or shuttles from specific employers. Public lots
available to anyone on land owned or leased by the town or state may be eligible for state or
federal funding. The use of private lots sponsored by major employers or institutions and
located on private land may be limited to those affiliated with the owner. Either type will
promote use of public transportation and carpooling, thereby alleviating traffic into
Hanover and reducing the use of carbon fuels. Norwich built its first park-and-ride in 2009
at Huntley Meadow off Turnpike Road with 20 parking spaces served by Advance Transit.
Air Travel
There is no air travel facility located in Norwich. Lebanon Regional Airport is the closest
airport that offers limited passenger and freight services. National and international flights
are available from airports in Burlington; Hartford, Connecticut; Boston, Massachusetts; and
Manchester, New Hampshire. Bus service is available to the Burlington, Manchester and
Boston airports.
Regional Transportation Planning Issues
Regional transportation planning in Vermont is now increasingly the responsibility of the
Regional Planning Commissions rather than state highway engineers in Montpelier. The
Two Rivers-Ottauquechee Regional Commission (TRORC) has a Transportation Advisory
Committee (TAC) with representatives from its member towns. The TAC creates a Regional
Transportation Plan that is coordinated with land use planning and is responsive to local

68
needs and concerns. The Vermont Agency of Transportation will use the Regional
Transportation Plan for determining which projects they will fund and the priority of these
projects.
In addition to TRORC, Vital Communities, a regional nonprofit organization based in White
River Junction, hosts the Upper Valley Transportation Management Association (UVTMA),
which is sponsored by the Upper Valley towns, major Upper Valley employers and both
regional planning commissions. The mission of the UVTMA is to provide leadership and
education to promote planning, development, and implementation of transportation
initiatives to mitigate traffic congestion and reduce reliance on single-occupant vehicle
commuting. The UVTMA provides information about alternative transportation, researches
transportation issues, and works with towns and businesses on transportation issues and
solutions.
Of regional concern to Norwich is traffic generated in other towns that flows onto Norwich
roads and particularly through Norwich village. Over time, growth in Sharon, Strafford or
Thetford could seriously affect traffic in Norwich village and on Route 132.
Pedestrian and Bicycle Paths
Safe and convenient pedestrian and bicycle paths connecting Norwich village, Hanover,
playing fields and recreation areas, and outlying population centers would provide for
alternative modes of transportation. Although portions of the village have sidewalks and
there are some existing trails and Class 4 roadways, generally pedestrians and bicyclists
share the roads with cars. U.S. Route 5 North has become a major regional bicycle route.
Ideally, bicycle lanes should be available along roads for experienced and faster riders, and
on separate paths for inexperienced or casual riders and pedestrians.
The Trails and Transportation Committee has been identifying potential bicycle paths and
trails, and sources of funding. It has also been working with groups from other towns within
the region to coordinate a network of regional trails and bicycle paths. A path connecting
Huntley Meadow with the Village Green has been a high priority. An Upper Valley Loop Trail
connecting Norwich, Hanover, Lebanon and Hartford is a long-term project supported by
the towns and the Upper Valley Trails Alliance. A connection from Dothan Brook School in
Hartford to Route 10A in Norwich is a significant gap that needs to be planned and
completed.
Norwich Corridor Project
The Norwich Corridor Project was conceived and planned in 1999-2000 as a major
enhancement of the roadway connecting the newly rebuilt Ledyard Bridge through the
village to Turnpike Road. The master plan reflects the desire of the community to redesign
this corridor from its current form, a typical 1960s interstate highway access road, to a form
more appropriate to its role as a connection between two New England villages by slowing
traffic, providing pedestrian and bicycle lanes, and planting street trees and other
landscaping. The implementation of this plan has moved slowly over the years, with limited
portions incorporated in a 2009 state paving project. Despite the setbacks, the town should
69
retain the vision of this plan for future improvements in the corridor.
Development Review
All new development in Norwich should recognize and accommodate the transportation
issues identified in this plan. Access to all modes of transportation should be considered in
the adoption of new regulations and the review of specific proposals. Using the UVTMA
Mobility Checklist will identify many of the features of walkable, smart growth communities
that are pedestrian, bicycle, healthy-lifestyle and energy-conservation friendly.
Goals, Objectives and Actions
Goal G Plan, maintain and provide for safe, efficient, sustainable, and multi-modal
transportation facilities that serve existing and planned land uses throughout the town
and region and are consistent with the character of Norwich and the region.
Objective G.1 Provide and maintain an efficient and safe network of roads, sidewalks, bikeways
and trails that incorporate rural aesthetics and encourage alternative modes of travel.
Action G.1.a Maintain an up-to-date bridge and culvert inventory and use that inventory to prioritize and schedule replacements and repairs to those structues.
Objective G.2 Encourage new development to locate where there is existing
transportation capacity and to meet all the objectives of this section.
Objective G.3 Create a long-range plan for creation and maintenance of future roads,
sidewalks, bikeways, trails and park-and-ride lots to be updated on a
regular schedule.
Action G.3.a Proposed major changes in land use, either new development or changes in zoning districts, should be evaluated based on the available or planned capacity of transportation facilities serving the area.
Action G.3.b For long-range planning for maintenance and capital improvements of roads and bridges, use available and appropriate tools. Plans should be reviewed by the Planning Commission, Conservation Commission and Transportation Committee to ensure coordination with land use planning and resource protection.
Objective G.4 Plan for and develop long-term solutions to traffic congestion, particularly
alternatives to widening roads or installing traffic signals.
Action G.4.a Improve and create an interconnected road network to avoid congestion.

70
Action G.4.b Use roundabouts, where feasible, to keep traffic moving at a steady but slower pedestrian-friendly pace.
Action G.4.c Facilitate alternative modes of transportation, such as sidewalks, bikeways, park-and-ride lots, carpooling and public transit.
Action G.4.d Consider how best to promote multi-modal transportation uses when making changes in land use.
Objective G.5 Consider the aesthetic enjoyment of traveling on the road and effects on
wildlife habitat, in addition to safety and cost, in decisions regarding
changes within the road right-of-way.
Action G.5.a Adopt policies and guidelines to be followed when upgrading town roads, taking into consideration cost, safety, aesthetic enjoyment of traveling on the road, provisions for bike and pedestrian traffic, and other concerns of residents served by the roads.
Action G.5.b Utilize design concepts developed in the corridor master plan (Final Report - Main Street/Route 5 and Route 10A Transportation Corridor Plan for the Town of Norwich, Vermont, December 2000) as guidelines for future transportation facility planning in the village.
Action G.5.c Consider effects on wildlife habitat and travel corridors when making changes within road rights-of-way.
Objective G.6 Promote creation of an interconnected system of trails, paths, bikeways,
and sidewalks to meet the recreation, health, and transportation needs of
Norwich residents.
Action G.6.a Create and maintain a master plan for future trails, paths, sidewalks, and bikeways. Use the master plan as a basis for pursuing grants and other funding for design, right-of-way acquisition, and construction of planned improvements.
Action G.6.b Build pedestrian and bicycle paths connecting village centers, recreation areas, town facilities, and paths to other towns to promote health, safety, and alternative modes of transportation in Norwich.
Action G.6.c Incorporate the needs of cyclists and pedestrians into all transportation facility planning and review of future development
Action G.6.d Accommodate bicycle and pedestrian safety when rebuilding and upgrading roads and bridges.

71
Objective G.7 Continue to provide additional protection for the exceptional scenic,
historical, and cultural qualities of Norwich’s designated scenic roads under
the Norwich Scenic Road Ordinance.
Action G.7.a Review and update the current Norwich Scenic Road Ordinance based on its past effectiveness and current concerns.
Objective G.8 Consider the potential value of Class 4 roads, legal trails or ancient roads
for recreational trails or for future roads before any reclassification or
change in these roads or discontinuance of public rights-of-way.
Action G.8.a Consider the following prior to re-classifying or discontinuing any Class 4 road:
1. Recreational use, connections to other trails, access to public land
2. Suitability to upgrade to future Class 3 road based on topography, geology, and environmental impact
3. Potential for providing access to areas suitable for future development based on land use objectives of town plan
4. Potential for providing future link between existing Class 3 roads and, if so, benefit to vehicular transportation network and emergency response
5. Liability to town in current condition
6. Effect of change of classification on abutting landowners’ use of their property
7. Historical significance of thoroughfare
Action G.8.b Consider the following prior to discontinuing any legal trail or ancient road:
1. Recreational use, connections to other trails, access to public land
2. Suitability to improve the right-of-way for vehicular travel or recreational use based on topography, geology, and environmental impact
3. Potential for providing access to areas suitable for future development based on land use objectives of town plan
4. Potential for providing future link between existing town roads and, if so, benefit to vehicular transportation network and emergency response
5. Liability to town in current condition
6. Effect of change of classification on abutting landowners’ use of their property
7. Historical significance of thoroughfare

72
Objective G.9 Ensure that all private roads meet basic standards appropriate for
Norwich’s climate, terrain and rural character in order to protect public
safety, infrastructure, and the environment, and promote multiple modes of
travel.
Action G.9.a Regulate intersections with private roads and town roads by providing standards for sight distance, intersection angle, percent of grade at intersection, and any other criteria to promote safety and prevent damage to town roads.
Action G.9.b Encourage the use of shared driveways to reduce the number of private roads intersecting the town roads.
Action G.9.c Continue to regulate the design and construction of private roads serving two or more houses, and private driveways for single-family residences, to facilitate access by emergency and service vehicles, protect public safety and limit environmental impacts.
Action G.9.d Where possible, design private roads to follow existing tree lines, stone walls, ridgelines, or other topographical features and to protect rural character to the greatest extent possible.
Action G.9.e Create guidelines for the design and construction of private roads and driveways to have minimum impact on significant natural resources and scenic views.
Action G.9.f Continue to regulate the design and construction of private roads and driveways to ensure that appropriate stormwater management techniques and infrastructure are used to minimize run-off, sedimentation and flooding of downslope infrastructure, property and waterways.
Objective G.10 Balance the decision to retain the town‘s ancient road rights-of-
way for the benefit of town residents with the rights of individual
landowners.
Objective G.11 Increase awareness and use of existing public transportation to
reduce future traffic congestion in the town and region, environmental
impact, and wear-and-tear on roads.
Action G.11.a Promote use of public transportation by providing park-and-ride lots, bike racks at bus stops, bike racks on buses, small bus stop shelters, and similar improvements to make public transit more convenient.
Action G.11.b Revise land use regulations to allow both public and private park-and-ride facilities in key locations to allow commuter traffic to transfer from single-occupant vehicles to public or private busses or carpools.

73
Action G.11.c Facilitate carpooling through use of ride-share physical or electronic bulletin boards.
Objective G.12 Encourage more students to use the school bus system to
alleviate traffic congestion in the village.
Action G.12.a Create programs to educate parents and students of the advantages of using the school bus system.
Action G.12.b Design or plan any improvements to the school’s traffic circulation pattern, access drive or parking area primarily to accommodate safe bus transportation, walking and cycling, and to discourage parents from driving to the school to drop off and pick up students.
Objective G.13 Coordinate transportation and land use planning with surrounding
towns.
Action G.13.a Meet with officials from surrounding towns to discuss planning objectives and specific proposals that impact both towns.
Objective G.14 Incorporate the following UVTMA Checklist Goals into land use
planning and development review where feasible:
1. Proximity to Services, Employment, and Transit. The most effective way to reduce single-occupant vehicle (SOV) transportation is to locate housing near services and employment and on transit routes.
2. Pedestrian and Cyclist Orientation. These features encourage people to walk and cycle instead of getting into their automobiles. Routes for pedestrians and cyclists within the proposed development should be convenient, attractive and safe. The design also should provide for the easy use of strollers, scooters, roller blades, walkers and wheelchairs.
3. Density/Location. Concentrated development supports pedestrians, cyclists, and public transportation opportunities.
4. Mix of Uses. “Villages” at transit stops should have a mix of residential, civic, and commercial land uses, as well as other land uses nearby. The mix should offer people opportunities to live and work close to transit, to obtain at least basic goods and services, and to use transit to travel to other places.
5. Parking. Parking should be minimized while encouraging active transportation alternatives to the SOV.

74
Objective G.15 Participate actively in the regional transportation planning process
to ensure that regional plans support the goals, objectives and policies of
the Norwich Town Plan and that Norwich takes advantage of regional
solutions to transportation issues affecting town residents.
Action G.15.a Ensure regular representation to all regional transportation entities, such as UVTMA, Advance Transit, Upper Valley Trails Alliance, etc.
Action G.15.b Investigate passenger train possibilities.

75
energy
We are in an era of significant change in the use of energy and the management of
energy resources. Change based on new research and technology is so rapid that
many of the concepts and programs addressed in this chapter may be obsolete within a
few years, but the goal of moving to a more sustainable world by conserving resources
and reducing greenhouse gases will remain.
This goal will be attained by reducing energy demand within our homes and businesses
and in our transportation system and converting to renewable non-fossil-fuel energy
sources. The benefits of an effective energy policy are economic, environmental, and
social.
Profile
History and Trends
Originally energy needs were met locally: forests for fuels, rivers and streams for mills,
physical labor from man and beast for work and transportation, and perhaps some wind
power. The 20th century brought a switch to inexpensive fossil fuels for transportation, heat,
and electric power, as well as a move away from local energy sources. By the end of the
century, with 85 percent of the money spent by Vermonters on energy going out of state or
country, most of the money spent on energy is exported from our local economy and does
not return to create jobs or buy goods locally. In addition, foreign fuel sources are unstable,
and subject to huge price swings and supply shortages beyond our control.
With the dramatic increases in the cost of energy derived from fossil fuels in the last 40
years, we have witnessed major changes in building construction, transportation, and
general energy efficiency. Recognition of the threat of climate change has accelerated the
move away from fossil fuels in the last 10 years and heightened interest in solar, wind and
other renewable noncarbon-based energy resources. It is clear that this trend will continue.
Energy Use
The State of Vermont set a goal of meeting 90% of its energy needs through efficiency and renewables by 2050. As of 2014, Norwich was meeting less than 20% of its annual energy needs through renewables as follows:
29% of the 174,000 MMBTUs used for heat. A well-insulated, 1,500 square foot home in Vermont uses about 75 MMBTUs per year for heat. There are approximately 1,640 homes in Norwich, most of which are larger than 1,500 square feet.
26% of the 57,000 MMBTUs used for electricity. The average household in Vermont

76
uses about 7,200 kWh (24.6 MMBTUs) of electricity per year. There are approximately 1,350 households living in Norwich.
7% of the 211,000 MMBTUs used for transportation. The average personal vehicle in Vermont is driven 15,000 miles per year and gets 25 miles to the gallon, consuming 72 MMBTUs per year. Norwich residents have approximately 2,600 personal vehicles. *
* Source of Data- Vermont Community Energy Dashboard
Norwich is typical of Vermont communities relative to energy consumption. More than 75% of energy consumed in Vermont today is from fossil fuels, and it is used primarily for heating and transportation. Meeting the 90% goal by 2050 will require significant improvements in the energy efficiency of buildings and in the transportation sector. For example, there has been a significant increase in the amount of energy being generated from photovoltaic solar systems in Norwich, as of 2017 (approximately 878,000 kWh of electricity was being generated annually from about 130 photovoltaic solar installations), these systems generate only enough power to provide electricity to approximately 120 or 9% of homes in Norwich.
Approximately 1,420,900 kWh/year is being generated by a total of 1093 kW in photovoltaic solar installations: 219 homes (both on-site and off-site installations), 1 business, and 1 church in Norwich. This represents 16.4% of the homes in Norwich.
Energy Resources
Wind Resources. Wind speeds in Norwich, even in the higher elevation areas on the western side of town, are relatively low, suggesting that utility-scale wind farms are unlikely to be feasible in Norwich.
Solar Resources. A combination of forest cover and topography significantly reduces the areas of town that are suitable for solar power generation. The suitable sites are primarily located in the eastern portion of town where the topography is less severe, and there is more open land and there is access to existing infrestructure.
Siting Standards and Guidelines
The following sites have been reviewed by the Norwich Planning Commission as locations that should be given priority as renewable energy generation sites and those locations where renewable energy is not appropriate and would violate community standards.
Theseis parcels qualifiesy as a Category II site for a solar array not larger than 150 kW AC:
- Parcel 11-045-200, located at 673 Union Village Road
- Parcel 12-001.300,b #, located at [intersection of Farrell Farm Rd and Starlake Ln]
These parcels qualify as Category III sites for a solar array not larger than 500 kW AC:
- Parcel 11-104-000, located at 635 US Route 5 North

77
- Parcel 11-105-000, located on US Route 5 North
Future Energy
The town’s energy future is inextricably linked with energy policies and economic forces at
the state, federal, and international levels. While Norwich is limited in its ability to affect a
national energy policy, town government does have significant local influence. The town is
the unit of government closest to the citizens, and is therefore most accessible to the
participation of every individual.
Norwich views the implementation of this Energy Resource Conservation Plan as the initial
step in the development of a sustainable energy future. Our long-term vision is to become a
model of sustainable energy practices by: reducing our energy use through utilization of
energy-efficient end-systems; achieving the maximum development of local renewable
resources that is economically feasible; and thoroughly evaluating and modifying, wherever
feasible, our patterns of energy use, settlements, transportation, and industry to minimize
environmental impacts and carbon emissions that contribute to the problem of climate
change. By implementing these goals, we expect to reap long-term economic,
environmental, and quality-of-life benefits.
Since our air and water quality as well as the quality of life in Norwich are affected by our
energy use, we must take responsibility for the environmental effects of our energy use, in
consideration of generations yet to come. Therefore, the Town of Norwich resolves to take
action that will create a sustainable energy future; one that minimizes environmental
impact, supports our local economy, and emphasizes energy conservation, efficiency, and
the increased use of local and regional clean renewable energy sources.
Energy Conservation
In addition to energy-efficient buildings, the conservation of energy in Norwich should also
include land use and transportation policies. Land use issues addressed in Chapter 12 and
transportation issues addressed in Chapter 9 include the importance of sustainable
development patterns that reduce the need for excessive use of private vehicles. Building
higher-density housing in areas near existing roads and public transportation will minimize
the increased use of inefficient single-occupancy vehicles. Planned Unit Developments
(PUDs) should include provisions for public transit, pedestrian and bike paths within the
developed area and connecting to other destinations.
Energy-efficient buildings are a critical component of energy conservation. The town should
continue to support state programs such as the Vermont Residential Building Energy

78
Standards Certificate to mandate the energy-efficient construction of new buildings and
create incentives to retrofit existing buildings to be more energy efficient. The town should
continue to set an example by implementing energy conservation programs for all new and
existing municipal buildings. Energy efficiency and the reduction of greenhouse gases
should be considered in the purchase of new vehicles and machinery.
Goals, Objectives and Actions
Goal H Reduce overall energy consumption within the town through conservation and
efficiency, thereby decreasing the adverse environmental and economic impacts
associated with energy consumption and volatility in fuel prices, reducing
dependence on oil, and lowering energy costs where possible.
Objective H.1 Model responsible energy use through municipal actions, decisions,
purchases and projects.
Action H.1.a Reduce energy consumption in all town buildings and operations.
Action H.1.b Investigate and consider energy conservation and efficiency measures for use in all town buildings and operations.
Action H.1.c Encourage the development and use of local low-pollution, low-carbon- emission renewable energy resources for all town buildings and operations. The use of combustion-based energy sources in the high-density town center should include controls on particulate emissions.
Action H.1.d Encourage conversion of older wood stoves to new cleaner-burning EPA-certified wood stoves. Do not permit use of outdoor wood boilers unless they meet strict emission control standards.
Action H.1.e Investigate prospects for a district heating system in the town center, ideally a cogeneration system that would create electricity as well as space heat.
Action H.1.f Conduct complete energy audits of all town buildings to identify areas of energy waste and areas of potential savings, determine whether end-uses of energy are properly matched with the types of energy sources used, recommend cost-effective energy conservation and efficiency measures and modifications that will make use of renewable energy, prioritize these modifications and incorporate them into the Town’s Capital Budget, and implement programs as prioritized by the previous steps.
Action H.1.g Construct all new municipal buildings according to standards of energy efficiency at least equivalent to Energy Rated Homes of Vermont 4-star level or other state energy code. Mandate that all new buildings that will involve heating and cooling consider the lowest carbon emission heating/cooling plant design - for example, ground-source cold-climate heat-pump technology.

79
Action H.1.h Develop and implement a program of upgrading to, and maintaining, energy-efficient and nonpolluting exterior lighting for both public and private facilities including streetlights. Exterior lighting should be controlled by timers and light sensors to reduce usage when not needed and only low-level security lighting should be on all night.
Action H.1.i Use life-cycle cost planning in evaluating all decisions concerning the purchase by the town of any equipment, vehicle, or other item requiring energy consumption. Use comprehensive pollution analysis in this decision-making process. Require a public discussion of the trade-offs between pollution, CO2 emissions, and energy costs as identified by life-cycle cost analysis. The town must consider together its twin goals of pollution reduction and cost reduction.
Action H.1.j Engage in long-range planning for the use and acquisition of sustainable low-pollution energy. Include environmental and pollution risks and benefits in this planning process.
Action H.1.k Increase the energy efficiency of all town vehicles by the use of alternative fuels and hybrid-drive systems in town vehicles and other technological advances as they are developed. The ecological and social impacts of specific types of alternative fuels should be considered before their adoption for town vehicles. Analyze the routes and travel of all town vehicles in order to recommend changes that will reduce transportation costs.
Action H.1.l Manage town forest land, where possible, to provide high-value locally produced durable wood products, recreational uses, and wildlife habitat for the benefit of the town and its residents in a sustainable manner. Where sound forest management practices dictate, some wood may be harvested for use as fuel as a “transition” fuel source. Studying feasibility of converting municipal buildings and schools to the lowest possible carbon emission heating and cooling systems, including ground-sourcecold-climate-heat pumps (GSHP). Consider conversion of legacy oil burners to bio-diesel “boost” heat sources for GSHP cold-climate heat pump systems. Consider systems that burn wood chips, wood pellets, grass pellets, and other fuel stocks whose combustion releases carbon only if non-combustion systems are deemed not feasible.
Objective H.2 Require that cost-effective conservation, efficiency, renewable energy
technologies and techniques be incorporated into all new publicly funded
structures erected in the town.
Objective H.3 Encourage the use of energy-efficient materials, technologies and
techniques in all new privately owned structures erected in the town.

80
Action H.3.a Facilitate compliance with state mandated energy efficiency codes including the Vermont Residential Building Energy Standards Certificate through directing building permittees to free consultation with Efficiency Vermont
.
Action H.3.b Create Incentives for meeting or exceeding state and federal or industry energy efficiency standards in the construction of all buildings.
Objective H.4 Encourage and support settlement patterns and densities that reduce
travel requirements to work, services, shopping, and recreation.
Action H.4.a Adopt land use and zoning ordinances that encourage energy conservation and efficiency and the environmentally sound development of local renewable sources of energy.
Action H.4.b Encourage outlying village centers (growth centers) to promote land use that would create or lead to energy-efficient development patterns.
Action H.4.c Encourage agricultural activities and seasonal farm stands so that local produce can be marketed locally.
Action H.4.d Allow appropriate home occupations in order to reduce commuter transportation.
Objective H.5 Promote development of local clean, low-pollution (e.g. solar, hydro,
wind) renewable resources as a replacement for imported nonrenewable
resources and for combustion-based energy sources.
Action H.5.a Identify and protect potential clean, low-pollution renewable energy resources such as hydro, solar, wind and ground-sourcecold-climate heat pumpingpumps.
Action H.5.b Encourage and support the development and use of clean, low-pollution, local renewable energy resources for the town’s residential, commercial and industrial sectors wherever economically feasible.
Action H.5.c Encourage townspeople and developers to use clean, low-pollution local and/or renewable resources and technology on a sustainable basis.
Action H.5.d Promote environmentally sound development of the town’s clean, low-pollution renewable energy resources.
Action H.5.e Encourage use of clean, low-pollution renewable energy sources instead of imported non-renewable energy supplies and combustion processes.
Action H.5.f Recommend construction design standards and siting requirements that encourage solar heating and lighting and ground-sourcecold-climate heat pumps or other low-carbon-emission technologies in all new buildings.

81
Objective H.6 Ensure that energy supplies will be reliable, affordable, and
environmentally sound.
Action H.6.a Develop a system to allow tax credits for energy efficiency or clean, low-polluting renewable energy investments and improvements.
Action H.6.b Require that all wood-burning installations meet all applicable National Fire Protection Association (code # 211) safety requirements and Federal EPA emissions standards. Encourage a switch away from wood-burning to ground-sourcecold-climate heat pumps in high-density areas and areas subject to inversion conditions.
Action H.6.c Promote state and/or local tax abatement programs for improving the sustainable management of forests.
Action H.6.d Protect designated productive forest lands from development by working with land trusts and owners to acquire conservation easements to protect forest lands and/or by offering tax stabilization agreements to landowners who agree to manage their forests for wood products, recreational uses, and wildlife habitat in a sustainable manner.
Objective H.7 Increase public awareness of energy issues and build public support for
energy efficiency, pollution reduction, and sustainable energy policies.
Action H.7.a Encourage and support public energy education and awareness programs that responsibly consider the environmental impacts of energy decisions.
Action H.7.b Provide resources for information on conservation and efficiency technologies including efficient transportation; local clean, low-CO2 renewable resources; related town, state, and federal energy programs; and available funding and financing for these programs. These resources may be made available at the Norwich Public Library, town offices, and town web site.
Action H.7.c Provide information on local and regional funding for residential energy audits and cost-effective weatherization services for all existing homes, with special emphasis on low-income housing.
Action H.7.d Provide information to encourage the use of local wood products and resources.
Action H.7.e Promote a campaign to educate builders and architectsthe community on solar technologies, such as passive solar heating and natural lighting, as well as other low-carbon-emission technologies such as ground-sourcecold-climate heat pumps.

82
Action H.7.f Promote community weatherization programs to increase the energy efficiency of existing homes using additional insulation and other cost effective sustainable techniques. Programs should provide information regarding any health risks of specific types of insulation and about the importance of maintaining adequate ventilation to allow adequate air exchange.
Action H.7.g Consider adopting local building codes to maintain energy efficiency, personal safety, and sustainability.
Action H.7.h Provide information to residents about existing and potential solar, wind and hydro-powered generating sites, procedures for developing solar,wind power and hydroelectric power, and available solar,wind and hydro-powered generating systems. Provide information on net-metering opportunities.
Action H.7.i Encourage state legislators and regulators to allow support distributed power generation opportunities such as net metering below zero, allowing residential hydro, solar, and wind systems to be net sellers of power to the grid.
Objective H.8 Coordinate land-use and transportation planning that promotes energy-
efficient transportation.
Action H.8.a Promote cost-effective energy efficiency in future transportation planning.
Action H.8.b Promote and implement strategies to encourage ride-sharing, public transit, bicycling, and walking.
Action H.8.c Encourage the use of existing public transportation and school bus routes, state car-pooling and van-pooling programs, and other transportation alternatives.
Action H.8.d Promote the development and use of a system of trails, greenways, sidewalks, bicycle paths, and commuter parking lots as safe and viable transportation components.
Action H.8.e Encourage the installation of bicycle parking racks at major activity areas such as schools, recreation facilities, shopping centers, major places of employment, and mass transportation facilities.
ADD - Encourage the installation of electric-vehicle charging stations]
Action H.8.f Provide shelters, where needed, for pedestrians and bicyclists at bus stops and ride-share pickup locations.
Action H.8.g Include bicycle paths as a component of the town’s Capital Improvement Program and pursue federal and state funding for their construction.
Action H.8.h Include bicycle paths, pedestrian walkways, and mass transportation access in review of all proposals for commercial development, PUD housing, and town facilities.

83
Action H.8.i Adopt zoning regulations that support development of mixed-use growth centers containing daily services to residences, thereby reducing transportation needs.
Action H.8.j Consider transportation efficiency issues and bicycle use when making road expansion decisions.
Objective H.9 Encourage and support the retrofitting of older buildings as a more
energy-efficient and sustainable practice than demolition and rebuilding.
Action H.9.a Consider the total cost of energy use and sustainability when determining whether to retrofit an older building or demolish it and re-build. Energy costs may include demolition, disposing of used materials, manufacturing and transporting new materials, and construction. The embodied energy costs - energy used to create the materials and construct the original building - may also be considered and include the energy used to create the materials and construct the original building.
Action H.9.b Provide information to owners of older and historic buildings about the many tax credits, grants, and low interest loans created to support both historic preservation and energy efficiency.
84
natural and historic resources
Norwich’s citizens value the town’s natural resources and are concerned with their
protection. This has been shown by the responses to several town-wide surveys and
questionnaires conducted by the Planning and Conservation Commissions over the
past decade. The Capital Land Fund, in existence for more than two decades, is
evidence of community support through annual dedications of public funds for
conservation and resource protection.
Norwich’s natural resources are valued for contributing to its citizens’ well-being and the
town’s rural character. This chapter will explore the past and present state of Norwich’s
natural, scenic and historic resources and suggest how those resources should be
treated in the future.
A Changing Landscape The colonists who first moved into the forested lands of the Norwich Town Grant did so
with the intention of making use of the area’s natural resources. They settled along the river
plain and above the fall-lines of the brooks, where there was good soil. At first, they avoided
the ancient bed of glacial Lake Hitchcock, where they found soggy clays and wetlands, and
where the streams were clogged with flood debris.
As more immigrants arrived, they cleared and settled the land between the banks and deltas
by the lake created over several thousand years while the continental ice sheet was
retreating. Early settlers quickly deforested much of the arable land using a slash-and-burn
technique to create farm fields and pastures. This rapid change in the landscape had many
impacts on the town’s natural systems – loss of species as habitat disappeared, alteration of
soils, extensive erosion from deforested uplands that deposited silt and modified streams,
damming and diversion of streams for waterpower and irrigation. As the town developed,
residents began extracting the glacial deposits of sand and gravel for construction and road
building, a practice that continues today.
Once the broader expanses of level land were settled, homesteaders worked their way along
the main brook valleys, which provided natural corridors where roads could be more easily
built. The landscape of the early 19th century was one characterized by significantly more
open land than exists two centuries later. Hillside farms, always marginal, were abandoned
after several generations struggled to subsist on their poor lands; the fields and pastures
reverted to their natural forested state. Evidence of these farmsteads can still be found –

85
segments of stone walls, depressions created by old cellar holes, remnants of stone
foundations or chimneys – in what looks like undisturbed forest today.
The town’s higher ridges and peaks remained largely undeveloped, although all but the
least accessible lands have been logged at some point during the last 250 years. Today most
of the steep hills and ridges are covered in forest, creating scenic vistas from both the
valleys and the peaks. Norwich’s topography affords many opportunities for scenic views
from the roads that travel along valleys and up into the hills. These vistas are major
contributors to the rural character enjoyed by Norwich’s residents.
Over the last 50 years, Norwich’s landscape has again been experiencing change. Residential
development has been moving out from the river valley up into the hills. Modern technology
and infrastructure have allowed us to live in places previously too inaccessible or difficult to
build on. While many of the homes located in the town’s uplands are barely visible as one
travels the wooded back roads, each new house affects the natural systems around it to
some degree. The impact of those many small changes can have significant cumulative
effects – fragmenting wildlife habitat, altering surface drainage patterns, generating
pollution. While we generally recognize the importance of the town’s natural systems and
their functions today, we continue to change the landscape around us and utilize its
resources as suits our purposes.
Air and Climate
Air Quality
Like most of Vermont, Norwich enjoys excellent air quality. Given the absence of large-scale
industry or major urban centers in the region, local air quality concerns are limited mainly
to vehicle emissions, especially from idling vehicles, heating systems, and dust generated by
construction and excavation sites. The cumulative effect of these local sources of air
pollution may increase with additional growth and may have a greater impact on air quality
in the future.
Of more immediate concern are impacts on air quality resulting from pollution generated
far from Vermont. Most notably, the coal-burning power plants of the Midwest have been
cited as the main cause of acid rain and other airborne pollutants, which are detrimental to
the health of forests and pond ecosystems throughout the Northeast. Clean air is a basic
resource that can no longer be taken for granted even in rural communities like Norwich.
Climate
Climate represents the average weather conditions characteristic of an area over time.
Weather patterns are an important consideration for planning and design because of their
effect on such things as soil erosion, plant growth, storm water runoff and flooding,
groundwater supplies, road maintenance, energy demand and alternative energy supplies.
Weather patterns, especially wind, also influence air quality.
Norwich experiences average high temperatures in the low 80s during the summer and

86
average lows in the single digits above zero during the winter. However, short periods of
highs above 90°F and lows below 0°F occur most years. Two to three inches of precipitation
can be expected most months, as shown in Figure 11-1.
The effects of climate change are already evident in Norwich, including more intense storms
linked to rising average temperatures. Over the next 50 years, climate change models have
projected that the average temperatures in the region will increase by five to nine degrees
Fahrenheit. Such an increase would reduce the number of months with average low
temperatures below freezing from the current six, to four, and increase the number of
months with average highs above 80°F from two to three or four.
While many of us human residents may not miss the extra months of winter weather, the
plants and animals around us will. Climate change will alter the town’s natural environment
by changing the plant species that can thrive in Norwich, the migrating patterns of
waterfowl and songbirds, the temperature of rivers and ponds, and countless other changes
throughout parts of the interconnected web of life. The climate and natural environment
will become more like that of the mid-Atlantic region.
Terrain, Geology and Soils
Topography
Elevation. The elevation in Norwich ranges from 400 feet above mean sea level along the
banks of the Connecticut River to 1,850 feet atop Gile Mountain. The dramatic rise from the
valley floor to the upland ridges and hilltops creates the varied terrain that is an important
component of the town’s character. Norwich’s landform is often described as a hand, with
the palm being the relatively level lands of the river valley and the fingers being the narrow
stream valleys that extend up into the hills. There are a number of named mountains and
hills as shown on Map 5.
Slope. Steep slopes characterize significant portions of Norwich, as shown on Map 6. Slope
is one of the primary characteristics of land that influences the uses it can support. While
the map shows general areas of moderately and severely steep slopes, site assessments may
be needed to accurately delineate steep slopes and determine the management
requirements for specific properties.
Percent of slope is one way to describe the steepness of land and measure change in
elevation over a given distance. A one percent slope equals a one-foot change in elevation
over a 100-foot distance. The Natural Resources Conservation Service (NRCS) recommends
careful management to limit site disturbance on slopes in excess of 15 percent and suggests
avoiding all construction activities on slopes in excess of 25 percent to prevent soil erosion,
increased runoff, downstream flooding and other hazards.
On steep slopes, soils are typically shallower, the volume and velocity of surface water
runoff is increased and the erosion potential is greater than on level ground. Maintaining or
restoring forest cover is the optimal solution for controlling erosion and slowing runoff

87
from steep slopes. The tree canopy helps to dissipate the energy forces of a strong rainfall,
while tree roots hold soil in place. Dropped leaves and forest litter help to prevent soil
compaction, fertilize the soil, retain moisture, allow water to infiltrate the soil and recharge
groundwater supplies.
Ridgelines. As described above, the town’s topography includes a number of prominent
hills and ridgelines, which are characterized by their elevation and steep slopes. In addition
to physical limitations and impacts on natural resources, development on steep slopes and
prominent ridgelines can adversely affect scenic character. Development on hillsides,
summits and ridgelines, especially at higher elevations, is often highly visible from
numerous vantage points. Such development also contrasts dramatically with the natural
backdrop of unbroken forest.
Bedrock Geology
The Connecticut Valley marks an important geologic boundary as well as the political
boundary between Vermont and New Hampshire. The Ammonoosuc fault line lies just east
of Interstate 91 along the river. Road cuts along the interstate reveal the geologic history of
the valley, which included periods of sedimentary rock formation when all of New England
was under the Atlantic Ocean and volcanic activity that metamorphosed older rocks.
The valley also contains a wealth of depositional and erosional features related to the more
recent glaciation during the last ice age. Most of what we now call the Connecticut Valley
existed before that last period of glaciation. Ice pushed into the valley from the north,
gouging it deeper and wider. When the glacier began to melt, the valley was flooded,
forming an immense body of water referred to as Lake Hitchcock. At one time Lake
Hitchcock and Lake Vermont (the glacial-era Lake Champlain) were only separated by a few
miles. Large amounts of sediment were released from the melting ice and were deposited
on the lake bed. As the floodwaters receded, the river cut a channel through the former lake
bed and its deposited sediments.
Soils
The physical and chemical components of soil vary greatly in Norwich and influence the
suitability of land for various land uses, such as agriculture and development. The town’s
soils developed as the landscape and underlying bedrock was shaped by geologic forces and
their characteristics are influenced by topography, climate and ecological factors. The
Natural Resource Conservation Service has inventoried, assessed and mapped Norwich’s
soils; its survey data was most recently updated in 1992. In 1994, the maps were converted
into digital format and are a layer of the Norwich Geographic Information System (GIS).
While the maps provide an excellent basis for town-level planning, site assessments may be
needed to accurately determine the types, characteristics and extents of soils on any given
property.
Shallow Soils. Soils on ridgelines and hillsides in Norwich are thin (less than two feet to
bedrock). Shallow soils increase the difficulty and expense of constructing adequate septic
systems. In addition, soils overlaying steep slopes are highly erodible and, like shallow soils,

88
pose similar constraints to septic system installation and proper operation.
Hydric Soils. There is only a small amount of land in Norwich characterized by hydric
soils. These soils generally occur in conjunction with streams and indicate that wetlands
may be present, including unmapped Class III wetlands.
Sand and Gravel Resources. Norwich has small deposits of sand and significant deposits
of gravel. There are several active extraction operations in town and a number of sites that
have been previously mined for sand or gravel. The ability to acquire sand and gravel locally
significantly reduces the cost of road maintenance within the town. With proper erosion
control and reclamation techniques, their extraction can have minimal impact on the
environment and the land can be returned to other productive uses. Sand and gravel
deposits are a valuable, non-renewable resource for construction, which becomes
unavailable for future use if built upon. Further, the sand and gravel deposits near the
Connecticut River, and elsewhere, are highly porous and readily transmit septic effluent to
the groundwater.
Agricultural Soils. On a nationwide basis, certain soils are designated as prime for
agriculture because of their chemical properties and drainage characteristics. As shown on
Map 9, Norwich has prime soils within the floodplain of the Connecticut River and
Ompompanoosuc River, and on the terraces of the ancient Lake Hitchcock.
Many of the same characteristics that make these soils excellent for farming also make them
a prime location for development, as evidenced by the fact the Norwich Village is largely
located on agricultural soils. A large percentage of Norwich’s agricultural soils are located
on parcels of land less than 25 acres in size, which limits their productive use. Some of these
soils remain undeveloped and, though not sufficient for large-scale agricultural practices,
have potential to be used for vegetable and specialty crops for local and northeastern
markets. The ability to grow food locally is one of the components of Norwich’s rural
character valued by residents.
Forestry Soils. The Natural Resource Conservation Service also has identified the best
soils to support commercial forestry, including many upland soils that are too shallow,
rocky or steep to support other types of development. As a result, primary forestry soils are
generally less threatened by development, but are more sensitive to site disturbance and
erosion. To help prevent soil erosion, the state has adopted acceptable management
practices to prevent soil erosion and maintain water quality on logging jobs.
Septic Suitability. With no municipal wastewater infrastructure, all of Norwich’s homes
and businesses rely on soil-based septic systems to treat their sewage. While the town can
no longer regulate wastewater systems, as that authority was assumed in its entirety by the
state in 2007, the capability of the town’s soils to adequately treat waste remains an
important planning issue.
Norwich has large areas characterized by soils that are not well-suited for conventional
septic systems. The shallow depth of many of the town’s soils noted above is a limiting

89
factor, which often requires the installation of more expensive alternatives such as mound
systems, and is one of the factors driving the high cost of new home construction in
Norwich. It should not be assumed, however, that the current assessment of the ability of
Norwich’s soils to adequately treat septic waste will on its own serve to limit development
in particular parts of town or control the town’s growth rate over time. Wastewater
technology continues to evolve and soil conditions are likely to become a less critical factor
in septic system design in the decades ahead. New state standards adopted in 2002 reduced
the required isolation distances to bedrock and groundwater and allowed for alternatives to
conventional systems.
Water Resources
Groundwater
Groundwater is the least understood and documented of all our natural resources, yet it is
essential to the preservation of life and to economic stability. The entire population of
Norwich relies on groundwater for domestic uses. It is tapped from underground springs or
fractures in rock, or mined from underground storage areas called aquifers.
Aquifers are subsurface deposits of coarse sand and gravel that, because of the depth of the
material and large pore sizes between sand grains and cobbles, hold vast quantities of
groundwater. The coarse texture in an aquifer also allows rapid and untreatable diffusion of
pollutants. The two types of aquifers are gravel and bedrock. Both can be unconfined or
confined (not susceptible to surface water) and both can be vast or limited in quantity and
time of recharge. Septic tank effluent, leaking underground fuel storage tanks, landfill
leachate, agricultural runoff, or improperly stored hazardous wastes are potential sources
of groundwater pollution. The recharge water’s passage through vegetation and soil must
filter out such toxins; otherwise, the pollution is virtually impossible to remove from the
aquifer and its use as a potable water supply would likely need to be discontinued or a
water treatment plant would be required. Preventing pollution spills or leaks, creating or
maintaining vegetated buffers, following accepted manure management practices, and
establishing setbacks within recharge areas are effective methods of protecting drinking
water supplies stored in aquifers.
Norwich Village Water Supply. Since the 1980s, Norwich village’s water supply has been
an aquifer three miles north along the Connecticut River. It lies in an esker, a thick ribbon of
sand and gravel left by a river that ran under the great ice sheet while it was retreating
northward. The modern river cut through it, probably when ancient Lake Hitchcock was
emptying, so that only its northern part is in Vermont; its southern part extends down
through Hanover from the level of the Cold Regions Research and Engineering Laboratory
(CRREL). The Fire District owns 27 acres of land at the south end of the Vermont part of the
esker to ensure access to it.
The town has incorporated an approximately 69-acre Primary Aquifer Protection Area into
its zoning regulations that includes the Fire District’s holdings and some of the gravel mine
to the north. A Secondary Aquifer Protection Area includes the entire watershed
90
(approximately 2,315 acres) of the stream that flows near the Primary Aquifer Protection
Area. The current boundaries of the Primary Aquifer Protection District are based on
hydrological studies conducted in 1990. The water quality of the well is affected by the
water quality of the Connecticut River and therefore the actual area that needs to be
monitored could be extensive. The Connecticut River, the railroad, Route 5 and Interstate
91 all pass near the esker. A major toxic spill on any of these might contaminate the village’s
drinking water supply.
Given that a portion of the aquifer re-charge comes from the Connecticut River, which is
controlled by the State of New Hampshire, continuing cooperation between the two states is
important for safeguarding this resource. An interstate aquifer protection district has been
proposed, but not yet implemented.
In summary, there is an ongoing critical need to protect the aquifer that supplies Norwich
village and other sources of drinking water, and to identify major sources for future needs.
Only with planning, education, and action can Norwich assure its citizens that their water
and health will be safeguarded from harmful micro-organisms and toxic chemicals.
Protecting groundwater deserves the highest priority in formulating plans for the future of
Norwich.
Surface Water
Connecticut River. Norwich is located along the Connecticut River, which forms the
town’s 7.8-mile eastern border. The Connecticut River is probably Norwich’s most valued
natural, recreational and scenic resource, and has been recognized as a national treasure
through its designation as an American Heritage River in 1998. The Connecticut River
travels 410 miles from its source in a small lake near the Canadian border to flow into the
Atlantic Ocean at Long Island Sound.
The river gathers the flow of 24 major tributaries and thousands of small streams that
originate in the mountainous uplands of Vermont and New Hampshire. Its watershed
encompasses 41 percent of Vermont’s land mass and one-third of New Hampshire’s.
Between the two states, 52 communities, in addition to Norwich, have a boundary defined
by the river. The river can be seen as a living thread that has tied, and continues to tie, the
people along its entire length together in one long valley community.
Recent decades have seen the river’s resurgence as an important natural and recreational
resource. First for Native Americans, then for early European settlers, the Connecticut River
was an important corridor for travel and commerce. By the 20th century, the historic
practice of dumping waste directly into the nearest stream or river so unwanted pollution
would wash away with the flowing waters resulted in major rivers like the Connecticut
becoming virtual cesspools whose downstream waters could barely support life.
In recent decades, the river’s water quality has markedly improved as upstream
communities have installed wastewater treatment plants, and direct discharges of
untreated effluent into surface waters have been outlawed. Work remains to be done to

91
clean the river, and prevent pollution from entering its waters. Attention is now being paid
to non-point sources of pollution, especially storm water runoff from developed property
and nutrient-loading from agricultural lands.
Currently, the Connecticut River as it flows past Norwich is considered Class B according to
state and federal water quality standards. Class B waters are managed for aesthetic values,
recreation on and in the water, public water supply with disinfection and filtration, high
quality habitat for aquatic plants and animals, irrigation and other agricultural uses.
The entire Town of Norwich is located in the Connecticut River watershed, which means
that all runoff and surface waters drain to the river. The town is divided into several sub-
basins as shown on Map 7. Most of town drains directly to the Connecticut River via Blood
Brook and its tributaries or several other small streams that flow directly to the
Connecticut. An area in the northeastern portion of town drains to the Ompompanoosuc
River, while areas to the west drain to the White River; both rivers are tributaries of the
Connecticut.
The Connecticut River Joint Commission includes New Hampshire’s Connecticut River
Valley Resource Commission, created by the legislature in 1987, and Vermont’s Connecticut
River Watershed Advisory Commission, similarly created in 1988. These commissions are
charged with cooperating in order to preserve and protect the resources of the Connecticut
River Valley, and to guide its growth and development. The commissions are advisory and
have no regulatory powers, preferring instead to advocate and ensure public involvement in
decisions that affect the river and its valley. The Upper Valley River Subcommittee
addresses local issues and concerns.
Ompompanoosuc River. The Ompompanoosuc River flows into the Connecticut River in
the northeastern corner of town. Only the final three miles of the river’s total 25-mile length
are in Norwich. The river is impounded by the Union Village Dam, which was completed in
1950 as part of a U.S. Army Corps of Engineers project for flood control. Segments of the
Ompompanoosuc River upstream of Norwich are on the state’s list of impaired waters. The
Elizabeth Mine, an abandoned copper mine in South Strafford approximately seven miles
upstream from the Union Village Dam, is leaching highly acidic runoff into the West Branch
of the Ompompanoosuc River from a 40-acre tailings pile. The site has been listed as a
federal Superfund site and awaits funding for cleanup. The region has a history of copper
mining, and several other sites are also likely leaching metallic compounds into the river.
Public Access. Today Norwich’s rivers and streams are used extensively by residents and
visitors for boating, swimming and fishing. No longer corridors for commerce and industry,
waterways are being rediscovered as recreational, scenic and natural resources. The
railroad line from White River Junction to Wells River, built in the mid-1880s, limits access
to the Connecticut River, yet has also protected the shoreline.
There are only two public water access points in Norwich: a small site north of the Ledyard
Bridge on River Road owned by the town, and another belonging to the Vermont
Department of Fish and Wildlife on the Ompompanoosuc. A state-owned primitive canoe

92
campsite, accessible from the river, provides for low-impact recreation. A spot for public
swimming on the Ompompanoosuc River or Connecticut River does not exist in Norwich,
though potential sites exist. Currently, there are no incentives to landowners to create
greenways along the rivers.
The Montshire Museum of Science owns more than 2,000 feet of Connecticut River
shoreline property, including land on both sides of the railroad right-of-way. The
Montshire’s property includes an inlet, the lagoon, where Blood Brook enters the
Connecticut – a favorite spot for shoreline birds and other animals, as well as recreational
boaters. The Montshire’s web of trails includes one along part of the shoreline. Its private
canoe access in the lagoon and its shoreline trail are open to visitors of the museum.
Small Streams. In addition to the two main rivers, there are a number of smaller streams
and brooks in Norwich, as shown on Map 7. The largest of these is Blood Brook, which
arises on the slopes of Gile Mountain in the northernmost corner of the town and empties
into the Connecticut River near the southernmost corner, running almost the entire
diagonal length of the town. Its two largest tributaries are the Charles Brown Brook from
the northwest and the New Boston Brook from the north-northeast. A smaller branch, Bragg
Brook, joins near the south end of town. Dothan, Podunk, Tigertown and Mitchell brooks
flow southward toward the White River. Avery Brook flows into the Ompompanoosuc River
from northeast Norwich through Thetford.
All of these brooks have beautiful, clear tumbling water and are recreational resources, to
walk alongside or fish. They support wildlife and provide natural corridors that facilitate
travel for many species. They also contribute to the recharge of groundwater supplies, but
they are not regularly tested. The quality of water in the town’s brooks and streams needs
to remain high to support these uses.
Lakes and Ponds. Norwich has one large kettle-hole pond, Star Lake, within its boundary.
A portion of the constructed Norford Lake crosses Norwich’s boundary from Thetford.
There are a number of small ponds supported and controlled by beavers, two of which are
ponds at the headwaters of Avery Brook and Mitchell Brook. Other small ponds are
associated with larger wetland complexes and many are a result of beaver activity along the
town’s many brooks.
While beavers sometimes cause flooding that can damage the built environment and
working timber stands, overall they are generally beneficial to the natural environment. The
consequences of beaver dams are very important for stream ecosystems and the terrestrial
environments that surround them. New plant clusters develop on the flooded shorelines
and the process of restoring natural rich vegetation that can support a diverse mix of
species develops within the transition zones (or ecotones) that form along the edges of the
newly-created beaver ponds. Shallow, warmer water creates the conditions needed for the
creation of wetland vegetation and a swampy transition zone forms between the water and
the land.
Beaver ponds can help improve water quality and reduce downstream sedimentation. The
93
fine sediments and organic substances that fall on the bottom create a perfect substratum
for the development of aquatic vegetation. Thanks to the development of vegetation, the
streambed is stabilized and the newly-created complex not only catches the sediments, but
also acts like a filter and a container of sediments flowing in from the surrounding
ecosystems. Due to the accumulation of organic substances, water micro-organisms flourish
and aid in the decomposition of pollutants. Beaver ponds also increase the storage capacity
within a drainage basin, reducing flooding during spring snow melt and storm events.
Water flow is slowed, reducing the potential for erosion and downstream sedimentation.
Riparian Buffers. The maintenance and enhancement of shoreline vegetation is the
simplest and most effective means of protecting the many benefits and values associated
with surface waters. Maintaining or planting naturally growing woody vegetation alongside
surface waters is essential to the health of streams and lakes.
Appropriate buffer width is related to stream bank slope and the purpose of the buffer. A
25- to 50-foot buffer may increase stream bank stability and remove sediment on level land
and moderate slopes. Greater width would be needed on steeper slopes or where sediment
loads are particularly high. In addition to filtering pollutants, a 100-foot buffer will provide
food, cover and breeding habitat for many kinds of wildlife. Buffers of several hundred feet
are necessary to provide habitat and corridors for some species.
Appropriately, vegetated shorelines contribute to maintenance of water quality and
shoreline protection in the following ways:
Provide bank support and stabilization;
Help prevent bank undercutting and bank collapse;
Provide food and shelter for fish and wildlife, and corridors for wildlife movement;
Intercept, absorb, and filter out pollutants such as silt, fertilizers, toxic chemicals, and
livestock wastes;
Keep water temperatures cool during hot summer months when fish are susceptible
to heat stress;
Slow surface water runoff;
Increase wildlife diversity;
Reduce flood and ice damage to stream channels, and adjacent lands and
structures; and
Preserve natural character of waters.
Wetlands
Marshes along rivers and streams, swamps, and bogs in woods, areas that are more or less
regularly soggy or inundated, are wetlands. Historically, wetlands have been considered a
nuisance to be eliminated, but they are now understood to be essential not only for the
survival of many species of plants and animals, but also for maintaining the health, safety,
and welfare of the general public. These fragile resources protect drinking water supplies
by filtering out pollutants and by helping to recharge aquifers. Wetlands minimize flood
damage by temporarily absorbing and storing floodwaters. They also present significant

94
development constraints associated with poor drainage and high water tables.
The importance of wetlands has been recognized both in national and Vermont legislation
in recent years. Thus, those that remain and are of a size and/or quality to fulfill the
functions mentioned before are protected. These wetlands, Class I of national significance
and Class II of statewide significance, comprise less than five percent of the state’s land area.
The Vermont Water Resources Division has estimated that more than half the state’s
wetlands have been lost to development or drained for agricultural use.
There are approximately 345 acres of wetlands in Norwich included in the National
Wetlands Inventory, which are protected by the 1990 Vermont Wetland Rules as Class II
wetlands and the state’s regulations requiring a 50-foot buffer between development and
Class II wetlands. Some of the town’s major wetland complexes are located in the brook
valleys and along the shore of the Connecticut River. The largest wetland in town is an
approximately 65-acre area along New Boston Brook.
The Conservation Commission has updated the state’s inventory of wetlands in Norwich. In
the summer of 1993, two consultants mapped new information from 1992 infrared aerial
photos taken by the state and 1992 data on wetland-related soils from the Natural Resource
Conservation Service. Some of the potential wetlands were field-checked. These new
inventories can be used to help prioritize wetlands, in terms of their significance for public
education, to facilitate planning decisions, and to encourage their protection. The
Conservation Commission’s inventory includes approximately 625 acres of wetlands. Both
the state and town’s wetland inventories are available digitally as a layer of the Norwich
Geographic Information System (GIS). As with other mapped data, site assessments are
needed to accurately delineate wetlands on any given property.
The state is just beginning a process to update its wetland mapping. It is likely that some of
the wetlands not currently shown on the state map will be added as new Class II wetlands.
Where appropriate, Class II wetlands may warrant re-designation as Class I (of national
significance) so that they will be afforded greater protection. Conversely, some wetlands
currently included in the National Wetlands Inventory may not be significant enough and
should be reassigned to Class III.
Vernal Pools
Vernal pools are small wetlands characterized by a lack of woody vegetation resulting from
the persistence of standing water for a portion of the year. They typically occur in small
depressions in upland forests or less frequently in forested swamps. Vernal pools generally
lack inlets and outlets, and collect water mainly from precipitation and snow melt. The
pools are shaded by the surrounding forest canopy and so can retain moisture well beyond
“mud season.” Depending on the amount of precipitation in a given year, a vernal pool may
be dry or still have standing water by mid-summer.
Vernal pools provide important breeding habitat for amphibians such as salamanders and
frogs. In order to support those species the pools need to retain their water during the late-

95
spring/early-summer breeding season. The pools are highly productive ecosystems that
provide a rich source of food for a wide variety of species.
Their small size and temporary nature make vernal pools difficult to inventory and protect.
Construction of roads, timber harvesting and other development in upland forests around
vernal pools can negatively affect the pools and the species that depend on them.
A partial inventory of vernal pools, mapped by the Norwich Conservation Commission in
2006 using infrared aerial maps, is in the Norwich GIS and is shown on Map 8.
Floodplains
As shown on Map 7, floodplains have been identified along the town’s rivers and streams.
Mapped floodplains include those areas that have a one percent chance of flooding in a year.
These areas temporarily carry and retain bank overflow from spring runoff and heavy
storms, and are vital to the health of the river and the safety of the community. Increased
development and shifting weather patterns have resulted in a number of serious flood
events around Vermont in recent years, pointing to the need to re-examine the flood hazard
maps prepared by the Federal Emergency Management Agency (FEMA). This process is
currently underway in Vermont.
The Federal Emergency Management Agency’s (FEMA) Flood Insurance Rate Maps (FIRMs)
show the floodplain that FEMA has determined would be covered by water during the “100-
year flood,” which is a storm event that has a 1% likelihood of occurring in any given year
and which is refered to as the base flood. This area of inundation is called the Special Flood
Hazard Area (SFHA). FIRMs may also show expected base flood elevations (BFEs) and
floodways (smaller areas that carry more current).
There are approximately 50 homes and a small number of non-residential structures
currently located within the mapped special flood hazard area in Norwich. None of the
town’s critical facilities (ex., fire station) are located in floodplains and there are no
repetitive loss properties in Norwich as identified by FEMA.
Norwich has adopted flood hazard area regulations to limit development within flood
hazard areas, as required for municipal participation in the federal flood insurance
program. These regulations are intended to protect life and property, and to allow property
owners to obtain flood insurance and mortgages at relatively affordable rates. The town
needs to continue strictly restricting development within its floodplains to protect public
health and safety.
FIRMS are only prepared for larger streams and rivers. Recent studies have shown that a
significant portion of flood damage in Vermont occurs outside of the FEMA mapped areas
along smaller upland streams, as well as along road drainage systems. Since FEMA maps are
only concerned with inundation, and these other areas are at risk from flash flooding and
erosion, these areas are often not recognized as being flood-prone. Property owners in such
areas outside of SFHAs are not required to have flood insurance. Flash flooding along
96
smaller streams can be extremely erosive, causing damage to road infrastructure and to
topographic features including stream beds and the sides of hills and mountains, and
creating landslide risk.
Fluvial ErosionRiver Corridors
In addition to the risks associated with inundation, there is the related hazard posed by
storm-swollen streams and rivers, which may unexpectedly jump their banks and cut new
channels. Due largely to human influences, many stream and river channels are no longer
stable, especially in upland areas. Their instability creates an erosion hazard during major
storms, which as noted elsewhere in the plan, are becoming more common as a result of
climate change. Fluvial erosion hazards are often in locations that are unlikely to be
inundated with flood waters and are therefore not protected through existing regulations
that limit development in floodplains. Eroding stream banks are also a significant source of
sediment and polluting nutrients entering major rivers and lakes, which decreases water
quality.
The Vermont Agency of Natural Resources has developed river corridor maps that show the
areas subject to erosion. In these areas, the lateral movement of the river and the associated
erosion is a greater threat than inundation by floodwaters. As with the FEMA FIRMs, the
smaller streams have not been mapped and a default 50-foot corridor of concern is defined
from the top of bank of these streams. There are approximately 15 homes currently located
with the state-mapped river corridor areas, outside the special flood hazard area, in
Norwich.
Fluvial geomorphology seeks to explain the physics of flowing water, soils and land use in
relation to various land forms. It analyzes physical, chemical, biological and land use data to
explain the historic causes of the problems currently being experienced in stream corridors
in an attempt to resolve or avoid conflicts between fluvial systems and the built
environment. A geomorphic assessment is currently underway on Blood Brook in Norwich
and the town is considering limiting development within identified fluvial erosion hazard
areas in a manner similar to current regulations within flood hazard areas.
The Blood Brook Watershed Corridor Plan of March 2008 is the result of a three-phase
study by the Norwich Conservation Commission, the Two-Rivers Ottauquechee Regional
Commission, and the Vermont Agency of Natural Resources, Department of Environmental
Conservation, River Management Program. The purpose of that plan is to assess the
underlying causes of channel instability and encourage the stream’s return to equilibrium
conditions. The plan outlines management efforts directed toward long-term solutions that
help curb escalating costs and minimize the danger posed or damage caused by storm-
swollen streams. Such efforts can help reduce flood and erosion hazards along the river
corridor, improve water quality and aquatic habitat, and enhance aesthetic and recreational

97
values of the stream.
Land Cover, Habitat and Wildlife
Forestland
Forest is the most common land cover type in Norwich accounting for nearly 22,000 acres
or approximately 76 percent of Norwich’s land. Forest resources provide a number of
benefits, including an economic return for local landowners, water quality, wildlife habitat,
recreation opportunities for town residents and visitors, and an important visual backdrop
to the town’s scenic views and vistas. Most of Norwich’s forestlands are in private
ownership, but remain in tracts 50 acres or larger. The largest single forest parcel is the 450
acres along the Appalachian Trail owned by the National Park Service. The Norwich Fire
District owns a 330-acre parcel off Beaver Meadow Road.
Forests are a permanently renewable resource if managed properly. Sound forest
management results in a stable economic return for landowners, local resources to support
local industry, and perhaps most importantly, an incentive for keeping large tracts of land
free of development and available to the public for recreation, wildlife and scenic
enjoyment. However, poor forest management can result in the degradation of biological
diversity and can damage scenic landscapes. Forest management can be accomplished in a
manner that does not create erosion or adversely impact scenic areas and wildlife.
Generally, a sound forest management plan should be based on a number of objectives,
including sustainable timber production, the protection of water quality, maintaining a
diversity of wildlife habitat, and aesthetic enhancement. Whatever the objectives of a forest
property owner, developing and implementing a forest management plan is the best means
of managing a forest parcel for long-term, sustainable forest production.
The majority of the town’s forest land is privately owned. While much of the private forest
is made up of large parcels associated with single-family residences, many undeveloped
parcels under forest management also exist. Of the privately owned forestland in town,
more than 11,000 acres are currently enrolled in the state’s current use program, and are
therefore managed in accordance with a forest management plan approved by the county
forester.
Wildlife
In addition to its 3,500 human residents, Norwich is home to a variety of animal species. To
survive, these animals require substantial acreage, preferably in large, solid blocks
interconnected by undisturbed corridors for seasonal movement. The preservation of a
diverse array of species requires more than protection of identified deer wintering areas or
bird nesting sites. Certain species such as black bear that require large contiguous habitat
areas, which also support a variety of other species, serve as indicators of the health and
diversity of local wildlife populations.
In Norwich, forested upland areas are home to bear, deer, bobcat, moose and coyote. The
Connecticut River and its tributaries support natural and stocked populations of brook,
98
brown and rainbow trout. The Connecticut River is also a major route for bird migration.
The marshes and other wetlands along the Connecticut River provide migrating songbirds
and raptors with food, water and shelter. Numerous species of waterfowl, including ducks,
egrets and blue herons, occur along the river. Non-game small mammals such as beavers
and otters that need continuous access to water abound along the river. Wetlands also
provide critical habitat for a variety of species such as mink, otter, beaver, black bear, grey
fox, moose, ducks, herons, other wading birds and shore birds and other species.
Special natural areas contribute to the quality of life in Norwich, promoting species
diversity, aesthetic enjoyment, recreation and education. Natural areas in Norwich include
orchid swamps, peat bogs, vernal pools, , fall-line gorges, estuaries and deer yards. Natural
areas can be identified and graded in order of their uniqueness or significance. Such an
assessment would provide direction for conservation efforts. Important natural areas can
be protected through purchase, through encouraging landowners to seek permanent
conservation protection, and through careful review of proposed development.
The main threat to wildlife habitat is fragmentation. Figure 11-3 illustrates the impacts of
land subdivision and fragmentation of large tracts of forestland on wildlife populations in
northern New England. The left-hand column identifies expected species in large tracts of
undeveloped forest, while each subsequent column depicts the species likely to be lost as
the land is subdivided into smaller parcels for scattered development.
In order to maintain habitat for animals that have large home ranges, such as bear, bobcat,
fisher, and moose, and other animals that are sensitive to human disturbance, such as wood
thrushes, larger blocks of forest or meadowland, or wetland habitat need to be conserved.
Blocks up to 20 acres are home to species typical of urban and suburban landscapes (e.g.,
raccoons, skunks, and squirrels). Moose, bald eagles, goshawks and similar species usually
require 500 to 2,500 acres, while blocks of more than 2,500 acres may hold the full
complement of species expected to occur in this region of Vermont.
Within Norwich, a number of large, unfragmented blocks of forest remain, including:
2,600 acres between Beaver Meadow and Turnpike Roads, which continues into the
Town of Sharon
2,000 acres south of Bragg Hill Road
1,500 acres between Upper Turnpike Road and New Boston Road
1,400 acres between Turnpike Road and Upper Turnpike Road, which continues into
the adjoining towns of Sharon, Strafford and Thetford
1,000 acres between New Boston Road and Bradley Hill Road
Maintaining contiguous forested lands within Norwich, as well as between Norwich and
neighboring towns, protects wildlife habitats found in core forests and provides corridors
that connect larger blocks of forest.
While many residents enjoy hunting, fishing, wildlife viewing and have extensive knowledge
of local wildlife and fisheries, the information has not been documented. Most of the town’s

99
important wildlife habitats have not been inventoried or mapped. The extent of
documented knowledge about wildlife habitat in Norwich is surprisingly limited, in part
because of the amount of fieldwork and mapping needed to document local populations. For
this reason, site-specific evaluations may be required to determine the potential impacts to
wildlife and important habitat associated with a particular subdivision or development
proposal.
Scenic Resources and Rural Character Norwich is appreciated by most of its residents as a quiet community for rural living.
Commercial development is limited to retail and service establishments on Main Street and
Route 5. The many small businesses and offices that residents operate from their homes
remain inconspicuous. The green in the center of Norwich village and the historic homes
along or near Main Street are a visual reminder of the community’s heritage. Abandoned
cellar-holes and granite posts mark former homesteads of the town’s founding families and
their descendants.
Norwich is no longer primarily an agricultural town, but retains a few moderately-sized
farms and much rural character. Open country and meandering roads that follow lively
brooks between forested slopes lead to small hamlets with names like Beaver Meadow,
Union Village, Pompanoosuc and Podunk. The Connecticut River with its tributary, the
Ompompanoosuc, open fields and remaining patches of pasture add to the variety and
beauty.
Yet, as the town’s landscape continues to change, residents recognize that Norwich’s rural
character is threatened. The views from the roads, fanning like fingers of a hand from
Norwich village, are changing as more homes are built, so that passersby are required to
look between houses to glimpse the view beyond. This section of the plan describes the
main elements of Norwich’s rural character – its agricultural and forest lands, brooks and
wetlands, wildlife and vulnerable habitats, scenic roads and vistas, historic buildings and
sites, views of the night sky and a quiet environment. Other elements, such as the traditional
village settlement pattern and clustered housing in relation to open space, are discussed in
other sections of the plan, but are equally important in a discussion of natural resources. In
order to preserve rural character, it is necessary to identify the elements of Norwich’s
natural and built environment that creates that character.
Scenic Resources
Long vistas across open farmland to the town’s upland forests to the west and across the
Connecticut River toward the White Mountains to the east create a landscape of great scenic
beauty in Norwich. A scenic area can be one with views of farmsteads surrounded by
pasture, of compact villages nestled among hills, and of arching trees over dirt roads. It can
also be views of mountain ridgelines seen across a level or gently rolling field. These areas
combine elements of contrast, reflect order and harmony, and contain intact patterns and
focal points. Scenic beauty is linked to the visual relationships between the built
environment, open farmland, mountains and rivers.

100
Norwich’s scenic beauty and rural character is heavily influenced by the patchwork pattern
of meadow and forest resulting from more than two centuries of farming. The beauty of the
agricultural landscape comes from the productive use of the land and its seasonally
changing colors, textures and patterns. Open lands are responsible for the wide and distant
views found along many of the town’s roads. Striking views that include forested mountains
in the distance with a foreground and middle-ground of rolling countryside can be seen
from many vantage points in town, and have nearly universal appeal as scenic resources.
Scenic Vistas and Roads. The Natural Resources Questionnaire circulated to Norwich
residents in 1988 brought out nominations for scenic areas from nearly all respondents and
included roads through most of the fall-line gorges that followed tumbling brooks through
unbroken forest; for instance, the Crooked Half-Mile, lower Bragg Hill Road and Tigertown
Road. Views considered the best were those from the top of Gile Mountain, upper Bragg Hill,
Bradley Hill, and along the Connecticut River. Special areas included the Village Green in fall
foliage season, the New Boston beaver ponds, the Norwich Grand Canyon, and the Van
Arman and Smith farms.
The 360-degree panorama from the fire tower atop Gile Mountain is one of the area’s most
extensive and accessible vistas. On a clear day, a half-hour walk offers views of both the
Green Mountains and White Mountains, along with much of the Connecticut River valley
stretching between the two.
A wider study of Norwich’s scenic resources needs to be undertaken. Scenic areas and roads
should be identified both for their value to the community and their sensitivity to
development. Then, Norwich can focus efforts to encourage private and public means for
their protection. (See Chapter 9 for a further discussion of scenic roads.)
Ridgelines. The scenic qualities of a forested ridgeline or hillside silhouetted against the
sky, can be compromised by poorly planned development, such as inappropriate building
placement, site design, material selection and excessive clearing. While they are some of the
most visually sensitive areas of town, Norwich’s hillsides and ridgelines are highly desired
locations because of the views they offer. It is possible to locate development in the town’s
uplands in a manner that preserves the scenic qualities of the landscape. Landowners
wanting a more open view in a forest setting can limb trees and selectively cut branches to
create view corridors rather than clear-cut a swath of trees. As described before, the town’s
hills and ridgelines have been identified as a critical component of its scenic character. The
town’s Ridgeline Protection Overlay district was designed to protect these fragile and
beautiful features of the town’s landscape.
Rural Character
Open Space. Compact village clusters surrounded by open space - all land that is not built
on - help define the character of Norwich as a New England town with roots deep in the
past. Open meadows, fields and woods contribute to the enjoyment of residents and visitors
alike as they walk or ride along the town’s roads and trails; they are an essential part of
Norwich’s scenic beauty. Farmlands preserve open stretches viewed from Interstate 91 and

101
Route 5, as well as closer to town and along Union Village Road. Other open lands are vital
parts of favorite areas, such as Bradley Hill Road and Bragg Hill Road. Farm fields and
pastures, which comprise less than 15 percent of the town’s land area, are critical to
retaining views, especially for travelers on the town’s roads.
Norwich is fortunate that it retains much of its open space. Currently, less than 10 percent
of the town’s land area has been developed, yet parcels are being continuously subdivided
and developed. Remaining areas should be identified and prioritized for possible protection.
Landowners can be encouraged to do this through conservation easements, development
plans that group or cluster houses together leaving the remaining land as preserved open
space, and estate planning that considers the future use of the land.
Agricultural Structures and Patterns. Historic farmhouses, barns and other agricultural
outbuildings are also essential components of the town’s rural character. They are an
architectural connection to the town’s history and heritage as a farming community. Other
visual reminders of the agricultural use of Norwich’s land are the stone walls and
hedgerows that define the edges of fields and meadows. They create a recognizable pattern
on the landscape that reinforces the town’s rural character. While farmsteads, fields and
pastures may pass from productive to residential use, the architectural elements and visual
patterns can provide a framework for appropriately locating and designing development so
that it fits into a rural environment. New uses can be found for obsolete farm structures,
giving them new life while maintaining their architectural integrity.
Lighting. The skies above and the views from and toward Norwich are appreciated at night
as well as day. The ability to enjoy a view of the night sky without the intrusion of artificial
lighting is another component of the town’s rural character. The ability to enjoy the night
sky can be reduced by excessive and unshielded lighting. Public safety and welfare require
adequate illumination in proper places, but excessive lighting may produce unsafe or
unpleasant conditions in which unshielded light glares into the eyes of drivers and into
houses. Excessive lighting also unnecessarily consumes energy.
Noise. Intrusive noise is out of character in a rural setting, where people expect a quiet
atmosphere interspersed with natural sounds like bird songs or flowing water. Traffic and
other sources of noise can diminish rural character.
Trails and Greenways Appalachian Trail. The Appalachian Trail, a 2,178-mile, continuous hiking trail from Mt.
Katahdin, Maine to Springer Mountain, Georgia travels more than five miles through
Norwich. The National Park Service owns 697 acres around the trail in Norwich. After
traversing about two miles by roadway from Ledyard Bridge via Main Street to the trail
entrance near the top of Elm Street, the trail generally follows the ridgelines that define the
southern part of the Blood Brook watershed. The Dartmouth Outing Club maintains this
segment of the trail.
The Appalachian Trail Conference and Upper Valley Land Trust worked to acquire and hold

102
conservation easements on abutting lands to create a buffer for the trail. In Norwich, 556
acres adjacent to the trail corridor have been conserved in addition to the lands owned by
the National Park Service. Altogether, this protected greenway corridor represents four
percent of Norwich’s land area.
This major open space corridor serves as a backbone of protected recreational land and has
been a driving force to develop an interconnected trail system throughout the town.
Connections currently exist from the Appalachian Trail to the following town trails and
roads: Cossingham Trail, Tucker Trail, Happy Hill Road, Burton Woods Road, Brown School
House Road, Ballard Trail, Gile Mountain Ridge Trail, Heyl Trail, Elm Street, Bragg Hill Road,
Hopson Road and the informal trail under the power transmission line.
Ecologically, the Appalachian Trail corridor provides habitat for a diverse array of plant and
animal species. It travels through a forested landscape with an understory of ferns and
wildflowers to emerge briefly for expansive views on its path from Elm Street over Bragg
Hill to the Jericho area and on into Hartford. The protected corridor is an excellent example
of the Northern Hardwood Forest natural community and the related Hemlock Northern
Hardwood Forest community. The area includes some important wetlands and an area of
mesic forest, which is home to a number of rare plant species.
Town Trails. Norwich’s trails and greenways provide a valued resource for citizens and
visitors. A favorite bicycle and jogging route travels along the Connecticut River on the
River Road and then extends north into Thetford. Another walking and jogging route for
residents and visitors alike makes a loop on Route 5 south and Hopson Road, taking
advantage of the open spaces of the Booth property and the Warner Meadow, both
protected with conservation easements donated to the Upper Valley Land Trust.
The Milton Frye Nature Area adjacent to the Marion Cross School is readily accessible to
school children and the general public close to the center of town. With interpretative stops,
it helps to educate classes of school children and others, as well as to provide a peaceful
respite. Trails owned by the town, leading to Gile Mountain (the highest peak in town) and
to the Schmidt Preserve with its showy lady slippers (a rare plant species), provide access
to other favorite spots in the fall and spring, respectively. Another resource, the Bill Ballard
Trail, follows the Charles Brown Brook down the length of the Fire District watershed land.
A trail created by the mutual efforts of the Montshire Museum and the conservation
commissions of Norwich and Hartford leads from the museum to Wilder Village. It and
other Montshire trails – one for finding wildflowers and one along the Connecticut River –
are valued assets.
Class 4 roads and numerous trails are used by hikers, bikers, horseback riders, cross-
country skiers and snowmobilers. Many are not identified on maps. Some roads and trails
could be interconnected to provide a continuous network, both in Norwich and adjoining
towns. Ways may be found to provide safe hiking and biking passage to the Huntley
Meadow from the center of town.

103
Trails in Norwich with permanent easements or on public land are mapped and included in
the Norwich GIS and are shown on Map 4. Opportunities to interconnect existing trails need
to be explored. Other corridors of open space need to be identified and landowners
encouraged to protect them, perhaps using the Appalachian Trail Corridor as a model and
creating links to it.
Historic and Cultural Resources Norwich’s wealth of historic and cultural resources is essential to its sense of place and
character. They are key elements of the town’s traditional settlement pattern, energy
sustainability, scenic resources and rural character, and economic sustainability.
Norwich’s iconic town center results from centuries of town settlement, construction, and
preservation of distinctive houses, public buildings, places of worship, and commercial
buildings. This town center is the focal point for the broader town made special by its rural
character and scenic resources.
Long-time residents have protected these qualities while more recent residents choose to
live in Norwich in part because of its sense of place and character. These qualities thus
contribute to Norwich’s strong property values and the viability of its town center.
Norwich’s historic resources range from undisturbed Native American sites to Civil War
letters; from historic buildings to portraits of those who owned them, and from 18th-century
account books to 20th-century photographs. The diversity of historical documents within
the town and in nearby repositories is staggering, but myth often replaces fact. Our
historical resources furnish the elements of truth often obscured in fanciful folklore. For
instance, Blood Brook is often described as the site of an Indian massacre. The closest
Native American conflict to Norwich was the raid on Royalton on October 16, 1780. Blood
Brook more likely received its name because of the tanneries located on its banks.
Norwich’s historical resources are recognized at the local, state and national levels. The
Norwich Village Historic District is listed in the National Register of Historic Places and
numerous historic structures are identified in the state’s historic register. Resources buried
in the earth, built on the landscape and preserved in town archives are used on a daily basis.
They are integral to, and help to define, the town’s unique sense of community through the
years.
Archaeological Resources
Native American Resources. Although few of the town’s archaeological sites have been
identified and fewer still studied, it is possible to predict, based on environmental
characteristics, where certain kinds of prehistoric Native American sites would be more
likely found. Results from archaeological investigations around Vermont in recent decades
suggest that prehistoric sites are typically located within 300 to 500 feet of an existing or
relict water source, on gently sloping land, or adequately drained soils with a southeast-
south-southwest exposure. These lands provided essential resources that attracted human
populations. People exploited these resources and left behind archaeological remains of

104
their activities at these locations.
In Norwich, the confluences of the town’s rivers and brooks on the rich alluvial plains
adjacent to the Connecticut River are known to harbor vestiges of civilizations that pre-date
colonial settlement by thousands of years. The Ompompanoosuc River (the Native
American name meaning ‘place of very white stones’) is associated with Native American
heritage. From Gile Mountain and Griggs Mountain to Brown Brook and Blood Brook, and
the Connecticut River, all have the potential for revealing evidence of Native American
activity. In 1994, a Marion Cross Elementary School student located a projectile point
during a casual walk on the Fire District land.
It is important to recognize and respect the importance of these ancient dwelling, hunting
and burial sites and not to disturb or pilfer them for curiosity’s sake. Casual ‘digs’ destroy
the ability of professional archaeologists to accurately date and study buried artifacts. The
Vermont Division for Historic Preservation should be contacted if a site is inadvertently
unearthed. Not every site is worthy of preservation, but an expert should be called to assess
the find.
Colonial Resources. Archaeology also tells us a lot about the colonists who came to settle
in what would become Norwich. As far as is known, none of the original houses built by the
earliest colonists – Jacob Fenton, the Hutchinsons or the Messengers – survive. Throughout
Vermont, examples of pre-Revolutionary War architecture are rare, as many buildings were
destroyed during the war. Archaeological research, coupled with information from primary
manuscripts, would likely locate the archaeological remains of the first town’s homesteads,
mills and other structures.
18th and 19th Century Resources. Excavations around the Marion Cross School during
construction of the 1993 addition unearthed cadet buttons, eating utensils, clay pipes and
ceramic plates used at Norwich University. A gnarled piece of iron found at the site
illustrates the heat of the fire that destroyed the south barracks in 1866, leading to the
university’s move to Northfield. Granite posts along the road and ripples in the land tell of
the rich manufacturing history of potash works, blacksmith shops, tanneries and orchards.
Near many of Norwich’s 18th- and 19th-century homes are ‘trash pits’ where domestic refuse
was dumped. With time, these textured soils become a buried record of lifestyle. Ceramic
bits found in these historic dumpsters document dishes imported from England, France and
China. In fact, potsherds (broken archaeological samples) recently found near the Norwich
Inn suggest that 19th-century dinners were served on fancy Chinese porcelain plates.
Although largely gone from the landscape, Norwich’s industrial history can be understood
through archaeology. For instance, the Pattersonville Chair Factory was located on the
Ompompanoosuc. While the factory was originally composed of more than nine buildings
including sawmills, warehouses and a company store, only two structures remain. Together
with photographic documentation and business records, the archaeological potential of the
site is rich. Lewiston village, once a thriving community with stores, homes, sawmill,
icehouse and railroad depot, was razed when the interstate ramps were built in the 1960s.

105
Three existing buildings, photographs, maps and concentrations of archaeological resources
document the history of this site.
Historic Resources
Material Culture. Material culture is an academic phrase for what can be described as
above-ground archaeology. The study of material culture focuses on structures and objects
like buildings, bridges, roads, domestic furnishings, tools and machines to better
understand history through the daily life of the time. It complements the traditional study of
history by linking the written word to the three-dimensional world. Norwich’s history, in
large part, can be understood by driving along Main Street, where impressive neoclassical
houses speak of an affluent, highly style-conscious community. Large, hipped roof houses
with connected barns and out-buildings along outlying roads tell of well-off farmers and a
complicated network of trade and commerce.
Historically, houses and outbuildings were built with convenience and practicality in mind.
Until recently, the latter (barns, wood sheds, stables, sugar and milk houses, chicken coops,
hog houses, etc.) were integral parts of domestic space in Norwich. Some of these structures
have been renovated and adapted to current needs. Others have fallen into disrepair,
eventually to become part of the archaeological record rather than visual landscape. In
addition to recording a way of life and use of resources, farmhouses, barns, outbuildings are
an essential component of the town’s rural character, as described elsewhere in this plan.
Primary Resources. The artifacts of Norwich’s history are diverse and plentiful. The
Norwich Historical Society seeks to “preserve and interpret items from Norwich’s past”
including textiles, ceramics, paintings and prints, maps, letters and photographs. Thus, there
is a repository for the safe-keeping of items found in homes, businesses, antique shops and
flea markets that directly relate to town history.
Records at the Town Clerk’s Office and at the county seats in Woodstock and Middlesex are
also invaluable resources for telling the complex story of Norwich’s settlement and
development. The Vermont Historical Society, Shelburne Museum, Bennington Museum,
Special Collections at Dartmouth College, and Norwich University archives are additional
repositories for historical resources. Family archives are another important resource. Many
Norwich homes house heirlooms in attics, cellars, closets and trunks. While the 18th and 19th
centuries intrigue us, Norwich’s 20th-century history is just as significant. It is perhaps the
century that has witnessed the most change in the town’s daily routines.
Architectural Resources. Norwich’s architectural heritage is one historic resource that is
unmatched in the Upper Valley. Norwich village (Main Street and adjacent side streets) was
placed on the National Register of Historic Places in 1991 because it retains its early scale
and architectural integrity. The Beaver Meadow Union Chapel was listed on the National
Register of Historic Places in 1995. The classification is honorific and does not place
restrictions or covenants on the buildings. Numerous buildings throughout town are also
listed on the state historic register.

106
Older Buildings and Energy Sustainability. Although retrofitting older buildings to
increase energy efficiency may be expensive, the actual cost in energy consumption of
demolition, disposing of the used materials, manufacturing and transporting new materials,
and construction will often make retrofitting of existing older buildings a more energy-
efficient and sustainable option. These factors should be considered when making decisions
regarding the fate of older and, more importantly, historic buildings that have become
functionally obsolete. In addition to these more direct costs, the embodied energy - energy
used to create the materials and construct the original building - will also be lost. Many of
the newer techniques for evaluating energy efficiency and sustainability in construction
take these factors into account. The retrofitting of older buildings may also qualify for many
tax credits, grants, and low interest loans created to support both historic preservation and
energy efficiency.
Goals, Objectives and Actions
Goal I Maintain and improve the quality of our air, water, wildlife and land resources.
Objective I.1 Maintain the high quality of the town’s air resources by discouraging uses
and practices that generate air pollution.
Action I.1.a Monitor local sources of air pollution.
Action I.1.b Promote use of efficient, less polluting technologies to heat buildings, especially non-polluting wood-burning practices.
Action I.1.c Consider the impacts of new development on traffic congestion that would result in increased air pollution, especially within Norwich village. Support efforts to raise weight limits to allow heavy trucks access to Interstate-91 rather than being required to travel on Route 5 through the village.
Action I.1.d Collaborate with neighboring communities and Advance Transit to provide mass transit services for Norwich residents as a means of reducing air pollutants from private vehicle emissions.
Action I.1.e Promote compact development patterns as a way to reduce air pollution by decreasing automobile dependence and increasing the feasibility of mass transit.
Action I.1.f Use the town’s zoning regulations to control dust from activities such as construction sites, and resource extraction and processing operations.
Objective I.2 Ensure the responsible use of gravel and sand resources to provide long-
term benefit to the town.
Action I.2.a Identify sand and gravel deposits, and conserve these limited resources for future uses.

107
Action I.2.b Use the town’s zoning regulations to require the use of appropriate techniques to minimize environmental impact of sand and gravel extraction and provide for reclamation of the land.
Action I.2.c Require all applicants for resource extraction operations to prepare, submit and implement erosion control, stormwater management and site restoration plans.
Action I.2.d Require all applicants for resource extraction operations to operate in a manner that avoids or minimizes impacts to natural, scenic and historic resources, public infrastructure and quality of life for nearby residents to the greatest extent feasible.
Action I.2.e Require adequate stormwater management and erosion control measures for stockpiled sand, gravel, soil, salt or other similar materials.
Action I.2.f Prohibit the stockpiling of sand, gravel, soil, salt or similar materials in areas adjacent to public water supplies, identified aquifers and surface waters.
Objective I.3 Encourage the preservation of prime agricultural soils and viable tracts of
productive farmland.
Action I.3.a Promote landowner participation in the state’s current use program.
Action I.3.b Explore other methods to reduce the property tax burden of maintaining viable tracts of productive farmland.
Action I.3.c Continue identification and evaluation of active and potential agricultural lands by methods such as the Land Evaluation and Site Assessment for Farmland (LESA) program.
Action I.3.d Use Norwich’s zoning and subdivision regulations to promote the conservation of farmland by permitting homes to be clustered while maintaining viable tracts of productive farmland.
Action I.3.e Require development to be located along the edges of fields or on the least productive land in order to preserve primary agricultural soils, allow for continued agricultural use and maintain the scenic character of Norwich’s rural landscape.
Action I.3.f Designate development envelopes on lots being created or newly built upon to ensure that buildings are sited to minimize impacts on agricultural soils and productive farmland.
Action I.3.g Require adjacent lots to share roads, drives and utility corridors whenever feasible to limit fragmentation of agricultural soils and productive farmland.
Action I.3.h Support the ability of current and future residents to grow food locally by promoting the conservation of agricultural soils, including pockets not large enough to support traditional farming operations.

108
Objective I.4 Maintain the town’s steep slopes in a manner that prevents erosion,
changes to natural drainage patterns and loss of scenic character.
Action I.4.a Use the town’s zoning and subdivision regulations to control development in areas characterized by shallow soils and/or steep slopes to reduce erosion and pollution potential.
Action I.4.b Review development on moderately steep slopes and prohibit development on severely steep slopes.
Action I.4.c Require the preparation and implementation of stormwater management and erosion control plans for development on steep slopes.
Action I.4.d Limit removal of woody vegetation on steep slopes.
Objective I.5 Protect the aquifers and groundwater that are the sources of Norwich’s
present and future drinking water supply.
Action I.5.a Identify and protect potential drinking water resources.
Action I.5.b Identify and map all public water supplies and known aquifers in Norwich.
Action I.5.c Re-evaluate the boundaries of the existing Aquifer Protection District.
Action I.5.d Regulate development to prevent contamination of public water supplies and known aquifers due to the on-site production, storage or disposal of potential pollutants or hazardous materials.
Action I.5.e Test groundwater in Norwich village to identify any pollution from septic systems.
Action I.5.f Develop contingency plans for supplying Norwich village with potable water in case of a disaster that contaminates the current drinking water supply.
Action I.5.g Develop plans to add a filtration plant to the existing water system that serves Norwich village should treatment become necessary due to pollution of the groundwater stored in the aquifer.
Objective I.6 Maintain and improve the water quality in the town’s brooks and rivers.
Action I.6.a Collaborate with neighboring Upper Valley communities in a regional effort to manage riverfront lands and improve the water quality of the Connecticut River.
Action I.6.b Participate in state, regional, federal and other efforts to protect the Connecticut River.
Action I.6.c Regulate development to prevent contamination of surface waters due to the on-site production, storage or disposal of potential pollutants or hazardous materials.

109
Action I.6.d Prohibit all discharges into rivers and brooks from failed septic systems, construction site erosion, stormwater run-off, agricultural run-off and other sources of pollution that would adversely affect water quality.
Action I.6.e Review development plans to assure adequate setbacks of buildings and septic systems to prevent erosion and pollution and minimize alteration of stream courses.
Action I.6.f Require the maintenance or establishment of vegetated riparian buffers along the town’s surface waters in order to filter stormwater runoff, prevent soil erosion, protect wildlife and fish habitat and maintain water quality.
Action I.6.g Promote the maintenance and planting of native woody plant species within riparian buffers by educating landowners about both appropriate native and inappropriate invasive trees and shrubs.
Action I.6.h Limit the maintenance or creation of expanses of lawn within riparian buffers in order to prevent erosion and maintain the natural condition and function of waterfront lands.
Action I.6.i Educate the owners of waterfront properties about the potential impact of household chemicals, de-icers, animal waste, and lawn and garden products and practices on water quality.
Objective I.7 Protect public safety and private property from flood hazards by
maintaining the natural functions of the town’s floodplains and stream
corridors.
Action I.7.a Continue to Participate participate in and meet the requirements of the National Flood Insurance Program so that owners within floodplains are eligible for flood insurance.
Action I.7.b Regulate development in order to prevent loss of life or property by prohibiting further significant development within identified floodways and floodplains.
Action I.7.c Review any proposed development, alteration of the natural grade or loss of pervious ground cover within identified floodways and floodplains in order to prevent restrictions to the flow of floodwaters or reductions in the natural ability of the land to absorb floodwaters.
Action I.7.d Complete geomorphic assessments on the town’s streams and implement measures to minimize loss of life or property due to fluvial erosion.
Action I.7.e Explore adoption of River Corridor regulations to limit development in areas prone to fluvial erosion hazards.
Action I.7.f Do not locate any municipal or critical facilities, other than water-dependent structures, within mapped flood hazard or river corridor areas

110
Objective I.8 Preserve the functions and prevent the loss of the town’s wetlands.
Action I.8.a Identify and assess the town’s wetlands.
Action I.8.b Complete the identification and mapping of Norwich’s wetlands.
Action I.8.c Petition the state to reclassify wetlands that the town considers of national importance to Class I status to ensure a higher level of protection.
Action I.8.d Maintain provisions in Norwich’s zoning and subdivision regulations to minimize the loss of wetlands to development.
Action I.8.e Educate landowners about the function and value of wetlands including their role in storing water during storm events and reducing the severity of downstream flooding.
Action I.8.f Require construction of compensatory flood storage if wetlands that provide flood storage will be lost or adversely affected by proposed development so as to achieve no net loss of the affected wetland’s flood storage function.
.
Objective I.9 Conserve significant wildlife habitats, especially the habitats of rare and
endangered species, protect core blocks of forest and maintain forest
connectivity between blocks.
Action I.9.a Define, identify, map and document Norwich’s significant wildlife and plant habitats.
Action I.9.b Map larger blocks of contiguous forest land and potential travel corridors between those blocks in Norwich and neighboring towns.
Action I.9.c Review subdivision and site plans to assess their effects on significant wildlife habitats in order to encourage their protection.
Action I.9.d Require new development to be located and configured in a manner that minimizes adverse impacts on critical wildlife habitat, including travel corridors, deer wintering areas and natural areas to the greatest extent feasible.
Action I.9.e Require buffers between new development and significant wildlife habitats.
Action I.9.f Use the town’s zoning and subdivision regulations to protect the habitats of rare and endangered species.
Action I.9.g Promote the protection of rare and endangered species, and their habitats, by the town’s landowners.
Objective I.10 Encourage the conservation of working forestlands and the use of
management practices that enhance forest health and long-term
productivity.

111
Action I.10.a Promote landowner participation in the state’s current use program for forestlands.
Action I.10.b Manage town forests and other forested public land in accordance with best practices in order to conserve and maintain them as a long-term resource.
Action I.10.c Require forestry practices that minimize erosion and damage to watercourses.
Goal J Identify, protect and preserve the important natural and historic features that create
Norwich’s scenic landscapes and community character.
Objective J.1 Protect the scenic beauty and rural character of Norwich’s forests, open
lands, shorelines and roads.
Action J.1.a Identify and prioritize scenic areas and roads in town.
Action J.1.b Develop and implement plans to protect and encourage protection of identified scenic areas and roads of highest priority.
Action J.1.c Require new development to be located and designed in a manner that minimizes its impacts on the town’s identified scenic resources.
Action J.1.d Designate development envelopes on lots being created or newly built upon where deemed necessary to ensure that buildings are sited to minimize impacts on identified scenic resources.
Action J.1.e Require the use of construction materials and colors for new construction in identified scenic areas that will result in structures blending into their surroundings.
Action J.1.f Limit the scale and height of new structures to be built in identified scenic areas so that new development will better fit into its surroundings.
Action J.1.g Require landscaping as needed to screen new development from view or blend it into the surrounding landscape.
Objective J.2 Preserve Norwich’s ridgelines in their natural state without visible
intrusions by development as an integral component of the town’s scenic
character as viewed from public lands and roads.
Action J.2.a Identify ridgelines and review proposed development on or adjacent to them in order to minimize impacts on the town’s scenic character.
Action J.2.b Limit clearing of existing vegetation on development sites.
Action J.2.c Limit the height and placement of new structures so that they remain below nearby ridgelines and the forest canopy.
112
Action J.2.d Require landscaping as needed to screen new development or blend it into the surrounding landscape.
Action J.2.e Require the use of construction materials and colors that will enable structures to blend into their surroundings.
Objective J.3 Preserve existing open space as a vital component of Norwich’s rural
character.
Action J.3.a Encourage landowners to keep their fields open and educate them about mowing practices that will not harm nesting birds.
Action J.3.b Identify and evaluate significant open space areas in Norwich that may warrant special protection.
Action J.3.c Develop and implement a plan to protect and encourage protection of open space of high priority utilizing landowner cooperation and by purchase, using the town’s Conservation Trust Fund and other private and public resources.
Action J.3.d Use Norwich’s zoning and subdivision regulations to promote cluster/open space development, so as to maintain a significant amount of open space.
Action J.3.e Require that subdivision and site plans respond to the existing landscape features and patterns that are components of rural character such as hedgerows, stone walls, open fields and the terrain.
Objective J.4 Protect Norwich’s residents from the intrusion of noise, light, traffic and
similar impacts at levels not characteristic of a rural environment.
Action J.4.a Regulate sources of loud or persistent noise such as aircraft overflights, vehicles that have removed exhaust noise suppression devices for greater power, vehicles and equipment with back-up alarms, and similar sources.
Action J.4.b Establish and enforce daytime and nighttime noise levels that preserve the quality of life enjoyed and expected by town residents.
Action J.4.c Regulate lighting, so that it may be reasonable for public safety, but ensure access to the day and night sky by minimizing intrusive light.
Action J.4.d Revise zoning and subdivision regulations to protect the environment from unnecessary, offensive and wasteful lighting, while providing such lighting as is reasonably necessary for public safety, and to ensure reasonable access to natural light and darkness.
Action J.4.e Revise zoning and subdivision regulations to require new development projects to show that lighting and construction will not impede access to natural light and darkness for neighboring units.

113
Objective J.5 Enhance public access to Norwich’s rivers, streams and natural areas via
an interconnected greenway system.
Action J.5.a Identify and map existing trails and greenways.
Action J.5.b Identify existing trails and Class 4 roads, and interconnect and maintain them for public use.
Action J.5.c Identify and map “unidentified corridors” as defined in the state’s Ancient Roads statute, and re-classify those that can be delineated to town highways or trails as appropriate based on the long-term interests of town residents.
Action J.5.d Identify potential trail corridors to link existing trails and greenways with each other and with trail systems in neighboring towns.
Action J.5.e Create public trails to access natural and scenic resource areas where feasible and appropriate.
Action J.5.f Schedule regular maintenance of town trails.
Objective J.6 Protect Norwich’s archaeological, historic and cultural resources in order
to preserve the community’s history, heritage, culture and character for
future generations.
Action J.6.a Establish criteria for identifying sites with potential archaeological value in Norwich.
Action J.6.b Require professional assessments of the potential of new development to impact archaeological resources when development is proposed on sites identified as archaeologically sensitive.
Action J.6.c Designate development envelopes on lots being created or newly built upon, where deemed necessary, to ensure that buildings are sited to minimize their impacts on archaeological resources.
Action J.6.d Support work conducted by the Norwich Historical Society.
Action J.6.e Establish criteria for identifying significant historical structures or sites in Norwich.
Action J.6.f Identify, designate, map and document Norwich’s significant historic sites or structures to encourage greater public recognition, enjoyment and protection of these resources.
Action J.6.g Identify any historic structures outside the town’s designated historic district or not included in the state’s inventory of historic resources.
Action J.6.h Seek designation on the National Register of Historic Places for other Norwich villages like Beaver Meadow and Union Village.
Action J.6.i Allow for the adaptive reuse, restoration or reconstruction of historic structures that may otherwise not conform to zoning standards such as setbacks and height limits.
Action J.6.j Review development plans prior to construction or demolition to prevent or minimize any adverse effects on significant historical sites or structures.

114
Action J.6.k Document details of structures slated for remodeling or demolition with photographs and reports.
Action J.6.l Require that subdivision and site plans respond to and incorporate existing historic structures and landscape features that speak to the town’s heritage, culture and character, such as cellar holes, stone walls and historic buildings including barns and agricultural outbuildings.
Action J.6.m Require that new development be designed to maintain the historic context of the site and its environs, and to minimize its impact on historic value, architectural integrity and views of identified historic structures nearby.
Objective J.7 Encourage and support the retrofitting of older buildings as a more energy
efficient and sustainable practice than demolition and rebuilding.
Action J.7.a Consider the total cost of energy use and sustainability when determining whether to retrofit an older building or demolish it and re-build. Energy costs may include demolition, disposing of the used materials, manufacturing and transporting new materials, and construction. The embodied energy costs- energy used to create the materials and construct the original building - may also be considered and include the energy used to create the materials and construct the original building.
Action J.7.b Provide information to owners of older and historic buildings about the many tax credits, grants, and low interest loans created to support both historic preservation and energy efficiency.

115
land use
More than two centuries have brought about many changes in Norwich’s landscape as it
has been transformed from a wilderness by settlers in the 1770s, to a rural town of
farms and villages, to a bedroom community for nearby employment centers. The
topography may be the same, but forests were cleared and allowed to grow again,
pastures were created and then disappeared, streams were dammed and undammed,
farmsteads were built and abandoned, and villages emerged.
This land use plan attempts to identify those features of the natural and working
landscape that should be preserved and to direct future land development in a manner
that respects the desire of the community to preserve its rural character and quality of
life while creating homes and employment opportunities for current residents and future
generations. The plan responds to our mutual needs and interdependencies as a
community while respecting the rights and concerns of individual citizens.
It must be recognized that Norwich’s landscape has never been and cannot be static
and that change can be both necessary and desirable. This land use plan describes
current land use patterns in Norwich, assesses recent land use trends and establishes
policies to direct future land use changes.
Norwich’s Land Use History Chapter 2 of this plan follows the transition of Norwich from a largely uninhabited
wilderness in the mid-1700s to the residential community it has become today. Most of the
land in Norwich has been through many changes since the original settlers arrived - first
cleared of trees, then grazed clean by sheep, then either allowed to revert to forest or
converted to pasture or hay field for dairy farms. Norwich is now 76 percent forested, and
farm fields and pastures account for only 14 percent of its land area.
For the most part, major land use changes in Norwich have been in response to economic
changes of a regional, national or global nature. Transportation has played a significant role
in these changes with the 1848 opening of the railroad that connected Norwich to markets
throughout the country and the building of Interstates 91 and 89 in the early 1970s that put
the entire Northeast within a day’s drive of Norwich. The effect of changes in transportation,
markets, and regulations on a regional, national and global level, and resulting changes in
our agricultural activity have had a dramatic impact on the working landscape.

116
Current Land Use in Norwich
Residential Land Uses
Over the past 50 years, Norwich’s pattern of residential development has changed from the
early compact settlements separated by open farmland to a linear spread of houses along
many of town’s major roads. Several large subdivisions with relatively small lots were
created in or near Norwich village before the enactment of state subdivision regulations in
1968. Through the 1970s, development continued to occur closer to Norwich village. In the
1980s, construction began spreading further out along Turnpike Road, Beaver Meadow
Road and New Boston Road.
Much of this later development has been in lots slightly larger than 10 acres due to the
exemption from state septic regulations for such parcels. The 10-acre exemption, created in
1968, had less impact after 1997 when the town on-site wastewater disposal regulations
were changed to match those of the state and was removed entirely by the state in 2002.
This 10-acre pattern created lots “too small to plow, but too big to mow”; that is not large
enough for economically viable agriculture or forestry, but larger than needed for a private
residence.
Active farms have been disappearing from Norwich since the mid-1900s and former
pastures or hay fields are now house lots or are reverting to woodland. A strong economy in
the Upper Valley, the excellent reputation of the school system, and the availability of land
drove residential development in the 1980s. The rate of growth has slowed in the 1990s
and 2000s, but the amount of open space being converted to residential lots continues to be
substantial as shown in Figure 12-2 and the average new house lot is approximately five
acres. (See Chapters 4 and 5 for a more detailed analysis of population and housing growth
in Norwich.)
Potentially, there is enough land for many times the number of houses now in Norwich
under current zoning even with substantial reduction of potential new lots in the rural
residential district due to density limitations adopted in the 2002 subdivision regulations.
However, there are constraints on residential development other than zoning, such as
limited septic disposal capacity, steep slopes, limited access, state and federal wetlands
rules, conservation easements, and private deed restrictions. Nevertheless, there is
potential for at least four or five times the number of houses now in Norwich to be built in
the future. Residential development could be accelerated by any or all of the following:
A strong regional economy.
Continued state adoption of new technology for on-site wastewater treatment or
introduction of a municipal wastewater system.
High taxes on undeveloped land forcing or encouraging owners to subdivide and sell.
Continued excellence of local schools relative to others in the region.
Less restrictive land use regulations.
As Norwich considers options regarding future growth, it should be mindful of the core

117
philosophy underlying our existing zoning system, which is, that, If if Norwich is to allow for
more houses without destroying the rural character and scenic beauty of the town,
development should be directed into areas suitable for that growth. To this end, Sspecific
areas of the town can that are easily accessible to good roads, town services, schools and
public transportation be have been designated for lower or higher densities of development
. while outlying areas of town without that accessibility have been designated for lower
densities of development., In outlying areas, new non-agricultural buildings are residential
structures can be grouped or “clustered” to preserve larger contiguous parcels for
agriculture, forestry or the protection of rural character and scenic beauty.
Demand for residential housing, high property taxes, and the poor economic return from
farming and forestry apply constant pressure for developing open land in Norwich. The
housing demand is mostly created by regional economic factors (see Chapter 5, Housing
Plan) but, as long as the town maintains its attractive rural character, good schools and
town services, this demand will most likely continue.
Commercial Land Uses
Commercial development in Norwich has remained primarily in the Village Business zoning
district and along the east side of Route 5 South in the Commercial/Industrial zoning
district. The limited commercial activity along River Road mostly consists of
“grandfathered” businesses that pre-date zoning. Although, at times, there has been demand
for more commercial space, availability has been limited by the lack of a municipal
wastewater system and the town’s Zoning Regulations. The Village Business District is
almost filled to capacity. The Commercial/Industrial District on Route 5 South has direct
access to the state highway and Interstate 91, but the area has been only partially developed
due to poor conditions for on-site wastewater disposal and the presence of Class II
wetlands. Future development will be limited by the conversion of 70 acres of open,
commercially-zoned land to athletic playing fields for the Dresden School District.
Home businesses exist throughout the town, but the visibility of many is low because zoning
regulations allow only one sign up to four square feet and no outside display of goods or
equipment. Many of these businesses have no signs at all.
Although at one time, additional commercial development in Norwich was considered by
some to have a positive effect on the property tax burden by increasing the value of the
Grand List without adding students to the school, Acts 60 and 68 changed Vermont’s school
funding formula and implemented a statewide system to redistribute education tax revenue
based on per pupil funding. Under the current education funding system, the argument can
no longer be made that commercial development will result in tax benefits for residential
property owners. The debate around school funding over the past two decades points out
that towns should not substitute tax policies for land use policies, as the tax structure may
change and yesterday’s “fiscal winner” may not remain as such.
Public and Privately Conserved Land
Approximately 11 percent of land in Norwich is either permanently protected from

118
development or controlled by the town/fire district, state or federal government. Additional
land may be protected by private deed restrictions; however, since these restrictions may
be removed in some cases by future owners or may not legally hold up over time, they do
not have the same force as conservation easements held by qualified organizations.
Working Lands and Open Space
For more than 50 years, working farms have been disappearing from the Norwich
landscape as the town has been transitioning from a primarily agricultural community to a
primarily residential community. However, it now appears that farms will not vanish
entirely from Norwich; over the past decade, there has been an increase in the number of
farms operating in town. The 2007 Agricultural Census counted 30 farms in the Norwich zip
code as compared to 21 in 1997.
Only one dairy farm remains in operation, but agriculture in Norwich is becoming
increasingly diversified. New farmers are turning to value-added, specialty and local food
products to make agriculture economically viable. The town’s farms raise sheep, beef cattle,
hogs and poultry, and grow fruits and vegetables, which are sold at roadside stands and
farmer’s markets to Upper Valley residents who want to eat more locally grown food. Rural
landowners continue to undertake other traditional activities like maple sugaring,
harvesting timber from managed woodlots, and extracting sand or gravel for sale to
supplement their income. Increasing numbers of Norwich residents keep horses on large
and small lots.
Several hundred acres of farmland have been conserved in Norwich, which ensures that
these lands will not be developed and will remain available for agricultural use. The best
way to protect Norwich’s working and open lands remains for agriculture and forestry to be
economically viable. While there is little local control over the economics of farming and
forestry, the town should support the alternatives to the traditional dairy farm that are
emerging - diversified agriculture, farm-based businesses, and local food and energy
production – as a way to protect working and open lands. Undeveloped land with
productive soils for agriculture or forestry has been inventoried and future development
should be planned so as not to destroy access to this irreplaceable resource.
In 2007, 129 parcels totaling 12,165 acres were enrolled in the state’s current-use program,
which is intended to reduce the property taxes paid by owners of working farms and
managed forest land. The landowner pays tax based on the value of the land for farming or
agriculture and the state reimburses the town the difference between what the landowner
pays and the full tax based on fair market value.
Despite the amount of residential development in Norwich over the past 50 years, there are
still many large parcels. The 2007 Grand List shows that 54 percent of the town’s total
acreage is in parcels of more than 50 acres (143 parcels) and that 32 percent is in parcels of
more than 100 acres (55 parcels). Further, there remains a significant amount of cleared
land in Norwich that is under-utilized, as many former farms have been divided into large
lots. Some owners of these residential lots grow hay for sale, primarily to keep the land

119
open, or brush-hog the pastures to keep growing hedgerows, juniper and pasture pines at
bay. Limiting further fragmentation of these larger landholdings would have a number of
benefits for the town including retaining a base of farm and forest land for future
generations and protecting the rural character valued by current residents.
Agricultural, forest, and open space land provide lower property tax receipts for the town
than developed land; however, they also require very little in town services as compared
with developed land. Agricultural, forest, and open space land does not provide children for
the school or put any cars on town roads. This financial benefit to the town is in addition to
the aesthetic benefits of living in a “rural” town. In most cases, when open space land is
developed for residential use, the additional new taxes do not cover the additional costs to
the town over time. (See Chapter 4 for a more detailed analysis of the costs versus benefits
of development.) Large developments in areas of town with limited access and facilities
could be very costly for all taxpayers in the future.
Future Land Use If Norwich is to protect its natural resources, preserve agricultural land, and maintain its
rural character and scenic beauty, development will need to become less haphazard and
more planned than it has been in recent decades. New economic forces have replaced those
that shaped the town before the 1960s. The value of land is no longer in agriculture and
logging, but in residential development. If left unregulated, residential development could
occur in every “nook and cranny” that modern technology can find access and sewage
disposal capability for, just as in the 19th-century, when the town was clear cut without
restrictions with timber and sheep as the economic engine.
Land Use Planning Areas
For the purpose of describing the desired future land use patterns in Norwich, the town has
been divided into land use planning areas as shown on Map 11. Their purpose is to describe
the future land use pattern and character desired in various parts of the town. The density,
scale and mix of land uses appropriate for each land use planning area are identified and
important land use issues are discussed below.
These areas are not intended to be regulatory, like zoning districts, and their boundaries are
generalized. A land use planning area may encompass several zoning districts or,
conversely, a single zoning district may include more than one land use planning area. The
descriptions that follow are a sketch plan of the town’s vision for its future. As with a
conceptual architectural drawing, a set of blueprints will need to be drafted to construct the
building. The town’s land use regulations and related implementation tools are the detailed
instructions that will ensure that the vision described in this land use plan is achieved over
time.
Village/Route 5 South and Adjacent Lands. This area includes Norwich village and
adjacent lands, as well as the Route 5 South corridor. These lands include the most densely
developed parts of town and are accessible from state and interstate highways. The town

120
should direct the majority of its growth and development to this land use planning area
through its land use regulations and the provision of water and/or sewer wastewater
infrastructure.
At the nucleus of this area is Norwich village - the historic center of the town. The village is
densely developed, compact, human-scaled, pedestrian-oriented and mixed-use. It has a
network of interconnected streets with sidewalks, street trees and buildings set close to the
frontages. The village business district accommodates mixed-use development, commercial
uses and civic spaces. Extending out from the downtown core are historic and more
recently constructed residential neighborhoods.
It is the intent of this plan that Norwich village:
Remain the heart of the community where civic buildings and uses are located.
Retain its architectural integrity through the preservation of historic buildings and the
compatible design of new structures.
Be pedestrian, rather than automobile, oriented by providing sidewalks and trail
connections, managing and calming traffic, and offering parking in a manner that
maintains the aesthetic character of this historic center.
To support a compact settlement pattern, lands adjacent to Norwich village should be
allowed to develop at higher densities than lands more distant from this center. Residential
neighborhoods near the village should provide sidewalks and trails that allow residents to
walk to school, shopping, services, transit stops and employment. Open spaces and parks
should be preserved to protect important resources and provide opportunities for outdoor
recreation and a connection to nature.
Due to limited building space, parking constraints and traffic congestion, the existing village
business district is most appropriate for businesses serving the needs of the community
rather than those primarily drawing customers from outside Norwich. Because of
transportation constraints and the desire to preserve the rural character of the town, the
most appropriate location for commercial development serving regional markets is east of
Route 5 South.
Designated Village Center – The Norwich Village Center (Village Center) includes the
Village Business Zoning District and additional area along Main Street north to the
Norwich Public Library on Hazen Street and south to the Norwich Historical Society and
Marion Cross School. (See Map #..). The Village Center is part of the Norwich Village
Historic District listed on the National Register of Historic Places. Approximately 23 of
the principal structures in the Village Center are listed as “contributing buildings” to the
Historic District. Uses include some residential properties, many Norwich businesses, the
town hall, police and fire station, public library, elementary school, Historical Society,
and Village Green. The Village Center was previously a Designated Village Center under
the Vermont Downtown Program but the designation could not be renewed due to a lack
of specific support in the 2011 Norwich Town Plan. The Norwich Village center meets

121
both the statutory definition of a Village Center and other state guidelines. The Village
Center designation will make various tax credits available to property owners for
improvements related to historic restoration, code compliance, and accessibility, and
provides the town with priority consideration for various state grant programs. The town
intends to reapply for the designation.
Route 5 South/River Road
The planning commission is presently considering whether to recommend the
creation of additional zoning districts that facilitate the development of mixed-
income housing and allow some level of commercial or mixed use activity on the west
side of Route 5 South and along River Road. These areas are served by state highways
and easily accessible to Interstate 91, schools, municipal services, and public
transportation. In 2014-2015, the town commissioned a report to review options for
this corridor and as of 2016, the planning commission was considering whether to
recommend a new zoning district and/or other changes to the zoning for this area.
The commission is presently considering how best to respond to and incorporate
public input. As the commission wishes to give further consideration to public input
as well as the nuances of this important topic, no decisions on this issue have yet been
made. Under state law, the creation of a new zoning district would require an
amendment to the town plan.
A significant restraint on higher density development in this area is the lack of wastewater
disposal capacity either on-siteinfrastrucure or via a municipal wastewater facility or other
alternative to individual on-site septic systems .. Due to poor soil conditions outside of the
existing village, the capacity of on-site systems is limited. A municipal wastewater facility
has been discussed and researched, but never built; this is possibly due to the cost, lack of
an existing health hazard, fear of too much development, or a combination of these
concerns. The 2005 Norwich Sewer Committee Report found that there was no immediate
public health emergency and that the future need for municipal or community wastewater
systems should be part of a long-term public town planning process. Alternatives to a new
municipal system include connections to wastewater treatment systems in Hanover or
Hartford, or smaller, decentralized community systems utilizing new technologies.
Hamlets. The re-creation of “outlying villages” or hamlets, either in the historic locations of
the original settlements or in new locations, would create a focus for more dense residential
development in specific locations. A hamlet is a small, compact cluster of homes, frequently
organized around a crossroads, civic building or public space. It may contain less than a
handful of residences or be large enough to support one or more small, neighborhood-
serving businesses.

122
The land use planning area map shows several potential hamlet locations in existing or
historic centers. Most commonly identified as potential hamlets are Beaver Meadow, Union
Village, Pompanoosuc, and New Boston, but all of these locations have some severe natural
resource limitations and may not be suitable. Other locations not currently developed may
be more suitable. Establishing a hamlet should be considered whenever plans are being
made to develop a large tract of outlying, rural land. Not all outlying lands are suited to
support this development pattern, but compared to low-density, scattered development; it
is a preferred alternative that can allow for growth while preserving rural character.
The creation of common cultural and recreational areas within these hamlets could create a
sense of a local community. The Town of Norwich has become large enough that some of the
advantages of a small community are at risk. Existing and new outlying hamlets could be
enhanced to generate smaller communities. Small parcels of common land would facilitate
this. Higher density in these areas could bring down the cost of housing, save open land and
provide common recreational facilities, create more active communities, and save on town
services. The outlying hamlets would foster community spirit in these areas and avoid strip
development without a focus. If outlying hamlets were large enough, consideration could be
given to allowing small neighborhood-serving commercial uses such as a general store,
convenience market or gas station. This would reduce the distance residents would have to
drive for basic goods and services, while also reducing the number of additional trips
through Norwich’s village center.
Valley. Roads and streams radiate out from Norwich village to the west, north, and parallel
to the Connecticut River to the east. These valleys contain level land suitable for
development, but also scarce farmland, wetlands, and scenic vistas of the working
landscape with hills in the background. Over the past several decades, the farm economy
and development pressure has made it difficult for landowners to keep agricultural lands in
productive use given the demand for and value of their property for residential
development. Norwich, however, desires to maintain the rural character of its valley lands
created through more than two centuries of productive use and retain a base of working
farm and forest land for future generations.
The town has recognized that it needs to be creative and consider innovative techniques to
achieve these goals. In order to preserve rural character while accommodating reasonable
amounts of growth, Norwich should promote use of cluster development on these valley
lands; clustering is a development technique that groups allowed development together on
smaller lots with a significant amount of the original parcel set aside as open space or
productive land.
Even well-planned development on rural lands often requires trade-offs. Is it better to
protect scenic views by placing new development within a wooded area or are homes on
open fields preferable to protect forested wildlife habitat? Are designs that place homes
located near existing roads to minimize the need for costly infrastructure superior to those
that place homes at the end of long access drives out of view of travelers on the public
roads? The complexity of rural planning is that there is no right or wrong that can be

123
applied town-wide. Each piece of land needs to be considered and assessed individually.
The town’s land use regulations should provide the flexibility to develop a rural parcel in
the manner best suited to that particular piece of land and location.
Commercial development in the rural areas should be limited to businesses that will have a
very low impact on town services or infrastructure and will not adversely affect rural
character and residential or agricultural use. The planning commission is currently
considering It may be desirable whether to create additional zoning districts allowing some
level of commercial activity along River Road and Route 5 North, which are reached by state
highways and easily accessible to Interstate 91. The level and type of commercial activity
should be compatible with existing residential uses and sensitive to natural resources in the
area such as the Connecticut River. Businesses oriented towards recreation or tourist
amenities may be the best fit for this part of town, as well as those on working farms where
operators need to expand upon traditional agricultural activities so their businesses can
remain economically viable.
Upland. Forested uplands dominate the western side of Norwich. Beyond the narrow
stream valleys that extend up into the hills from the lowlands along the Connecticut River
Valley, the terrain is steep and soils are shallow. Few roads bisect these areas with the
result being large, unbroken tracts of forestland. Their physical character, value as wildlife
habitat, fragile ecology and inaccessibility make these lands generally ill-suited for
development.
Low-density and low-impact development that has been carefully sited and designed may
be appropriate within the town’s upland areas. Impacts to be minimized include tree
clearing, disturbance of steep slopes, fragmentation of important wildlife habitat, and
increased stormwater runoff and/or decreased water quality in upland streams.
Recreational and forestry uses should be supported to the extent that they are undertaken
in a sustainable manner that protects environmental quality. Scenic resources, such as
views of prominent ridgelines and hillsides from public roads, may be protected by
directing development to less visible sites or maintaining an appropriate level of vegetative
screening.
Goals, Objectives and Actions
Goal K Maintain and enhance Norwich’s historic settlement pattern of compact village and
hamlet centers separated by rural countryside while accommodating growth at a
sustainable rate.
Objective K.1 Preserve and protect the town’s natural resources, scenic beauty and
rural character while managing growth in outlying areas.

124
Action K.1.a Develop and implement strategies to encourage higher density development around designated outlying hamlets and Planned Unit Developments (PUDs) balanced by conservation of open space.
Action K.1.b Allow for the creation of new, or the extension of historic, hamlets with smaller lot sizes, mixed residential and low impact commercial uses, and common areas for community use, which would be located based on existing roads, on-site wastewater disposal potential and interest of landowners.
Action K.1.c Promote, through incentives in land use regulations, the clustering of residential housing with the goal of preserving larger contiguous parcels for farming, forestry and the preservation of open space.
Action K.1.d Create incentives for clustering of residential housing and commercial developments in order to preserve natural resources and open lands.
Action K.1.e Support the use of conservation easements to preserve open space.
Action K.1.f Limit the allowed density for residences in rural areas where there is limited capacity for development.
Objective K.2 Direct new development to those locations best suited to accommodate it ,
particularly areas that are easily accessible to good roads, town services,
schools and public transportation.
.
Action K.2.a Develop guidelines and criteria to identify land that is physically capable of supporting development.
Action K.2.b Make inventories and maps of all protected natural resource areas readily available to all residents, landowners or their agents.
Action K.2.c Review the current zoning setbacks and protection zones for natural resource areas including wetlands, shorelines, and aquifers, and, if needed, establish new zones and setbacks.
Action K.2.d Maintain other protection areas such as steep slopes and ridgeline areas which may need additional evaluation on a site-specific basis prior to development. These areas should be clearly delineated on maps, and specific criteria and conditions for development should be established.
Action K.2.e Consider, as part of a long-term public town planning process, developing wastewater treatment for areas without adequate on-site, soil-based wastewater treatment capacity that are otherwise suitable for higher density development. Alternatives, subject of course to considerations of feasibility and cost-effectiveness, may include a new municipal system, connections to existing systems in neighboring towns, decentralized community systems, or use of new on-site treatment technologies.

125
Objective K.3 Limit commercial development through performance standards to a type,
scale and design that is compatible with the character of the town and the
neighborhood.
Action K.3.a Use performance standards to allow the type of commercial development appropriate for each of three categories: (a) Outlying neighborhood services; (b) Village businesses; (c) Regional commercial development.
Action K.3.b Re-evaluate performance standards on an ongoing basis to determine their effectiveness and make changes as needed.
Action K.3.c Support the ability of Norwich residents to work from home or operate businesses on their residential property to the extent that the activity is compatible with surrounding land uses and does not adversely impact neighbors’ quality of life.
Action K.3.d Allow for appropriate business/services needed in the community.
Action K.3.e Allow small businesses in outlying hamlets and PUDs, particularly those that primarily provide services to local residents.
Action K.3.f Create criteria and performance standards for commercial uses in the rural residential areas to allow low-impact uses that will not adversely affect residential and agricultural uses.
Action K.3.g Investigate the creation of additional commercial or mixed use districts on River Road, and Route 5 North that are compatible with existing residential uses and sensitive to natural resources in the area.
Action K.3.h Ensure that commercial development provides public spaces such as seating for public use, picnic tables, flower beds or a small park.
Objective K.4 Preserve and protect the character of Norwich village.
Action K.4.a Review the boundaries of the Village Business District and the nature of commercial development allowed in the district so as not to significantly exceed the current level.
Action K.4.b Encourage village businesses that are primarily intended to serve the needs of and enhance the vitality of the local community.
Action K.4.c Apply for state-designation as a Designated Village Center to recognize
the town’s efforts to maintain the vitality and livability of its historic village and to
provide priority consideration for state grants and other resources.
Objective K.5 Encourage and strengthen agricultural and forest industries.

126
Action K.5.a Promote use of sound forest and agricultural management practices.
Action K.5.b Evaluate, define, map and protect prime agricultural soils.
Action K.5.c Implement strategies to enhance the long-term viability of agricultural and forestlands.
Action K.5.d Support the viability of working farms through: (a) non-restrictive zoning for agriculture; (b) allowing commercial uses that help support the agricultural uses and/or preservation of land for agriculture; and (c) property tax relief at the town level.
Action K.5.e Allow for the manufacture and marketing of value-added agricultural and forest products.
Action K.5.f Promote the sale and consumption of locally grown food product.