Draft Advance Copy - UNCTADunctad.org/en/PublicationsLibrary/ditcted2013d8_en.pdf · ·...
101
UNITED NATIONS CONFERENCE ON TRADE AND DEVELOPMENT REGULATORY, TRADE AND DEVELOPMENT PERSPECTIVES Draft Advance Copy
Transcript of Draft Advance Copy - UNCTADunctad.org/en/PublicationsLibrary/ditcted2013d8_en.pdf · ·...
U N I T E D N AT I O N S C O N F E R E N C E O N T R A D E A N D D E V E L O P M E N T
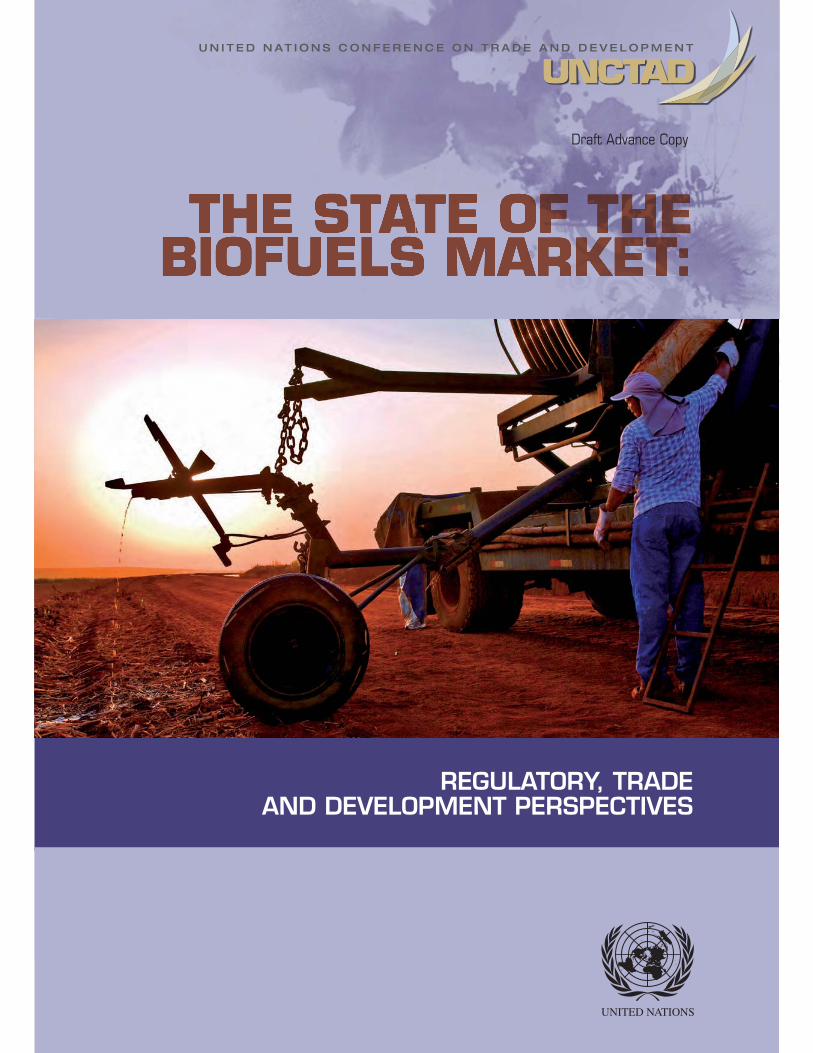
REGULATORY, TRADE AND DEVELOPMENT PERSPECTIVES
Draft Advance Copy
ii
NOTE
Symbols of the United Nations documents are composed of capital letters combined with figures. Mention of such a symbol indicates a reference to a United Nations document.
The designations employed and the presentation of the material in this publication do not imply the expression of any opinion whatsoever on the part of the Secretariat of the United Nations concerning the legal status of any country, territory, city or area, or of its authorities, or concerning the delimitation of its frontiers or boundaries.
Material in this publication may be freely quoted or reprinted, but acknowledgement is requested, together with a reference to the document number. A copy of the publication containing the quotation or reprint should be sent to the UNCTAD secretariat.
The views expressed in this publication are those of the author and do not necessarily reflect the views of the United Nations.
ACKNOWLEDGEMENTS
This study is a product of the Trade Environment, Climate Change and Sustainable Development Branch, DITC, UNCTAD and was prepared by Henrique Pacini, Alessandro Sanches-Pereira, Maria Durleva, Malick Kane and Arpit Bhutani within the framework of the activities of the UNCTAD BioFuels Initiative. This report
De
The authors wish to express their thanks to Bonapas Onguglo and Lucas Assunção Coordinators of the UNCTAD BioFuels Initiative and to contributors Rafael Perez Peña, Manuela Czinar, Tomas Lönnqvist, Victor Samuel, Bharadwaj Kummamuru Venkata, Harry de Gorter, Rob Vierhout, Geraldine Kutas, Alan Swinbank, Tetyana Payosova, Cheliza Ambas, Nick Goodall, Rodrigo Lima (Agroicone), Kenneth Light, Malena Sell, Patricia Guardabassi, Jonathan Hepburn, Rudinei Toneto and Christian Bomb for their inputs during the development of this report. Cover credits: Tadeu Fessel/UNICA.
Guillermo Valles Director
DITC
This draft text is not an official final version and is being circulated unedited.
UNCTAD/DITC/TED/2013/8 United Nations Publication
Copyright©United Nations, 2014 All rights reserved
iii
Executive Summary
This reports updates the initial study carried out by UNCTAD on the state of the biofuels markets, which was first published in 2006. In doing so, this 2013 update attempts to cover the main developments since 2006 in the biofuels sector, examining issues of production in key countries and regions, international trade, consumption trends, as well as evolving regulatory and political debates on this important theme.
During the 2000s there was an unprecedented increase in public and private interest for liquid biofuels, driven by a number of factors. Those included uncertainties about the price of petroleum products, the finite nature of fossil fuels, and ever growing environmental concerns, especially related to greenhouse gas emissions. It included also interest in novel ways to promote development and growth which could deliver
-carbon intensive sectors of the economy. Biofuels were discussed at one of the potential tools to allow a level of decoupling between development and environmental degradation.
While in 2006 the biofuel market was only starting to become truly international, by 2013 bioethanol and biodiesel have already become established commodities traded daily in all continents. Their market increased based primarily on demand from the transport sector, especially road vehicles, which use biofuels either in pure form or as blend into conventional fossil fuels (e.g. diesel or gasoline). Another important development, which occurred since 2006, was the emergence of alternative markets for liquid biofuels, beyond their core usage in road transport. Biofuels started being used in larger scale for aviation, electricity generation, cooking energy and even maritime transport. Policy focus of many countries also migrated from a limited scope of liquid biofuels towards broader notions of bioenergy (solid, liquid and gaseous energy products). In addition, concepts such as bioeconomy now embody a systemic view, in which systems must consider the usage of biomass not only for energy, but for food, feed and fiber as additional outputs.
Since 2006 several developed and developing countries have established (and continue to pursue) regulatory setups for biofuels, including blending targets, sustainability norms, as well as research and deployment strategies for advanced biofuel technologies which hold great promise of reducing social and environmental risks associated to their production and usage. While subsidies and incentives continue to be provided, biofuel industry as a whole seems to be more self-reliant in 2013 than it was in 2006. This is perhaps one of the factors behind a relative stabilization in demand for biofuels (and overall rate of growth in the industry) after 2010.
The emergence of better science around the issue of land use change associated to production and usage of biofuels brought doubts on the strength of 1st generation biofuels as a tool to mitigate greenhouse gases (GHG) emissions. Yet, the merits of biofuels have somehow shifted towards arguments about green jobs, energy security, and overall improvement of agricultural returns, which are in dire need in many developing and least developed countries.
The large increases in production, use, and international trade of biofuels which were seen after 2006 have contributed to mature the industry, giving it a professional standing in line with other major tradable commodities. Still, the basket of producing countries has not changed substantially since our first assessment was published in 2006. While in the policy front quick progress has been carried out by many countries, investments maintained the trend towards traditional producing areas that offer more predictable business landscapes for entrepreneurs.
A large potential remains to be exploited in the sustainable production of 1st generation biofuels in developing countries. Efficiency considerations continue to indicate that feedstock and biofuel production can be done most favorably in developing countries, where the climate to grow them and low-cost farm labor continue to exist. Energy security considerations, however, have prompted less-efficient countries to engage in biofuel production irrespective of economic and environmental considerations.
iv
Bioethanol and biodiesel continue to be the primary forces behind international biofuel markets. Developing and developed countries, particularly the United States (US), Brazil, the European Union (EU), China, Argentina and Malaysia have benefited from that dynamism by distinguishing themselves in the sector. In addition to biofuel trade flows between the EU, US and Brazil, South-South trade and transfer of technology are also taking place, especially as capacity flows albeit at a slow pace towards new production frontiers such as in many African countries. At the same time, there has been little international trade in bioethanol feedstocks, partially due to the non-tradable and perishable characteristics of some feedstocks (e.g. sugarcane), and to the dual role that some countries have as both producers of feedstock and consumers of biofuels (e.g. cereals-ethanol, sunflower-biodiesel in the US and in the EU). Biodiesel production outside of the EU has grown since 2006, but most imports in the region still take form of vegetable oil, from countries like Malaysia, Indonesia and Argentina. The 2nd generation of biofuels, which has started to be marketed at commercial levels in 2013, could change this panorama by allowing larger trade of feedstocks such as cellulosic and waste material, in line with practices adopted in the pellets and pulp & paper industries.
International trade in biofuels remains important to provide win-win opportunities to all countries, as several countries need the trade route as a way to guarantee the attainment of self-imposed blending targets. It has been noticed over the years that the successful cases of biofuel strategy implementation involved first the creation of domestic markets, with regional and international trade emerging from it. Export-oriented production models have not been the main trend adopted by the industry, as it became clear that reliance on fast-changing foreign regulations made risky the adoption of business models heavily reliant on exports. Instead of viewing export markets as primers for biofuel industries in developing countries, those have now the possibility to look for other sectors beyond transport such as cooking energy, electricity generation, and niche fuels such as aviation biodiesel as ways to start small, but in more solid ground.
While the market has grown more liberalized since 2006, biofuels still face tariffs and non-tariff measures. Brazil and the US both struck down their respective bioethanol import tariffs, primarily due to a mutual dependency to cover short-term demand needs from each other. The EU, on the other hand, maintained its applicable tariffs for bioethanol unchanged since 2006, but offered some waivers in the case of E85 (85 percent bioethanol blend with gasoline) imports by Sweden. While tariffs were somehow reduced, domestic subsidies continued to exist, and in some cases were strengthened such as in Brazil during 2012-13 as the country launched a plan to revitalize its bioethanol industry.
With a considerable increase in biofuels trade since 2006, sustainability certification became a new norm in the industry, as well as a prerequisite for market access. After intense debate on the formulation of sustainability regulations, certification, and labeling of biofuels and feedstocks, the sustainability criteria for biofuels has evolved mainly via voluntary schemes which adhere to legislation adopted in major markets (e.g. US and EU).
With the eyes towards the future, some specific challenges for developing countries include: (i) striking regulatory setups for bioenergy tailored to each country, which do not antagonize food and energy supply, but instead enhance agricultural productivity, rural income and worker's skills; (ii) design strategies to avoid the emergence of a technological gap between 1st generation (land-intensive) and 2nd generation (capital-intensive) biofuels; (iii) find ways to ensure that the cost of sustainability certification is spread along supply chains in a way that protects small farmers from undue cost burdens; (iv) promote a continuous inflow of private investment and production and process technologies to developing countries, especially through predictable business environments; (v) prioritize research and deployment of advanced technologies that can convert non-edible biomass into bioenergy products, doing so in cooperation with other countries to reduce costs; and (v) facilitate trade by engaging in consultations and adoption of sustainability practices which are compatible with major sustainability schemes adopted in the US, Brazil and the EU.

v
Conscious decisions, sharing of information and data collection, organizational strategies, government support services, technical and financial assistance will continue to be needed to guide developing countries towards the right decisions in this highly dynamic market.
UNCTAD, through its work on biofuels and renewable energy, is providing developing countries with access to economic and trade policy analysis, capacity-building activities, and consensus-building tools to help them address those and other challenges.
vi
Table of Contents
Executive Summary .................................................................................................................. iii List of Figures ......................................................................................................................... viii List of Tables ............................................................................................................................. ix List of Boxes ............................................................................................................................. ix Acronyms .................................................................................................................................. ix
Introduction ......................................................................................... 1
1 The present energy scenario ............................................................. 1
2 Biofuels in transport ........................................................................ 4 2.1 Usage in land transport ............................................................................................... 6
2.1.1 Technical and operational measures .................................................................................... 6 2.1.2 Alternative transport modes ................................................................................................. 6
2.2 Usage in aviation ......................................................................................................... 6 2.2.1 Technical and operational measures .................................................................................... 7 2.2.2 Alternative transport modes ................................................................................................. 7 2.2.3 Alternative fuels .................................................................................................................... 7
2.3 Usage in maritime transport ........................................................................................ 8 2.3.1 Technical and operational measures .................................................................................... 8 2.3.2 Alternative fuels .................................................................................................................... 8
3 Market and regulatory frameworks in selected developed and developing countries ......................................................... 9
3.1 United States ............................................................................................................... 9 3.2 The European Union .................................................................................................. 15
3.2.1 Sweden............................................................................................................................... 18 3.3 Brazil .......................................................................................................................... 21 3.4 Africa .......................................................................................................................... 23
3.4.1 South Africa ........................................................................................................................ 28 3.5 Paraguay .................................................................................................................... 30 3.6 Argentina ................................................................................................................... 32 3.7 Guatemala ................................................................................................................. 34 3.8 Mexico ....................................................................................................................... 35 3.9 China.......................................................................................................................... 38 3.10 India ........................................................................................................................... 39 3.11 The Philippines .......................................................................................................... 41 3.12 Thailand ..................................................................................................................... 43 3.13 Indonesia ................................................................................................................... 45 3.14 Other selected developing countries ........................................................................ 46
3.14.1 Malaysia .............................................................................................................................. 46 3.14.2 Colombia ............................................................................................................................ 47 3.14.3 Peru .................................................................................................................................... 48 3.14.4 Malawi ................................................................................................................................ 49 3.14.5 Mauritius ............................................................................................................................. 50 3.14.6 Bolivia ................................................................................................................................. 51
4 The technological dimension ........................................................... 51 4.1 First-generation biofuel technologies ........................................................................ 52 4.2 Second-generation biofuel technologies .................................................................. 52
5 Support measures ........................................................................ 55
6 Biofuels amid broader development challenges ................................... 58
vii
6.1 Development challenges in Africa ............................................................................. 58 6.2 Biofuels and the Clean Development Mechanism .................................................... 61 6.3 Risks .......................................................................................................................... 62
6.3.1 Land uses ........................................................................................................................... 62 6.3.2 Effects on food prices ......................................................................................................... 63 6.3.3
pr ............................................................................................ 64
6.3.4 Production Scales and Commercial availability .................................................................. 65 6.3.5 Access to energy technology ............................................................................................. 66
7 Trade flows for biofuels and related feedstocks .................................. 66 7.1 Global trends for biofuels and related feedstocks .................................................... 66 7.2 Triangular biofuel trade: Brazil, United States and European Union ........................ 67
7.2.1 Global import and export flows of biofuels ......................................................................... 70 7.2.2 EU Biofuel Import Tariffs and Prices ................................................................................... 71 7.2.3 African Countries with Duty-Free Access to the EU for Biofuel Exports ............................. 71
8 Recent developments and WTO implications ...................................... 72 8.1 Subsidies ................................................................................................................... 72 8.2 Environmental goods and services ........................................................................... 74 8.3 Sustainability certification.......................................................................................... 74
9 ty
................................................ 76
10 Conclusions ................................................................................. 77
References ....................................................................................... 80
viii
List of Figures
Figure 1: Estimated renewable energy share of global final energy consumption in 2011 ..... 2 Figure 2: Estimated use of biomass for cooking per world region in million m3 ....................... 3 Figure 3: US biofuel production and consumption in billion liters ........................................... 10
Figure 4: US Renewable Fuel Standard Mandates, by source .............................................. 13 Figure 5: US biofuel imports and exports volumes in billion liters ......................................... 14 Figure 6: EU biofuel production and consumption in billion liters ......................................... 17 Figure 7: EU biofuel imports and exports volumes in billion liters ......................................... 17 Figure 8: Swedish biofuel production and consumption in million liters ................................ 19 Figure 9: Swedish biofuel imports and exports volumes in million liters ............................... 20 Figure 10: Brazilian biofuel production and consumption in billion liters ............................... 22 Figure 11: Brazilian biofuel imports and exports volumes in billion liters .............................. 23 Figure 12: African biofuel production and consumption in million liters ................................ 24 Figure 13: African biofuel imports and exports volumes in million liters ................................ 25 Figure 14: Overview of the African cultivation of jatropha for the years 2008 and 2015 ....... 26 Figure 15: Paraguayan biofuel production and consumption in million liters ........................ 31 Figure 16: Argentinian biofuel production and consumption in billion liters .......................... 32 Figure 17: Argentinian biofuel imports and exports volumes in billion liters .......................... 33 Figure 18: Guatemalan bioethanol production and consumption in million liters .................. 34 Figure 19: Guatemalan fuel bioethanol exports volumes in million liters ............................... 35 Figure 20: Mexican bioethanol mandates from 2012 to 2016................................................ 36 Figure 21: Mexican bioethanol production in million liters ..................................................... 37 Figure 22: Mexican bioethanol imports and exports volumes in million liters ....................... 37 Figure 23: Chinese biofuel production and consumption in billion liters ............................... 38 Figure 24: Chinese biofuel imports and exports volumes in million liters .............................. 39 Figure 25: Indian overall bioethanol production and biofuel production and consumption .. 40 Figure 26: Indian bioethanol and biodiesel imports and exports volumes in million liters .... 41 Figure 27: Philippine biofuel production and consumption in million liters............................ 42 Figure 28: Philippine bioethanol import volumes in million liters ........................................... 43 Figure 29: Thai biofuel production and consumption in million liters ..................................... 44 Figure 30: Thai bioethanol export volumes in million liters .................................................... 44 Figure 31: Indonesian biofuel production and consumption in million liters .......................... 45 Figure 32: Indonesian biodiesel export volumes in billion liters ............................................. 46 Figure 33: Malaysian biodiesel production and consumption in million liters ........................ 47 Figure 34: Malaysian biodiesel traded volumes in million liters ............................................. 47 Figure 35: Colombian biofuel production and consumption in million liters .......................... 48 Figure 36: Peruvian biofuel production and consumption in million liters ............................. 48 Figure 37: Peruvian biofuel import and export volumes in million liters ................................. 49 gu
hanol production in million liters .................................................... 49 pr ................................................... 50
Figure 40: Price-formation of gasoline in Brazil and Sweden ................................................ 57 Figure 41: Fuel prices in Africa ............................................................................................... 59 Figure 42: Projected development of the world ethanol market ............................................ 67 Figure 43: Investments in renewable energy and oil prices evolution.................................... 68 Figure 44: Exported bioethanol volumes in billion liters among Brazil, the US, and the EU . 69 Figure 45: Brazilian bioethanol exports to the US .................................................................. 70
ix
List of Tables
Table 1: Biodiesel production ................................................................................................... 5 Table 2: Key legislation and regulation in the US ................................................................... 10 Table 3: The top 15 sugarcane producer countries in Africa based on 2010 volumes ......... 27 Table 4: South African research projects on biodiesel production ........................................ 30 Table 5: Important characteristics of support policies for biofuels ........................................ 56 Table 6: Policy tools (direct and indirect) often used to introduce bioethanol in in national contexts ............................................................................................................. 58 Table 7: Theoretical production potentials for selected African countries ............................. 60 Table 8: Studies examining the relationships between the prices of fuels and food commodities ....................................................................................................... 64 Table 9: New biofuel plants and the world biofuel production volumes from 2005 to 2011 . 68 Table 10: African countries with duty-free access to the EU ................................................. 72
List of Boxes
Box 1: Biofuel related trade regimes in the United States ....................................................... 1 Box 2: Biofuel related trade regimes in the European Union ................................................. 18 Box 3: Case example of the Mexican international cooperation on biofuels technology ...... 55 Box 4: Biofuels in Africa .......................................................................................................... 62
Acronyms
Amegas Mexican Association of Entrepreneurs Fuel Retailers AoA WTO Agreement on Agriculture ATM Air Traffic Management B2 2 percent biodiesel blend with diesel B5 5 percent biodiesel blend with diesel BAU Business As Usual Benelux Belgium, the Netherlands, and Luxemburg BID Inter-American Development Bank (BID) bnl Billion liters BTI Binding Tariff Information BTL Biomass to liquid fuel CAFTA US-Central America Free Trade Agreement CBI Caribbean Basin Initiative CDM Clean Development Mechanism CNPE Brazilian Council for Energy Policy CO Carbon monoxide CO2 Carbon dioxide Comtrade United Nations Commodity Trade Statistics Database E10 10 percent bioethanol blend with gasoline E15 15 percent bioethanol blend with gasoline E20 20 percent bioethanol blend with gasoline E85 85 percent bioethanol blend with gasoline E90 90 percent bioethanol blend with gasoline EBA Everything But Arms Regulation
x
EC European Commission EEDI Energy Efficiency Design Index EGS Environmental Goods and Services EISA2007 Energy Independence and Security Act of 2007 EPAs Economic Partnership Agreements ETS Emission Trade Schemes EU European Union FAME Fatty acid methyl esters FAO Food and Agriculture Organization of the United Nations GHG Greenhouse gases GMO Genetically Modified Organism Gt Gigatonne GTL Gas to liquid fuel ha Hectare HS Harmonized System HVO Hydrotreated Vegetable Oils ICRISAT International Crops Research Institute for the Semi-Arid Tropics IEA International Energy Agency ILUC Indirect Land Use Change IMO International Maritime Organization IPCC Intergovernmental Panel on Climate Change ISO International Organization for Standardization LCFS California Low Carbon Fuel Standard LDCs Least Developed Countries MARPOL International Convention for the Prevention of Pollution from Ships MDA Brazilian Ministry of Agrarian Development MFN Most Favored Nation MS Member States Mt Million tonnes NFIDCs Net Food-Importing Developing Countries NGOs Non-governmental organizations OECD Organization for Economic Co-operation and Development OPEC Organization of the Petroleum Exporting Countries ppm Parts per million PPP Public and Private Partnerships R&D Research & Development RIN Renewable Identification Number RFA United Kingdom Renewable Fuels Agency RFS First Renewable Fuels Standards RFS2 Second Renewable Fuels Standards RSB Roundtable on Sustainable Biomaterials RSPO Roundtable on sustainable Palm Oil SEEMP Ship Energy Efficiency Management Plan SENER Mexican Ministry of Energy SSA Sub-Saharan Africa SOX Sulphur oxides SVO Straight vegetable oil
xi
tmt Tonne-mile toe onnes of oil equivalent UNDESA United Nations Department of Economic and Social Affairs UNFCCC United Nations Framework Convention on Climate Change UNU United Nations University US United States of America USD US dollars US EPA US Environmental Protection Agency VEETC Volumetric Ethanol Excise Tax Credit VOCs Volatile organic compounds WTO World Trade Organization

Regulatory, Trade and Development Perspectives 1
1. Introduction
As the UN system gears towards the definition of the Sustainable Development Goals for the international community in the period post-2015, the linkages between energy and development lie high in international agendas. Governments, intergovernmental organizations, corporations, non-governmental organizations (NGOs) and even individuals are asking themselves a number of questions that are crucial for sustainable
role will renewable and alternative energies play? How can developing countries realize their right to development, and at the same time help in the fight against climate change? How do we accelerate improvements in energy conservation? How can developing countries best exploit the opportunities for diversification and new markets offered by the changing energy equation? Alternative energy sources, including biofuels, already have been forming part of the answers to these questions. While alternative energy sources grow faster than any other energy source, they still account for a very limited share of primary energy demand, therefore they are not expected to replace fossil fuels but to play a complementary role in satisfying the world energy demand.
Section 1 of this report presents the recent developments in the international energy scenario. Sections 2 and 3 address respectively the biofuels use in transport, as well as market and regulatory developments for biofuels in a number of developed and developing countries. Section 4 deals with the state of technological progress of the biofuel industry. Section 5 addresses the issue of support measures for the biofuels sector, followed by session 6 which cover the linkages between biofuels with broader development challeges in the world as of 2013. Sessions 7 and 8 examine trade flows of biofuels and related feedstocks, as well as recent developments and WTO implications.
The study focuses on the opportunities and issues faced by developing countries interested in this market, in terms of diversifying energy sources and reducing dependence on fossil fuels, mitigating climate change effects, increasing markets for agriculture products and enhancing the participation of rural communities in economic activities. While utilization levels increased many fold since 2006, biofuels still raise concerns and this prompted a regulatory push for 2nd generation fuels, which started being deployed in 2013. The actual and potential challenges and opportunities, especially for developing countries, are analyzed. Section 7 presents some data on trade flows for biofuels and related feedstocks among the US, EU and Brazil. Section 8 deals with some specific World Trade Organization (WTO) issues which may have direct implications for biofuels. The last two sections of the study illustrate UNCTAD´s activities under its BioFuels Initiative.
2. The present energy scenario
The global economy depends to a large extent on energy derived from fossil carbon sources, mainly oil, coal and increasingly natural gas. In 2012, around 31 billion barrels of oil were produced, which corresponds to an increase of 2 percent (International Energy Agency, 2013a; BP, 2013). Fossil fuel resources are finite, but not yet near to exhaustion. It is estimated that 970 billion barrels of oil have been consumed so far, while around 1 669 billion barrels at the end of 2012 are still to be extracted, which should take not more than 35 years at the current rate of production. An additional crucial problem is oil production capacity, which may peak in the next 5 to 15 years before starting to decline (ASPO, 2006; BP, 2013).
The latest analysis of the International Energy Agency (IEA) indicates that a new global energy landscape is emerging guided by the resurgence in oil and gas productions resulting from upstream technologies that are unlocking unconventional resources (e.g. oil sands, shale gas, and deepwater productions). Global
2 The State of the Biofuels Market
primary energy demand is estimated to increase by 56 percent from 2010 through 2040 led mostly by emerging economies, where robust economic growth and expanding populations are accompanied by increased demand for energy (International Energy Agency, 2012a; US Energy Information Administration, 2013a).
The projected growth is, nevertheless, slower than growth over the past three decades, which ran at 2.1 percent per year. Fossil fuels will remain dominant, accounting for more than 75 percent of the projected increase in primary energy demand to 2040 (US Energy Information Administration, 2013a). Natural gas demand will grow fastest, but oil will still be the largest individual fuel source. Members of the Organization of the Petroleum Exporting Countries (OPEC), especially in the Middle East, will meet most of the demand growth. Though renewable forms of energy will expand rapidly, they start from a small base and cannot displace fossil fuels as the over-riding source of energy in this timescale (International Energy Agency, 2012a). In short, the global use of energy from all sources increases in the projection.
High energy prices aligned with concerns about the energy security and environmental consequences of GHG emissions lead a number of national governments to provide incentives fostering the development of
-growing source of energy. However, the world is still failing in transitioning from current global energy system to a more sustainable model (International Energy Agency, 2012a; US Energy Information Administration, 2013a).
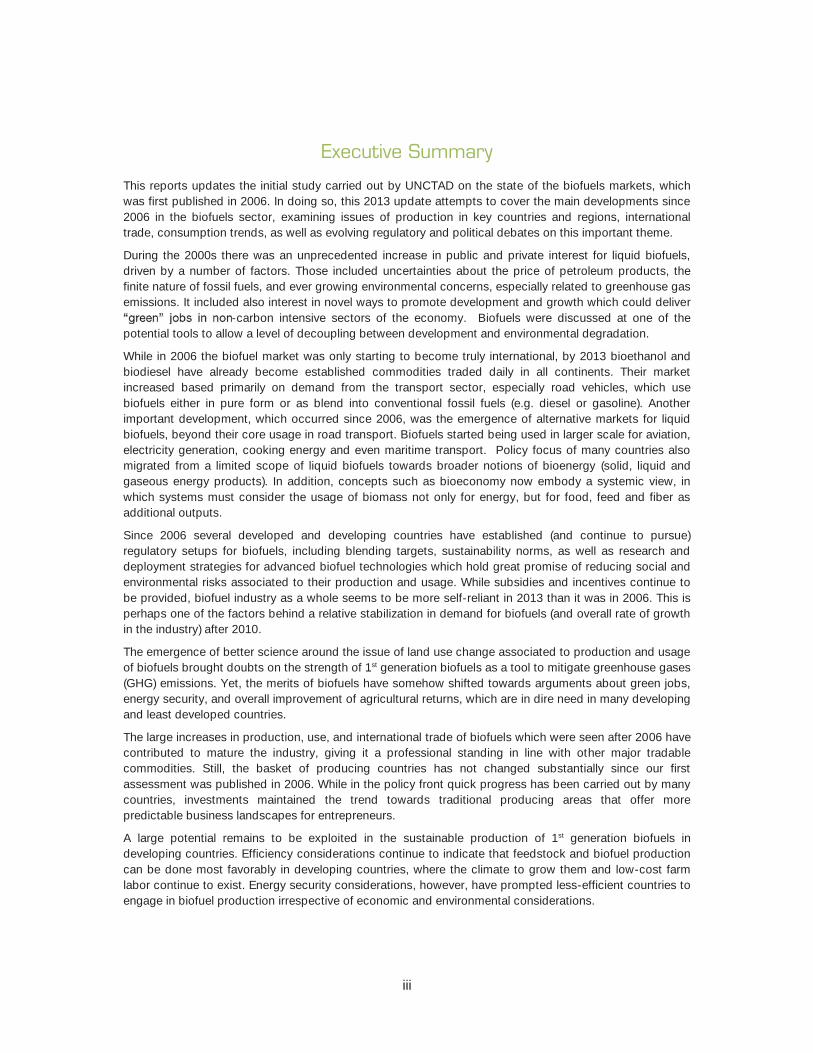
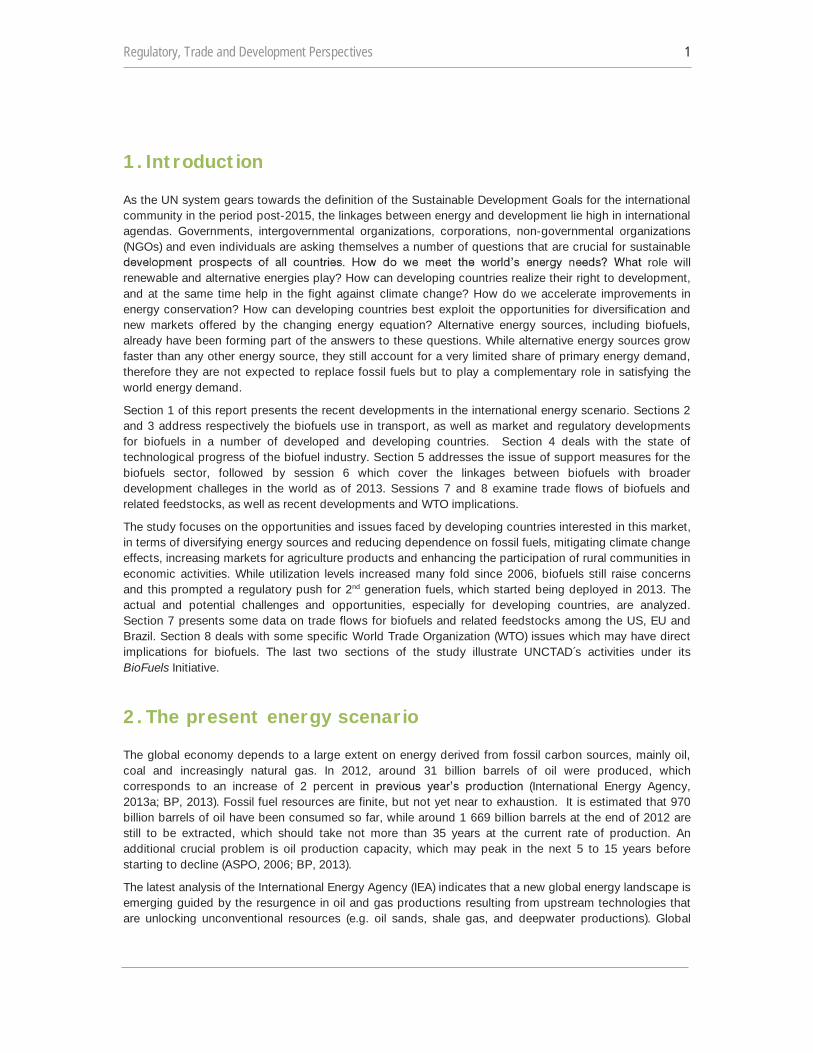
Figure 1: Estimated renewable energy share of global final energy consumption in 2011
Despite given expectations that oil prices will remain relatively high, fossil fuels will continue to supply
the largest sources of energy. In fact, oil is one of the slowest-growing energy sources. Its share of the total final consumption declines from 41 percent in 2010 to 28 percent in 2040 (International Energy Agency, 2013a; BP, 2013; US Energy Information Administration, 2013a).
Oil continues to dominate the fuel mix of developed countries. Yet, its consumption increases only in the industrial and transportation sectors while declining in the buildings and electric power sectors (US Energy Information Administration, 2013a). The fall in oil consumption was particularly strong in manufacturing and electricity generation as a result of both fuel switching and a strong decline in energy use per unit of output. In contrast, the transport sector continues to increase the use of liquids and it is assumed to keep on increasing by 1.1 percent per year from 2010 to 2040. As a result, it would account for 63 percent of the total projected net increment in liquid fuel use in the period (US Energy Information Administration, 2013a).

Regulatory, Trade and Development Perspectives 3
The decline in oil demand in stationary sectors was sufficient to offset the growth in transport oil demand at first, so that in 2001 oil demand levels in the Organization for Economic Co-operation and Development
s countries were comparable to those in 1973. At the global level, however, oil demand reached 86 million barrels per day in 2012 from 56 million barrels per day in 1973, due to increased consumption in non-OECD countries (BP, 2013).
Fossil fuels have provided the world with a means for transportation, lighting, heating, cooking, manufacturing and information. They have greatly contributed to overall development, economic growth, employment and communication. They have, however, also had high environmental costs. According to some estimates, carbon dioxide (CO2) levels in the atmosphere are were 394 parts per million (ppm) in 2012, 31 percent higher than the highest levels registered during the last 400 000 years with proven adverse climate impacts and associated social and economic costs. If current government policies do not change, energy-related emissions of CO2 would reach almost 950 ppm by 2050, which is far above of the required 450 ppm so as to have a chance of stabilizing the climate at a 2 °C global average temperature increase (International Energy Agency, 2012a). Therefore, irrespective of the supply-demand situation, continued utilization of fossil fuels is, and will increasingly become, a source of atmospheric carbon concentrations. This will be unsustainable from an environmental and economic point of view.
Most agree that the energy challenge of this century providing the affordable energy needed to achieve, expand, and sustain prosperity for all while avoiding intolerable environmental disruption cannot be met without a huge increase in the global energy-innovation effort. While it would be unrealistic to think that new energy sources could solve all the energy problems that countries face at present, their development may contribute to alleviating climate change-related problems and lessening the dependence of energy-importing countries on fossil fuels. Today, an inhabitant in the United States consumes on average 7 tonnes of oil equivalent (toe) a year, an European consumes 3.4 toe with the same standards of living, a Chinese consumes 1.8 toe a year, and a Indian or a Kenyan about 0.6 toe each (World Bank, 2013). As a result, exploring the potentialities of alternative energy sources would thus be suitable in economic, environmental, strategic and political terms. In addition, efforts should be deployed to achieve a more sustainable path of energy consumption through efficiency gains and demand-side management.
Figure 2: Estimated use of biomass for cooking per world region in million m3
In this context, the global demand for renewable energy continued to rise during, despite policy uncertainty and declining support in some key markets. Renewable energy supplied an estimated 19 percent of global final energy consumption by the end of 2011, from which approximately 9.3 percent came from traditional biomass used primarily for cooking and heating in rural areas of developing countries. Modern renewable accounted to the remaining 9.7 percent, of which heat energy accounted for
4 The State of the Biofuels Market
an estimated 4.1 percent of total final energy use, hydropower made up about 3.7 percent, 1.9 percent was provided by power from wind, solar, geothermal, and biomass, and finally biofuels with 0.8 percent (REN21, 2013). Figure 1 illustrates the estimated the global final energy consumption.
Worldwide, roughly 1.3 billion people continue to lack access to electricity and 2.6 billion rely on traditional biomass stoves and open fires for cooking and heating. More than 99 percent of people without electricity live in developing regions, and four out of five of them are in rural South-East Asia and Sub-Saharan Africa (SSA) (REN21, 2013). Biomass sources for traditional bioenergy systems include fuel-wood and charcoal (wood-fuels), animal dung and crop residues. Figure 2 presents the estimated global use of biomass for cooking in million m3 (Smeets, et al., 2012).
A growing number of developing countries are transitioning to clean and sustainable cooking technologies and fuels, and away from the traditional practice of cooking over smoky open fires. Yet in SSA, more than
ants, still rely on traditional biomass for heating and cooking (REN21, 2013).
In this context, the need for rural energy in developing countries is, above all, a social and economic development matter around the world. Renewable energy technologies, combined with development police adapted to specific countries or regions, have proven to be both reliable and affordable means for achieving access to modern energy services (REN21, 2013; Gómez & Sanches-Pereira, 2013). Several projections indicate that traditional bioenergy systems will slowly be replaced by modern fuels as households become wealthier. When the income of households increases, they tend to move from low quality fuels to more convenient, cleaner and modern fuels. Recently, there has been an increasing attention on liquid and gaseous biofuels for cooking, such as biogas, bioethanol and alcohol-gel fuels. Several countries in Africa are currently producing bioethanol from sugarcane at significant scales, such as Malawi (Smeets, et al., 2012).
2.1.1.1. Biofuels in transport A biofuel is any fuel derived from biomass. Note, there is still no strict definition of biomass but, in this report, it is defined as the organic matter available on a renewable basis, such as forest and mill residues, agricultural crops and residues, wood and wood residues, animal wastes, livestock operation residues, aquatic plants, and the organic portion of urban wastes. The most suitable plants for energy production tend to be either those that grow fast and produce woody material that can be easily burned, such as willow, eucalyptus and miscanthus; plants that produce oil that is high in calorific value, such as soy, palm, sunflower, rapeseed and castor oils; or plants with a high content of sugar that can be fermented. This study will concentrate on bioethanol and biodiesel because they are the most widely used liquid biofuels.
Bioethanol is an alcohol produced by the biological fermentation of carbohydrates derived from plant material. Pure bioethanol (hydrated ethanol, which has usually about 5 percent water content) can only be used directly in cars especially designed to run it. Dehydrated (anhydrous) bioethanol, on the other hand, is used for blending with gasoline so as , which contains up to 25 percent of bioethanol. In this case, no engine modification is typically needed. In addition, bioethanol can be used as an octane-boosting, pollution-reducing additive in unleaded gasoline, thereby substituting for chemical additives such as MTBE. At present Brazil is the only country that uses bioethanol as both a 100 percent substitute for gasoline and a blend. In all other countries that utilize biofuels, bioethanol is blended with gasoline in different proportions. Bioethanol is also used as a solvent in industrial applications, while the oldest and most traditional use of alcohol is in making spirits or alcoholic beverages.
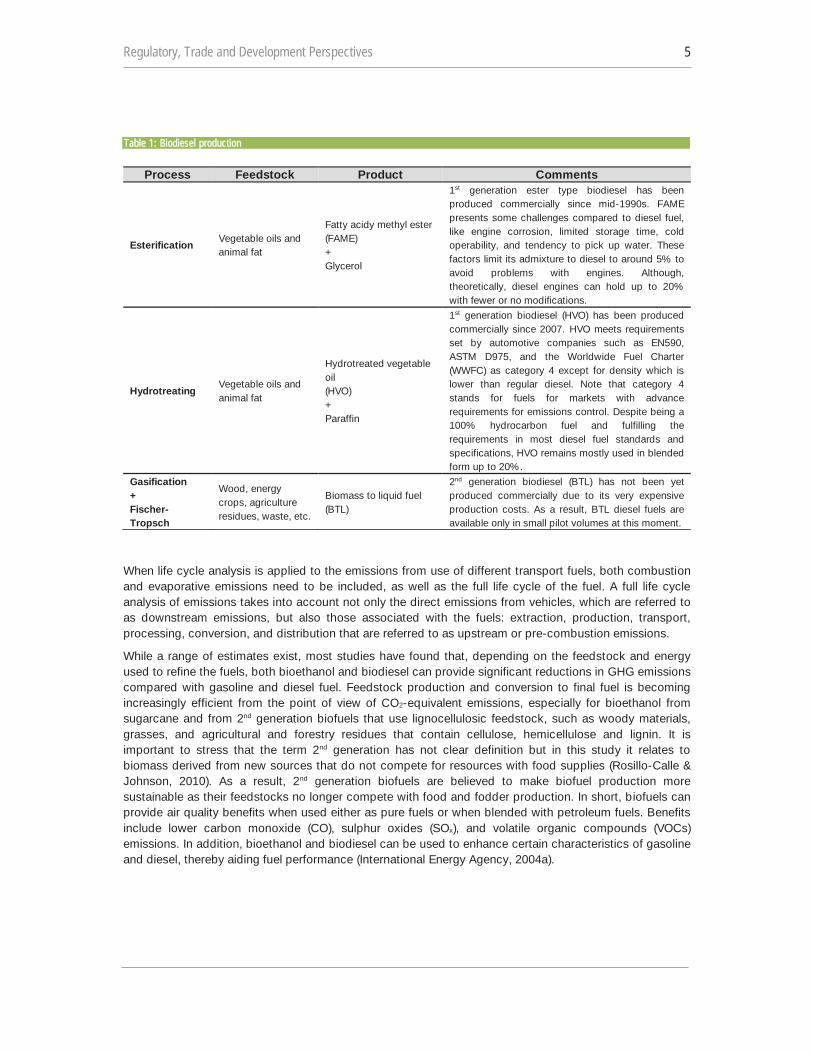
Biodiesel is a synthetic diesel-like fuel produced from vegetable oils, animal fats or recycled cooking grease. It can be used directly as fuel, which often requires some engine modifications, or blended with petroleum diesel and used in diesel engines with fewer or no modifications. Table 1 summarizes the biodiesel production processes (Kuronen, et al., 2007; Aatola, et al., 2008).
Regulatory, Trade and Development Perspectives 5
When life cycle analysis is applied to the emissions from use of different transport fuels, both combustion and evaporative emissions need to be included, as well as the full life cycle of the fuel. A full life cycle analysis of emissions takes into account not only the direct emissions from vehicles, which are referred to as downstream emissions, but also those associated with the fuels: extraction, production, transport, processing, conversion, and distribution that are referred to as upstream or pre-combustion emissions.
While a range of estimates exist, most studies have found that, depending on the feedstock and energy used to refine the fuels, both bioethanol and biodiesel can provide significant reductions in GHG emissions compared with gasoline and diesel fuel. Feedstock production and conversion to final fuel is becoming increasingly efficient from the point of view of CO2-equivalent emissions, especially for bioethanol from sugarcane and from 2nd generation biofuels that use lignocellulosic feedstock, such as woody materials, grasses, and agricultural and forestry residues that contain cellulose, hemicellulose and lignin. It is important to stress that the term 2nd generation has not clear definition but in this study it relates to biomass derived from new sources that do not compete for resources with food supplies (Rosillo-Calle & Johnson, 2010). As a result, 2nd generation biofuels are believed to make biofuel production more sustainable as their feedstocks no longer compete with food and fodder production. In short, biofuels can provide air quality benefits when used either as pure fuels or when blended with petroleum fuels. Benefits include lower carbon monoxide (CO), sulphur oxides (SOx), and volatile organic compounds (VOCs) emissions. In addition, bioethanol and biodiesel can be used to enhance certain characteristics of gasoline and diesel, thereby aiding fuel performance (International Energy Agency, 2004a).
Table 11: BBiodiesel production
Process Feedstock Product Comments
Esterification Vegetable oils and animal fat
Fatty acidy methyl ester (FAME) + Glycerol
1st generation ester type biodiesel has been produced commercially since mid-1990s. FAME presents some challenges compared to diesel fuel, like engine corrosion, limited storage time, cold operability, and tendency to pick up water. These factors limit its admixture to diesel to around 5% to avoid problems with engines. Although, theoretically, diesel engines can hold up to 20% with fewer or no modifications.
Hydrotreating Vegetable oils and animal fat
Hydrotreated vegetable oil (HVO) + Paraffin
1st generation biodiesel (HVO) has been produced commercially since 2007. HVO meets requirements set by automotive companies such as EN590, ASTM D975, and the Worldwide Fuel Charter (WWFC) as category 4 except for density which is lower than regular diesel. Note that category 4 stands for fuels for markets with advance requirements for emissions control. Despite being a 100% hydrocarbon fuel and fulfilling the requirements in most diesel fuel standards and specifications, HVO remains mostly used in blended form up to 20%.
Gasification + Fischer-Tropsch
Wood, energy crops, agriculture residues, waste, etc.
Biomass to liquid fuel (BTL)
2nd generation biodiesel (BTL) has not been yet produced commercially due to its very expensive production costs. As a result, BTL diesel fuels are available only in small pilot volumes at this moment.
6 The State of the Biofuels Market
2.2. Usage in land transport Land transport, road and rail transport, contributes to around 16 percent of global GHG emissions (International Energy Agency, 2012b). As a result, land transport especially road transport is by far the biggest emitter in the transport sector. Therefore, addressing its emissions is a natural starting point, which made road transport the frontrunner in biofuel use. On an energy basis, biofuels provide around 3 percent of total land transport fuel worldwide nowadays (International Energy Agency, 2013b).
2.2.1. Technical and operational measures At technical level, substantial improvements to on-road vehicles can be realized through known and existing technologies for engine, transmission, and driveline improvements, hybrid systems, lightweight materials, as well as better aerodynamics and rolling resistance (International Council on Clean Transportation, 2012).
At operational level, measures are related to mandatory fuel economy standards. Currently, standards for passenger vehicles are in effect for more than 70 percent of the global new light-duty vehicle market and they have a proven track record for achieving efficiency improvements. However, standards must be made continuously more stringent over time so as to secure overall reductions in fuel use and GHG emissions in the face of increasing vehicle travel. Well-designed fiscal policies can also boost standards benefits or even replace them in some cases by encouraging more efficient vehicle choices for passenger cars and more efficient use of the transportation system for freight. The reasoning behind is that common sense of consumers, especially commercial truck operators, would demand fuel-efficient vehicles to reduce transportation costs. In reality, consumers and manufacturers have been unwilling to invest in fuel economy technologies unless they have less than a one- to two-year payback from fuel savings. As a result, in the absence of a global framework, GHG regulations or incentives on land transport have varied from market to market depending largely on fuel pricing and income growth (International Council on Clean Transportation, 2012).
2.2.2. Alternative transport modes Better coordination and integration of different transport services will improve the attractiveness and convenience of public transport. For example, promoting the use of smart ticketing which allows passengers to move seamlessly between different modes. In addition, for urban mobility, promote low carbon transport options that also promote personal health and wellbeing such as cycling as a mainstream form of personal transport (UK Department of Energy and Climate Change, 2009).
2.3. Usage in aviation Over the past few decades, aviation has changed the way people travel and transport goods, which has led to consiemissions actually amounts to only 1.5 percent which is far less than the impact of other forms of transport. Foreseeable consequences of climate change, the globalization of markets and services, the rising demand for energy in the face of potential resources decline, and the drastically rising volumes of freight traffic have induced an increase in cost of aviation turbine fuel and emergence of stricter climate efficiency laws and market instruments such as Emission Trading System (ETS) within the sector (International Energy Agency, 2012a; United Nations, 2013a). Airlines are now looking not only for cheaper alternatives but also pursuing options to decarbonize air transport. Current viable options are by adoption of (i) technical and operational measures, (ii) alternative transport modes, and (iii) alternative fuels.
Regulatory, Trade and Development Perspectives 7
2.3.1. Technical and operational measures The current Air Traffic Management (ATM) system is already highly optimized. However, there is still room for developments on how to take advantage of existing aircraft capabilities to manage traffic in congested environments in a more fuel efficient manner (Boeing & CANSO, 2012).
These development procedures include reducing air traffic congestion by identifying where capacity and efficiency can still be improved, which demands a significant investment in airport infrastructure and long waiting periods for results. They could also take advantage of current aircraft equipage. Using composite materials to reduce the weight of the aircraft and improve jet engine efficiency are some of the ways aircrafts can be made more efficient. Yet, these development procedures could only be made possible by manufacturers through massive investment in time and resources. For instance, the first commercial aircraft using composite material Boeing 787 Dreamliner has taken several years in research and development and yet it is still grounded because of its complex design. Moreover, the worldwide ATM set the goal at fuel efficiency, which is estimated to be between 92 and 94 percent, to values between 95 to 98 percent by 2050 (Boeing & CANSO, 2012).
2.3.2. Alternative transport modes In specific cases, aviation competes with surface transport, such as inland territories. Hence, high-speed rail service or improving the existing rail infrastructure could provide alternative modes of transport to reduce GHG emissions (Matheys, et al., 2008). The downside is that high-speed transport between major cities requires new infrastructures and optimal operating conditions to accommodate such type of service. Therefore, fares prices may cost more than equivalent airline tickets and electricity for trains still has to be generated somehow, perhaps even with non-renewable sources.
2.3.3. Alternative fuels Since July 2011, biofuels were approved for use on commercial flights as a blend of up to 50 percent in jet fuels (ASTM Committee, 2011). As a result, there has been an increased use of biofuels in the aviation sector because this alternative does not require changing existing aviation infrastructures or developing new aviation technology. A number of major commercial airlines have already started using this alternative. KLM Royal Dutch Airlines , which is an admixture of kerosene and biofuel produced from used cooking oil, from Amsterdam to Paris with 171 passengers on board (KLM Royal Dutch Airlines, 2013). Nevertheless, alternative fuels in aviation sector have its own share of critics. In fact, there have been studies that diminish or criticize the role of biofuels in aviation sector. One example of such criticism is that biofuel use in order to be financially viable, its final cost has to be lower than conventional turbine fuels. Another point is whether biofuel use would be an effective instrument to reduce carbon emissions or airline companies would rather prefer cheaper options for reducing GHG emissions such as buying emission credits.
Although the inclusion of aviation in the European Union (EU) ETS has been restricted to flights within and between the 30 European countries, the future of biofuels in aviation looks hopeful (European Union, 2013). Especially because many airlines are setting voluntary goals to get at least 1 percent of their fuel demand supplied with biofuels by 2015. Some companies are even investing in partnerships for developing their own biofuel. For example, SkyNRG that is a joint venture of KLM Royal Dutch Airlines, North Sea Group and Spring Associates. British Airways is also working to accelerate the use of biofuels in the aviation industry through partnerships with Solena Fuels and Rolls Royce (KLM Royal Dutch Airlines, 2013; British Airways, 2013).
8 The State of the Biofuels Market
2.4. Usage in maritime transport Intercontinental trade of raw materials and products would not be possible without maritime transport. Currently, about 90 percent of the global trade is carried out by international shipping (International Maritime Organization, 2012). 2 emissions from fuel combustion shows that international maritime industry contributed with 2.1 percent of global CO2 emission, which is an increase of
contribution va (International Energy Agency, 2001; 2012b).
Even though there has been technological progress in the maritime sector to reduce the emissions, our estimate1 shows that, in a business as usual (BAU) scenario, CO2 emissions may grow by 30 percent by
(US Energy Information Administration, 2013a; International Energy Agency, 2012b). Given these figures, it is imperative to take immediate strategies to mitigate carbon dioxide emission potential of the world maritime fleet (International Transport Forum, 2009). The International Maritime Organization (IMO) is pursuing alternatives to decarbonize seaborne transport. Current viable options are by adoption of (i) technical and operational measures and (ii) alternative fuels.
2.4.1. Technical and operational measures From January 2013, the Energy Efficiency Design Index (EEDI) was made mandatory for all new ships from party members of the International Convention for the Prevention of Pollution from Ships (MARPOL). EEDI aims at promoting energy efficient and less polluting equipment and engines by requiring a minimum energy efficiency level per capacity mile or per tonne-mile2 (tmt) based on different sizes and type segments of the ships. Note that regulations are non-prescriptive, which means that ship designers and builders are free to use the most cost-efficient solution as long as required energy efficiency levels are attained (International Maritime Organization, 2011; 2013).
The new regulations also make mandatory a Ship Energy Efficiency Management Plan (SEEMP), which set guidelines to help energy savings depending upon ship type, cargo, route and other factors. For example, speed optimization and/or weather routing and hull maintenance (International Maritime Organization, 2011; 2013). This ship-specific plan being mandatory is encouraging the shipping industry to review its practices in a systematic way to find the most cost-efficient solutions for complying with the guidelines.
2.4.2. Alternative fuels In comparison to land borne transport modes, maritime and aviation industries are more dependent on crude oil than road and rail transport since they can run on electricity. However, seaborne transport can reduce carbon emissions by using cleaner fuels, which is the most practical option in the near future. For example, the use of biofuels in international shipping could benefit from existing distribution networks. Meaning, this option may not require a separate investment, especially as a blend into conventional fossil fuels. Another important reavariety of biomass feedstock.
The only cause of concern for the sector could be the cost of processing biomass into biofuels which could be more than the cost of bunker fuels. However, in the long term perspective, the biofuel industry has the potential to reach economies of scale. Hence, the future of biofuel use in maritime transport is very promising thanks to the increasing pressure on the sector to reduce its carbon footprints (International Maritime Organization, 2011).
Regulatory, Trade and Development Perspectives 9
3. Market and regulatory frameworks in selected developed and developing countries
World production of bioethanol from sugar cane, maize and sugar beet increased from less than 39 billion liters in 2006 to over 85 billion liters (bnl) in 2012 (Renewable Fuel Association, 2012). Despite strong growth of 7 percent in biodiesel production in the last couple of years, global volumes remained at roughly 15 bnl. This represents around 2.3 percent of global transport fuel demand in 2011. However, global
(e.g. European biodiesel sector), (ii) review of biregarding the amount of biofuel derived from food crops), and (iii) higher feedstock prices (International Energy Agency, 2013c).
oethanol producer and exporter. Its 16 bnl production represented about 36 percent of the world total and US was the second largest producer with 15 bnl. China and India were distant third and fourth producers at 9 and 4 percent respectively (Oxford Analytica, 2006). In that same year, biodiesel accounted for less than 0.2 percent of the diesel consumed for transport.
stagnated in developing countries mainly due to the supply reduction in Brazil. In 2012, the US production represented about 59 percent of the world total (OECD/Food and Agriculture Organization of the United Nations, 2013a; US Energy Information Administration, 2013b). Global bioethanol production is projected
three major producers are expected to remain the US, Brazil and the EU with 48, 28, and 7 percent respectively. Biodiesel production has recovered from a strong production decline in 2011 and did increase slightly beyond the trend of previous years with most of the growth taking place in Brazil, Indonesia, Thailand and Malaysia. Global biodiesel production is estimated to reach 41 bnl in 2022 and the UE is expected to be by far the major producer with 45 percent, followed by the US and Brazil with 15 and 8 percent in that order (OECD/Food and Agriculture Organization of the United Nations, 2013a).
The cost of large-scale production of bio-based products is currently high in developed countries. Estimated production costs, as reported by biofuel producers, range between $0.203 and $1.38 per liter (Solecki, et al., 2012). Conversely, in Brazil and other developing countries, the costs of producing biofuels are much lower than in the OECD countries and very near to the world market price of petroleum fuel. For example, the current cost of production of bioethanol is about $0.18 per liter in Brazil, between $0.28 and $0.46 per liter in China, and about $0.44 per liter in India, roughly comparable to the pre-tax prices of gasoline and diesel in these countries. Biodiesel production, on the other hand, ranges between $0.70 and $1.00 per liter (Timilsina & Shrestha, 2011).
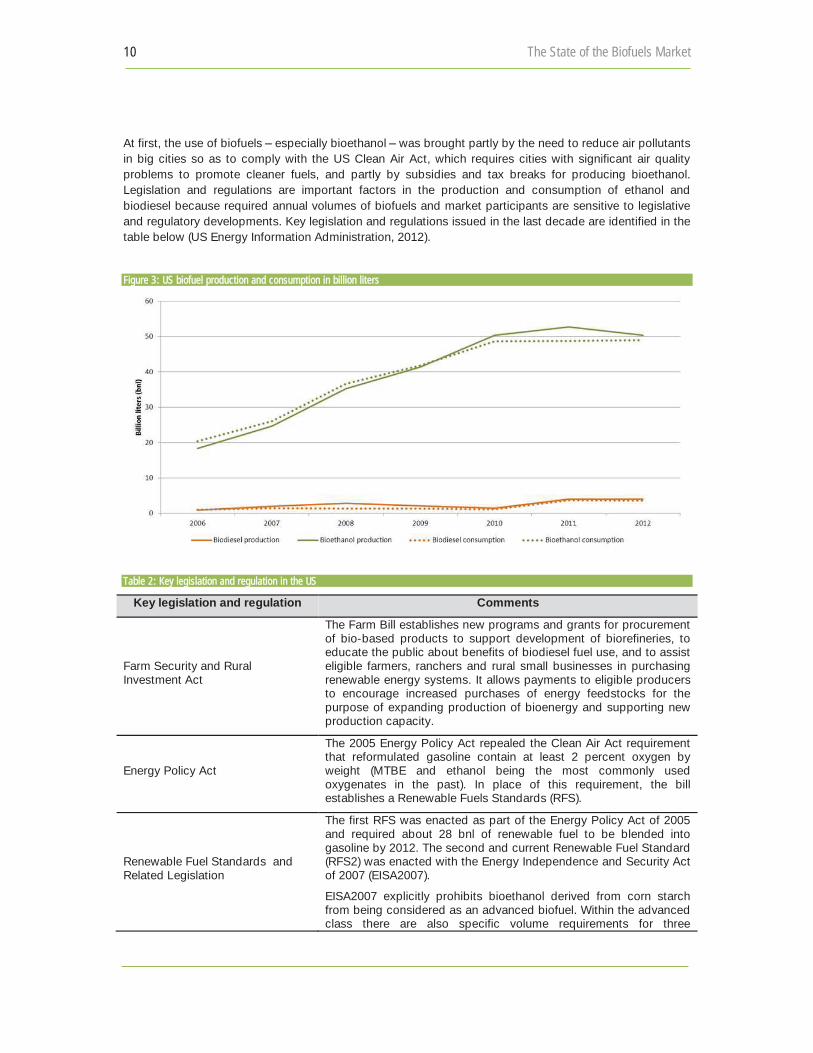
3.1. United States In the US, bioethanol is produced almost entirely from maize (90 percent), with a larger consumption of fossil fuels in the production process and a lower energy balance compared with bioethanol produced from sugarcane4 (US Department of Energy, 2010). From 2006 to 2012, the bioethanol production in the country increased from 18 to 50 bnl. Maize also plays an important role as feedstock for biodiesel production. In the same period, the US biodiesel production increased by a factor of four, from 0.9 up to about 4 bnl. As a result, there were a total of 16 435 million tonnes (Mt) of feedstocks consumed to produce biodiesel in 2012. Soybean oil was the largest feedstock with 54 percent. The next four largest biodiesel feedstocks were animal fat (14 percent), recycled feeds such as cooking oil (13 percent), canola oil (11 percent), and maize oil (9 percent) (US Energy Information Administration, 2013b; 2013c). Figure 3
10 The State of the Biofuels Market
At first, the use of biofuels especially bioethanol was brought partly by the need to reduce air pollutants in big cities so as to comply with the US Clean Air Act, which requires cities with significant air quality problems to promote cleaner fuels, and partly by subsidies and tax breaks for producing bioethanol. Legislation and regulations are important factors in the production and consumption of ethanol and biodiesel because required annual volumes of biofuels and market participants are sensitive to legislative and regulatory developments. Key legislation and regulations issued in the last decade are identified in the table below (US Energy Information Administration, 2012).
Figure 3: US biofuel production and consumption in billion liters
Table 2: Key legislation and regulation in the US
Key legislation and regulation Comments
Farm Security and Rural Investment Act
The Farm Bill establishes new programs and grants for procurement of bio-based products to support development of biorefineries, to educate the public about benefits of biodiesel fuel use, and to assist eligible farmers, ranchers and rural small businesses in purchasing renewable energy systems. It allows payments to eligible producers to encourage increased purchases of energy feedstocks for the purpose of expanding production of bioenergy and supporting new production capacity.
Energy Policy Act
The 2005 Energy Policy Act repealed the Clean Air Act requirement that reformulated gasoline contain at least 2 percent oxygen by weight (MTBE and ethanol being the most commonly used oxygenates in the past). In place of this requirement, the bill establishes a Renewable Fuels Standards (RFS).
Renewable Fuel Standards and Related Legislation
The first RFS was enacted as part of the Energy Policy Act of 2005 and required about 28 bnl of renewable fuel to be blended into gasoline by 2012. The second and current Renewable Fuel Standard (RFS2) was enacted with the Energy Independence and Security Act of 2007 (EISA2007). EISA2007 explicitly prohibits bioethanol derived from corn starch from being considered as an advanced biofuel. Within the advanced class there are also specific volume requirements for three
Regulatory, Trade and Development Perspectives 11
subcategories of advanced biofuels: unspecified, cellulosic biofuels, and biomass-based diesel. The EISA2007 statute created two principal categories renewable fuels (subsequently referred to as pr pa go (s qu y
includes virtually all renewable fuels produced by facilities that existed or were under construction in 2008 and any new sources of renewable fuel meeting a 20-percent reduction in GHG emissions relative to the fuels displaced (gasoline or diesel) from 2005 baseline. Advanced biofuels, which include fuels such as sugarcane ethanol, require a 50 percent GHG emissions reduction. Biomass-based diesel requires the same 50 percent. Finally, cellulosic biofuel with 60 percent GHG emissions reduction.
California Low Carbon Fuel Standard (LCFS)
LCFS implementation began in January 2011 but was halted by an injunction in December 2011 as two separate lawsuits worked their way through the state and federal courts. The injunction was lifted in April 2012 but litigation continues. Under the LCFS, every fuel has its own demonstrated level of lifecycle GHG emissions. The level of GHG emissions is expressed as a value of CO2 equivalent per unit of energy, in order to consistently account for GHG other than CO2. The standard requires substitutes for fossil fuels that demonstrate lower lifecycle GHG emissions than the fuels they replace. Each gasoline or diesel substitute is assigned one or more pathways with unique levels of GHG emissions based on raw material production and biofuel production.
Ethanol Blending
In March 2009, Growth Energy and a number of ethanol producers petitioned the US Environmental Protection Agency (US EPA) to approve the use of up to 15 percent bioethanol by volume in finished gasoline (E15). In October 2010, US EPA approved the use of E15 in vehicles of model year 2007 and later after conducting vehicle tests in conjunction with the Department of Energy. In January 2011, US EPA approved the use of E15 in light-duty vehicles beginning with model year 2001. The ethanol industry was also trying to persuade Congress to pass legislation to allow the same 1-pound Reid Vapor Pressure (RVP) waiver for E15 that is currently allowed for summer-grade conventional gasoline blended with 10 percent ethanol. This waiver would make the marketing of E15 less costly in the summer months, when gasoline volatility is required to be lower for air quality reasons. Approximately two-thirds of US gasoline volume is subject to the existing 1-pound waiver. As of January 2011, the vehicles covered by the two E15 waivers were estimated to be 60 percent of vehicles on US roads. Automakers, however, continue to oppose the use of E15 in any vehicle that is not capable of using high ethanol blends up to E85. E10 will continue to be the limit for light vehicles built prior to model year 2001, all gasoline-powered heavy-duty vehicles, and all non-road equipment. At the end of 2011, industry and regulators were working on health effects testing of E15 and pump certification, which are required to be addressed before E15 can be marketed. In 2012 US EPA began accepting submissions from retailers for approval to offer E15 blends. Numerous companies applied and were approved, with the first liter of E15 gasoline being sold in July 2012. As of August 2012, E15 is still limited by the same liability, warranty, and distribution concerns that were present in 2011 despite the first official volumes of the fuel making their way into the market. While small volumes of the fuel are likely to continue being sold in select locations around the country, they are likely to
12 The State of the Biofuels Market
remain marginal relative to the total ethanol supply until these issues are resolved.
Ethanol Tariffs and Tax Credits
Gasoline blended with bioethanol received a partial exemption from the motor fuels excise tax. This exemption made bioethanol-blended fuel price-competitive with gasoline. In 2005, the excise tax exemption was replaced by a tax credit (Volumetric Ethanol Excise Tax Credit - VEETC). VEETC was the most significant among the numerous US federal and state level tax incentives put in place to boost bioethanol use. The tax credit of $0.12 per liter of bioethanol blended with gasoline expired on December 31, 2011. High petroleum prices, record ethanol production, the saturation of the gasoline pool with ethanol, a robust federal RFS2 mandate, and a need to reduce federal tax expenditures all contributed to the expiration of the credit. Until the end of 2011, imports of bioethanol were subject to a tariff of $0.14 per liter. The tariff was intended to offset the bioethanol blending tax credit, so that only domestic bioethanol producers would benefit from the credit. The idea was to prevent large-scale direct imports from Brazil. There were, however, two ways to import bioethanol without tariff liability. One way was to ship ethanol from Brazil to the Caribbean for further processing. The ethanol could then be imported tariff-free under the Caribbean Basin Initiative. Another way was to offset fuel ethanol imports with exports of US-produced bioethanol and claim a duty drawback. This provision came into play in 2011, when corn ethanol was essentially swapped for the sugarcane ethanol needed to meet the RFS2 and the LCFS.
Biodiesel Blending
Biodiesel use is also required by various state and local mandates. Minnesota, the first state to require that all gasoline be blended with bioethanol, also led the way with a 2 percent biodiesel (B2) requirement in all diesel fuel. More recent state legislative activity has focused on heating oil. The biodiesel content requirements for states and localities mandating biodiesel (e.g. Minnesota, Oregon, Pennsylvania, Washington, New York City, and Vermont) range from 2 up to 20 percent. In addition, New Mexico and Massachusetts have suspended B2 legislation and Louisiana has a B2 mandate passed in 2006 that has not been implemented.
Biodiesel Tax Credit
The credit for biodiesel blending into diesel fuel or heating oil is $0.26 per liter of biodiesel blended. This tax credit was allowed to expire at the end of 2009, contributing to a decline in biodiesel production in 2010. At the end of 2010, the biodiesel credit was reintroduced for 2011 and made retroactive for all of 2010. The
2010 and 2011, because biodiesel is necessary to meet the biomass-based diesel requirement.
Cellulosic Biofuels Producer Tax Incentives
Producers of cellulosic biofuels are eligible for a production tax credit of $0.27 for each liter. An incentive depreciation allowance is also available for cellulosic biofuel plant property. Both of these incentives expire at the end of 2012
These key legislations and regulations set a renewable fuel consumption mandate, which establishes the overall volumes of biofuels to be blended into fossil fuels until 2022. The mandate required about 34 bnl of biofuels to be blended into fossil fuels in 2008. This demand was covered with conventional sources,
Regulatory, Trade and Development Perspectives 13
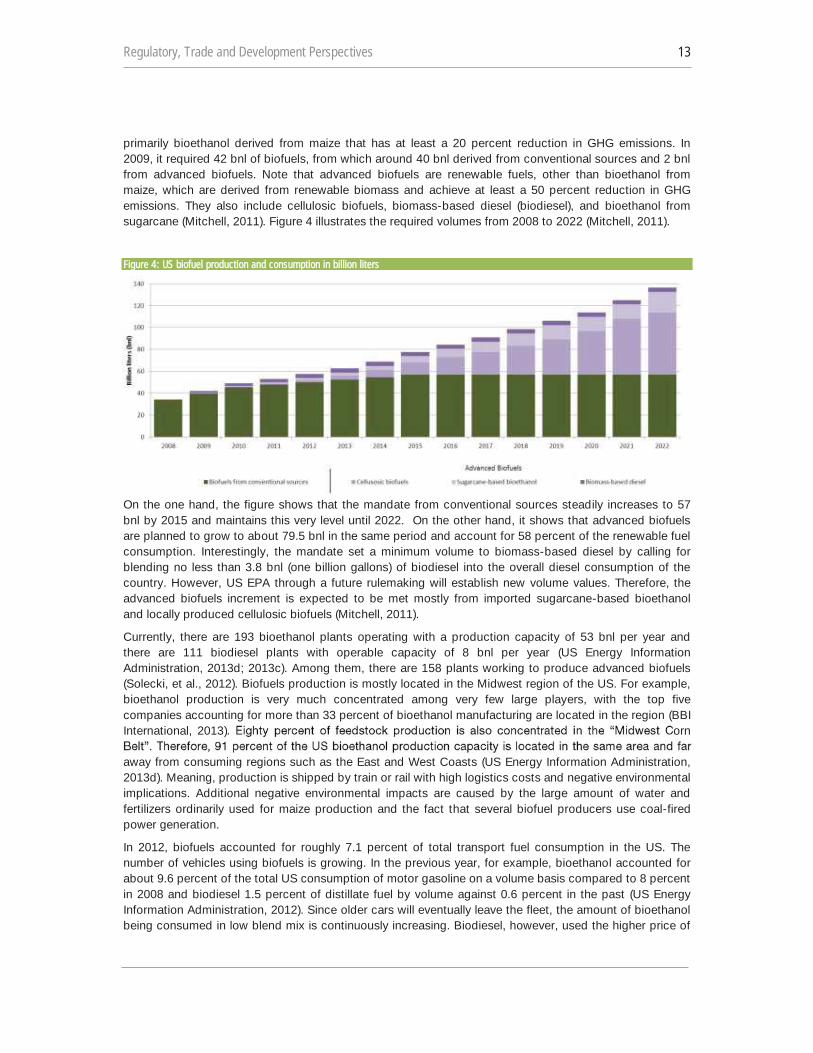
primarily bioethanol derived from maize that has at least a 20 percent reduction in GHG emissions. In 2009, it required 42 bnl of biofuels, from which around 40 bnl derived from conventional sources and 2 bnl from advanced biofuels. Note that advanced biofuels are renewable fuels, other than bioethanol from maize, which are derived from renewable biomass and achieve at least a 50 percent reduction in GHG emissions. They also include cellulosic biofuels, biomass-based diesel (biodiesel), and bioethanol from sugarcane (Mitchell, 2011). Figure 4 illustrates the required volumes from 2008 to 2022 (Mitchell, 2011).
Figure 4: US biofuel production and consumption in billion liters
On the one hand, the figure shows that the mandate from conventional sources steadily increases to 57 bnl by 2015 and maintains this very level until 2022. On the other hand, it shows that advanced biofuels are planned to grow to about 79.5 bnl in the same period and account for 58 percent of the renewable fuel consumption. Interestingly, the mandate set a minimum volume to biomass-based diesel by calling for blending no less than 3.8 bnl (one billion gallons) of biodiesel into the overall diesel consumption of the country. However, US EPA through a future rulemaking will establish new volume values. Therefore, the advanced biofuels increment is expected to be met mostly from imported sugarcane-based bioethanol and locally produced cellulosic biofuels (Mitchell, 2011).
Currently, there are 193 bioethanol plants operating with a production capacity of 53 bnl per year and there are 111 biodiesel plants with operable capacity of 8 bnl per year (US Energy Information Administration, 2013d; 2013c). Among them, there are 158 plants working to produce advanced biofuels (Solecki, et al., 2012). Biofuels production is mostly located in the Midwest region of the US. For example, bioethanol production is very much concentrated among very few large players, with the top five companies accounting for more than 33 percent of bioethanol manufacturing are located in the region (BBI International, 2013) orn
away from consuming regions such as the East and West Coasts (US Energy Information Administration, 2013d). Meaning, production is shipped by train or rail with high logistics costs and negative environmental implications. Additional negative environmental impacts are caused by the large amount of water and fertilizers ordinarily used for maize production and the fact that several biofuel producers use coal-fired power generation.
In 2012, biofuels accounted for roughly 7.1 percent of total transport fuel consumption in the US. The number of vehicles using biofuels is growing. In the previous year, for example, bioethanol accounted for about 9.6 percent of the total US consumption of motor gasoline on a volume basis compared to 8 percent in 2008 and biodiesel 1.5 percent of distillate fuel by volume against 0.6 percent in the past (US Energy Information Administration, 2012). Since older cars will eventually leave the fleet, the amount of bioethanol being consumed in low blend mix is continuously increasing. Biodiesel, however, used the higher price of
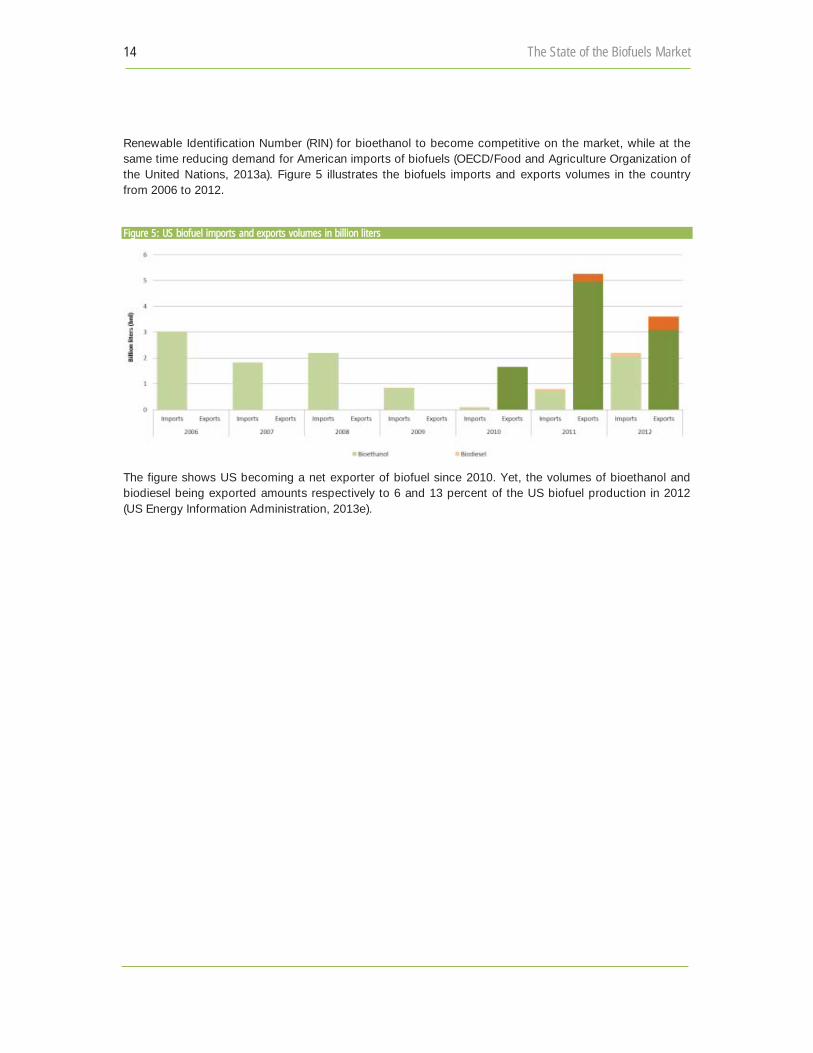
14 The State of the Biofuels Market
Renewable Identification Number (RIN) for bioethanol to become competitive on the market, while at the same time reducing demand for American imports of biofuels (OECD/Food and Agriculture Organization of the United Nations, 2013a). Figure 5 illustrates the biofuels imports and exports volumes in the country from 2006 to 2012.
Figure 5: US biofuel imports and exports volumes in billion liters
The figure shows US becoming a net exporter of biofuel since 2010. Yet, the volumes of bioethanol and biodiesel being exported amounts respectively to 6 and 13 percent of the US biofuel production in 2012 (US Energy Information Administration, 2013e).
Regulatory, Trade and Development Perspectives 15
3.2. The European Union In 2001, the European Commission (EC) launched a policy to promote the use of biofuels for transport in order to reduce GHG emissions and environmental impacts as well as to increase security of supply, technological innovation and agricultural diversification. The bamarket-necessary to achieve the stated goals.
In May 2003, Directive 2003/30/EC (Biofuels Directive) entered into force. The Directive required that Member States (MS) introduce legislation and take the necessary measures to ensure that, beginning in 2005, biofuels account for a minimum proportion of the fuel sold on their territory. Meaning, 2 percent by December 2005 and 5.75 percent by December 2010, compared with 0.6 percent in 2002. These were indicative targets. Since the 2005 target was not achieved biofuel use attained only 1.4 percent of transport fuel at region level , the EC established mandatory targets.
In parallel, legislation was developed on taxation of energy sources. According to Directive 2003/96/EC , MS may apply total or partial exemptions or reductions in the level of taxation to, inter alia, forms of energy derived from solar, wind, tidal or geothermal energy, or from biomass or waste. These tax concessions are considered as state aids, which may not be implemented without prior authorization by the Commission in order to avoid undue distortion of competition and over-compensation (European Union, 2003a).
Box 1 Biofuel related trade regimes United States
In 2012, the United States imported around 2 bnl of bioethanol, representing 4 percent of domestic consumption. Imports originate mainly from Brazil and reach the US market either directly or via Caribbean countries. The United States imposes Most Favored Nation (MFN) import duties of $14.27 cents/liter plus a 2.5 per cent ad valorem tariff on fuel ethanol. In many cases, this tariff regime offsets lower production costs in other countries and represents a significant barrier to imports as well as a tool to guarantee a captive market for US ethanol producers.
A limited amount of bioethanol may be imported duty-free under the Caribbean Basin Initiative (CBI) even if most of the steps in the production process were completed in other countries. More specifically, if produced from at least 50 percent local (CBI) feedstocks, bioethanol may be imported duty-free into the US market. If the local feedstock content is lower, limitations apply on quantity of duty-free bioethanol. Nevertheless, up to 7 percent of the US market may be supplied duty-free by CBI bioethanol containing no local feedstocks. In this case, hydrous bioethanol produced in other countries (mainly Brazil), can be shipped to a dehydration plant in a CBI country for reprocessing. After the bioethanol is dehydrated, it is imported duty free into the US. Currently, imports of dehydrated (anhydrous) bioethanol under the CBI are far below the 7 percent cap. In fact the overall bioethanol imports in 2012 account to approximately 4 percent of the volumes used in the country, from which less than 1 percent is free of taxes. However, this situation may change as agribusinesses, some of them North American, invest in bioethanol plants in the Caribbean. Dehydration plants are currently operating in Jamaica, Costa Rica, El Salvador and Trinidad and Tobago.
In the past, duty-free bioethanol imports have played a role during the negotiations of the US-Central America Free Trade Agreement (CAFTA). However, CAFTA did not introduce major changes. It does not increase overall preferential access to the US markets but it does establish country-specific shares for El Salvador and Costa Rica within the existing CBI quota. The other CAFTA countries, especially Jamaica, retain existing CBI benefits on bioethanol.
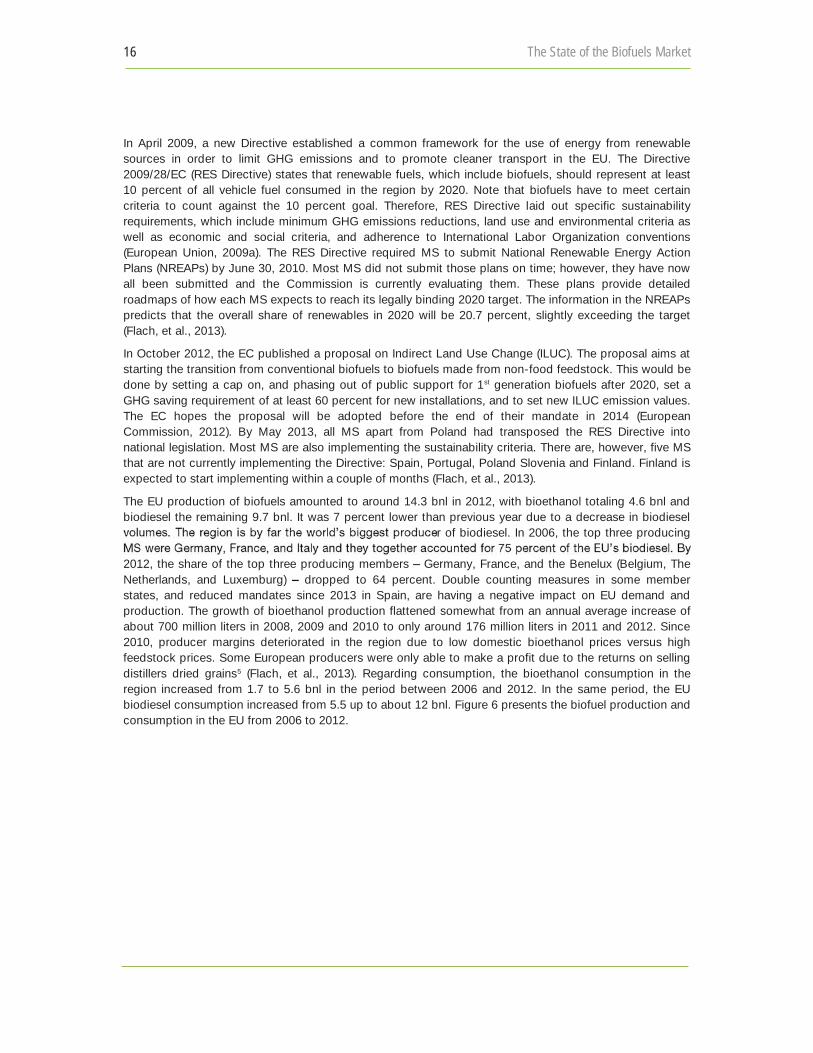
16 The State of the Biofuels Market
In April 2009, a new Directive established a common framework for the use of energy from renewable sources in order to limit GHG emissions and to promote cleaner transport in the EU. The Directive 2009/28/EC (RES Directive) states that renewable fuels, which include biofuels, should represent at least 10 percent of all vehicle fuel consumed in the region by 2020. Note that biofuels have to meet certain criteria to count against the 10 percent goal. Therefore, RES Directive laid out specific sustainability requirements, which include minimum GHG emissions reductions, land use and environmental criteria as well as economic and social criteria, and adherence to International Labor Organization conventions (European Union, 2009a). The RES Directive required MS to submit National Renewable Energy Action Plans (NREAPs) by June 30, 2010. Most MS did not submit those plans on time; however, they have now all been submitted and the Commission is currently evaluating them. These plans provide detailed roadmaps of how each MS expects to reach its legally binding 2020 target. The information in the NREAPs predicts that the overall share of renewables in 2020 will be 20.7 percent, slightly exceeding the target (Flach, et al., 2013).
In October 2012, the EC published a proposal on Indirect Land Use Change (ILUC). The proposal aims at starting the transition from conventional biofuels to biofuels made from non-food feedstock. This would be done by setting a cap on, and phasing out of public support for 1st generation biofuels after 2020, set a GHG saving requirement of at least 60 percent for new installations, and to set new ILUC emission values. The EC hopes the proposal will be adopted before the end of their mandate in 2014 (European Commission, 2012). By May 2013, all MS apart from Poland had transposed the RES Directive into national legislation. Most MS are also implementing the sustainability criteria. There are, however, five MS that are not currently implementing the Directive: Spain, Portugal, Poland Slovenia and Finland. Finland is expected to start implementing within a couple of months (Flach, et al., 2013).
The EU production of biofuels amounted to around 14.3 bnl in 2012, with bioethanol totaling 4.6 bnl and biodiesel the remaining 9.7 bnl. It was 7 percent lower than previous year due to a decrease in biodiesel
r of biodiesel. In 2006, the top three producing
2012, the share of the top three producing members Germany, France, and the Benelux (Belgium, The Netherlands, and Luxemburg) dropped to 64 percent. Double counting measures in some member states, and reduced mandates since 2013 in Spain, are having a negative impact on EU demand and production. The growth of bioethanol production flattened somewhat from an annual average increase of about 700 million liters in 2008, 2009 and 2010 to only around 176 million liters in 2011 and 2012. Since 2010, producer margins deteriorated in the region due to low domestic bioethanol prices versus high feedstock prices. Some European producers were only able to make a profit due to the returns on selling distillers dried grains5 (Flach, et al., 2013). Regarding consumption, the bioethanol consumption in the region increased from 1.7 to 5.6 bnl in the period between 2006 and 2012. In the same period, the EU biodiesel consumption increased from 5.5 up to about 12 bnl. Figure 6 presents the biofuel production and consumption in the EU from 2006 to 2012.
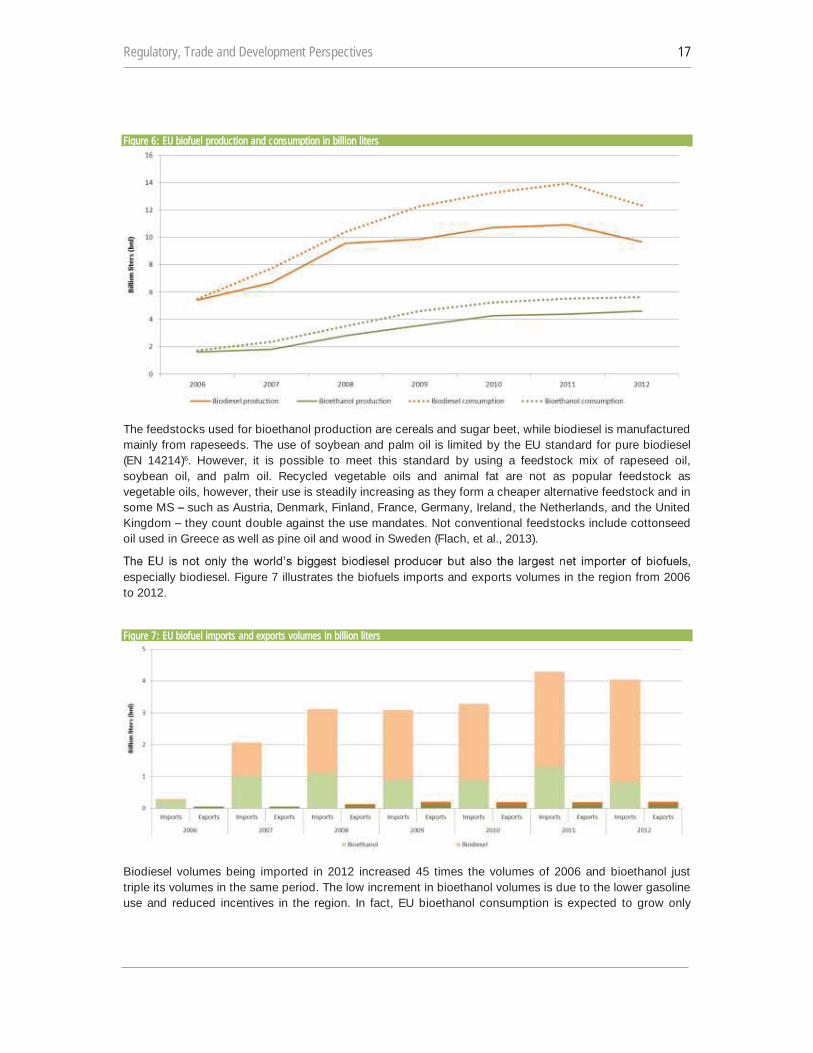
Regulatory, Trade and Development Perspectives 17
Figure 6: EU biofuel production and consumption in billion liters
The feedstocks used for bioethanol production are cereals and sugar beet, while biodiesel is manufactured mainly from rapeseeds. The use of soybean and palm oil is limited by the EU standard for pure biodiesel (EN 14214)6. However, it is possible to meet this standard by using a feedstock mix of rapeseed oil, soybean oil, and palm oil. Recycled vegetable oils and animal fat are not as popular feedstock as vegetable oils, however, their use is steadily increasing as they form a cheaper alternative feedstock and in some MS such as Austria, Denmark, Finland, France, Germany, Ireland, the Netherlands, and the United Kingdom they count double against the use mandates. Not conventional feedstocks include cottonseed oil used in Greece as well as pine oil and wood in Sweden (Flach, et al., 2013).
especially biodiesel. Figure 7 illustrates the biofuels imports and exports volumes in the region from 2006 to 2012.
Figure 7: EU biofuel imports and exports volumes in billion liters
Biodiesel volumes being imported in 2012 increased 45 times the volumes of 2006 and bioethanol just triple its volumes in the same period. The low increment in bioethanol volumes is due to the lower gasoline use and reduced incentives in the region. In fact, EU bioethanol consumption is expected to grow only
gg pppp pppp
18 The State of the Biofuels Market
marginally from 5.6 billion liters in 2012 to 5.7 billion liters in 2013 and 5.8 billion liters in 2014 (Flach, et al., 2013).
3.2.1. Sweden Sweden is the frontrunner among MS regarding the growth of renewables in transport. The share of biofuels in the Swedish domestic transport sector has more than doubled in the last years, from 2.9 percent in 2006 to approximately 7.5 percent in 2012. In a BAU scenario, Sweden may exceed its mandate of 10 percent renewable fuels in transport by 2020 with a surplus of 2 percent (Sanches-Pereira & Gómez, 2013). The Swedish production of biofuels amounted to around 348 million liters in 2012, with bioethanol totaling 57 percent of the volumes produced and biodiesel the remaining 43 percent (Dahlbacka, 2009; Swedish Energy Agency, 2012a). The growth of the Swedish biofuel production flattened following the European trend due to low domestic biofuel prices versus high feedstock prices in the last couple of years (Flach, et al., 2013). Figure 8 presents the biofuel production and consumption in Sweden from 2006 to 2012.
Box 2 Biofuel related trade regimes European Union
The EU imported more than 20 bnl of biofuels in during 2006-2012, from which bioethanol accounts for 31 percent of the imports and biodiesel 69 percent. The EU tariff on undenatured bioethanol (HS 2207.10) is 0.192 Euro per liters, while the tariff on denatured ethanol (HS 2207.20) is 0.102 Euro per liters. Most MS only permit blending with undenatured bioethanol so as to protect their domestic market by the higher tariff rate. The governments of the United Kingdom, the Netherlands, Finland, Denmark, the Czech Republic and Slovakia, however, also permit blending with denatured bioethanol.
In the last six years, the majority of the bioethanol has been imported by the Benelux countries, United Kingdom, Sweden, and Finland mainly through the port of Rotterdam. A part of the bioethanol imports is blended with gasoline in Rotterdam, but most of the biofuel is blended at its final destination to fulfill local MS requirements. In order to benefit from a lower import tariff, the major part of the bioethanol volumes was imported as E90 (90 percent bioethanol blend with gasoline) with a Binding Tariff Information (BTI) under the Harmonized System (HS) code 3824.90.97, subject to a lower tariff, namely 6.5 percent of the customs value. On April 2012, the EU closed this popular loophole in the tariff regime. On February 2013, the EU also imposed an anti-dumping duty on bioethanol imports from the US. Despite these trade barriers, the region is expected to remain attracting bioethanol from foreign markets mainly supplied through preferential trade measures with Guatemala, Peru and Pakistan. The other likely source is Brazil.
EU imports of biodiesel are also subject to anti-dumping duties. On March 2009, the EC published Regulation 193/2009 and Regulation 194/2009, containing provisional anti-dumping and countervailing duty measures on imports of biodiesel from the US containing 20 percent or more of biofuels. The Regulations and duties entered into force on March 2009 and applied for 6 months, after which they were made definitive for a 5-year period. On May 2011, the EC published a decision to extend the definitive countervailing and anti-dumping duties imposed on all biodiesel originating in the US. As a result, US supplied-biodiesel has been largely replaced by biodiesel from Argentina and Indonesia. In an attempt to curb imports from these countries, the EU enforced anti-dumping duties starting May 29, 2013. The new enforced duties could open up opportunities for biodiesel from other origins, for example, imports from Malaysia are likely to increase.
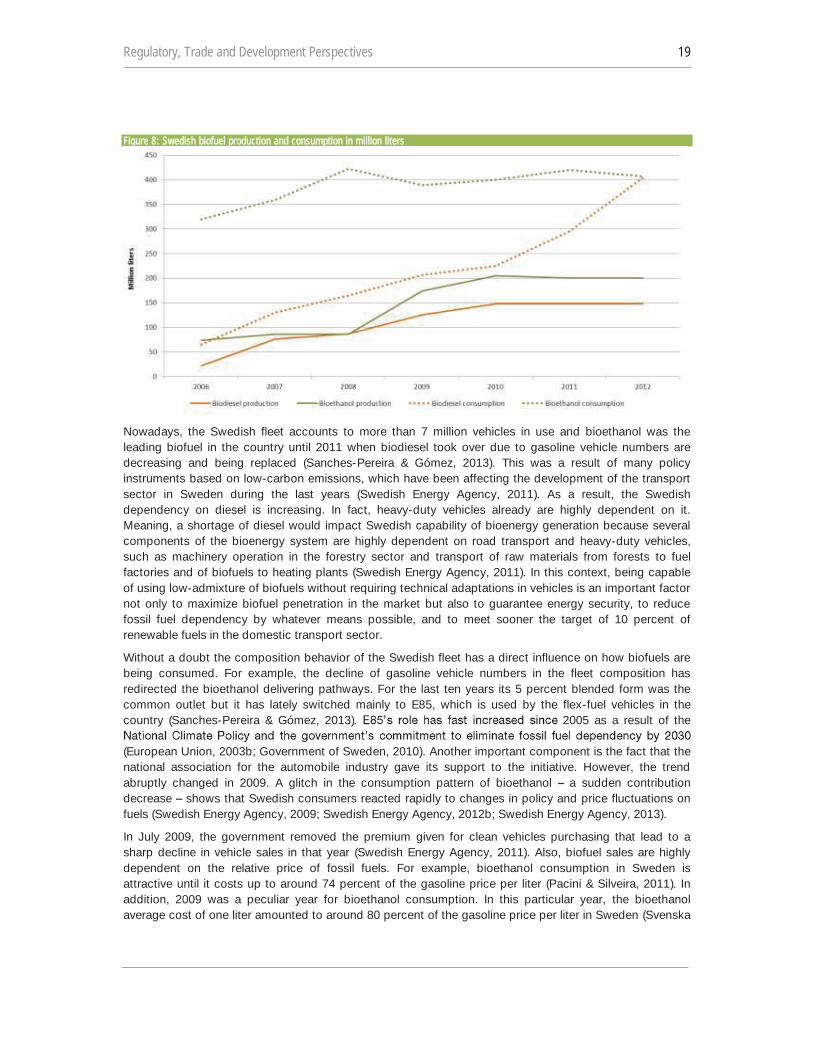
Regulatory, Trade and Development Perspectives 19
Figure 8: Swedish biofuel production and consumption in million liters
Nowadays, the Swedish fleet accounts to more than 7 million vehicles in use and bioethanol was the leading biofuel in the country until 2011 when biodiesel took over due to gasoline vehicle numbers are decreasing and being replaced (Sanches-Pereira & Gómez, 2013). This was a result of many policy instruments based on low-carbon emissions, which have been affecting the development of the transport sector in Sweden during the last years (Swedish Energy Agency, 2011). As a result, the Swedish dependency on diesel is increasing. In fact, heavy-duty vehicles already are highly dependent on it. Meaning, a shortage of diesel would impact Swedish capability of bioenergy generation because several components of the bioenergy system are highly dependent on road transport and heavy-duty vehicles, such as machinery operation in the forestry sector and transport of raw materials from forests to fuel factories and of biofuels to heating plants (Swedish Energy Agency, 2011). In this context, being capable of using low-admixture of biofuels without requiring technical adaptations in vehicles is an important factor not only to maximize biofuel penetration in the market but also to guarantee energy security, to reduce fossil fuel dependency by whatever means possible, and to meet sooner the target of 10 percent of renewable fuels in the domestic transport sector.
Without a doubt the composition behavior of the Swedish fleet has a direct influence on how biofuels are being consumed. For example, the decline of gasoline vehicle numbers in the fleet composition has redirected the bioethanol delivering pathways. For the last ten years its 5 percent blended form was the common outlet but it has lately switched mainly to E85, which is used by the flex-fuel vehicles in the country (Sanches-Pereira & Gómez, 2013) 2005 as a result of the
(European Union, 2003b; Government of Sweden, 2010). Another important component is the fact that the national association for the automobile industry gave its support to the initiative. However, the trend abruptly changed in 2009. A glitch in the consumption pattern of bioethanol a sudden contribution decrease shows that Swedish consumers reacted rapidly to changes in policy and price fluctuations on fuels (Swedish Energy Agency, 2009; Swedish Energy Agency, 2012b; Swedish Energy Agency, 2013).
In July 2009, the government removed the premium given for clean vehicles purchasing that lead to a sharp decline in vehicle sales in that year (Swedish Energy Agency, 2011). Also, biofuel sales are highly dependent on the relative price of fossil fuels. For example, bioethanol consumption in Sweden is attractive until it costs up to around 74 percent of the gasoline price per liter (Pacini & Silveira, 2011). In addition, 2009 was a peculiar year for bioethanol consumption. In this particular year, the bioethanol average cost of one liter amounted to around 80 percent of the gasoline price per liter in Sweden (Svenska
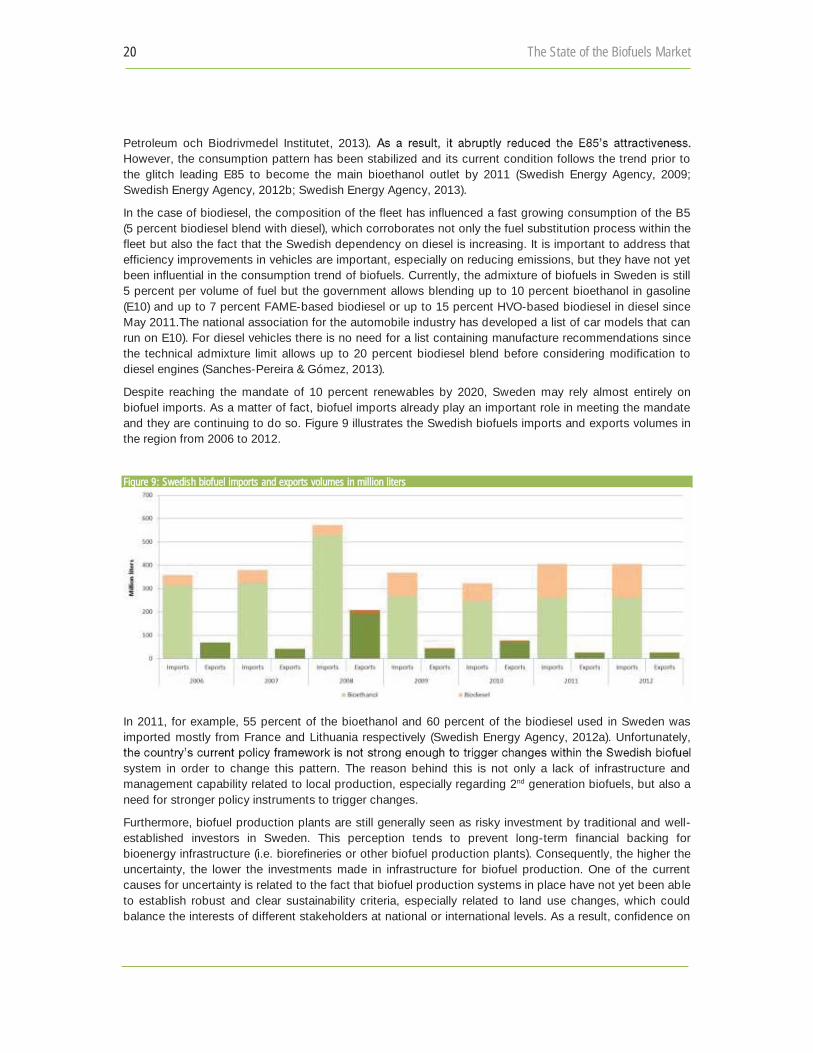
20 The State of the Biofuels Market
Petroleum och Biodrivmedel Institutet, 2013) However, the consumption pattern has been stabilized and its current condition follows the trend prior to the glitch leading E85 to become the main bioethanol outlet by 2011 (Swedish Energy Agency, 2009; Swedish Energy Agency, 2012b; Swedish Energy Agency, 2013).
In the case of biodiesel, the composition of the fleet has influenced a fast growing consumption of the B5 (5 percent biodiesel blend with diesel), which corroborates not only the fuel substitution process within the fleet but also the fact that the Swedish dependency on diesel is increasing. It is important to address that efficiency improvements in vehicles are important, especially on reducing emissions, but they have not yet been influential in the consumption trend of biofuels. Currently, the admixture of biofuels in Sweden is still 5 percent per volume of fuel but the government allows blending up to 10 percent bioethanol in gasoline (E10) and up to 7 percent FAME-based biodiesel or up to 15 percent HVO-based biodiesel in diesel since May 2011.The national association for the automobile industry has developed a list of car models that can run on E10). For diesel vehicles there is no need for a list containing manufacture recommendations since the technical admixture limit allows up to 20 percent biodiesel blend before considering modification to diesel engines (Sanches-Pereira & Gómez, 2013).
Despite reaching the mandate of 10 percent renewables by 2020, Sweden may rely almost entirely on biofuel imports. As a matter of fact, biofuel imports already play an important role in meeting the mandate and they are continuing to do so. Figure 9 illustrates the Swedish biofuels imports and exports volumes in the region from 2006 to 2012.
Figure 9: Swedish biofuel imports and exports volumes in million liters
In 2011, for example, 55 percent of the bioethanol and 60 percent of the biodiesel used in Sweden was imported mostly from France and Lithuania respectively (Swedish Energy Agency, 2012a). Unfortunately,
system in order to change this pattern. The reason behind this is not only a lack of infrastructure and management capability related to local production, especially regarding 2nd generation biofuels, but also a need for stronger policy instruments to trigger changes.
Furthermore, biofuel production plants are still generally seen as risky investment by traditional and well-established investors in Sweden. This perception tends to prevent long-term financial backing for bioenergy infrastructure (i.e. biorefineries or other biofuel production plants). Consequently, the higher the uncertainty, the lower the investments made in infrastructure for biofuel production. One of the current causes for uncertainty is related to the fact that biofuel production systems in place have not yet been able to establish robust and clear sustainability criteria, especially related to land use changes, which could balance the interests of different stakeholders at national or international levels. As a result, confidence on
gg pppp pppp
Regulatory, Trade and Development Perspectives 21
biofuel availability and increases risks when it comes to quantity, quality, price, as well as demand volumes across the main supply sources is negatively affected. For example, the previously mentioned EU cap regarding the amount of biofuel derived from food crops at 5.5 percent in order to avoid a competition with food and fiber production, deals with indirect change in land use and biofuel standards that would affect the biofuel system as a whole. Regardless of the directive proposal entering into legal force soon or not; it may still create uncertainties regarding the future development of the Swedish biofuel production system. Therefore, these have already had impacts on the country by making investors even more cautious and uncertain about the credibility of existing infrastructure on facing such challenge.
Despite the aforementioned challenges to the future of biofuels in Sweden, there is no doubt that the Swedish biofuel systems were built on government support and incentives. Reliance on such support does not only keep the system stable but it also is a tool in changing the course of its development so as to turn
independent of fossil fuels by 2030 without compromising security of supply.
3.3. Brazil The Brazilian bioethanol production increased 33 percent between 2006 and 2012, from around 18 bnl to about 24 bnl (Instituto Brasileiro de Petróleo, Gás e Biocombustíveis, 2013; Barros, 2013). Sugarcane is virtually the exclusive source of feedstock for bioethanol production in Brazil and nearly half of the
about 428 Mt in 2006, to over 594 Mt in the 2012. The Brazilian success is the result of a government-sponsored program to
reduce dependence from imported petroleum products. Environmental and social considerations, however, played an important role as well.
Brazil not only became an important producer but also a major user of bioethanol for transport fuel. Total domestic bioethanol demand in 2012 was 19 bnl and it is projected to increase based on likely higher supply, attractive bioethanol prices at the pump, and the continued steady sales of flex-fuel vehicles in the Brazilian market. Therefore, total bioethanol consumption for use as fuel is estimated at 23.7 billion liters for 2014 (Barros, 2013). Regarding biodiesel, the Brazilian production was 2.7 bnl in 2012. Figure 10 presents the biofuel production and consumption in Brazil from 2006 to 2012.

22 The State of the Biofuels Market
Figure 10: Brazilian biofuel production and consumption in billion liters
The Brazilian biodiesel program was launched in 2002 and it presents many similarities with that for bioethanol. The biodiesel program targets collective and merchandise transport as well as off-grid electricity generation in remote areas where kerosene burning is currently the major energy source. In December 2004, a bill (Law No. 11.097) was passed authorizing a voluntary 2 percent addition of biodiesel to diesel. Starting in 2008, the mix became mandatory and it has been gradually increased. The Brazilian biodiesel mandate has been set at 5 percent biodiesel blend with diesel since 2010. However, several industry proposals have advocated the gradual increase of the blend to 10 percent along the next few years. In fact, the Brazilian Council for Energy Policy (CNPE) has studied the possibility to increase the current blend to 7 percent in the recent future but no decision has been taken yet (Barros, 2013).
Biodiesel production is strongly regulated by the Brazilian government. Commercial use of biodiesel in Brazil is governed by a specific regulatory framework that makes biodiesel competitive with diesel, taking into account the wide variety of oilseeds available, measures to guarantee supply, compliance with fuel
awarded by the Brazilian Ministry of Agrarian Development (MDA), establishes the conditions for industrial producers of biodiesel to obtain tax benefits and credit. In order to receive the seal, an industrial producer must purchase feedstock from family farmers and enter into a legally binding agreement with them to establish specific income levels and guarantee technical assistance and training (Ministério de Minas e Energia, 2013). The use of several oil seeds and several technologies is permitted. Some tax exemptions are allowed for biodiesel producers who utilize castor oil and palm oil as feedstock, to enhance the participation of the rural communities of the North-East States of Brazil which are the poorest States in the program (EPAMIG, 2005). The mandatory use of biodiesel made its domestic demand jump to 1.13 bnl in 2008 and 2.79 bnl in 2012.
Brazilian total bioethanol exports in 2012 were 3 bnl and, for 2014, are forecast at 3.65 bnl. The country also imports bioethanol 0.55 bnl in 2012 and the US is the biggest supplier with 99 percent of the imported volumes. The Figure 11 below shows the biofuel imports and exports volumes from 2006 to 2012.
gggggg pppp pppp
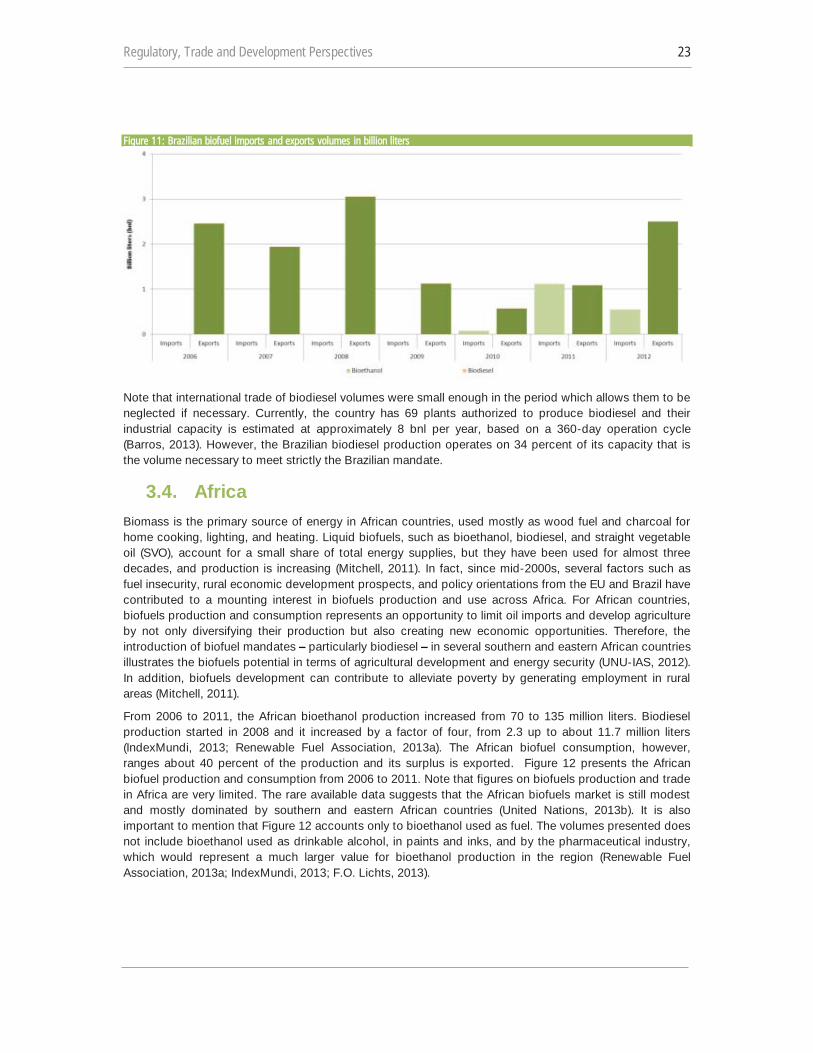
Regulatory, Trade and Development Perspectives 23
Figure 11: Brazilian biofuel imports and exports volumes in billion liters
Note that international trade of biodiesel volumes were small enough in the period which allows them to be neglected if necessary. Currently, the country has 69 plants authorized to produce biodiesel and their industrial capacity is estimated at approximately 8 bnl per year, based on a 360-day operation cycle (Barros, 2013). However, the Brazilian biodiesel production operates on 34 percent of its capacity that is the volume necessary to meet strictly the Brazilian mandate.
3.4. Africa Biomass is the primary source of energy in African countries, used mostly as wood fuel and charcoal for home cooking, lighting, and heating. Liquid biofuels, such as bioethanol, biodiesel, and straight vegetable oil (SVO), account for a small share of total energy supplies, but they have been used for almost three decades, and production is increasing (Mitchell, 2011). In fact, since mid-2000s, several factors such as fuel insecurity, rural economic development prospects, and policy orientations from the EU and Brazil have contributed to a mounting interest in biofuels production and use across Africa. For African countries, biofuels production and consumption represents an opportunity to limit oil imports and develop agriculture by not only diversifying their production but also creating new economic opportunities. Therefore, the introduction of biofuel mandates particularly biodiesel in several southern and eastern African countries illustrates the biofuels potential in terms of agricultural development and energy security (UNU-IAS, 2012). In addition, biofuels development can contribute to alleviate poverty by generating employment in rural areas (Mitchell, 2011).
From 2006 to 2011, the African bioethanol production increased from 70 to 135 million liters. Biodiesel production started in 2008 and it increased by a factor of four, from 2.3 up to about 11.7 million liters (IndexMundi, 2013; Renewable Fuel Association, 2013a). The African biofuel consumption, however, ranges about 40 percent of the production and its surplus is exported. Figure 12 presents the African biofuel production and consumption from 2006 to 2011. Note that figures on biofuels production and trade in Africa are very limited. The rare available data suggests that the African biofuels market is still modest and mostly dominated by southern and eastern African countries (United Nations, 2013b). It is also important to mention that Figure 12 accounts only to bioethanol used as fuel. The volumes presented does not include bioethanol used as drinkable alcohol, in paints and inks, and by the pharmaceutical industry, which would represent a much larger value for bioethanol production in the region (Renewable Fuel Association, 2013a; IndexMundi, 2013; F.O. Lichts, 2013).
gggggg pppp pppp
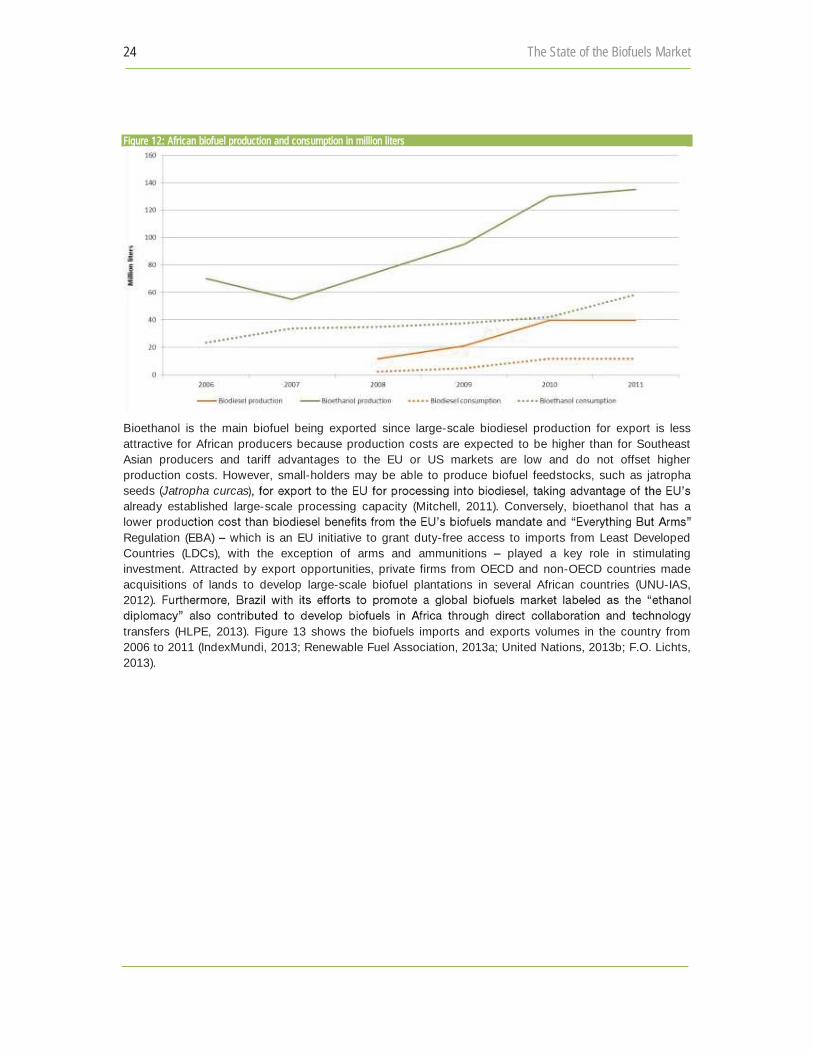
24 The State of the Biofuels Market
Figure 12: African biofuel production and consumption in million liters
Bioethanol is the main biofuel being exported since large-scale biodiesel production for export is less attractive for African producers because production costs are expected to be higher than for Southeast Asian producers and tariff advantages to the EU or US markets are low and do not offset higher production costs. However, small-holders may be able to produce biofuel feedstocks, such as jatropha seeds (Jatropha curcassalready established large-scale processing capacity (Mitchell, 2011). Conversely, bioethanol that has a lower prodRegulation (EBA) which is an EU initiative to grant duty-free access to imports from Least Developed Countries (LDCs), with the exception of arms and ammunitions played a key role in stimulating investment. Attracted by export opportunities, private firms from OECD and non-OECD countries made acquisitions of lands to develop large-scale biofuel plantations in several African countries (UNU-IAS, 2012)
transfers (HLPE, 2013). Figure 13 shows the biofuels imports and exports volumes in the country from 2006 to 2011 (IndexMundi, 2013; Renewable Fuel Association, 2013a; United Nations, 2013b; F.O. Lichts, 2013).
gggggg pppp pppp
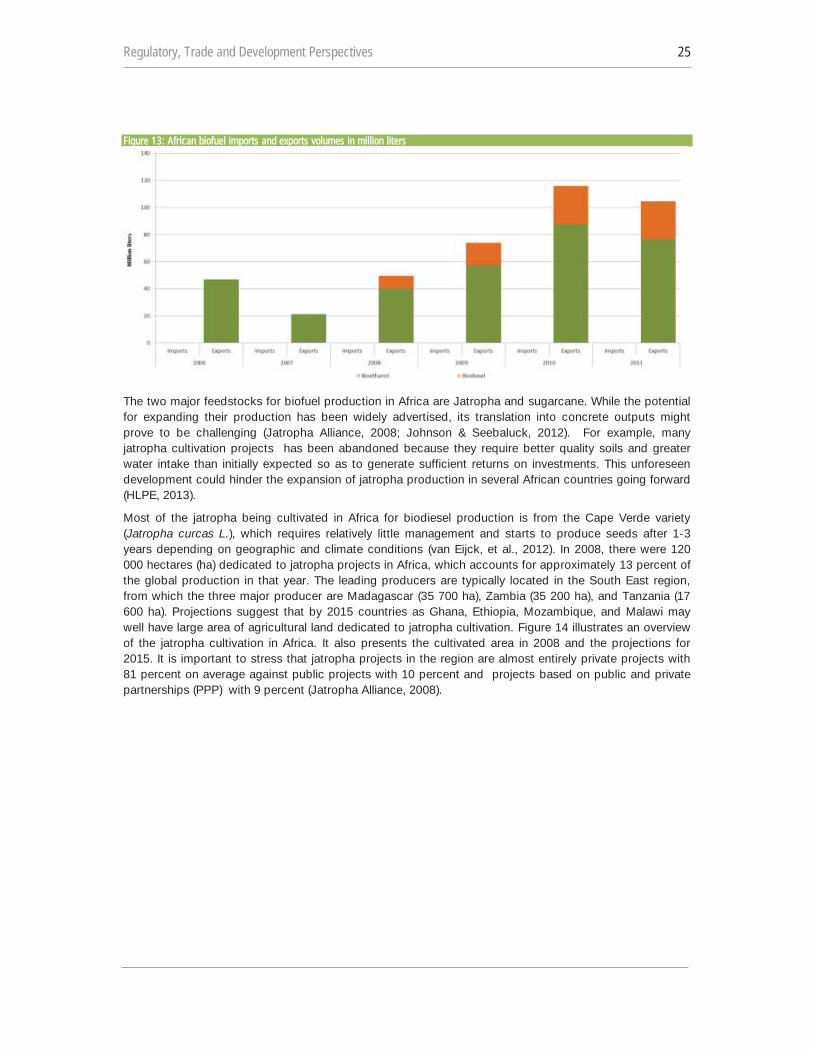
Regulatory, Trade and Development Perspectives 25
Figure 13: African biofuel imports and exports volumes in million liters
The two major feedstocks for biofuel production in Africa are Jatropha and sugarcane. While the potential for expanding their production has been widely advertised, its translation into concrete outputs might prove to be challenging (Jatropha Alliance, 2008; Johnson & Seebaluck, 2012). For example, many jatropha cultivation projects has been abandoned because they require better quality soils and greater water intake than initially expected so as to generate sufficient returns on investments. This unforeseen development could hinder the expansion of jatropha production in several African countries going forward (HLPE, 2013).
Most of the jatropha being cultivated in Africa for biodiesel production is from the Cape Verde variety (Jatropha curcas L.), which requires relatively little management and starts to produce seeds after 1-3 years depending on geographic and climate conditions (van Eijck, et al., 2012). In 2008, there were 120 000 hectares (ha) dedicated to jatropha projects in Africa, which accounts for approximately 13 percent of the global production in that year. The leading producers are typically located in the South East region, from which the three major producer are Madagascar (35 700 ha), Zambia (35 200 ha), and Tanzania (17 600 ha). Projections suggest that by 2015 countries as Ghana, Ethiopia, Mozambique, and Malawi may well have large area of agricultural land dedicated to jatropha cultivation. Figure 14 illustrates an overview of the jatropha cultivation in Africa. It also presents the cultivated area in 2008 and the projections for 2015. It is important to stress that jatropha projects in the region are almost entirely private projects with 81 percent on average against public projects with 10 percent and projects based on public and private partnerships (PPP) with 9 percent (Jatropha Alliance, 2008).
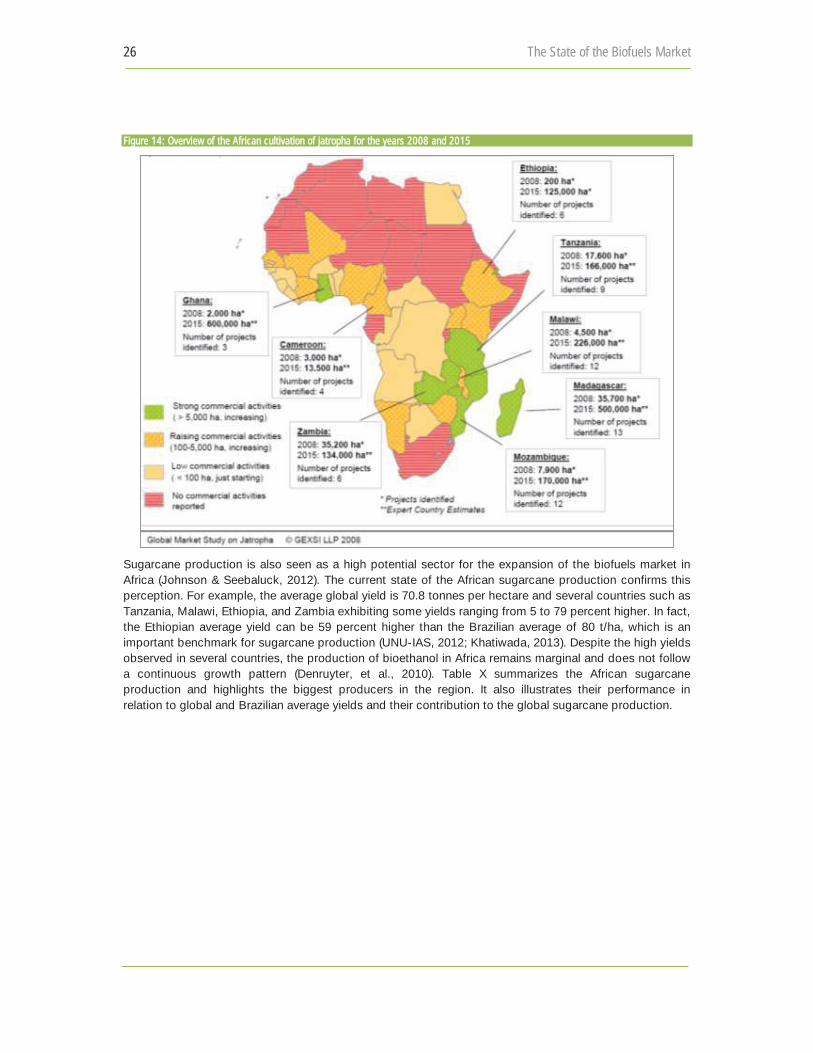
26 The State of the Biofuels Market
Figure 14: Overview of the African cultivation of jatropha for the years 2008 and 2015
Sugarcane production is also seen as a high potential sector for the expansion of the biofuels market in Africa (Johnson & Seebaluck, 2012). The current state of the African sugarcane production confirms this perception. For example, the average global yield is 70.8 tonnes per hectare and several countries such as Tanzania, Malawi, Ethiopia, and Zambia exhibiting some yields ranging from 5 to 79 percent higher. In fact, the Ethiopian average yield can be 59 percent higher than the Brazilian average of 80 t/ha, which is an important benchmark for sugarcane production (UNU-IAS, 2012; Khatiwada, 2013). Despite the high yields observed in several countries, the production of bioethanol in Africa remains marginal and does not follow a continuous growth pattern (Denruyter, et al., 2010). Table X summarizes the African sugarcane production and highlights the biggest producers in the region. It also illustrates their performance in relation to global and Brazilian average yields and their contribution to the global sugarcane production.
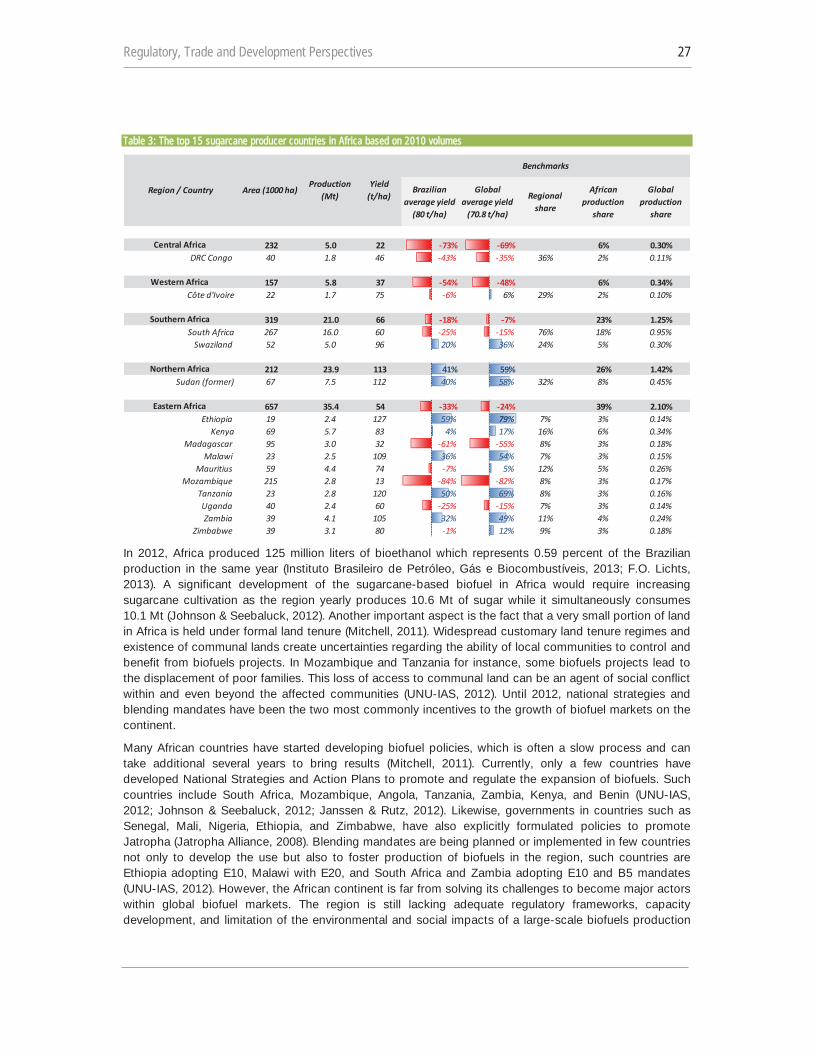
Regulatory, Trade and Development Perspectives 27
Table 3: The top 15 sugarcane producer countries in Africa based on 2010 volumes
In 2012, Africa produced 125 million liters of bioethanol which represents 0.59 percent of the Brazilian production in the same year (Instituto Brasileiro de Petróleo, Gás e Biocombustíveis, 2013; F.O. Lichts, 2013). A significant development of the sugarcane-based biofuel in Africa would require increasing sugarcane cultivation as the region yearly produces 10.6 Mt of sugar while it simultaneously consumes 10.1 Mt (Johnson & Seebaluck, 2012). Another important aspect is the fact that a very small portion of land in Africa is held under formal land tenure (Mitchell, 2011). Widespread customary land tenure regimes and existence of communal lands create uncertainties regarding the ability of local communities to control and benefit from biofuels projects. In Mozambique and Tanzania for instance, some biofuels projects lead to the displacement of poor families. This loss of access to communal land can be an agent of social conflict within and even beyond the affected communities (UNU-IAS, 2012). Until 2012, national strategies and blending mandates have been the two most commonly incentives to the growth of biofuel markets on the continent.
Many African countries have started developing biofuel policies, which is often a slow process and can take additional several years to bring results (Mitchell, 2011). Currently, only a few countries have developed National Strategies and Action Plans to promote and regulate the expansion of biofuels. Such countries include South Africa, Mozambique, Angola, Tanzania, Zambia, Kenya, and Benin (UNU-IAS, 2012; Johnson & Seebaluck, 2012; Janssen & Rutz, 2012). Likewise, governments in countries such as Senegal, Mali, Nigeria, Ethiopia, and Zimbabwe, have also explicitly formulated policies to promote Jatropha (Jatropha Alliance, 2008). Blending mandates are being planned or implemented in few countries not only to develop the use but also to foster production of biofuels in the region, such countries are Ethiopia adopting E10, Malawi with E20, and South Africa and Zambia adopting E10 and B5 mandates (UNU-IAS, 2012). However, the African continent is far from solving its challenges to become major actors within global biofuel markets. The region is still lacking adequate regulatory frameworks, capacity development, and limitation of the environmental and social impacts of a large-scale biofuels production
Brazilian average yield
(80 t/ha)
Global average yield
(70.8 t/ha)
Regional share
African production
share
Global production
share
80 70.8 91 1685232 5.0 22 -73% -69% 6% 0.30%
DRC Congo 40 1.8 46 -43% -35% 36% 2% 0.11%
157 5.8 37 -54% -48% 6% 0.34%Côte d'Ivoire 22 1.7 75 -6% 6% 29% 2% 0.10%
319 21.0 66 -18% -7% 23% 1.25%South Africa 267 16.0 60 -25% -15% 76% 18% 0.95%
Swaziland 52 5.0 96 20% 36% 24% 5% 0.30%
212 23.9 113 41% 59% 26% 1.42%Sudan (former) 67 7.5 112 40% 58% 32% 8% 0.45%
657 35.4 54 -33% -24% 39% 2.10%Ethiopia 19 2.4 127 59% 79% 7% 3% 0.14%
Kenya 69 5.7 83 4% 17% 16% 6% 0.34%Madagascar 95 3.0 32 -61% -55% 8% 3% 0.18%
Malawi 23 2.5 109 36% 54% 7% 3% 0.15%Mauritius 59 4.4 74 -7% 5% 12% 5% 0.26%
Mozambique 215 2.8 13 -84% -82% 8% 3% 0.17%Tanzania 23 2.8 120 50% 69% 8% 3% 0.16%Uganda 40 2.4 60 -25% -15% 7% 3% 0.14%Zambia 39 4.1 105 32% 49% 11% 4% 0.24%
Zimbabwe 39 3.1 80 -1% 12% 9% 3% 0.18%
Northern Africa
Eastern Africa
Region / Country
Central Africa
Western Africa
Southern Africa
Benchmarks
Yield (t/ha)
Production (Mt)
Area (1000 ha)
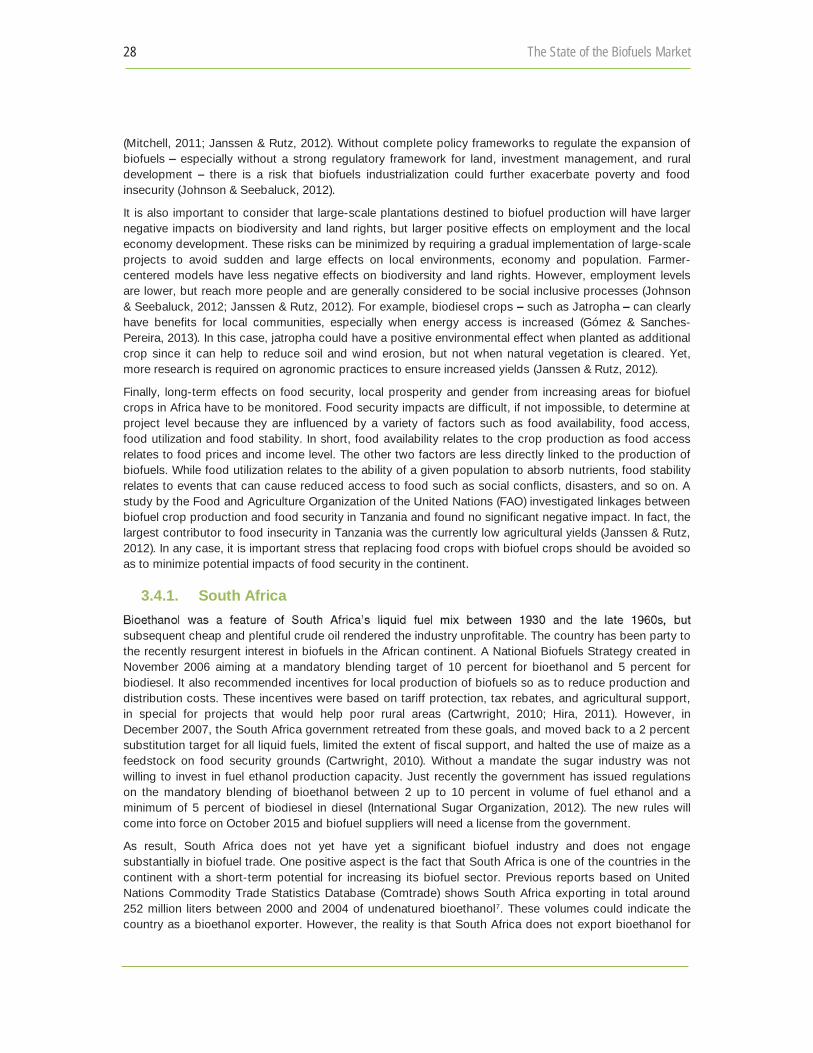
28 The State of the Biofuels Market
(Mitchell, 2011; Janssen & Rutz, 2012). Without complete policy frameworks to regulate the expansion of biofuels especially without a strong regulatory framework for land, investment management, and rural development there is a risk that biofuels industrialization could further exacerbate poverty and food insecurity (Johnson & Seebaluck, 2012).
It is also important to consider that large-scale plantations destined to biofuel production will have larger negative impacts on biodiversity and land rights, but larger positive effects on employment and the local economy development. These risks can be minimized by requiring a gradual implementation of large-scale projects to avoid sudden and large effects on local environments, economy and population. Farmer-centered models have less negative effects on biodiversity and land rights. However, employment levels are lower, but reach more people and are generally considered to be social inclusive processes (Johnson & Seebaluck, 2012; Janssen & Rutz, 2012). For example, biodiesel crops such as Jatropha can clearly have benefits for local communities, especially when energy access is increased (Gómez & Sanches-Pereira, 2013). In this case, jatropha could have a positive environmental effect when planted as additional crop since it can help to reduce soil and wind erosion, but not when natural vegetation is cleared. Yet, more research is required on agronomic practices to ensure increased yields (Janssen & Rutz, 2012).
Finally, long-term effects on food security, local prosperity and gender from increasing areas for biofuel crops in Africa have to be monitored. Food security impacts are difficult, if not impossible, to determine at project level because they are influenced by a variety of factors such as food availability, food access, food utilization and food stability. In short, food availability relates to the crop production as food access relates to food prices and income level. The other two factors are less directly linked to the production of biofuels. While food utilization relates to the ability of a given population to absorb nutrients, food stability relates to events that can cause reduced access to food such as social conflicts, disasters, and so on. A study by the Food and Agriculture Organization of the United Nations (FAO) investigated linkages between biofuel crop production and food security in Tanzania and found no significant negative impact. In fact, the largest contributor to food insecurity in Tanzania was the currently low agricultural yields (Janssen & Rutz, 2012). In any case, it is important stress that replacing food crops with biofuel crops should be avoided so as to minimize potential impacts of food security in the continent.
3.4.1. South Africa
subsequent cheap and plentiful crude oil rendered the industry unprofitable. The country has been party to the recently resurgent interest in biofuels in the African continent. A National Biofuels Strategy created in November 2006 aiming at a mandatory blending target of 10 percent for bioethanol and 5 percent for biodiesel. It also recommended incentives for local production of biofuels so as to reduce production and distribution costs. These incentives were based on tariff protection, tax rebates, and agricultural support, in special for projects that would help poor rural areas (Cartwright, 2010; Hira, 2011). However, in December 2007, the South Africa government retreated from these goals, and moved back to a 2 percent substitution target for all liquid fuels, limited the extent of fiscal support, and halted the use of maize as a feedstock on food security grounds (Cartwright, 2010). Without a mandate the sugar industry was not willing to invest in fuel ethanol production capacity. Just recently the government has issued regulations on the mandatory blending of bioethanol between 2 up to 10 percent in volume of fuel ethanol and a minimum of 5 percent of biodiesel in diesel (International Sugar Organization, 2012). The new rules will come into force on October 2015 and biofuel suppliers will need a license from the government.
As result, South Africa does not yet have yet a significant biofuel industry and does not engage substantially in biofuel trade. One positive aspect is the fact that South Africa is one of the countries in the continent with a short-term potential for increasing its biofuel sector. Previous reports based on United Nations Commodity Trade Statistics Database (Comtrade) shows South Africa exporting in total around 252 million liters between 2000 and 2004 of undenatured bioethanol7. These volumes could indicate the country as a bioethanol exporter. However, the reality is that South Africa does not export bioethanol for
Regulatory, Trade and Development Perspectives 29
use in the fuel market since they are destined for use in beverage, pharmaceutical, and paint industries. In fact, there is currently very little bioethanol being produced in South Africa apart from the industrial bioethanol produced almost entirely by the sugar industry (Cartwright, 2010).
Despite being one of the larger sugarcane producing country in Africa (see Table 3), South Africa manufactures small volumes of bioethanol by fermenting the molasses produced as a by-product of its sugar industry. This bioethanol, as mentioned before, is not used in fuel but as drinkable alcohol, solvent in paints and inks, and by the pharmaceutical industry. Therefore, supplying large volumes of bioethanol will not only require the creation of biofuel industry with any significant scale but also use sugarcane juice instead of molasses as a more efficient source (Cartwright, 2010).
Gradually, the South African biofuel industry is emergi
medium term will likely be sold in the market that offers the highest price. On a purely financial basis, it makes sense for South African growers to export bioethanol if the price they receive once the commodity has been freighted and import duties have been paid is higher than the price received in the domestic market. The domestic market price is expected to be linked to the basic fuel price and in order to compete unassisted with imported fuel on an energy equivalent basis8, South African bioethanol would therefore have had to be produced at ZAR9 3.02 per liter or $ 0.31. To put into a global market perspective, the current cost of production of bioethanol is about $0.18 per liter in Brazil, between $0.28 and $0.46 per liter in China, and about $0.44 per liter in India (Timilsina & Shrestha, 2011).
Regarding biodiesel, there are no commercial volumes being trade in South Africa and the biodiesel currently in use corresponds to an insignificant proportion share of fuel use in the country National Mineral Research Organisation, 2012). Biofuel projections indicate that domestic use of biodiesel in South Africa would be around 100 million liters by 2020 (OECD/Food and Agriculture Organization of the United Nations, 2011), which correspond to less than 2 percent of the planned national capacity of biodiesel production. Table 4 presents the current research projects in biodiesel production in the country
.
30 The State of the Biofuels Market
Table 4: South African research projects on biodiesel production
In August 2013, the South African Department of Energy announced mandatory blending regulations for biodiesel and bioethanol under Government Notice R.671. The regulations require a minimum of B5 for diesel, and allow blends of E2 and E10 for gasoline (European Biofuels Technology Platform, 2013).
3.5. Paraguay The current Paraguayan economic growth is increasing the number of cars and pushing fuel consumption up. However, official projections do not foresee a significant growth in consumption of biofuels. Hence, the Government of Paraguay passed several decrees in the beginning of 2013 aiming at resolving a number of issues hindering the biofuels development in the country (Joseph & Sallyards, 2013a).
Currently, the total number of vehicles in Paraguay is assessed as 25 percent being flex fuel, 25 percent running on gasoline, and 50 percent on diesel and they consumed 2.8 bnl of fuel in 2012, from which less than 6 percent was biofuels (Joseph & Sallyards, 2013a). Figure 15 presents the biofuel production and consumption in Paraguay from 2006 to 2012.
Developer Project Annual Capacity in million liters
Potential Capacity Share
Status
Australian Goverment Rainbow Biodiesel 226 4% Project at feasibility stage
German Goverment East London Biodiesel refinery 226 4% Project at feasibility stage
Sasol SA Sasol Biodiesel 453 8% Project on hold
NW Provincial government Biodiesel 240 4% Ongoing
IDC Biodiesel project at Hoedspruit 100 2% No information
IDC Biodiesel project at Ogies 150 3% No information
IDC Biodiesel project at Cradock 90 2% No information
IDC Biodiesel project at Pondoland 150 3% No information
IDC Biodiesel project at Makhathini 100 2% No information
De Beers Biodiesel project at Mookgopong 43 1% Ongoing
De Beers Biodiesel project at Naboomspruit 4000 69% Ongoing
Ongoing Capacity 4283 74%
Overall Potential Capacity 5779 100%
De Beers
IDC and CEF
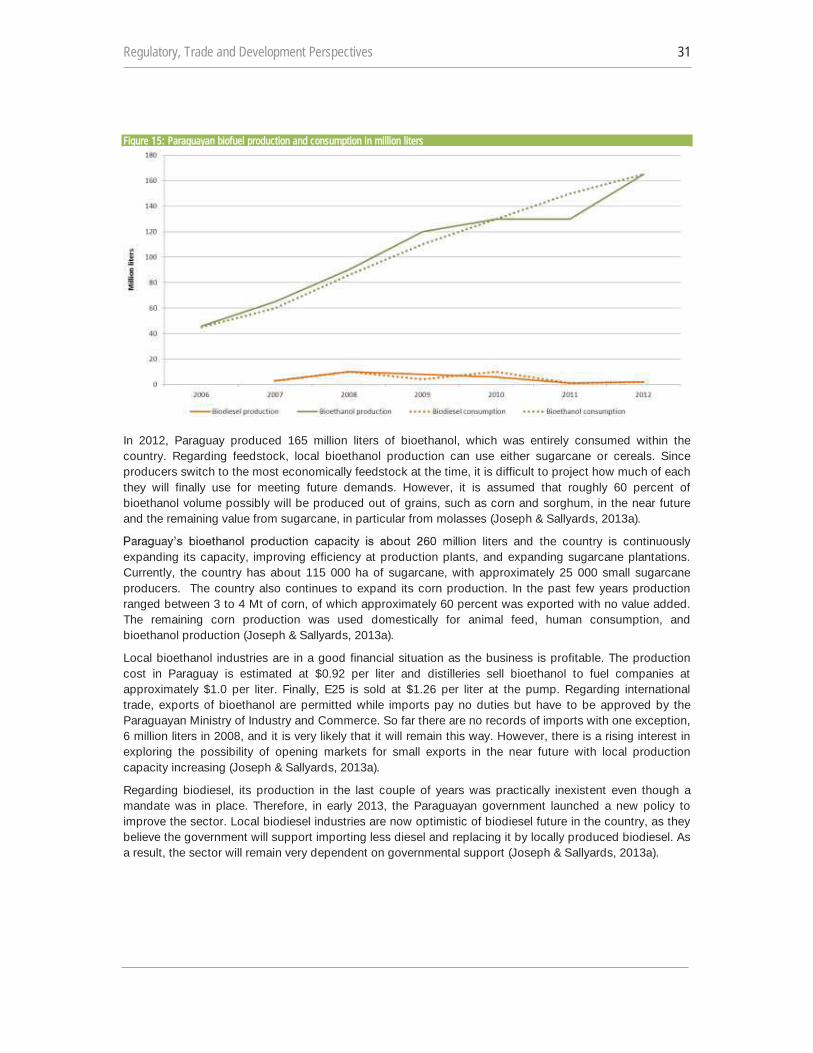
Regulatory, Trade and Development Perspectives 31
Figure 15: Paraguayan biofuel production and consumption in million liters
In 2012, Paraguay produced 165 million liters of bioethanol, which was entirely consumed within the country. Regarding feedstock, local bioethanol production can use either sugarcane or cereals. Since producers switch to the most economically feedstock at the time, it is difficult to project how much of each they will finally use for meeting future demands. However, it is assumed that roughly 60 percent of bioethanol volume possibly will be produced out of grains, such as corn and sorghum, in the near future and the remaining value from sugarcane, in particular from molasses (Joseph & Sallyards, 2013a).
llion liters and the country is continuously expanding its capacity, improving efficiency at production plants, and expanding sugarcane plantations. Currently, the country has about 115 000 ha of sugarcane, with approximately 25 000 small sugarcane producers. The country also continues to expand its corn production. In the past few years production ranged between 3 to 4 Mt of corn, of which approximately 60 percent was exported with no value added. The remaining corn production was used domestically for animal feed, human consumption, and bioethanol production (Joseph & Sallyards, 2013a).
Local bioethanol industries are in a good financial situation as the business is profitable. The production cost in Paraguay is estimated at $0.92 per liter and distilleries sell bioethanol to fuel companies at approximately $1.0 per liter. Finally, E25 is sold at $1.26 per liter at the pump. Regarding international trade, exports of bioethanol are permitted while imports pay no duties but have to be approved by the Paraguayan Ministry of Industry and Commerce. So far there are no records of imports with one exception, 6 million liters in 2008, and it is very likely that it will remain this way. However, there is a rising interest in exploring the possibility of opening markets for small exports in the near future with local production capacity increasing (Joseph & Sallyards, 2013a).
Regarding biodiesel, its production in the last couple of years was practically inexistent even though a mandate was in place. Therefore, in early 2013, the Paraguayan government launched a new policy to improve the sector. Local biodiesel industries are now optimistic of biodiesel future in the country, as they believe the government will support importing less diesel and replacing it by locally produced biodiesel. As a result, the sector will remain very dependent on governmental support (Joseph & Sallyards, 2013a).
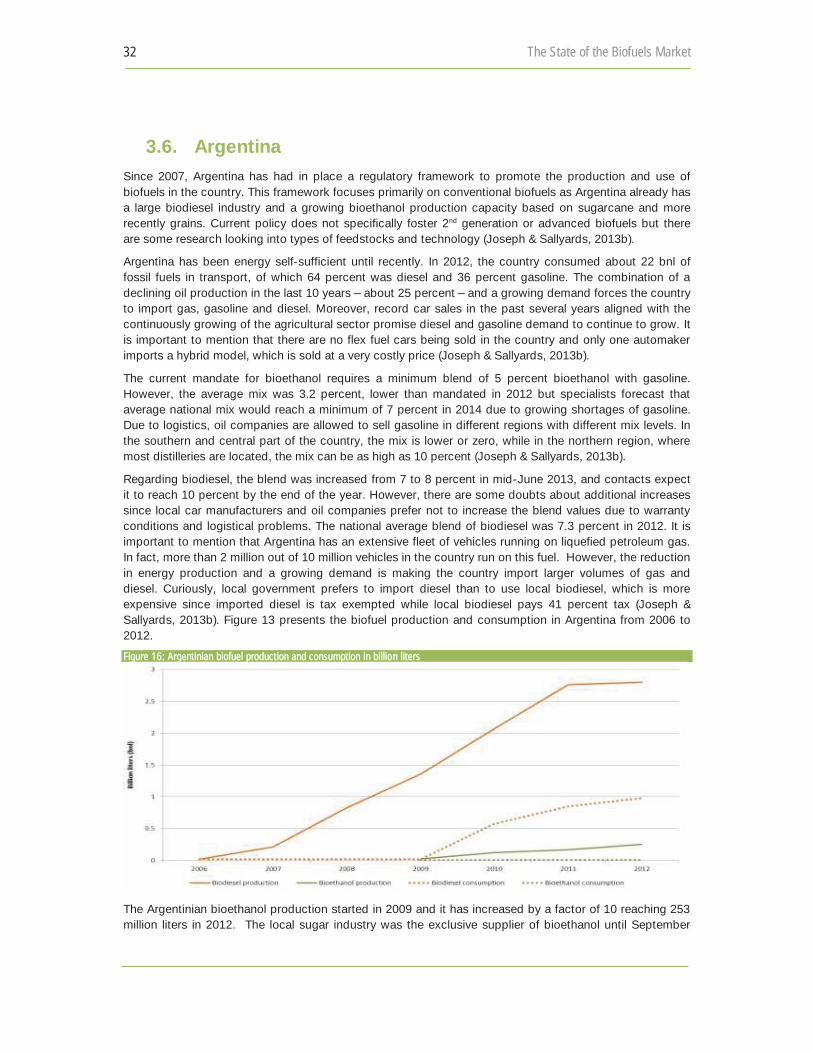
32 The State of the Biofuels Market
3.6. Argentina Since 2007, Argentina has had in place a regulatory framework to promote the production and use of biofuels in the country. This framework focuses primarily on conventional biofuels as Argentina already has a large biodiesel industry and a growing bioethanol production capacity based on sugarcane and more recently grains. Current policy does not specifically foster 2nd generation or advanced biofuels but there are some research looking into types of feedstocks and technology (Joseph & Sallyards, 2013b).
Argentina has been energy self-sufficient until recently. In 2012, the country consumed about 22 bnl of fossil fuels in transport, of which 64 percent was diesel and 36 percent gasoline. The combination of a declining oil production in the last 10 years about 25 percent and a growing demand forces the country to import gas, gasoline and diesel. Moreover, record car sales in the past several years aligned with the continuously growing of the agricultural sector promise diesel and gasoline demand to continue to grow. It is important to mention that there are no flex fuel cars being sold in the country and only one automaker imports a hybrid model, which is sold at a very costly price (Joseph & Sallyards, 2013b).
The current mandate for bioethanol requires a minimum blend of 5 percent bioethanol with gasoline. However, the average mix was 3.2 percent, lower than mandated in 2012 but specialists forecast that average national mix would reach a minimum of 7 percent in 2014 due to growing shortages of gasoline. Due to logistics, oil companies are allowed to sell gasoline in different regions with different mix levels. In the southern and central part of the country, the mix is lower or zero, while in the northern region, where most distilleries are located, the mix can be as high as 10 percent (Joseph & Sallyards, 2013b).
Regarding biodiesel, the blend was increased from 7 to 8 percent in mid-June 2013, and contacts expect it to reach 10 percent by the end of the year. However, there are some doubts about additional increases since local car manufacturers and oil companies prefer not to increase the blend values due to warranty conditions and logistical problems. The national average blend of biodiesel was 7.3 percent in 2012. It is important to mention that Argentina has an extensive fleet of vehicles running on liquefied petroleum gas. In fact, more than 2 million out of 10 million vehicles in the country run on this fuel. However, the reduction in energy production and a growing demand is making the country import larger volumes of gas and diesel. Curiously, local government prefers to import diesel than to use local biodiesel, which is more expensive since imported diesel is tax exempted while local biodiesel pays 41 percent tax (Joseph & Sallyards, 2013b). Figure 13 presents the biofuel production and consumption in Argentina from 2006 to 2012. Figure 16: Argentinian biofuel production and consumption in billion liters
The Argentinian bioethanol production started in 2009 and it has increased by a factor of 10 reaching 253 million liters in 2012. The local sugar industry was the exclusive supplier of bioethanol until September
gggggg gggggg pppp pppp
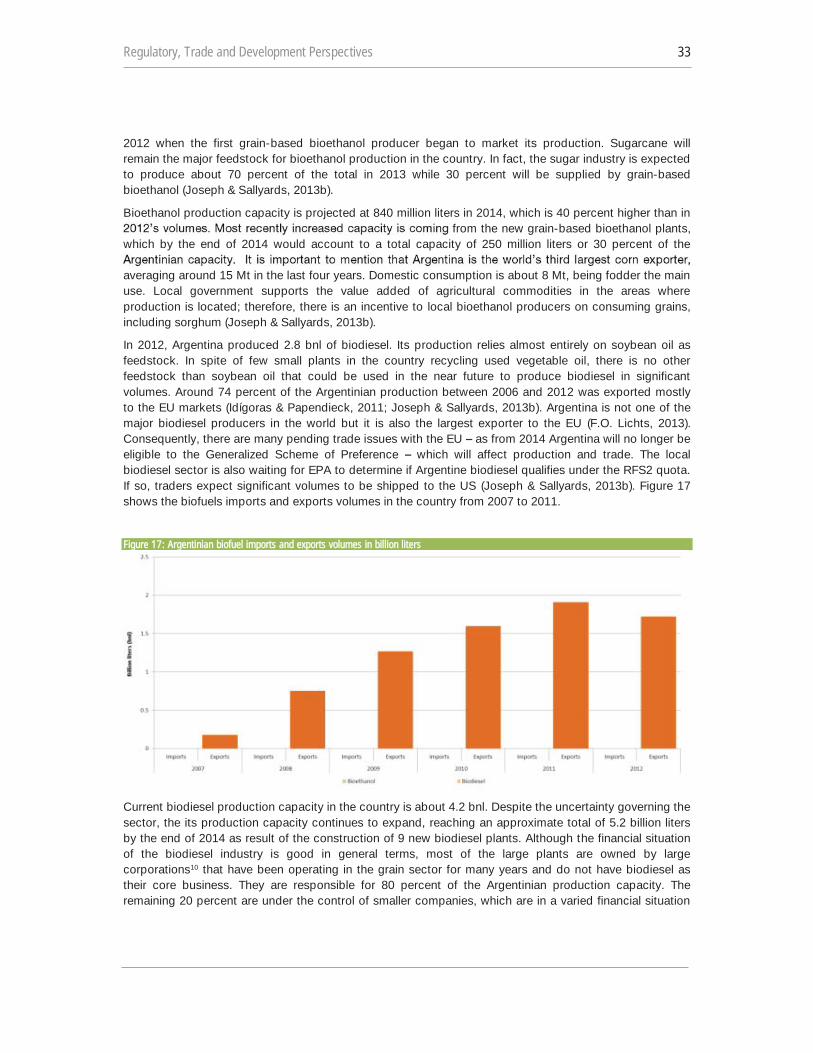
Regulatory, Trade and Development Perspectives 33
2012 when the first grain-based bioethanol producer began to market its production. Sugarcane will remain the major feedstock for bioethanol production in the country. In fact, the sugar industry is expected to produce about 70 percent of the total in 2013 while 30 percent will be supplied by grain-based bioethanol (Joseph & Sallyards, 2013b).
Bioethanol production capacity is projected at 840 million liters in 2014, which is 40 percent higher than in from the new grain-based bioethanol plants,
which by the end of 2014 would account to a total capacity of 250 million liters or 30 percent of the
averaging around 15 Mt in the last four years. Domestic consumption is about 8 Mt, being fodder the main use. Local government supports the value added of agricultural commodities in the areas where production is located; therefore, there is an incentive to local bioethanol producers on consuming grains, including sorghum (Joseph & Sallyards, 2013b).
In 2012, Argentina produced 2.8 bnl of biodiesel. Its production relies almost entirely on soybean oil as feedstock. In spite of few small plants in the country recycling used vegetable oil, there is no other feedstock than soybean oil that could be used in the near future to produce biodiesel in significant volumes. Around 74 percent of the Argentinian production between 2006 and 2012 was exported mostly to the EU markets (Idígoras & Papendieck, 2011; Joseph & Sallyards, 2013b). Argentina is not one of the major biodiesel producers in the world but it is also the largest exporter to the EU (F.O. Lichts, 2013). Consequently, there are many pending trade issues with the EU as from 2014 Argentina will no longer be eligible to the Generalized Scheme of Preference which will affect production and trade. The local biodiesel sector is also waiting for EPA to determine if Argentine biodiesel qualifies under the RFS2 quota. If so, traders expect significant volumes to be shipped to the US (Joseph & Sallyards, 2013b). Figure 17 shows the biofuels imports and exports volumes in the country from 2007 to 2011.
Figure 17: Argentinian biofuel imports and exports volumes in billion liters
Current biodiesel production capacity in the country is about 4.2 bnl. Despite the uncertainty governing the sector, the its production capacity continues to expand, reaching an approximate total of 5.2 billion liters by the end of 2014 as result of the construction of 9 new biodiesel plants. Although the financial situation of the biodiesel industry is good in general terms, most of the large plants are owned by large corporations10 that have been operating in the grain sector for many years and do not have biodiesel as their core business. They are responsible for 80 percent of the Argentinian production capacity. The remaining 20 percent are under the control of smaller companies, which are in a varied financial situation
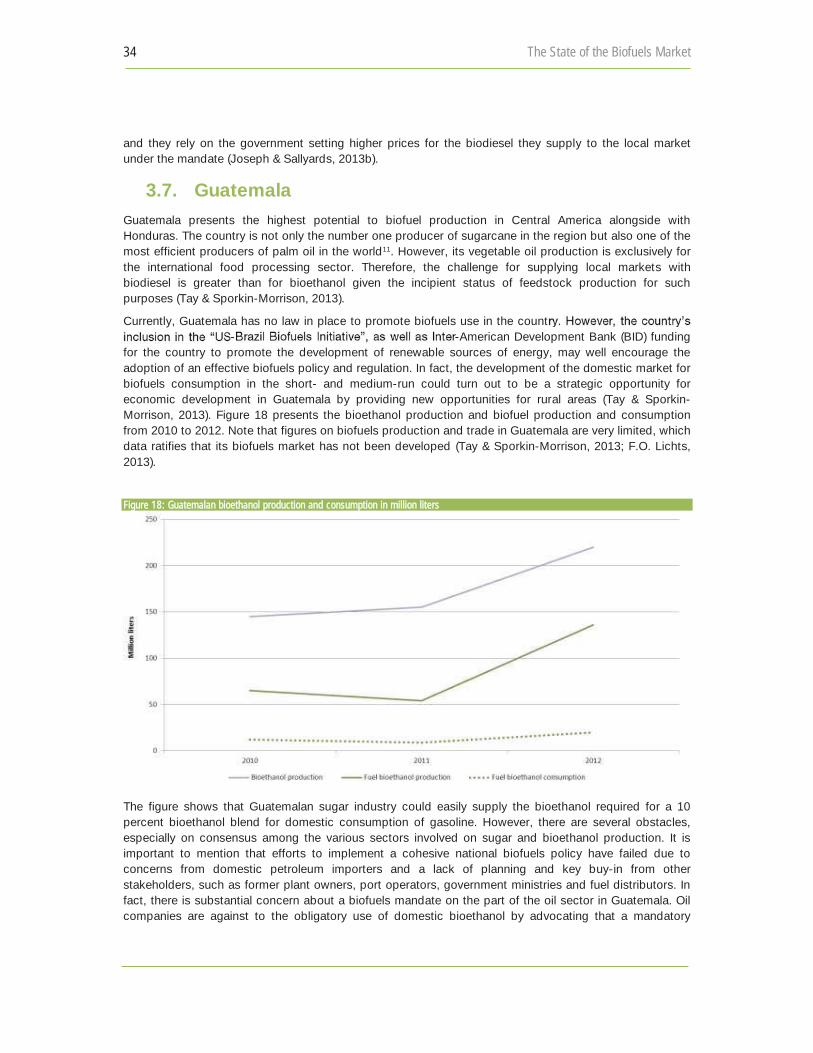
34 The State of the Biofuels Market
and they rely on the government setting higher prices for the biodiesel they supply to the local market under the mandate (Joseph & Sallyards, 2013b).
3.7. Guatemala Guatemala presents the highest potential to biofuel production in Central America alongside with Honduras. The country is not only the number one producer of sugarcane in the region but also one of the most efficient producers of palm oil in the world11. However, its vegetable oil production is exclusively for the international food processing sector. Therefore, the challenge for supplying local markets with biodiesel is greater than for bioethanol given the incipient status of feedstock production for such purposes (Tay & Sporkin-Morrison, 2013).
Currently, Guatemala has no law in place to promote biofuels use in the count- -American Development Bank (BID) funding
for the country to promote the development of renewable sources of energy, may well encourage the adoption of an effective biofuels policy and regulation. In fact, the development of the domestic market for biofuels consumption in the short- and medium-run could turn out to be a strategic opportunity for economic development in Guatemala by providing new opportunities for rural areas (Tay & Sporkin-Morrison, 2013). Figure 18 presents the bioethanol production and biofuel production and consumption from 2010 to 2012. Note that figures on biofuels production and trade in Guatemala are very limited, which data ratifies that its biofuels market has not been developed (Tay & Sporkin-Morrison, 2013; F.O. Lichts, 2013).
Figure 18: Guatemalan bioethanol production and consumption in million liters
The figure shows that Guatemalan sugar industry could easily supply the bioethanol required for a 10 percent bioethanol blend for domestic consumption of gasoline. However, there are several obstacles, especially on consensus among the various sectors involved on sugar and bioethanol production. It is important to mention that efforts to implement a cohesive national biofuels policy have failed due to concerns from domestic petroleum importers and a lack of planning and key buy-in from other stakeholders, such as former plant owners, port operators, government ministries and fuel distributors. In fact, there is substantial concern about a biofuels mandate on the part of the oil sector in Guatemala. Oil companies are against to the obligatory use of domestic bioethanol by advocating that a mandatory
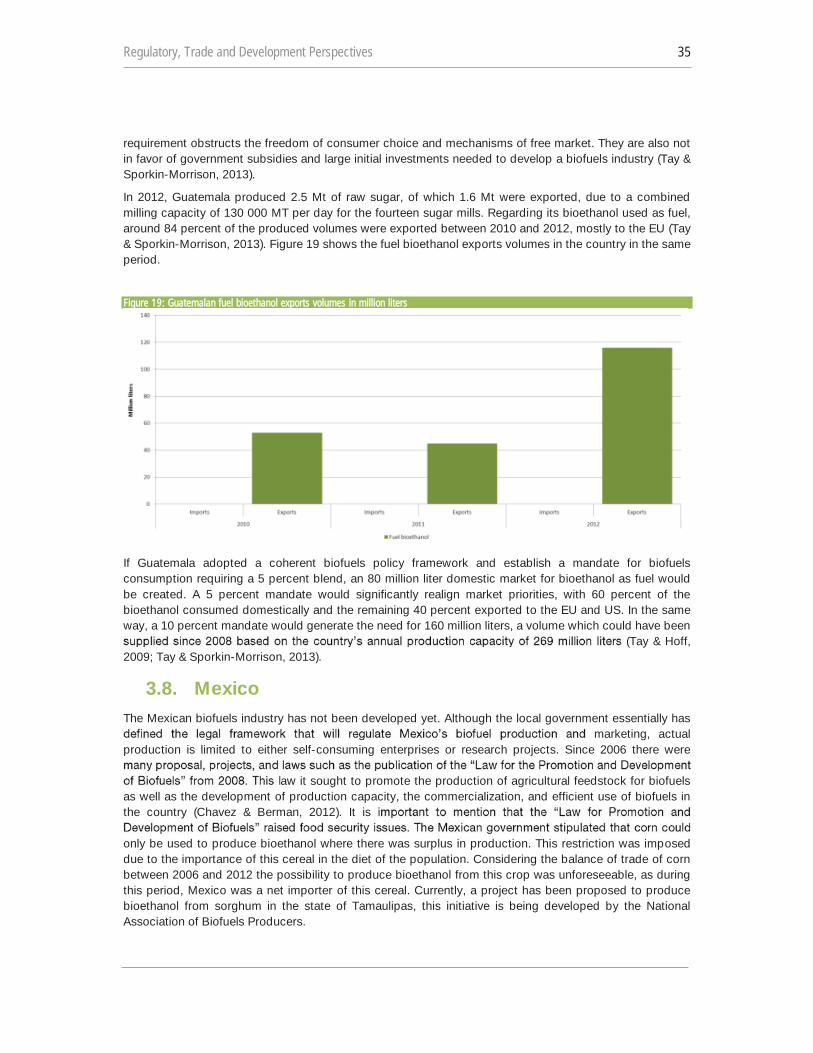
Regulatory, Trade and Development Perspectives 35
requirement obstructs the freedom of consumer choice and mechanisms of free market. They are also not in favor of government subsidies and large initial investments needed to develop a biofuels industry (Tay & Sporkin-Morrison, 2013).
In 2012, Guatemala produced 2.5 Mt of raw sugar, of which 1.6 Mt were exported, due to a combined milling capacity of 130 000 MT per day for the fourteen sugar mills. Regarding its bioethanol used as fuel, around 84 percent of the produced volumes were exported between 2010 and 2012, mostly to the EU (Tay & Sporkin-Morrison, 2013). Figure 19 shows the fuel bioethanol exports volumes in the country in the same period.
Figure 19: Guatemalan fuel bioethanol exports volumes in million liters
If Guatemala adopted a coherent biofuels policy framework and establish a mandate for biofuels consumption requiring a 5 percent blend, an 80 million liter domestic market for bioethanol as fuel would be created. A 5 percent mandate would significantly realign market priorities, with 60 percent of the bioethanol consumed domestically and the remaining 40 percent exported to the EU and US. In the same way, a 10 percent mandate would generate the need for 160 million liters, a volume which could have been
(Tay & Hoff, 2009; Tay & Sporkin-Morrison, 2013).
3.8. Mexico The Mexican biofuels industry has not been developed yet. Although the local government essentially has
marketing, actual production is limited to either self-consuming enterprises or research projects. Since 2006 there were
aw it sought to promote the production of agricultural feedstock for biofuels as well as the development of production capacity, the commercialization, and efficient use of biofuels in the country (Chavez & Berman, 2012). It is
only be used to produce bioethanol where there was surplus in production. This restriction was imposed due to the importance of this cereal in the diet of the population. Considering the balance of trade of corn between 2006 and 2012 the possibility to produce bioethanol from this crop was unforeseeable, as during this period, Mexico was a net importer of this cereal. Currently, a project has been proposed to produce bioethanol from sorghum in the state of Tamaulipas, this initiative is being developed by the National Association of Biofuels Producers.
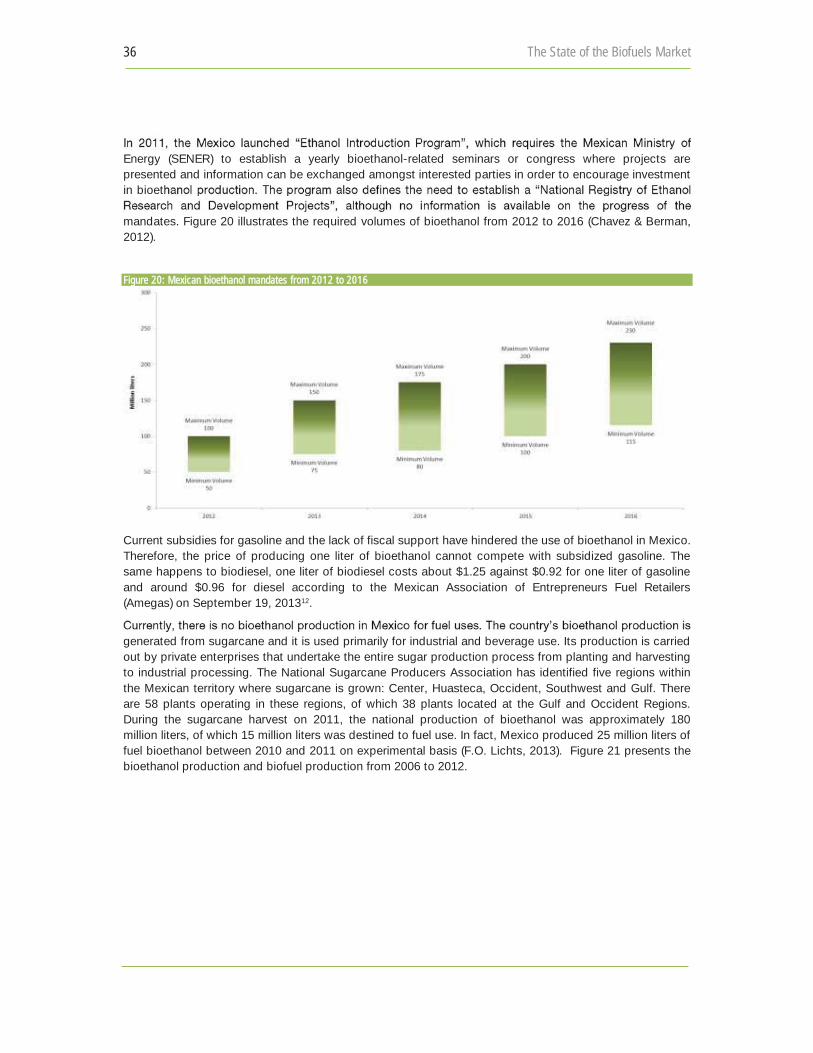
36 The State of the Biofuels Market
Energy (SENER) to establish a yearly bioethanol-related seminars or congress where projects are presented and information can be exchanged amongst interested parties in order to encourage investment in bioet
mandates. Figure 20 illustrates the required volumes of bioethanol from 2012 to 2016 (Chavez & Berman, 2012).
Figure 20: Mexican bioethanol mandates from 2012 to 2016
Current subsidies for gasoline and the lack of fiscal support have hindered the use of bioethanol in Mexico. Therefore, the price of producing one liter of bioethanol cannot compete with subsidized gasoline. The same happens to biodiesel, one liter of biodiesel costs about $1.25 against $0.92 for one liter of gasoline and around $0.96 for diesel according to the Mexican Association of Entrepreneurs Fuel Retailers (Amegas) on September 19, 201312.
generated from sugarcane and it is used primarily for industrial and beverage use. Its production is carried out by private enterprises that undertake the entire sugar production process from planting and harvesting to industrial processing. The National Sugarcane Producers Association has identified five regions within the Mexican territory where sugarcane is grown: Center, Huasteca, Occident, Southwest and Gulf. There are 58 plants operating in these regions, of which 38 plants located at the Gulf and Occident Regions. During the sugarcane harvest on 2011, the national production of bioethanol was approximately 180 million liters, of which 15 million liters was destined to fuel use. In fact, Mexico produced 25 million liters of fuel bioethanol between 2010 and 2011 on experimental basis (F.O. Lichts, 2013). Figure 21 presents the bioethanol production and biofuel production from 2006 to 2012.
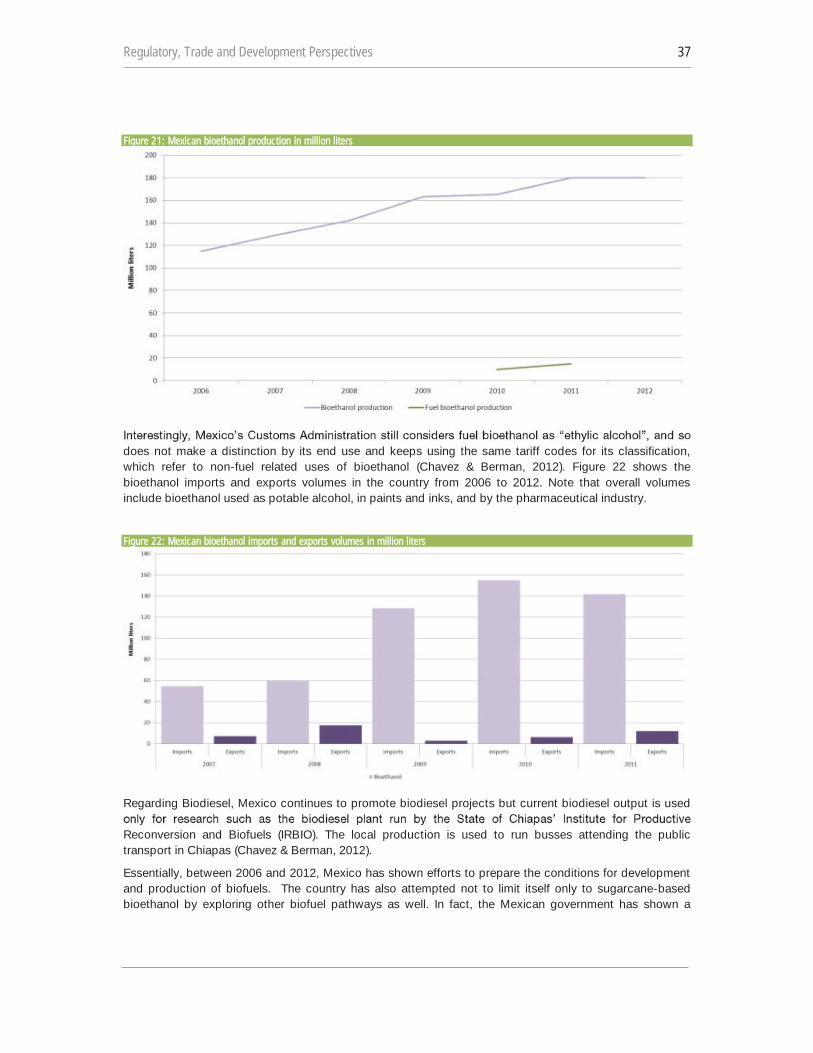
Regulatory, Trade and Development Perspectives 37
Figure 21: Mexican bioethanol production in million liters
does not make a distinction by its end use and keeps using the same tariff codes for its classification, which refer to non-fuel related uses of bioethanol (Chavez & Berman, 2012). Figure 22 shows the bioethanol imports and exports volumes in the country from 2006 to 2012. Note that overall volumes include bioethanol used as potable alcohol, in paints and inks, and by the pharmaceutical industry.
Figure 22: Mexican bioethanol imports and exports volumes in million liters
Regarding Biodiesel, Mexico continues to promote biodiesel projects but current biodiesel output is used
Reconversion and Biofuels (IRBIO). The local production is used to run busses attending the public transport in Chiapas (Chavez & Berman, 2012).
Essentially, between 2006 and 2012, Mexico has shown efforts to prepare the conditions for development and production of biofuels. The country has also attempted not to limit itself only to sugarcane-based bioethanol by exploring other biofuel pathways as well. In fact, the Mexican government has shown a
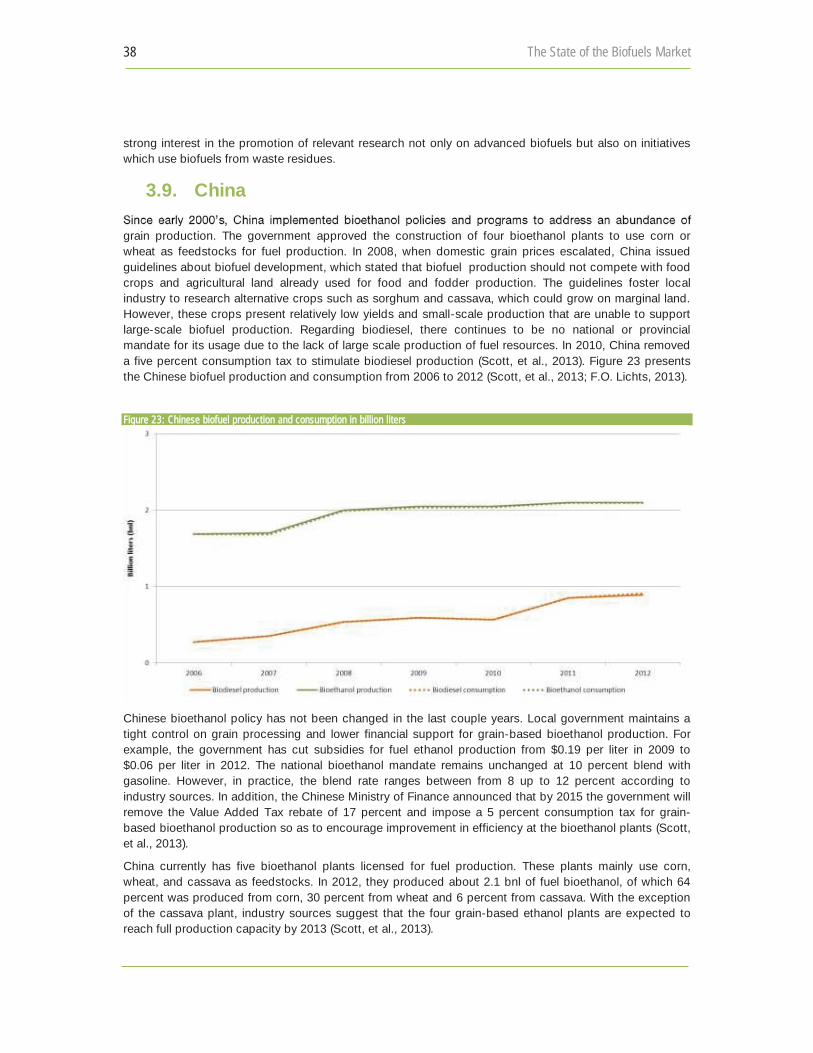
38 The State of the Biofuels Market
strong interest in the promotion of relevant research not only on advanced biofuels but also on initiatives which use biofuels from waste residues.
3.9. China
grain production. The government approved the construction of four bioethanol plants to use corn or wheat as feedstocks for fuel production. In 2008, when domestic grain prices escalated, China issued guidelines about biofuel development, which stated that biofuel production should not compete with food crops and agricultural land already used for food and fodder production. The guidelines foster local industry to research alternative crops such as sorghum and cassava, which could grow on marginal land. However, these crops present relatively low yields and small-scale production that are unable to support large-scale biofuel production. Regarding biodiesel, there continues to be no national or provincial mandate for its usage due to the lack of large scale production of fuel resources. In 2010, China removed a five percent consumption tax to stimulate biodiesel production (Scott, et al., 2013). Figure 23 presents the Chinese biofuel production and consumption from 2006 to 2012 (Scott, et al., 2013; F.O. Lichts, 2013).
Figure 23: Chinese biofuel production and consumption in billion liters
Chinese bioethanol policy has not been changed in the last couple years. Local government maintains a tight control on grain processing and lower financial support for grain-based bioethanol production. For example, the government has cut subsidies for fuel ethanol production from $0.19 per liter in 2009 to $0.06 per liter in 2012. The national bioethanol mandate remains unchanged at 10 percent blend with gasoline. However, in practice, the blend rate ranges between from 8 up to 12 percent according to industry sources. In addition, the Chinese Ministry of Finance announced that by 2015 the government will remove the Value Added Tax rebate of 17 percent and impose a 5 percent consumption tax for grain-based bioethanol production so as to encourage improvement in efficiency at the bioethanol plants (Scott, et al., 2013).
China currently has five bioethanol plants licensed for fuel production. These plants mainly use corn, wheat, and cassava as feedstocks. In 2012, they produced about 2.1 bnl of fuel bioethanol, of which 64 percent was produced from corn, 30 percent from wheat and 6 percent from cassava. With the exception of the cassava plant, industry sources suggest that the four grain-based ethanol plants are expected to reach full production capacity by 2013 (Scott, et al., 2013).
gg pppp pppp
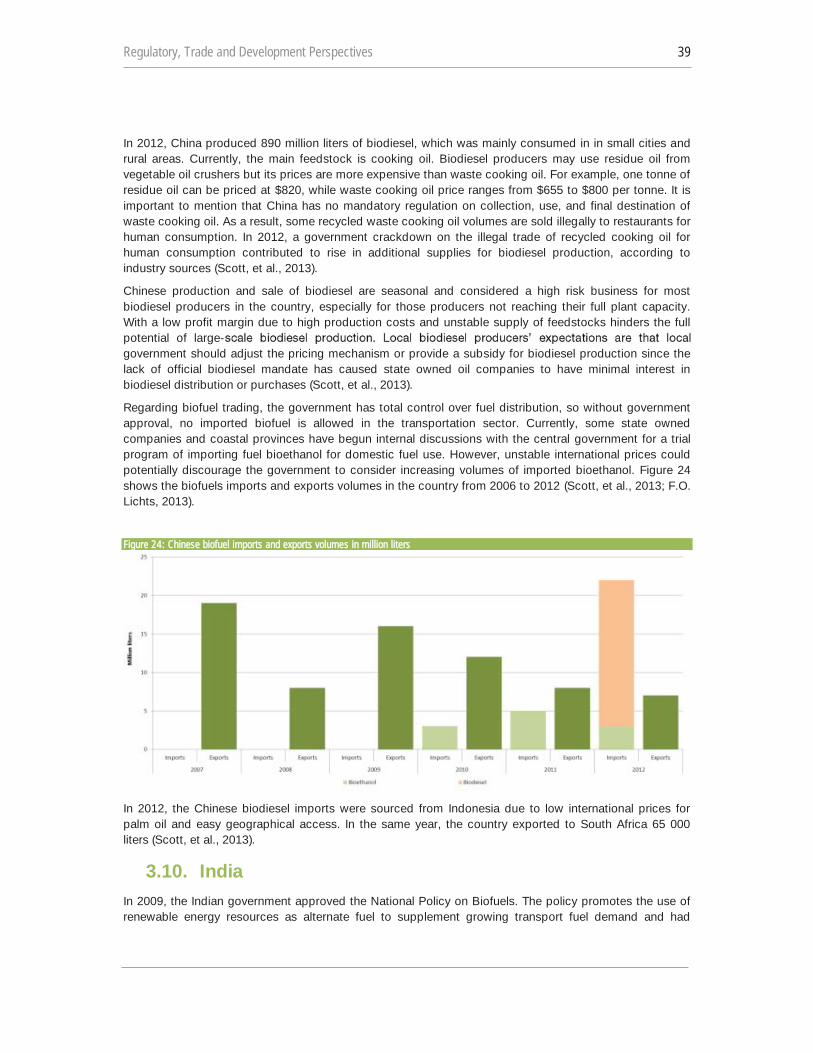
Regulatory, Trade and Development Perspectives 39
In 2012, China produced 890 million liters of biodiesel, which was mainly consumed in in small cities and rural areas. Currently, the main feedstock is cooking oil. Biodiesel producers may use residue oil from vegetable oil crushers but its prices are more expensive than waste cooking oil. For example, one tonne of residue oil can be priced at $820, while waste cooking oil price ranges from $655 to $800 per tonne. It is important to mention that China has no mandatory regulation on collection, use, and final destination of waste cooking oil. As a result, some recycled waste cooking oil volumes are sold illegally to restaurants for human consumption. In 2012, a government crackdown on the illegal trade of recycled cooking oil for human consumption contributed to rise in additional supplies for biodiesel production, according to industry sources (Scott, et al., 2013).
Chinese production and sale of biodiesel are seasonal and considered a high risk business for most biodiesel producers in the country, especially for those producers not reaching their full plant capacity. With a low profit margin due to high production costs and unstable supply of feedstocks hinders the full potential of large-government should adjust the pricing mechanism or provide a subsidy for biodiesel production since the lack of official biodiesel mandate has caused state owned oil companies to have minimal interest in biodiesel distribution or purchases (Scott, et al., 2013).
Regarding biofuel trading, the government has total control over fuel distribution, so without government approval, no imported biofuel is allowed in the transportation sector. Currently, some state owned companies and coastal provinces have begun internal discussions with the central government for a trial program of importing fuel bioethanol for domestic fuel use. However, unstable international prices could potentially discourage the government to consider increasing volumes of imported bioethanol. Figure 24 shows the biofuels imports and exports volumes in the country from 2006 to 2012 (Scott, et al., 2013; F.O. Lichts, 2013).
Figure 24: Chinese biofuel imports and exports volumes in million liters
In 2012, the Chinese biodiesel imports were sourced from Indonesia due to low international prices for palm oil and easy geographical access. In the same year, the country exported to South Africa 65 000 liters (Scott, et al., 2013).
3.10. India In 2009, the Indian government approved the National Policy on Biofuels. The policy promotes the use of renewable energy resources as alternate fuel to supplement growing transport fuel demand and had
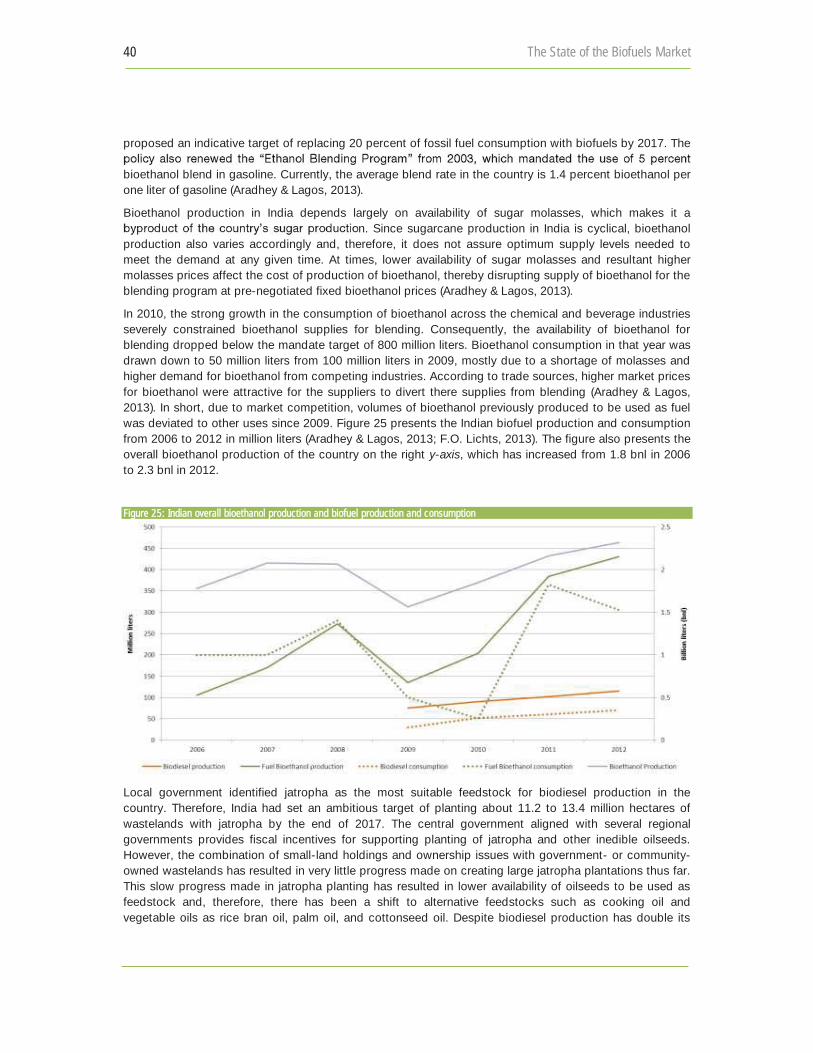
40 The State of the Biofuels Market
proposed an indicative target of replacing 20 percent of fossil fuel consumption with biofuels by 2017. The
bioethanol blend in gasoline. Currently, the average blend rate in the country is 1.4 percent bioethanol per one liter of gasoline (Aradhey & Lagos, 2013).
Bioethanol production in India depends largely on availability of sugar molasses, which makes it a n. Since sugarcane production in India is cyclical, bioethanol
production also varies accordingly and, therefore, it does not assure optimum supply levels needed to meet the demand at any given time. At times, lower availability of sugar molasses and resultant higher molasses prices affect the cost of production of bioethanol, thereby disrupting supply of bioethanol for the blending program at pre-negotiated fixed bioethanol prices (Aradhey & Lagos, 2013).
In 2010, the strong growth in the consumption of bioethanol across the chemical and beverage industries severely constrained bioethanol supplies for blending. Consequently, the availability of bioethanol for blending dropped below the mandate target of 800 million liters. Bioethanol consumption in that year was drawn down to 50 million liters from 100 million liters in 2009, mostly due to a shortage of molasses and higher demand for bioethanol from competing industries. According to trade sources, higher market prices for bioethanol were attractive for the suppliers to divert there supplies from blending (Aradhey & Lagos, 2013). In short, due to market competition, volumes of bioethanol previously produced to be used as fuel was deviated to other uses since 2009. Figure 25 presents the Indian biofuel production and consumption from 2006 to 2012 in million liters (Aradhey & Lagos, 2013; F.O. Lichts, 2013). The figure also presents the overall bioethanol production of the country on the right y-axis, which has increased from 1.8 bnl in 2006 to 2.3 bnl in 2012.
Figure 25: Indian overall bioethanol production and biofuel production and consumption
Local government identified jatropha as the most suitable feedstock for biodiesel production in the country. Therefore, India had set an ambitious target of planting about 11.2 to 13.4 million hectares of wastelands with jatropha by the end of 2017. The central government aligned with several regional governments provides fiscal incentives for supporting planting of jatropha and other inedible oilseeds. However, the combination of small-land holdings and ownership issues with government- or community-owned wastelands has resulted in very little progress made on creating large jatropha plantations thus far. This slow progress made in jatropha planting has resulted in lower availability of oilseeds to be used as feedstock and, therefore, there has been a shift to alternative feedstocks such as cooking oil and vegetable oils as rice bran oil, palm oil, and cottonseed oil. Despite biodiesel production has double its
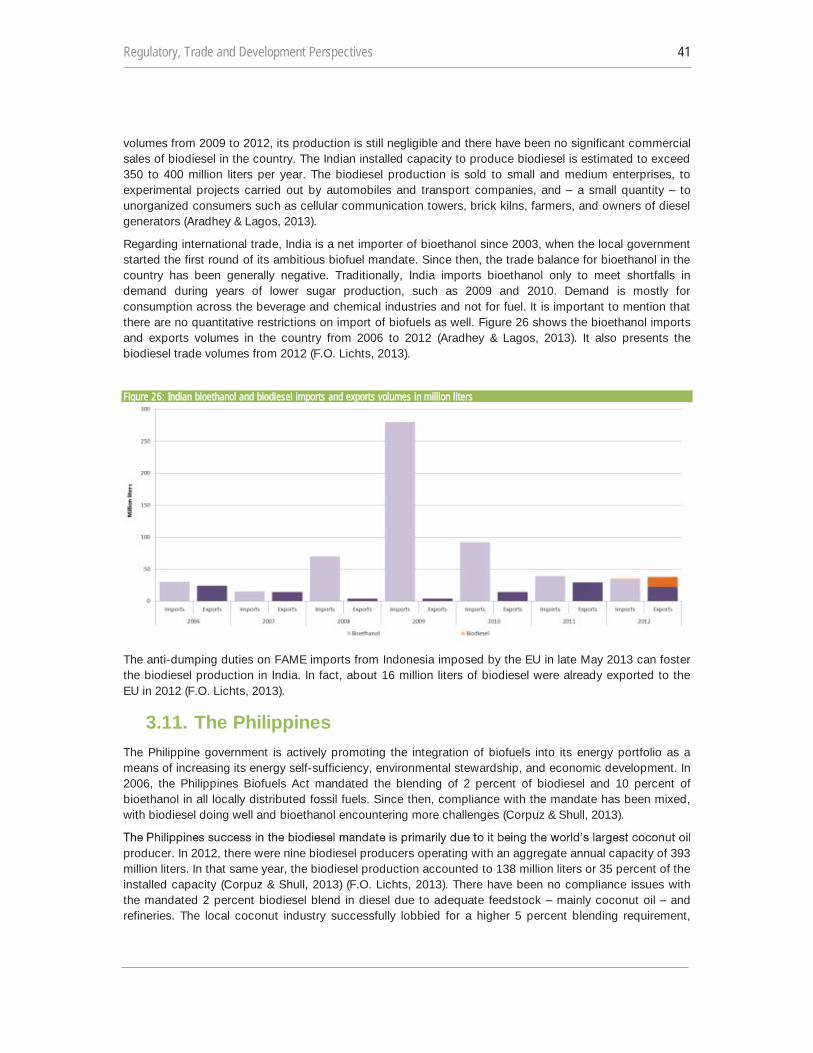
Regulatory, Trade and Development Perspectives 41
volumes from 2009 to 2012, its production is still negligible and there have been no significant commercial sales of biodiesel in the country. The Indian installed capacity to produce biodiesel is estimated to exceed 350 to 400 million liters per year. The biodiesel production is sold to small and medium enterprises, to experimental projects carried out by automobiles and transport companies, and a small quantity to unorganized consumers such as cellular communication towers, brick kilns, farmers, and owners of diesel generators (Aradhey & Lagos, 2013).
Regarding international trade, India is a net importer of bioethanol since 2003, when the local government started the first round of its ambitious biofuel mandate. Since then, the trade balance for bioethanol in the country has been generally negative. Traditionally, India imports bioethanol only to meet shortfalls in demand during years of lower sugar production, such as 2009 and 2010. Demand is mostly for consumption across the beverage and chemical industries and not for fuel. It is important to mention that there are no quantitative restrictions on import of biofuels as well. Figure 26 shows the bioethanol imports and exports volumes in the country from 2006 to 2012 (Aradhey & Lagos, 2013). It also presents the biodiesel trade volumes from 2012 (F.O. Lichts, 2013).
Figure 26: Indian bioethanol and biodiesel imports and exports volumes in million liters
The anti-dumping duties on FAME imports from Indonesia imposed by the EU in late May 2013 can foster the biodiesel production in India. In fact, about 16 million liters of biodiesel were already exported to the EU in 2012 (F.O. Lichts, 2013).
3.11. The Philippines The Philippine government is actively promoting the integration of biofuels into its energy portfolio as a means of increasing its energy self-sufficiency, environmental stewardship, and economic development. In 2006, the Philippines Biofuels Act mandated the blending of 2 percent of biodiesel and 10 percent of bioethanol in all locally distributed fossil fuels. Since then, compliance with the mandate has been mixed, with biodiesel doing well and bioethanol encountering more challenges (Corpuz & Shull, 2013).
producer. In 2012, there were nine biodiesel producers operating with an aggregate annual capacity of 393 million liters. In that same year, the biodiesel production accounted to 138 million liters or 35 percent of the installed capacity (Corpuz & Shull, 2013) (F.O. Lichts, 2013). There have been no compliance issues with the mandated 2 percent biodiesel blend in diesel due to adequate feedstock mainly coconut oil and refineries. The local coconut industry successfully lobbied for a higher 5 percent blending requirement,
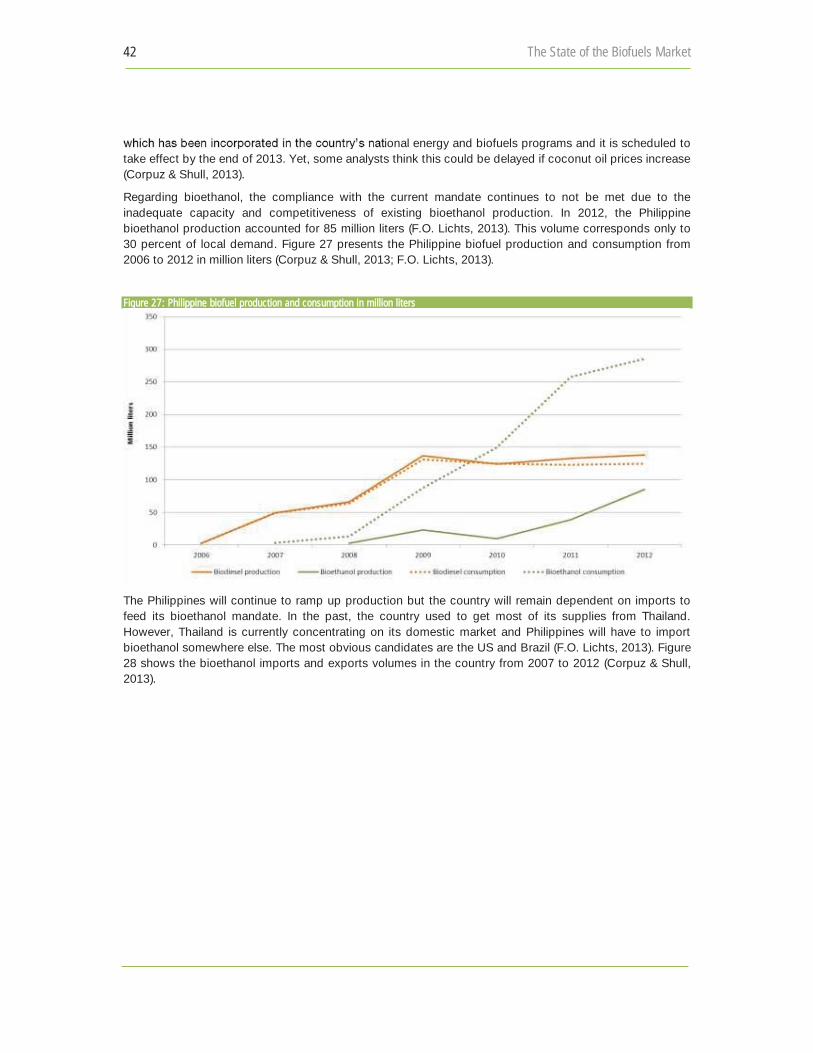
42 The State of the Biofuels Market
ional energy and biofuels programs and it is scheduled to take effect by the end of 2013. Yet, some analysts think this could be delayed if coconut oil prices increase (Corpuz & Shull, 2013).
Regarding bioethanol, the compliance with the current mandate continues to not be met due to the inadequate capacity and competitiveness of existing bioethanol production. In 2012, the Philippine bioethanol production accounted for 85 million liters (F.O. Lichts, 2013). This volume corresponds only to 30 percent of local demand. Figure 27 presents the Philippine biofuel production and consumption from 2006 to 2012 in million liters (Corpuz & Shull, 2013; F.O. Lichts, 2013).
Figure 27: Philippine biofuel production and consumption in million liters
The Philippines will continue to ramp up production but the country will remain dependent on imports to feed its bioethanol mandate. In the past, the country used to get most of its supplies from Thailand. However, Thailand is currently concentrating on its domestic market and Philippines will have to import bioethanol somewhere else. The most obvious candidates are the US and Brazil (F.O. Lichts, 2013). Figure 28 shows the bioethanol imports and exports volumes in the country from 2007 to 2012 (Corpuz & Shull, 2013).
gg pppppppp pppp pppp
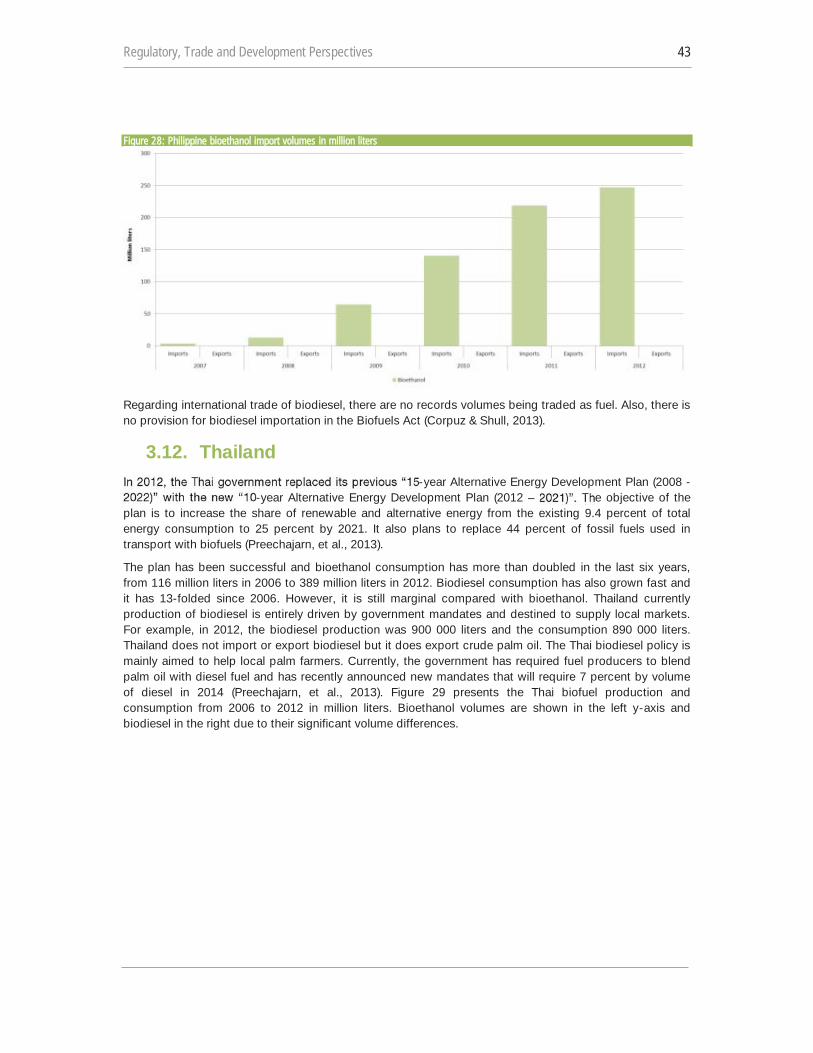
Regulatory, Trade and Development Perspectives 43
Figure 28: Philippine bioethanol import volumes in million liters
Regarding international trade of biodiesel, there are no records volumes being traded as fuel. Also, there is no provision for biodiesel importation in the Biofuels Act (Corpuz & Shull, 2013).
3.12. Thailand -year Alternative Energy Development Plan (2008 -
-year Alternative Energy Development Plan (2012 e objective of the plan is to increase the share of renewable and alternative energy from the existing 9.4 percent of total energy consumption to 25 percent by 2021. It also plans to replace 44 percent of fossil fuels used in transport with biofuels (Preechajarn, et al., 2013).
The plan has been successful and bioethanol consumption has more than doubled in the last six years, from 116 million liters in 2006 to 389 million liters in 2012. Biodiesel consumption has also grown fast and it has 13-folded since 2006. However, it is still marginal compared with bioethanol. Thailand currently production of biodiesel is entirely driven by government mandates and destined to supply local markets. For example, in 2012, the biodiesel production was 900 000 liters and the consumption 890 000 liters. Thailand does not import or export biodiesel but it does export crude palm oil. The Thai biodiesel policy is mainly aimed to help local palm farmers. Currently, the government has required fuel producers to blend palm oil with diesel fuel and has recently announced new mandates that will require 7 percent by volume of diesel in 2014 (Preechajarn, et al., 2013). Figure 29 presents the Thai biofuel production and consumption from 2006 to 2012 in million liters. Bioethanol volumes are shown in the left y-axis and biodiesel in the right due to their significant volume differences.
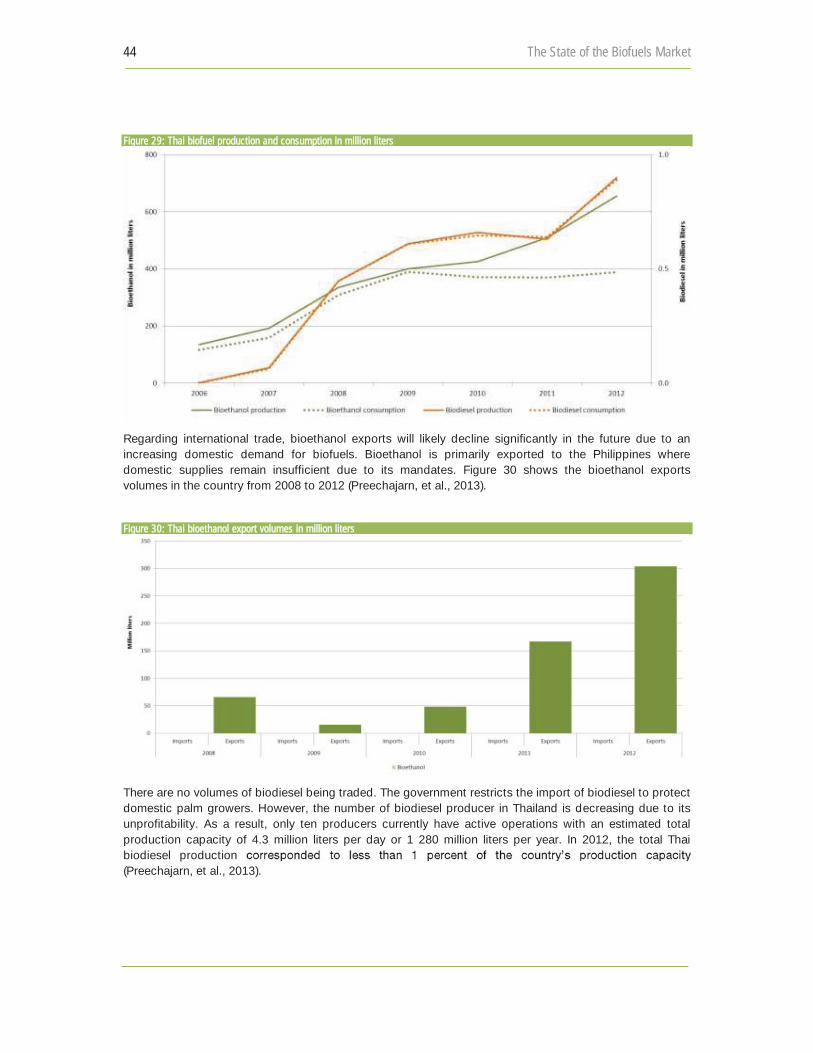
44 The State of the Biofuels Market
Figure 29: Thai biofuel production and consumption in million liters
Regarding international trade, bioethanol exports will likely decline significantly in the future due to an increasing domestic demand for biofuels. Bioethanol is primarily exported to the Philippines where domestic supplies remain insufficient due to its mandates. Figure 30 shows the bioethanol exports volumes in the country from 2008 to 2012 (Preechajarn, et al., 2013).
Figure 30: Thai bioethanol export volumes in million liters
There are no volumes of biodiesel being traded. The government restricts the import of biodiesel to protect domestic palm growers. However, the number of biodiesel producer in Thailand is decreasing due to its unprofitability. As a result, only ten producers currently have active operations with an estimated total production capacity of 4.3 million liters per day or 1 280 million liters per year. In 2012, the total Thai biodiesel production (Preechajarn, et al., 2013).
gggggg pppp pppp
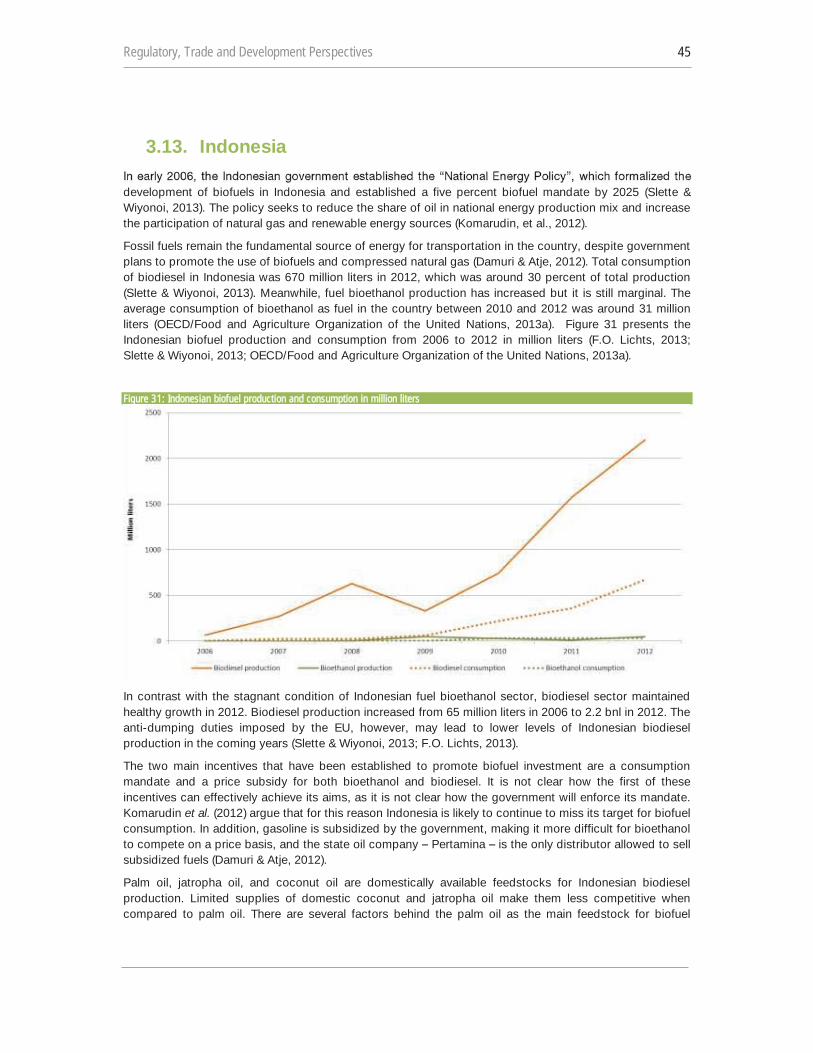
Regulatory, Trade and Development Perspectives 45
3.13. Indonesia
development of biofuels in Indonesia and established a five percent biofuel mandate by 2025 (Slette & Wiyonoi, 2013). The policy seeks to reduce the share of oil in national energy production mix and increase the participation of natural gas and renewable energy sources (Komarudin, et al., 2012).
Fossil fuels remain the fundamental source of energy for transportation in the country, despite government plans to promote the use of biofuels and compressed natural gas (Damuri & Atje, 2012). Total consumption of biodiesel in Indonesia was 670 million liters in 2012, which was around 30 percent of total production (Slette & Wiyonoi, 2013). Meanwhile, fuel bioethanol production has increased but it is still marginal. The average consumption of bioethanol as fuel in the country between 2010 and 2012 was around 31 million liters (OECD/Food and Agriculture Organization of the United Nations, 2013a). Figure 31 presents the Indonesian biofuel production and consumption from 2006 to 2012 in million liters (F.O. Lichts, 2013; Slette & Wiyonoi, 2013; OECD/Food and Agriculture Organization of the United Nations, 2013a).
Figure 31: Indonesian biofuel production and consumption in million liters
In contrast with the stagnant condition of Indonesian fuel bioethanol sector, biodiesel sector maintained healthy growth in 2012. Biodiesel production increased from 65 million liters in 2006 to 2.2 bnl in 2012. The anti-dumping duties imposed by the EU, however, may lead to lower levels of Indonesian biodiesel production in the coming years (Slette & Wiyonoi, 2013; F.O. Lichts, 2013).
The two main incentives that have been established to promote biofuel investment are a consumption mandate and a price subsidy for both bioethanol and biodiesel. It is not clear how the first of these incentives can effectively achieve its aims, as it is not clear how the government will enforce its mandate. Komarudin et al. (2012) argue that for this reason Indonesia is likely to continue to miss its target for biofuel consumption. In addition, gasoline is subsidized by the government, making it more difficult for bioethanol to compete on a price basis, and the state oil company Pertamina is the only distributor allowed to sell subsidized fuels (Damuri & Atje, 2012).
Palm oil, jatropha oil, and coconut oil are domestically available feedstocks for Indonesian biodiesel production. Limited supplies of domestic coconut and jatropha oil make them less competitive when compared to palm oil. There are several factors behind the palm oil as the main feedstock for biofuel
gg pppp pppp
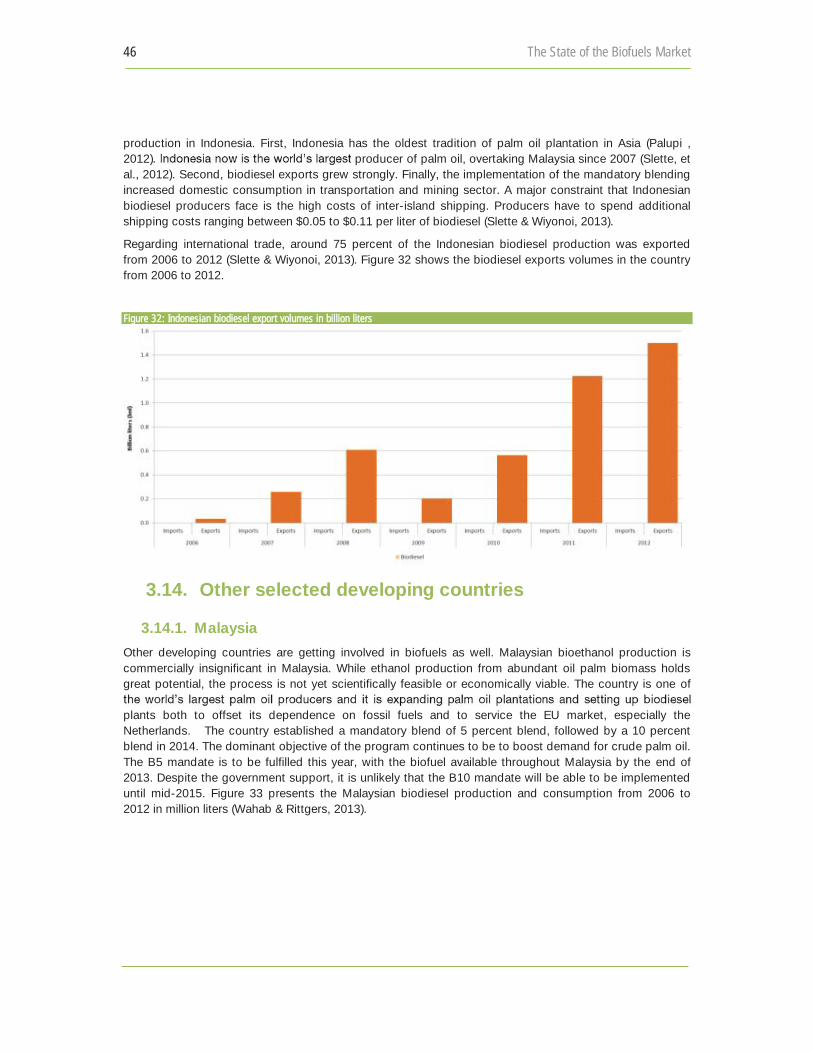
46 The State of the Biofuels Market
production in Indonesia. First, Indonesia has the oldest tradition of palm oil plantation in Asia (Palupi , 2012) producer of palm oil, overtaking Malaysia since 2007 (Slette, et al., 2012). Second, biodiesel exports grew strongly. Finally, the implementation of the mandatory blending increased domestic consumption in transportation and mining sector. A major constraint that Indonesian biodiesel producers face is the high costs of inter-island shipping. Producers have to spend additional shipping costs ranging between $0.05 to $0.11 per liter of biodiesel (Slette & Wiyonoi, 2013).
Regarding international trade, around 75 percent of the Indonesian biodiesel production was exported from 2006 to 2012 (Slette & Wiyonoi, 2013). Figure 32 shows the biodiesel exports volumes in the country from 2006 to 2012.
Figure 32: Indonesian biodiesel export volumes in billion liters
3.14. Other selected developing countries
3.14.1. Malaysia Other developing countries are getting involved in biofuels as well. Malaysian bioethanol production is commercially insignificant in Malaysia. While ethanol production from abundant oil palm biomass holds great potential, the process is not yet scientifically feasible or economically viable. The country is one of
plants both to offset its dependence on fossil fuels and to service the EU market, especially the Netherlands. The country established a mandatory blend of 5 percent blend, followed by a 10 percent blend in 2014. The dominant objective of the program continues to be to boost demand for crude palm oil. The B5 mandate is to be fulfilled this year, with the biofuel available throughout Malaysia by the end of 2013. Despite the government support, it is unlikely that the B10 mandate will be able to be implemented until mid-2015. Figure 33 presents the Malaysian biodiesel production and consumption from 2006 to 2012 in million liters (Wahab & Rittgers, 2013).
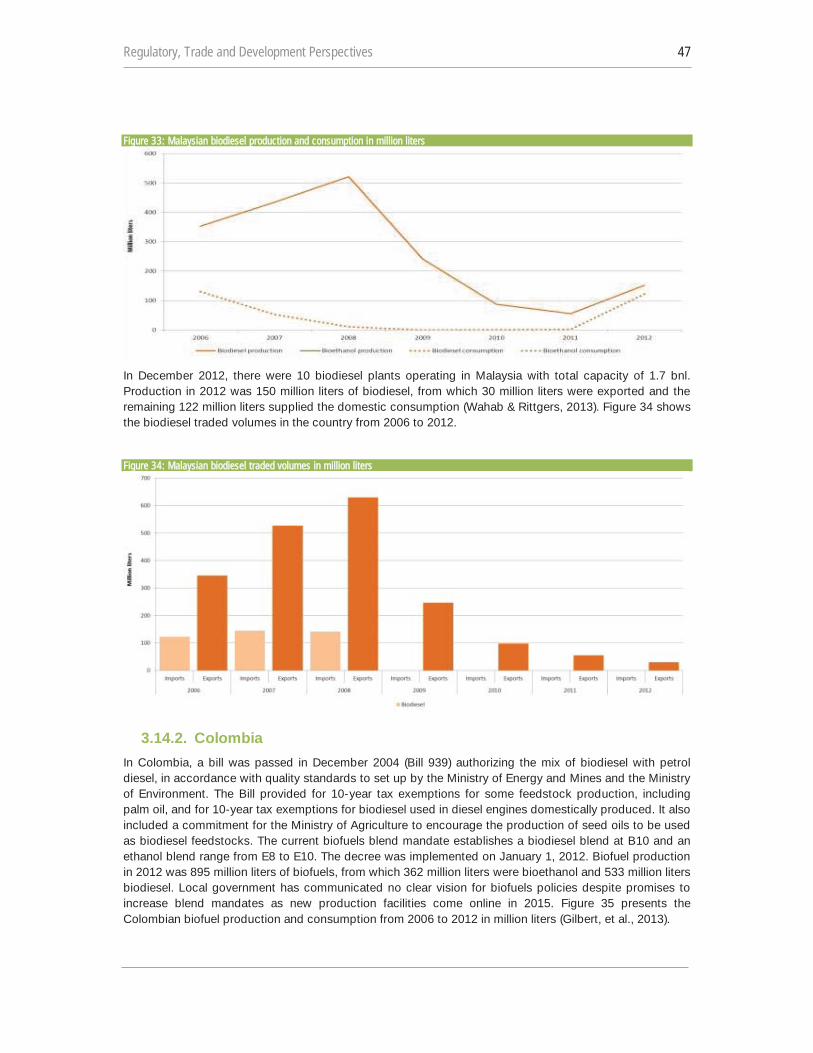
Regulatory, Trade and Development Perspectives 47
Figure 33: Malaysian biodiesel production and consumption in million liters
In December 2012, there were 10 biodiesel plants operating in Malaysia with total capacity of 1.7 bnl. Production in 2012 was 150 million liters of biodiesel, from which 30 million liters were exported and the remaining 122 million liters supplied the domestic consumption (Wahab & Rittgers, 2013). Figure 34 shows the biodiesel traded volumes in the country from 2006 to 2012.
Figure 34: Malaysian biodiesel traded volumes in million liters
3.14.2. Colombia In Colombia, a bill was passed in December 2004 (Bill 939) authorizing the mix of biodiesel with petrol diesel, in accordance with quality standards to set up by the Ministry of Energy and Mines and the Ministry of Environment. The Bill provided for 10-year tax exemptions for some feedstock production, including palm oil, and for 10-year tax exemptions for biodiesel used in diesel engines domestically produced. It also included a commitment for the Ministry of Agriculture to encourage the production of seed oils to be used as biodiesel feedstocks. The current biofuels blend mandate establishes a biodiesel blend at B10 and an ethanol blend range from E8 to E10. The decree was implemented on January 1, 2012. Biofuel production in 2012 was 895 million liters of biofuels, from which 362 million liters were bioethanol and 533 million liters biodiesel. Local government has communicated no clear vision for biofuels policies despite promises to increase blend mandates as new production facilities come online in 2015. Figure 35 presents the Colombian biofuel production and consumption from 2006 to 2012 in million liters (Gilbert, et al., 2013).
gggggg yyyyyy pppp pppp
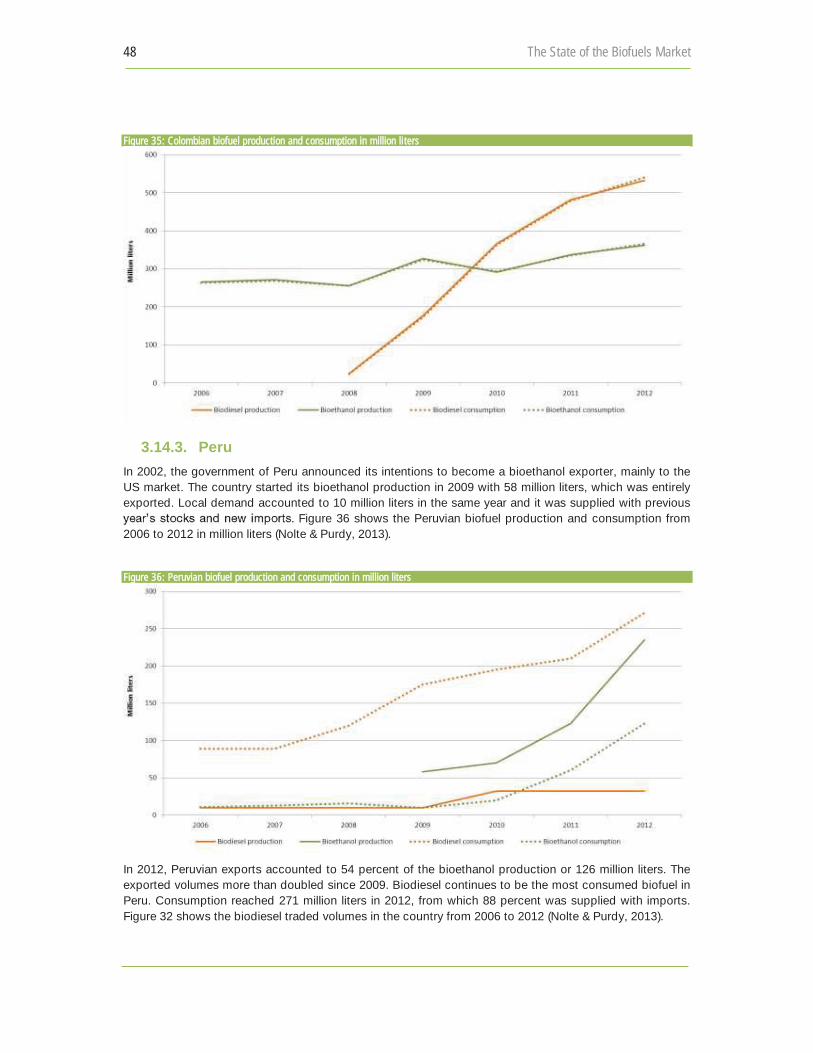
48 The State of the Biofuels Market
Figure 35: Colombian biofuel production and consumption in million li ters
3.14.3. Peru In 2002, the government of Peru announced its intentions to become a bioethanol exporter, mainly to the US market. The country started its bioethanol production in 2009 with 58 million liters, which was entirely exported. Local demand accounted to 10 million liters in the same year and it was supplied with previous
Figure 36 shows the Peruvian biofuel production and consumption from 2006 to 2012 in million liters (Nolte & Purdy, 2013).
Figure 36: Peruvian biofuel production and consumption in million liters
In 2012, Peruvian exports accounted to 54 percent of the bioethanol production or 126 million liters. The exported volumes more than doubled since 2009. Biodiesel continues to be the most consumed biofuel in Peru. Consumption reached 271 million liters in 2012, from which 88 percent was supplied with imports. Figure 32 shows the biodiesel traded volumes in the country from 2006 to 2012 (Nolte & Purdy, 2013).
gggggg pppp pppp
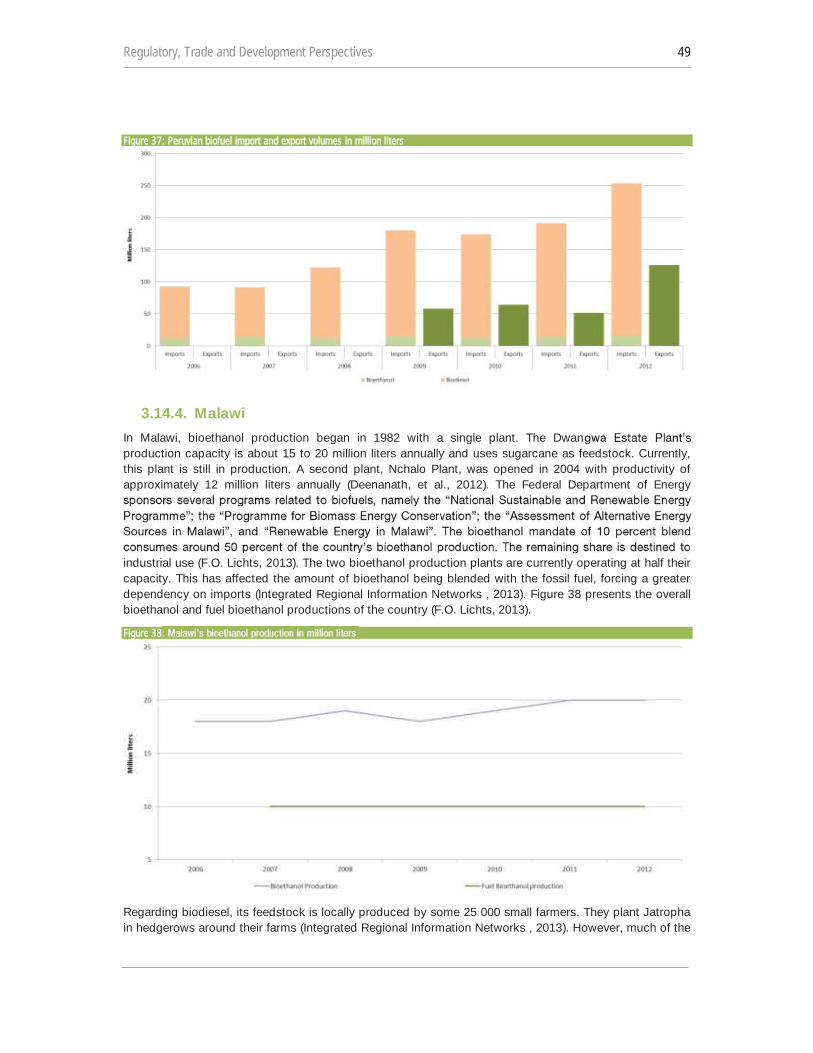
Regulatory, Trade and Development Perspectives 49
Figure 37: Peruvian biofuel import and export volumes in million liters
3.14.4. Malawi In Malawi, bioethanol production began in 1982 with a single plant. The Dwanproduction capacity is about 15 to 20 million liters annually and uses sugarcane as feedstock. Currently, this plant is still in production. A second plant, Nchalo Plant, was opened in 2004 with productivity of approximately 12 million liters annually (Deenanath, et al., 2012). The Federal Department of Energy
industrial use (F.O. Lichts, 2013). The two bioethanol production plants are currently operating at half their capacity. This has affected the amount of bioethanol being blended with the fossil fuel, forcing a greater dependency on imports (Integrated Regional Information Networks , 2013). Figure 38 presents the overall bioethanol and fuel bioethanol productions of the country (F.O. Lichts, 2013).
Figure 38
Regarding biodiesel, its feedstock is locally produced by some 25 000 small farmers. They plant Jatropha in hedgerows around their farms (Integrated Regional Information Networks , 2013). However, much of the

50 The State of the Biofuels Market
recent activity in feedstocks for biodiesel cultivation is the result of a private company's initiative which gives farmers free Jatropha trees to plant along with an engagement to later buy the Jatropha oil harvested for biofuel processing. The farmers, not the private company, retain ownership of both the land and the trees. The Biodiesel Agricultural Association serves as liaison between the private company and the Malawian farming community. The association has embarked on a nationwide campaign to discuss the
crops in order to maximize their economic potential. However, a chicken and egg situation is still
their production to Jatropha in the absence of processing facilities, and investors are hesitant to build processing facilities before feedstocks become available. The same situation is almost always true in many developing countries.
3.14.5. Mauritius The government of Mauritius is restructuring its sugar sector to become more competitive. In order to do so, local government, in consultation with stakeholders of the sugar industry, defined the Multi Annual Adaptation Strategy (MAAS) Action Plan 2006-2015. The main objective is to convert the sugar industry into a sugarcane cluster, meaning from an essentially raw sugar manufacturer to a producer of various types of sugar, cogenerated electricity from bagasse, and ethanol from molasses (Kong-Win Chang, 2013).
In Mauritius, about 25 percent of sugarcane molasses is used for rum production and the remaining share is used almost entirely to sugar production or exported as raw material. Fuel bioethanol production was first carried out by Alcodis in Rose-Belle in 2003. However, due to various reasons, the project was unsuccessful and the distillery was shut down around four years later. A large-scale bioethanol production in Mauritius is not currently attractive since low logistic cost of molasses within the island results in relatively good export prices for this commodity. The transport sector is therefore still entirely dependent on imported fossil fuels (Kong-Win Chang, 2013). Figure 39 million liters from 2006 to 2012 (F.O. Lichts, 2013).
Figure 39
Regarding biodiesel, the country is moving slowly from pilot plants to industrial size. Biodiesel use is marginal and the country imported around 7 million liters from Argentina in 2012 (F.O. Lichts, 2013).
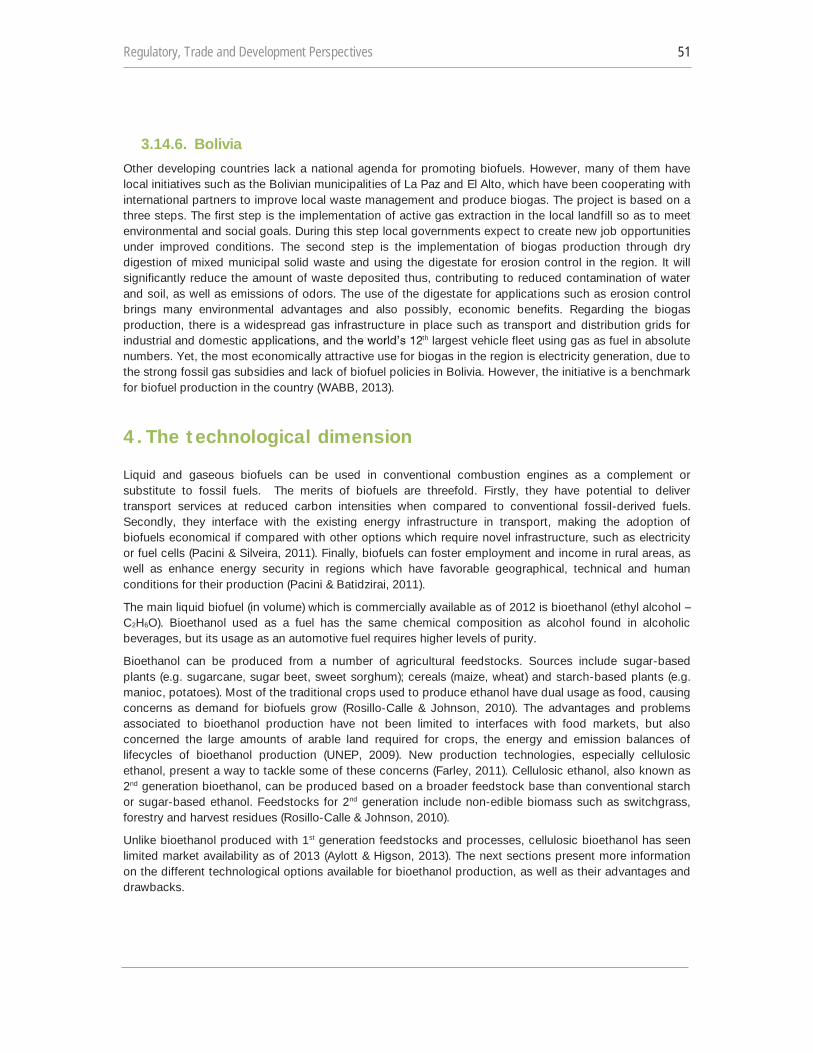
Regulatory, Trade and Development Perspectives 51
3.14.6. Bolivia Other developing countries lack a national agenda for promoting biofuels. However, many of them have local initiatives such as the Bolivian municipalities of La Paz and El Alto, which have been cooperating with international partners to improve local waste management and produce biogas. The project is based on a three steps. The first step is the implementation of active gas extraction in the local landfill so as to meet environmental and social goals. During this step local governments expect to create new job opportunities under improved conditions. The second step is the implementation of biogas production through dry digestion of mixed municipal solid waste and using the digestate for erosion control in the region. It will significantly reduce the amount of waste deposited thus, contributing to reduced contamination of water and soil, as well as emissions of odors. The use of the digestate for applications such as erosion control brings many environmental advantages and also possibly, economic benefits. Regarding the biogas production, there is a widespread gas infrastructure in place such as transport and distribution grids for industrial and domestic th largest vehicle fleet using gas as fuel in absolute numbers. Yet, the most economically attractive use for biogas in the region is electricity generation, due to the strong fossil gas subsidies and lack of biofuel policies in Bolivia. However, the initiative is a benchmark for biofuel production in the country (WABB, 2013).
4. The technological dimension
Liquid and gaseous biofuels can be used in conventional combustion engines as a complement or substitute to fossil fuels. The merits of biofuels are threefold. Firstly, they have potential to deliver transport services at reduced carbon intensities when compared to conventional fossil-derived fuels. Secondly, they interface with the existing energy infrastructure in transport, making the adoption of biofuels economical if compared with other options which require novel infrastructure, such as electricity or fuel cells (Pacini & Silveira, 2011). Finally, biofuels can foster employment and income in rural areas, as well as enhance energy security in regions which have favorable geographical, technical and human conditions for their production (Pacini & Batidzirai, 2011).
The main liquid biofuel (in volume) which is commercially available as of 2012 is bioethanol (ethyl alcohol C2H6O). Bioethanol used as a fuel has the same chemical composition as alcohol found in alcoholic beverages, but its usage as an automotive fuel requires higher levels of purity.
Bioethanol can be produced from a number of agricultural feedstocks. Sources include sugar-based plants (e.g. sugarcane, sugar beet, sweet sorghum); cereals (maize, wheat) and starch-based plants (e.g. manioc, potatoes). Most of the traditional crops used to produce ethanol have dual usage as food, causing concerns as demand for biofuels grow (Rosillo-Calle & Johnson, 2010). The advantages and problems associated to bioethanol production have not been limited to interfaces with food markets, but also concerned the large amounts of arable land required for crops, the energy and emission balances of lifecycles of bioethanol production (UNEP, 2009). New production technologies, especially cellulosic ethanol, present a way to tackle some of these concerns (Farley, 2011). Cellulosic ethanol, also known as 2nd generation bioethanol, can be produced based on a broader feedstock base than conventional starch or sugar-based ethanol. Feedstocks for 2nd generation include non-edible biomass such as switchgrass, forestry and harvest residues (Rosillo-Calle & Johnson, 2010).
Unlike bioethanol produced with 1st generation feedstocks and processes, cellulosic bioethanol has seen limited market availability as of 2013 (Aylott & Higson, 2013). The next sections present more information on the different technological options available for bioethanol production, as well as their advantages and drawbacks.
52 The State of the Biofuels Market
4.1. First-generation biofuel technologies Biofuels of 1st generation consist of three main types. The first type corresponds to petroleum-gasoline substitutes produced via biological fermentation of starch and sugar-rich crops (e.g. corn, sugar beet, sugarcane). The second type relates to petroleum-diesel substitutes, such as straight vegetable oil and biodiesel (e.g. FAME, FAEE, RME and SME) produced by transesterification of plant oils and fatty residues (e.g. soy, palm, jatropha, used cooking oil and animal fats). The third type corresponds to natural gas substitutes such as biogas, generally produced via anaerobic digestion of organic matter (Monreal, 2008; UNCTAD, 2008; International Energy Agency, 2010a).
First generation processes are based on mature technologies, relying on relatively simple processing equipment, modest investment per unit of production and can achieve favorable economics at smaller production scales. They represent the bulk of commercial biofuels as of 2013.
In spite of their relative ease of production, 1st generation biofuels have important limitations, especially for countries with limited availability of farmland. According to UNCTAD (2008) starch-based 1st generation biofuels have the lowest land use efficiency. When measured in the energy production achievable with one hectare of land, sugar-based 1st generation biofuels fare slightly better, with about the double of the land-use efficiency. 2nd generation biofuels, discussed in the next section provide an additional increase of 50 percent or more in land-use efficiency. In terms of net energy balances, 1st generation biofuels have generally lower performance (i.e. require higher amounts of fossil energy inputs for each unit of energy output delivered) than 2nd generation biofuels.
Most 1st generation biofuel production processes today depend on crops with dual usage as both energy and food purposes, which augmenting risks related to food security and affordability. While 1st-gen processes might promote employment in production areas, the jobs created can command low or high wages depending on the level of training and sophistication of agroindustrial processes (Red Mexicana de Bionergía, 2011; Neves & Chabbad, 2012). In addition to the social risks arising from competition between the food and energy markets, an additional economic argument adds caution to the expansion of 1st generation biofuels production; while production based on dual-purpose crops (food and fuel) provide ample markets, the usage of food crops for biofuel purposes imply in somewhat uncompetitive production due to the high costs of feedstock (SENER, 2006; UNCTAD, 2008). With 2nd generation feedstocks, such as the bulk of agricultural residues and forestry biomass, this trade-off is avoided.
Some 1st generation technologies can however be readily applied to convert non-food biomass. Examples consist of biogas production via anaerobic digestion of biomass, and biodiesel production from residual animal fats and vegetable oil. Those can be both relatively straightforward to deploy if coupled with conducive incentives, as illustrated by numerous successful cases around the world (Møller & Martinsen,
.
4.2. Second-generation biofuel technologies Moving from 1st generation (sugar-rich) to 2nd generation (cellulose and hemicellulose-rich feedstocks) has some major advantages, including (i) a much larger array of feedstock options; (ii) less competition on land use, and (iii) greater environmental benefits due to the possibility to use the feedstocks to power the process of conversion from biomass to fuels.
Cellulose-rich feedstocks comprise agricultural wastes, including those produced during production of food crops and forest products (e.g. straw and leaves) and those resulting from conventional bioethanol production (e.g. wheat straw, maize stover, rice straw and bagasse) and forest residues, such as under-utilized wood and logging residues, dead wood and excess small trees. They also include municipal solid wastes, such as wood, paper, cardboard and waste fabrics; wastes from the pulp and paper processes; and energy crops, such as switchgrass, miscanthus, hybrid poplar and willow.
Regulatory, Trade and Development Perspectives 53
Grasses and woody crops can be grown in a large range of lands, as opposed to conventional biofuel crops that require specific soil and climate conditions. Forest and agricultural crops residues are largely available and can supply an increasing amount of biomass for biofuels production without displacing land from other uses.
Finally, the lignin residues that remain after extracting the cellulose and hemicellulose from the plant can be used as boiler fuel to provide the energy that is required to convert cellulose into alcohol.
These technological developments may have far-reaching implications for rural economies. They imply that one can start to diversify the sources of biomass and move beyond those which are high in calorific value or have readily available sugars.
Biofuels of 2nd generation can be classified in three main types (UNCTAD, 2008). The first type corresponds to those produced via biochemical processes delivering petroleum-gasoline substitutes, such as alcohols (e.g. ethanol or butanol) produced by enzymatic hydrolysis. A second type of gasoline substitutes are those produced when biomass is subject to thermochemical processes, including methanol, Fischer-Tropsch gasoline and mixed alcohols. A third type of 2nd generation biofuels can be classified as petroleum-diesel substitutes produced by thermochemical processes, such as Fischer-Tropsch diesel, Dimethyl ether and other varieties of green diesel13. This basic taxonomy still remains largely valid as of 2013.
While 2nd generation biofuels are mostly based on lower-cost, residual and non-edible biomass, they still depend on skilled human capital and sophisticated technologies for their production. These results in larger capital costs per unit of production when compared to biofuels produced through 1st generation processes. On the other hand, lower-cost feedstocks tend to offset the larger capital costs of 2nd generation and bring costs down once technologies mature, akin to the cost-learning process seen in the Brazilian ethanol industry (Goldemberg, et al., 2004).
Much of the potential held in 2nd generation biofuels, which exploit agricultural residues and non-edible biomass such as forestry resources, still depends on emerging technological solutions. Unlike sugar, starch and oil-rich plants (e.g. sugarcane, corn and soybeans), agricultural residues like foliage, straw, leftover cereal shells, slaughter residues and residual oil often require more complex - and costly - conversion methods to be turned into useful biofuels. 2nd generation biofuels have only started to be available in commercial scales in 2013. US EPA called for 22.7 million liters of cellulosic ethanol to be blended in the gasoline pool in 2013 in the US. Producers like KiOR, ZeaChem and INEOS were already operating and producing cellulosic ethanol in the country as of 2013. Yet, this volume of cellulosic ethanol corresponds to less than 0.04 percent of the total bioethanol production in the US in 2013, which relies almost entirely on 1st generation fuel.
Second generation projects and research have not been an exclusivity of developed countries, tough. A number of pilot and demonstration plants are operating in places beyond North America and Europe, such as Brazil, China, Thailand and Mexico, all of which have the technology and human capital necessary to investigate and deploy technologies associated to 2nd generation processes (International Energy Agency, 2010a; Red Mexicana de Bionergía, 2011).
In face of a number of parallel efforts being undertaken in by countries to improve technologies and bring down costs of 2nd generation biofuels, it might be difficult and costly for developing countries alone to engage in all Research & Development (R&D), demonstration and deployment phases of 2nd-gen technologies. Given the necessity to develop 2nd generation processes which are suitable for the developing country contexts and available feedstocks, it could be highly interesting for countries to engage in regional and international cooperation, aimed at scaling up potential markets, promoting technology transfer and sharing of R&D costs.
Furthermore, as suggested by UNCTAD (2008) and Andersen (2011), for successful bioenergy technology adoption and adaptation, it is essential for developing countries to have a technology innovation system in
54 The State of the Biofuels Market
place, as well as mechanisms to allow regional cooperation and scales beyond those limited by national markets. Innovation systems refers to the consolidation of a broad set of activities and institutions, including (a) research universities/institutes generating fundamental knowledge and assimilating knowledge from the global community; (b) industries with the capacity to form joint ventures with foreign companies and to introduce innovation and learning into shared technologies; (c) government agencies able to recognize and support the required research and technology adaptation needs; and (d) a technology-informed public policymaking system.
Since 1st generation biofuel technologies often depend on edible crops as feedstocks, they can conflict with land tenure and food supply. Therefore, special emphasis of public efforts on fostering 2nd generation biofuels may be appropriate for the longer run. The development of competitive 2nd generation biofuel industries could be facilitated by the establishment of regulatory mandates for biofuel use. Direct financial incentives including grants for research, development and demonstration, or biofuel price subsidies
g. tied to oil prices and with finite durations) should be designed into such provisions.
An important aspect of the biofuels industry from 2014 onwards will be how to avoid the emergence of further technological gaps between countries. While many developed countries and regions like the US, the EU and advanced developing countries like Brazil, India and China have all invested in 2nd generation biofuels, many poorer developing countries and LDCs have been mostly absent of this technological race. In order to avoid a growing disparity between country capacities in this area, intermediate steps could be taken. The first involves policies supportive of international joint ventures which can help provide access to intellectual property owned by international companies, as well as improve regulatory climates attractive of investment in poorer countries. By often having natural environments conducive for biomass production, developing country partners in international joint ventures might contribute host sites for demonstration and first commercial plants, as well as avenues for entering local biofuels markets (UNCTAD, 2008).
Another possibility, as mentioned by Batidzirai et al. (2012) is to use initially less sophisticated technologies to create markets for 2nd generation biofuels. As an example, pre-treated biomass such as pellets have large export markets in developed countries and can help generate economic momentum which can aid in progress towards 2nd generation production in places like Africa. The same authors point at rationalization in agricultural production, as well as improved logistics as key factors to ensure competitive biomass supply.
Research and development of 2nd generation biofuels is a costly endeavor. This put emphasis on international partnerships to both share R&D costs and provide mutual demand for advanced biofuels in a broader geographic area.
Regulatory, Trade and Development Perspectives 55
5. Support measures
As biofuels are often more costly to produce than fossil fuels, conventional business-as-usual trends based on existing technologies are unlikely to lead to substantive incorporation of biofuels into national energy matrices (Lundgren, et al., 2008). Support measures are therefore needed to provide incentives for the adoption of biofuels.
Despite uncertainties concerning sustainability, pressure factors such as volatile fossil energy prices, the wards a strong
regulatory push for biofuels in political agendas of different governments since 2005 (Martinot, 2006). Major global players have written biofuels into their national energy legislations. The US adopted its Energy Policy act in 2005, adopting the National Renewable Fuel Standard which meant a shift from MTBE to Ethanol as a gasoline oxygenate. The US drive for biofuels was strengthened by the Energy Independence and Security act of 2007, which effectively contributed to a 10 percent bioethanol blend in all gasoline sold in the US after 2010. The EU started even earlier, with a formal directive fostering biofuels adopted already in 2003 and a new directive with stronger provisions adopted in 2009 (European Union, 2003b; European Union, 2009a).
Box 3 biofuels technology related trade regimes
Mexico has had significant cooperation with multilateral banks and international agencies to survey its potential for a biofuels industry. The German Technological Cooperation Enterprise
private investors and government-backed groups approached the Inter-American Development Bank (IADB) for loans relating to the production of a sweet sorghum-based bioethanol mill and jatropha-based biodiesel. PEMEX also applied for financing from the IADB in order to train its distributors and service providers (UNCTAD, 2013).
Private market agents already have cross-border business relations in the Mexican sugarcane industry. The Brazilian company DEDINI, a large industrial equipment supplier for bioethanol and sugar processes, had large commercial transactions with the Mexican group Piasa in 2007. High level meetings took place between Presidents Lula and Felipe Calderon, who in August 2007 signed a cooperation agreement for producing biofuels, including research cooperation on advanced and residue-based biofuels. Soon after, the Mexican government invited a Brazilian technical mission to discuss ethanol, which took place via the Mexican export promotion agency (ProMexico) in 2009 (UNCTAD, 2013).
Mexico has also engaged in biofuels cooperation with other countries in the Latin American Region. The Mexican state of Chiapas is participating in the Mesoamerica project, aimed at promoting inter-regional connections of transport, telecommunications and energy networks in Central America. A special initiative within the project is the Mesoamerican biofuels program (Programa Mesoamericano de Biocombustibles), which is based on the installation of pilot plants for the production of biofuels using non-food feedstocks. The project is developed in partnership with a network of universities responsible for research and technology transfer. At the first stage, three biofuel plants were installed in Central America (Honduras using palm, El Salvador using castor beans and one pending in Guatemala using Jatropha). These plants were financed by the government of Colombia. The next stage aims to install three additional biofuel plants in Mexico, Panama and Dominican Republic as well as the establishment of the Mesoamerican network of biofuels research and development (UNCTAD, 2013).
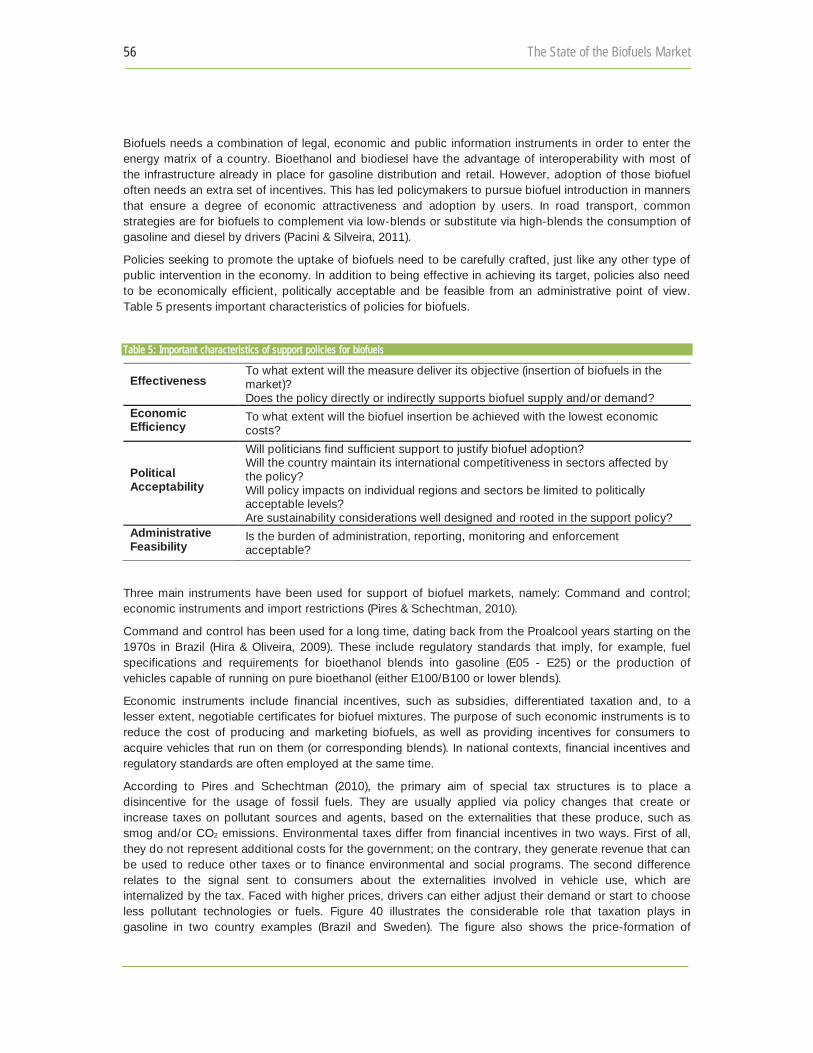
56 The State of the Biofuels Market
Biofuels needs a combination of legal, economic and public information instruments in order to enter the energy matrix of a country. Bioethanol and biodiesel have the advantage of interoperability with most of the infrastructure already in place for gasoline distribution and retail. However, adoption of those biofuel often needs an extra set of incentives. This has led policymakers to pursue biofuel introduction in manners that ensure a degree of economic attractiveness and adoption by users. In road transport, common strategies are for biofuels to complement via low-blends or substitute via high-blends the consumption of gasoline and diesel by drivers (Pacini & Silveira, 2011).
Policies seeking to promote the uptake of biofuels need to be carefully crafted, just like any other type of public intervention in the economy. In addition to being effective in achieving its target, policies also need to be economically efficient, politically acceptable and be feasible from an administrative point of view. Table 5 presents important characteristics of policies for biofuels.
Table 5: Important characteristics of support policies for biofuels
Effectiveness To what extent will the measure deliver its objective (insertion of biofuels in the market)? Does the policy directly or indirectly supports biofuel supply and/or demand?
Economic Efficiency
To what extent will the biofuel insertion be achieved with the lowest economic costs?
Political Acceptability
Will politicians find sufficient support to justify biofuel adoption? Will the country maintain its international competitiveness in sectors affected by the policy? Will policy impacts on individual regions and sectors be limited to politically acceptable levels? Are sustainability considerations well designed and rooted in the support policy?
Administrative Feasibility
Is the burden of administration, reporting, monitoring and enforcement acceptable?
Three main instruments have been used for support of biofuel markets, namely: Command and control; economic instruments and import restrictions (Pires & Schechtman, 2010).
Command and control has been used for a long time, dating back from the Proalcool years starting on the 1970s in Brazil (Hira & Oliveira, 2009). These include regulatory standards that imply, for example, fuel specifications and requirements for bioethanol blends into gasoline (E05 - E25) or the production of vehicles capable of running on pure bioethanol (either E100/B100 or lower blends).
Economic instruments include financial incentives, such as subsidies, differentiated taxation and, to a lesser extent, negotiable certificates for biofuel mixtures. The purpose of such economic instruments is to reduce the cost of producing and marketing biofuels, as well as providing incentives for consumers to acquire vehicles that run on them (or corresponding blends). In national contexts, financial incentives and regulatory standards are often employed at the same time.
According to Pires and Schechtman (2010), the primary aim of special tax structures is to place a disincentive for the usage of fossil fuels. They are usually applied via policy changes that create or increase taxes on pollutant sources and agents, based on the externalities that these produce, such as smog and/or CO2 emissions. Environmental taxes differ from financial incentives in two ways. First of all, they do not represent additional costs for the government; on the contrary, they generate revenue that can be used to reduce other taxes or to finance environmental and social programs. The second difference relates to the signal sent to consumers about the externalities involved in vehicle use, which are internalized by the tax. Faced with higher prices, drivers can either adjust their demand or start to choose less pollutant technologies or fuels. Figure 40 illustrates the considerable role that taxation plays in gasoline in two country examples (Brazil and Sweden). The figure also shows the price-formation of
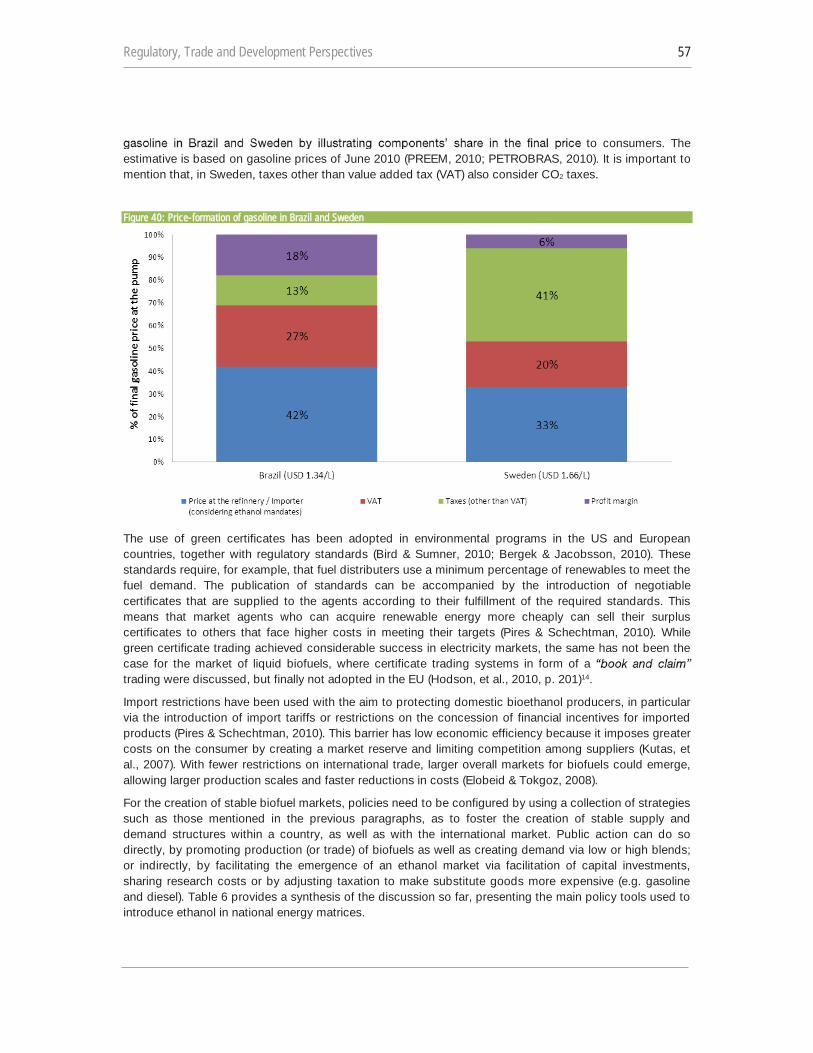
Regulatory, Trade and Development Perspectives 57
to consumers. The estimative is based on gasoline prices of June 2010 (PREEM, 2010; PETROBRAS, 2010). It is important to mention that, in Sweden, taxes other than value added tax (VAT) also consider CO2 taxes.
Figure 40: Price-formation of gasoline in Brazil and Sweden
The use of green certificates has been adopted in environmental programs in the US and European countries, together with regulatory standards (Bird & Sumner, 2010; Bergek & Jacobsson, 2010). These standards require, for example, that fuel distributers use a minimum percentage of renewables to meet the fuel demand. The publication of standards can be accompanied by the introduction of negotiable certificates that are supplied to the agents according to their fulfillment of the required standards. This means that market agents who can acquire renewable energy more cheaply can sell their surplus certificates to others that face higher costs in meeting their targets (Pires & Schechtman, 2010). While green certificate trading achieved considerable success in electricity markets, the same has not been the case for the market of liquid biofuels, where certificate trading systems in form of a trading were discussed, but finally not adopted in the EU (Hodson, et al., 2010, p. 201)14.
Import restrictions have been used with the aim to protecting domestic bioethanol producers, in particular via the introduction of import tariffs or restrictions on the concession of financial incentives for imported products (Pires & Schechtman, 2010). This barrier has low economic efficiency because it imposes greater costs on the consumer by creating a market reserve and limiting competition among suppliers (Kutas, et al., 2007). With fewer restrictions on international trade, larger overall markets for biofuels could emerge, allowing larger production scales and faster reductions in costs (Elobeid & Tokgoz, 2008).
For the creation of stable biofuel markets, policies need to be configured by using a collection of strategies such as those mentioned in the previous paragraphs, as to foster the creation of stable supply and demand structures within a country, as well as with the international market. Public action can do so directly, by promoting production (or trade) of biofuels as well as creating demand via low or high blends; or indirectly, by facilitating the emergence of an ethanol market via facilitation of capital investments, sharing research costs or by adjusting taxation to make substitute goods more expensive (e.g. gasoline and diesel). Table 6 provides a synthesis of the discussion so far, presenting the main policy tools used to introduce ethanol in national energy matrices.

58 The State of the Biofuels Market
Table 6: Policy tools (direct and indirect) often used to introduce bioethanol in in national contexts
Supply-side Policies Demand-side Policies
Direct Incentives
-cost financing
E25)
(E85/E100)
c tendering
Indirect Incentives
2 tax / gasoline tax tes
6. Biofuels amid broader development challenges
Since 2006, biofuels have continued to contribute to the crucial goals of enhancing energy security, energy diversification and energy access; improving health from reduced air pollution; and boosting employment and economic growth for rural communities. They have also helped to revitalize agricultural sectors and create new end-markets for agricultural products.
While bioenergy industries can be important for all countries, they can be particularly transforming for developing countries. People in developing countries suffer the most from limited access to commercial energy, from outdoor and indoor air pollution, and from the declining prices in traditional agricultural products.
Several countries in Africa, Asia and Latin America enjoy the appropriate climate and soil conditions to produce energy crops and have large areas potentially available for energy crop production without affecting forests and other sensitive ecosystems. Progress in those regions, especially beyond the traditional producing countries like Brazil, India, China, Argentina and Colombia, has been so far limited.
6.1. Development challenges in Africa The lack of access to improved energy sources is a key hurdle in reducing poverty worldwide (Pacini & Batidzirai, 2011). The exploitation of local potentials for bioenergy production holds the promise to help rural areas increase their income and livelihoods, through the provision of electricity and derived services (e.g. illumination, refrigeration, telecommunications), transport energy, as well as commercial opportunities within biofuel trade (UNCTAD, 2006). While holding great promise, biofuels development is clearly not risk-free (Low & Isserman, 2009).
In recent years a new push for development of biofuel capacities in developing countries has taken place. A number of nations in Southern Africa have shown interest for the biofuels option, in which they see an opportunity for economic development in the activity of producing and using biofuels (Amigun, et al., 2011). As the main biofuels in use, bioethanol and biodiesel can help reduce dependency on oil, shielding fragile economies from volatility in oil markets.
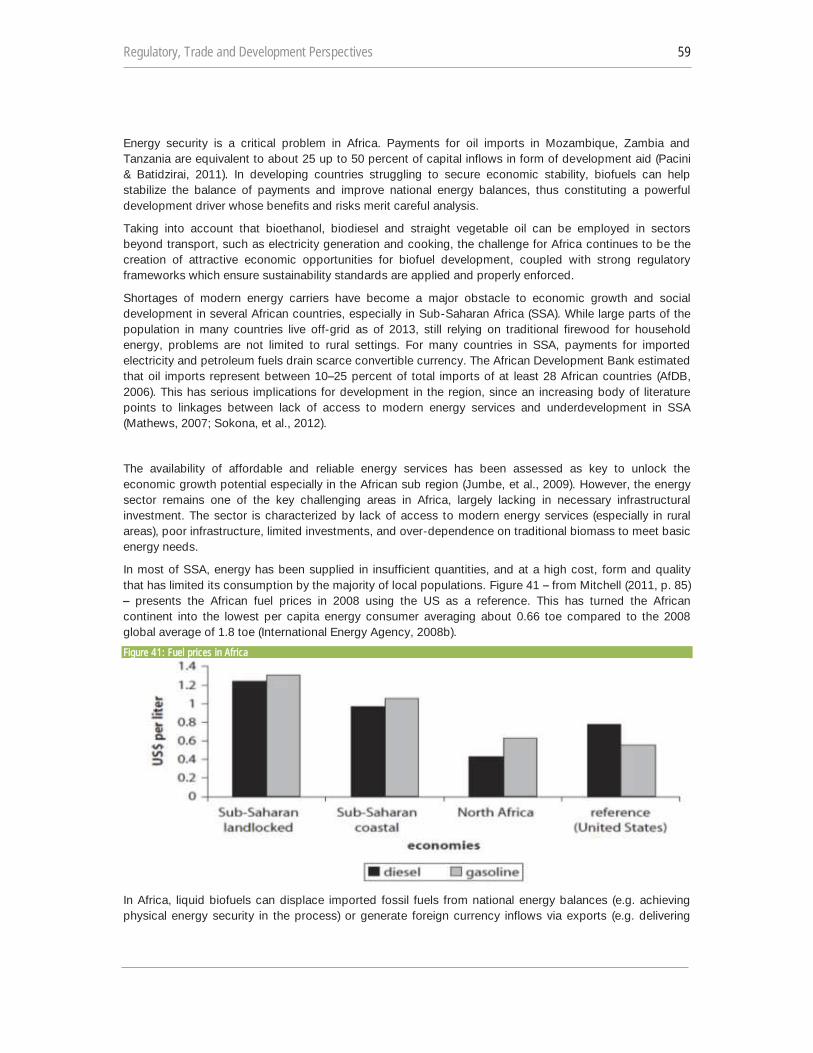
Regulatory, Trade and Development Perspectives 59
Energy security is a critical problem in Africa. Payments for oil imports in Mozambique, Zambia and Tanzania are equivalent to about 25 up to 50 percent of capital inflows in form of development aid (Pacini & Batidzirai, 2011). In developing countries struggling to secure economic stability, biofuels can help stabilize the balance of payments and improve national energy balances, thus constituting a powerful development driver whose benefits and risks merit careful analysis.
Taking into account that bioethanol, biodiesel and straight vegetable oil can be employed in sectors beyond transport, such as electricity generation and cooking, the challenge for Africa continues to be the creation of attractive economic opportunities for biofuel development, coupled with strong regulatory frameworks which ensure sustainability standards are applied and properly enforced.
Shortages of modern energy carriers have become a major obstacle to economic growth and social development in several African countries, especially in Sub-Saharan Africa (SSA). While large parts of the population in many countries live off-grid as of 2013, still relying on traditional firewood for household energy, problems are not limited to rural settings. For many countries in SSA, payments for imported electricity and petroleum fuels drain scarce convertible currency. The African Development Bank estimated that oil imports represent between 10 25 percent of total imports of at least 28 African countries (AfDB, 2006). This has serious implications for development in the region, since an increasing body of literature points to linkages between lack of access to modern energy services and underdevelopment in SSA (Mathews, 2007; Sokona, et al., 2012).
The availability of affordable and reliable energy services has been assessed as key to unlock the economic growth potential especially in the African sub region (Jumbe, et al., 2009). However, the energy sector remains one of the key challenging areas in Africa, largely lacking in necessary infrastructural investment. The sector is characterized by lack of access to modern energy services (especially in rural areas), poor infrastructure, limited investments, and over-dependence on traditional biomass to meet basic energy needs.
In most of SSA, energy has been supplied in insufficient quantities, and at a high cost, form and quality that has limited its consumption by the majority of local populations. Figure 41 from Mitchell (2011, p. 85) presents the African fuel prices in 2008 using the US as a reference. This has turned the African
continent into the lowest per capita energy consumer averaging about 0.66 toe compared to the 2008 global average of 1.8 toe (International Energy Agency, 2008b). Figure 41: Fuel prices in Africa
In Africa, liquid biofuels can displace imported fossil fuels from national energy balances (e.g. achieving physical energy security in the process) or generate foreign currency inflows via exports (e.g. delivering
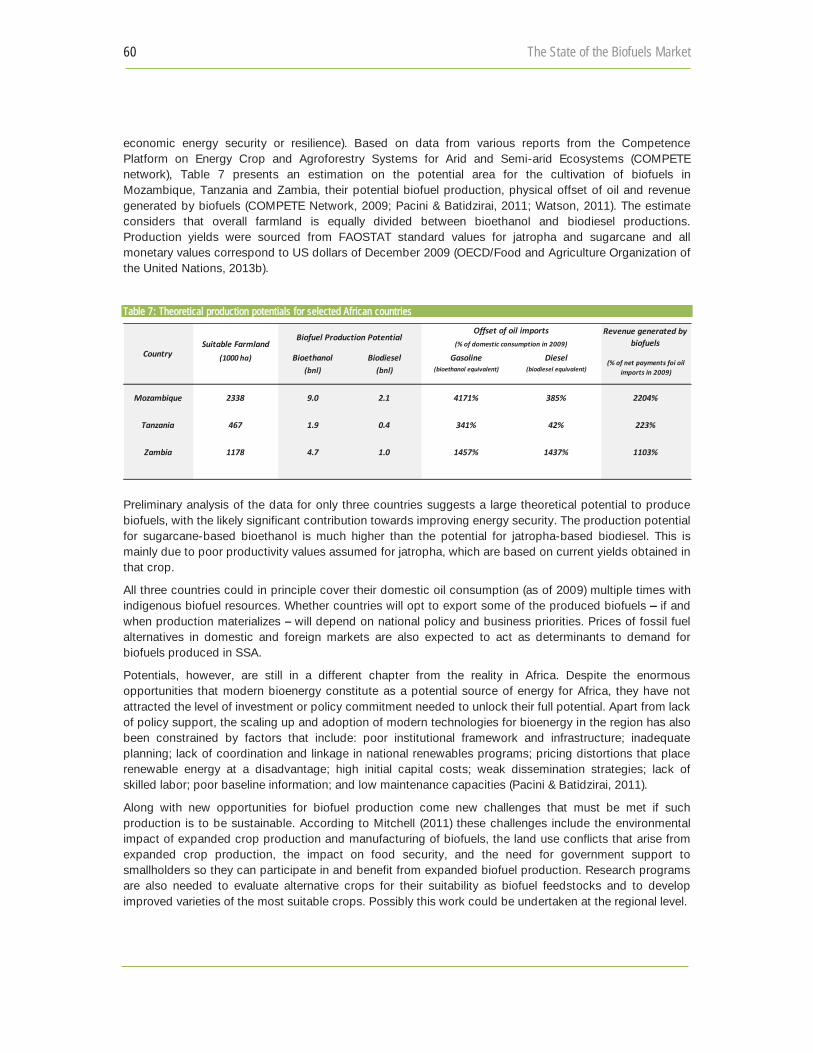
60 The State of the Biofuels Market
economic energy security or resilience). Based on data from various reports from the Competence Platform on Energy Crop and Agroforestry Systems for Arid and Semi-arid Ecosystems (COMPETE network), Table 7 presents an estimation on the potential area for the cultivation of biofuels in Mozambique, Tanzania and Zambia, their potential biofuel production, physical offset of oil and revenue generated by biofuels (COMPETE Network, 2009; Pacini & Batidzirai, 2011; Watson, 2011). The estimate considers that overall farmland is equally divided between bioethanol and biodiesel productions. Production yields were sourced from FAOSTAT standard values for jatropha and sugarcane and all monetary values correspond to US dollars of December 2009 (OECD/Food and Agriculture Organization of the United Nations, 2013b).
Table 7: Theoretical production potentials for selected African countries
Preliminary analysis of the data for only three countries suggests a large theoretical potential to produce biofuels, with the likely significant contribution towards improving energy security. The production potential for sugarcane-based bioethanol is much higher than the potential for jatropha-based biodiesel. This is mainly due to poor productivity values assumed for jatropha, which are based on current yields obtained in that crop.
All three countries could in principle cover their domestic oil consumption (as of 2009) multiple times with indigenous biofuel resources. Whether countries will opt to export some of the produced biofuels if and when production materializes will depend on national policy and business priorities. Prices of fossil fuel alternatives in domestic and foreign markets are also expected to act as determinants to demand for biofuels produced in SSA.
Potentials, however, are still in a different chapter from the reality in Africa. Despite the enormous opportunities that modern bioenergy constitute as a potential source of energy for Africa, they have not attracted the level of investment or policy commitment needed to unlock their full potential. Apart from lack of policy support, the scaling up and adoption of modern technologies for bioenergy in the region has also been constrained by factors that include: poor institutional framework and infrastructure; inadequate planning; lack of coordination and linkage in national renewables programs; pricing distortions that place renewable energy at a disadvantage; high initial capital costs; weak dissemination strategies; lack of skilled labor; poor baseline information; and low maintenance capacities (Pacini & Batidzirai, 2011).
Along with new opportunities for biofuel production come new challenges that must be met if such production is to be sustainable. According to Mitchell (2011) these challenges include the environmental impact of expanded crop production and manufacturing of biofuels, the land use conflicts that arise from expanded crop production, the impact on food security, and the need for government support to smallholders so they can participate in and benefit from expanded biofuel production. Research programs are also needed to evaluate alternative crops for their suitability as biofuel feedstocks and to develop improved varieties of the most suitable crops. Possibly this work could be undertaken at the regional level.
Suitable Farmland(1000 ha) Bioethanol Biodiesel Gasoline Diesel
(bnl) (bnl) (bioethanol equivalent) (biodiesel equivalent)
Mozambique 2338 9.0 2.1 4171% 385% 2204%
Tanzania 467 1.9 0.4 341% 42% 223%
Zambia 1178 4.7 1.0 1457% 1437% 1103%
(% of net payments foi oil imports in 2009)
Revenue generated by biofuels
Offset of oil imports(% of domestic consumption in 2009)
Country
Biofuel Production Potential
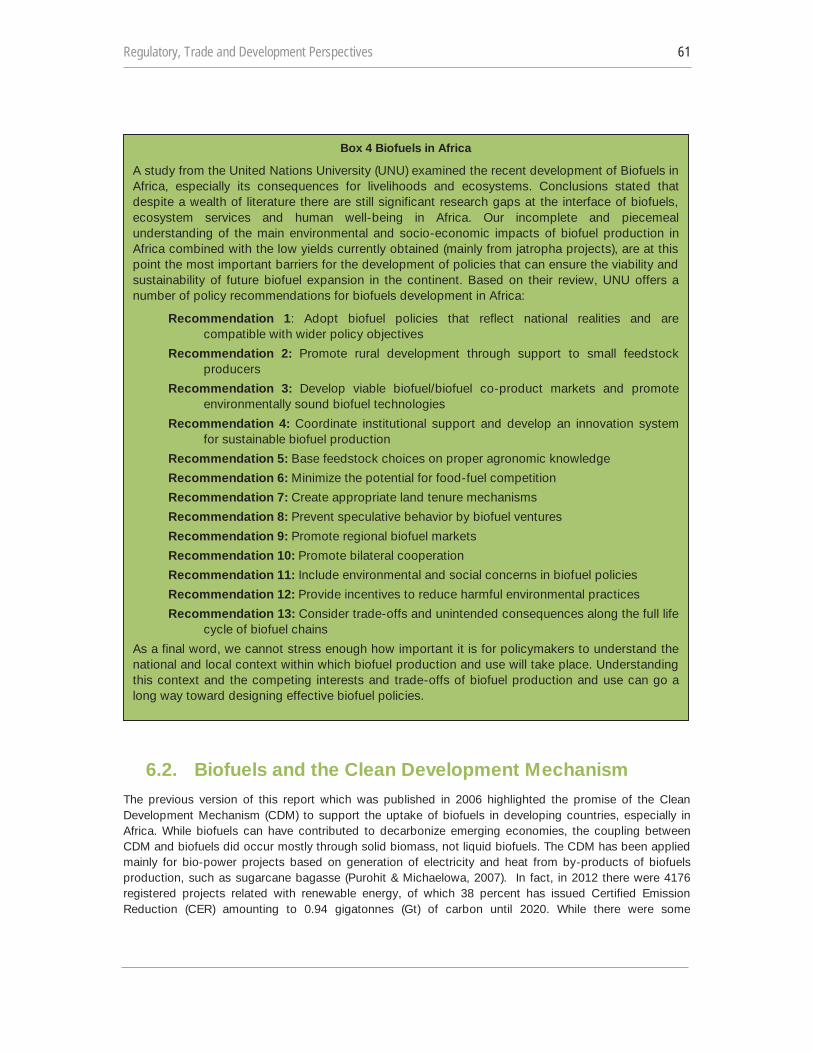
Regulatory, Trade and Development Perspectives 61
6.2. Biofuels and the Clean Development Mechanism The previous version of this report which was published in 2006 highlighted the promise of the Clean Development Mechanism (CDM) to support the uptake of biofuels in developing countries, especially in Africa. While biofuels can have contributed to decarbonize emerging economies, the coupling between CDM and biofuels did occur mostly through solid biomass, not liquid biofuels. The CDM has been applied mainly for bio-power projects based on generation of electricity and heat from by-products of biofuels production, such as sugarcane bagasse (Purohit & Michaelowa, 2007). In fact, in 2012 there were 4176 registered projects related with renewable energy, of which 38 percent has issued Certified Emission Reduction (CER) amounting to 0.94 gigatonnes (Gt) of carbon until 2020. While there were some
Box 4 Biofuels in Africa
A study from the United Nations University (UNU) examined the recent development of Biofuels in Africa, especially its consequences for livelihoods and ecosystems. Conclusions stated that despite a wealth of literature there are still significant research gaps at the interface of biofuels, ecosystem services and human well-being in Africa. Our incomplete and piecemeal understanding of the main environmental and socio-economic impacts of biofuel production in Africa combined with the low yields currently obtained (mainly from jatropha projects), are at this point the most important barriers for the development of policies that can ensure the viability and sustainability of future biofuel expansion in the continent. Based on their review, UNU offers a number of policy recommendations for biofuels development in Africa:
Recommendation 1: Adopt biofuel policies that reflect national realities and are compatible with wider policy objectives
Recommendation 2: Promote rural development through support to small feedstock producers
Recommendation 3: Develop viable biofuel/biofuel co-product markets and promote environmentally sound biofuel technologies
Recommendation 4: Coordinate institutional support and develop an innovation system for sustainable biofuel production
Recommendation 5: Base feedstock choices on proper agronomic knowledge Recommendation 6: Minimize the potential for food-fuel competition Recommendation 7: Create appropriate land tenure mechanisms Recommendation 8: Prevent speculative behavior by biofuel ventures Recommendation 9: Promote regional biofuel markets Recommendation 10: Promote bilateral cooperation Recommendation 11: Include environmental and social concerns in biofuel policies Recommendation 12: Provide incentives to reduce harmful environmental practices Recommendation 13: Consider trade-offs and unintended consequences along the full life
cycle of biofuel chains As a final word, we cannot stress enough how important it is for policymakers to understand the national and local context within which biofuel production and use will take place. Understanding this context and the competing interests and trade-offs of biofuel production and use can go a long way toward designing effective biofuel policies.

62 The State of the Biofuels Market
expectations back in 2006, CDM projects involving liquid biofuels have been very limited, with only one among the registered project and it has not issued any CERs (Kim, et al., 2013).
6.3. Risks Despite their potential to contribute to energy access and low-carbon development, the evolution of knowledge and practice on Biofuels in the period between 2006 and 2013 highlighted a number of challenges for the responsible development of this sector. Four issues have been at the forefront of the biofuels sustainability debate, namely (i) the effect on other land uses by production of energy crops; (ii) effects on food prices and affordability; (iii) the inclusion of small producers so as to ensure that they benefit from the new dynamism of the sector; (iv) production scales and commercial availability; and (v) access to advanced energy technology so as to ensure efficient processes, as well as to allow the usage of non-edible feedstocks in biofuel industries based on developing countries.
6.3.1. Land uses Land-use change is defined by the United Nations Framework Convention on Climate Change (UNFCCC)
a greenhouse gas inventory sector that covers emissions and removals of greenhouse gases resulting from direct human-induced land use, land- (UNFCCC, 2013a). Changes in land usage have impacts on the global carbon cycle and as such, these activities can add or remove carbon from the atmosphere, influencing climate (UNFCCC, 2013b). Additionally, land use is of critical importance for biodiversity (Henzen, 2008).
The Intergovernmental Panel on Climate Change (IPCC) estimates that land-use change (e.g. conversion of forest into agricultural land) contributes a net 1.6 ± 0.8 Gt of carbon per year to the atmosphere. For comparison, the major source of CO2, namely emissions from fossil fuel combustion and cement production amount to 6.3 ± 0.6 Gt of carbon per year.
The extent and type of land use directly affects wildlife habitat and thereby impacts local and global biodiversity. Human alteration of landscapes from natural vegetation (e.g. wilderness) to any other use typically results in habitat loss, degradation, and fragmentation, all of which can have devastating effects on biodiversity, being land conversion the single greatest cause of extinction of terrestrial species (Henzen, 2008; Bierregaard Jr, et al., 2001).
As the biofuel industry grew internationally between 2006 and 2013, a key issue has been the indirect land-use change effect of growing feedstock production. The indirect land use change impacts of biofuels, also known as ILUC, relates to the unintended consequence of releasing more carbon emissions due to land-use changes around the world induced by the expansion of croplands for ethanol or biodiesel production in response to the increased global demand for biofuels.
As farmers worldwide respond to higher crop prices in order to maintain the global food supply-and-demand balance, pristine lands can be cleared to replace the food crops that were diverted elsewhere to biofuels production. Because natural lands, such as rainforests and grasslands, store carbon in their soil and biomass as plants grow each year, clearance of wilderness for new farms translates to a net increase in greenhouse gas emissions, apart from its cost in terms of biodiversity. Due to this change in the carbon stock of the soil and the biomass, indirect land use change has consequences in the GHG balance of a biofuel15.
The estimates of carbon intensity for a given biofuel depend on the assumptions regarding several variables, and the modeling work in this area has improved significantly since 2006 (Pacini & Strapasson, 2012). As of 2008, multiple full life cycle studies had found that corn ethanol, cellulosic ethanol and sugarcane ethanol produce lower greenhouse gas emissions than gasoline. None of these studies, however, considered the effects of indirect land-use changes, and though land use impacts were
Regulatory, Trade and Development Perspectives 63
acknowledged, estimation was considered too complex and difficult to model (Gnansounou, et al., 2008; European Commission, 2010).
Since the environmental performance especially GHG emission performance of biofuels can be highly dependent on indirect land use change effects being considered or not into calculations, the issue became contentious for countries representing major biofuel producers and demanding markets. The US, Brazil and the EU have been especially active in this area, each enacting a number of policies and regulatory instruments targeting biofuels GHG performance over the years between 2006 and 2013.
In the US, ILUC factors were included in the rulemaking by the California Air Resources Board in 2009, which established the California Low-Carbon Fuel Standard which entered into force in 2011. At the national level, in May 2009, US EPA released a notice of proposed rulemaking for implementation of a modification of the Renewable Fuel Standard (RFS), which also included ILUC. This initial move to include ILUC produced controversy, but was followed by a final rule by the US EPA in February 2010, which incorporated improved modeling over the initial estimates.
In the United Kingdom, the Renewable Transport Fuel Obligation program requires the Renewable Fuels Agency (RFA) to report potential indirect impacts of biofuel production, including indirect land use change
, found several risks and uncertainties, and stated that the quantification of GHG emissions from indirect land-use change requires subjective assumptions and contains considerable uncertainty, requiring further examination to properly incorporate indirect effects into calculation methodologies (RFA, 2008). A similarly cautious approach was followed by the EU. In December 2008, the European Parliament adopted more stringent sustainability criteria for biofuels and directed the European Commission to develop a methodology to factor in GHG emissions the impacts from indirect land use change, what is likely to take place around 2020 (European Commission, 2012). While policymaking still debates the inclusion of ILUC factors in biofuel sustainability benchmarks, increasing focus is being dedicated to 2nd generation biofuels, which have lower competition for land (OECD/Food and Agriculture Organization of the United Nations, 2013a).
Genetic modification of fuel-dedicated crops aimed at increasing yields and at developing suitable traits have raised fears linked to perceived threats of agro-biotechnology to plant life and health, to the
conservation of biodiversity and to the environment at large. While genetic engineering in food products caused large interest from consumers and regulators, the same did not happen at the same intensity for biofuels. This is partially because the health risks which could arise from genetically modified organisms are not directly relevant when feedstocks are converted into fuels. Another aspect of interest in genetic engineering for biofuels production is the large potential this could offer in terms of more affordable fuels (Sticklen, 2008). Qiu et al. (2012) provided evidence that China is making important advances in the genetic modification of plants for biofuels and in the development of cellulosic biofuels.
6.3.2. Effects on food prices Food affordability continues to be a major concern in all developing countries, especially the net food-importing developing countries (NFIDCs)16. While in 2006 the relationship between food prices and biofuel production was mostly speculative, significant research has been carried out on the matter by 2013 (UNCTAD, 2006; Ajanovic, 2011; Rosillo-Calle & Johnson, 2010; Chen & Khanna, 2013). Since 2004 commodity prices rose, achieving a peak in 2008 and coinciding with the tripling of corn bioethanol production from 15 to 50 bnl between 2004 and 2010 (Chen & Khanna, 2013). Zilberman et al. (2013) carried out a review of literature examining the impact of biofuels on commodity food prices. The findings can be seen on Table 8 below (Serra, et al., 2011a; Zhang, et al., 2010; Serra, et al., 2011b).
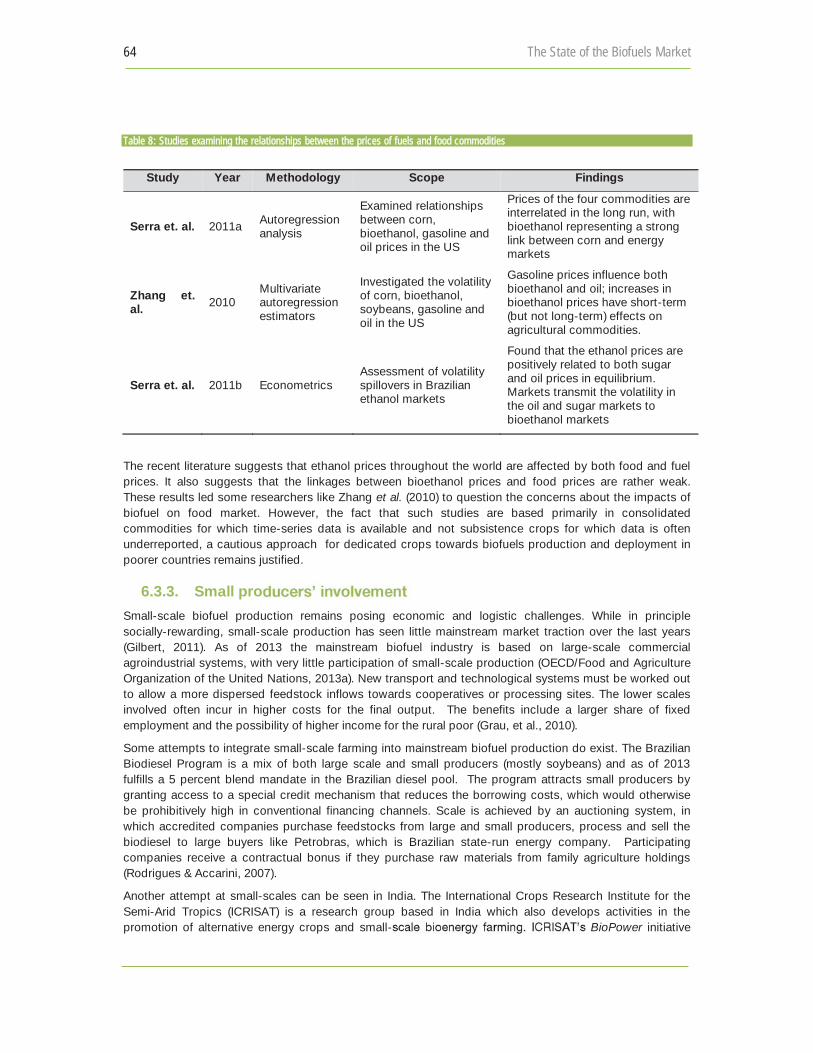
64 The State of the Biofuels Market
Table 8: Studies examining the relationships between the prices of fuels and food commodities
Study Year Methodology Scope Findings
Serra et. al. 2011a Autoregression analysis
Examined relationships between corn, bioethanol, gasoline and oil prices in the US
Prices of the four commodities are interrelated in the long run, with bioethanol representing a strong link between corn and energy markets
Zhang et. al. 2010
Multivariate autoregression estimators
Investigated the volatility of corn, bioethanol, soybeans, gasoline and oil in the US
Gasoline prices influence both bioethanol and oil; increases in bioethanol prices have short-term (but not long-term) effects on agricultural commodities.
Serra et. al. 2011b Econometrics Assessment of volatility spillovers in Brazilian ethanol markets
Found that the ethanol prices are positively related to both sugar and oil prices in equilibrium. Markets transmit the volatility in the oil and sugar markets to bioethanol markets
The recent literature suggests that ethanol prices throughout the world are affected by both food and fuel prices. It also suggests that the linkages between bioethanol prices and food prices are rather weak. These results led some researchers like Zhang et al. (2010) to question the concerns about the impacts of biofuel on food market. However, the fact that such studies are based primarily in consolidated commodities for which time-series data is available and not subsistence crops for which data is often underreported, a cautious approach for dedicated crops towards biofuels production and deployment in poorer countries remains justified.
6.3.3. Small pro Small-scale biofuel production remains posing economic and logistic challenges. While in principle socially-rewarding, small-scale production has seen little mainstream market traction over the last years (Gilbert, 2011). As of 2013 the mainstream biofuel industry is based on large-scale commercial agroindustrial systems, with very little participation of small-scale production (OECD/Food and Agriculture Organization of the United Nations, 2013a). New transport and technological systems must be worked out to allow a more dispersed feedstock inflows towards cooperatives or processing sites. The lower scales involved often incur in higher costs for the final output. The benefits include a larger share of fixed employment and the possibility of higher income for the rural poor (Grau, et al., 2010).
Some attempts to integrate small-scale farming into mainstream biofuel production do exist. The Brazilian Biodiesel Program is a mix of both large scale and small producers (mostly soybeans) and as of 2013 fulfills a 5 percent blend mandate in the Brazilian diesel pool. The program attracts small producers by granting access to a special credit mechanism that reduces the borrowing costs, which would otherwise be prohibitively high in conventional financing channels. Scale is achieved by an auctioning system, in which accredited companies purchase feedstocks from large and small producers, process and sell the biodiesel to large buyers like Petrobras, which is Brazilian state-run energy company. Participating companies receive a contractual bonus if they purchase raw materials from family agriculture holdings (Rodrigues & Accarini, 2007).
Another attempt at small-scales can be seen in India. The International Crops Research Institute for the Semi-Arid Tropics (ICRISAT) is a research group based in India which also develops activities in the promotion of alternative energy crops and small- BioPower initiative
Regulatory, Trade and Development Perspectives 65
focuses on three points: (i) enabling small-scale bioenergy farming; (ii) identifying comparative advantages and technologies suitable for resource-limited bioenergy production and (iii) aspects of sustainability. The initiative identifies sweet sorghum as the focus crop for ethanol production given its suitability for dry climates and degraded lands. In addition, the initiative promotes investment in pro-poor bioenergy projects.
Colombia is another national example of a country with ongoing experience in small-scale biofuel activities. The country has two biofuel mandates as of 2011, E10 and B5. The Colombian strategy gives priority to smaller scale pilot projects instead of larger plants. In face of the production based in small-scale projects, logistic issues have been reported in routing feedstocks to the processing centers (Gilbert, et al., 2013).
The potential for small-scale biofuel production in Africa has been assessed by the United Nations Department of Economic and Social Affairs (UNDESA) and examples were listed mostly on jatropha-based biodiesel for SSA. Initiatives were listed for Ghana, Mozambique, Tanzania and Zambia (UNDESA, 2007). However, unlike the Brazilian biodiesel program none of the African projects envisioned a country-wide fuel blend mandate with the participation of small-scale biofuel production. Output was envisioned instead primarily towards other usages such as cooking, fuels for electric generators and illumination purposes.
Crop characteristics are important to the feasibility of small-scale production. When comparing bioethanol and biodiesel, the feedstocks are often sucrose-based or oily-seeds based (e.g. sugarcane for bioethanol and soybeans for biodiesel). There is one important distinction to be made. Sucrose-based feedstocks generally need to be processed within 48 hours after harvesting, which requires the availability of a mill/distillery in proximity. Oily seeds on the other hand can be stored for longer periods prior to processing, allowing accumulation and transport to cooperative sites where commercial scales can be achieved. In other words, although energy in form of bioethanol is generally cheaper than energy in form of biodiesel, it is easier for the small-scale producer to handle oily seeds due to the fact that these do not necessarily need to be promptly processed after harvest. In this sense, dominant sugarcane production systems are established under a regional monopsony structure which gives relatively more power to the owner of the processing plant than for nearby farmers. Algae fuels, on the other hand, hold some promise in smaller yet commercial scales of production (Mata, et al., 2010; Savage, 2011).
6.3.4. Production Scales and Commercial availability Considering feedstock transformation, the minimum efficient scale of sugarcane feedstock for bioethanol production has been estimated in Brazil as between 1 and 3 Mt cane per year. In many developing countries this represents a very high target. Among the major producers in southern Africa, for example, only four of the 40 existing sugar factories exceed this scale (Johnson & Matsika, 2006). As of late 2013, Addax Bioenergy is building an ethanol and sugar plant with capacity of 1 Mt of cane per year in Sierra Leone, which falls within the range of commercial plants in similar models to the ones established in Brazil.
While the economic feasibility at smaller scales is disputed, several companies offer micro-distillery systems for bioethanol production at small scales, using a variety of feedstocks. As for example, in Brazil the company USI Biorefinarias sells micro-distilleries for the production of 400, 1000 or 2000 liters of bioethanol per day, using starch and sucrose-based feedstocks. In the US the firm E-Fuel markets the MicroFueler mostly aimed at the enthusiast market, which can use a broad array of feedstocks, like sugar, old beer and waste wine.
Such systems can be used by small-scale farmers to produce bioethanol locally. Considering the output, it is not clear how much water content the bioethanol would have given the different production apparatus. If a number of micro-producers deliver bioethanol with different specifications, the fuel would have to be further distilled at a harmonizing station in order to achieve the anhydrous specifications required for safe blending with gasoline. Water content might be an issue given the necessity of anhydrous bioethanol for
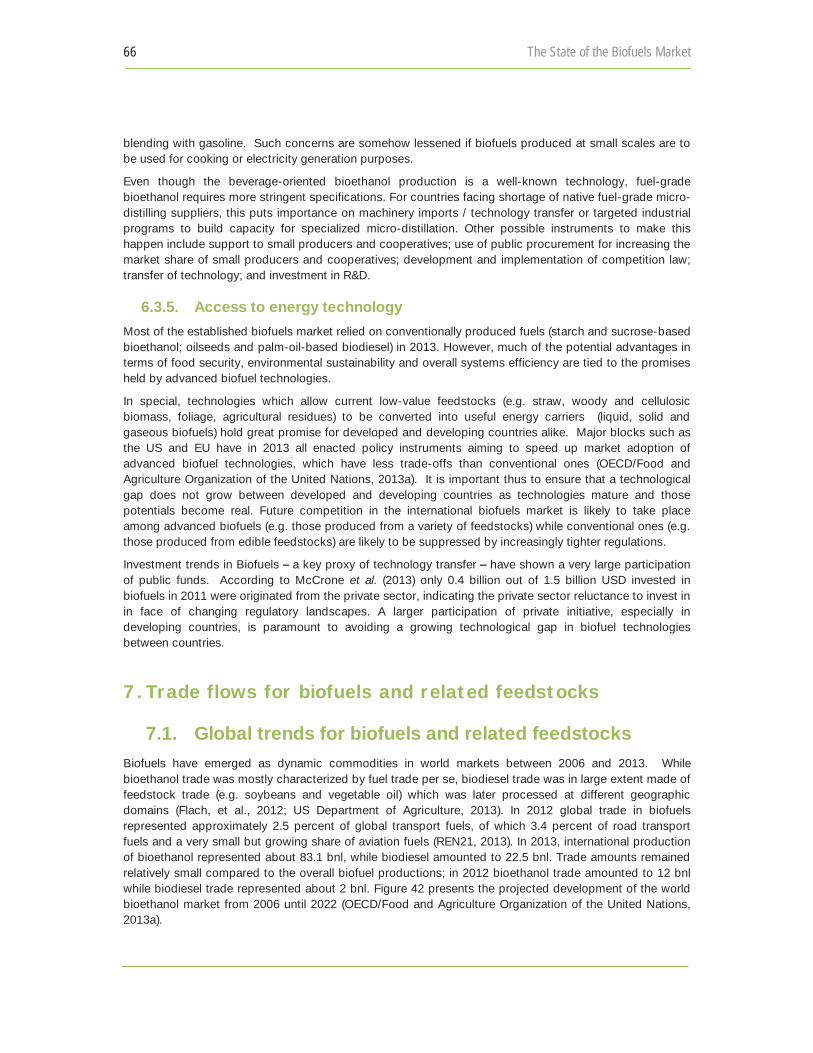
66 The State of the Biofuels Market
blending with gasoline. Such concerns are somehow lessened if biofuels produced at small scales are to be used for cooking or electricity generation purposes.
Even though the beverage-oriented bioethanol production is a well-known technology, fuel-grade bioethanol requires more stringent specifications. For countries facing shortage of native fuel-grade micro-distilling suppliers, this puts importance on machinery imports / technology transfer or targeted industrial programs to build capacity for specialized micro-distillation. Other possible instruments to make this happen include support to small producers and cooperatives; use of public procurement for increasing the market share of small producers and cooperatives; development and implementation of competition law; transfer of technology; and investment in R&D.
6.3.5. Access to energy technology Most of the established biofuels market relied on conventionally produced fuels (starch and sucrose-based bioethanol; oilseeds and palm-oil-based biodiesel) in 2013. However, much of the potential advantages in terms of food security, environmental sustainability and overall systems efficiency are tied to the promises held by advanced biofuel technologies.
In special, technologies which allow current low-value feedstocks (e.g. straw, woody and cellulosic biomass, foliage, agricultural residues) to be converted into useful energy carriers (liquid, solid and gaseous biofuels) hold great promise for developed and developing countries alike. Major blocks such as the US and EU have in 2013 all enacted policy instruments aiming to speed up market adoption of advanced biofuel technologies, which have less trade-offs than conventional ones (OECD/Food and Agriculture Organization of the United Nations, 2013a). It is important thus to ensure that a technological gap does not grow between developed and developing countries as technologies mature and those potentials become real. Future competition in the international biofuels market is likely to take place among advanced biofuels (e.g. those produced from a variety of feedstocks) while conventional ones (e.g. those produced from edible feedstocks) are likely to be suppressed by increasingly tighter regulations.
Investment trends in Biofuels a key proxy of technology transfer have shown a very large participation of public funds. According to McCrone et al. (2013) only 0.4 billion out of 1.5 billion USD invested in biofuels in 2011 were originated from the private sector, indicating the private sector reluctance to invest in in face of changing regulatory landscapes. A larger participation of private initiative, especially in developing countries, is paramount to avoiding a growing technological gap in biofuel technologies between countries.
7. Trade flows for biofuels and related feedstocks
7.1. Global trends for biofuels and related feedstocks Biofuels have emerged as dynamic commodities in world markets between 2006 and 2013. While bioethanol trade was mostly characterized by fuel trade per se, biodiesel trade was in large extent made of feedstock trade (e.g. soybeans and vegetable oil) which was later processed at different geographic domains (Flach, et al., 2012; US Department of Agriculture, 2013). In 2012 global trade in biofuels represented approximately 2.5 percent of global transport fuels, of which 3.4 percent of road transport fuels and a very small but growing share of aviation fuels (REN21, 2013). In 2013, international production of bioethanol represented about 83.1 bnl, while biodiesel amounted to 22.5 bnl. Trade amounts remained relatively small compared to the overall biofuel productions; in 2012 bioethanol trade amounted to 12 bnl while biodiesel trade represented about 2 bnl. Figure 42 presents the projected development of the world bioethanol market from 2006 until 2022 (OECD/Food and Agriculture Organization of the United Nations, 2013a).
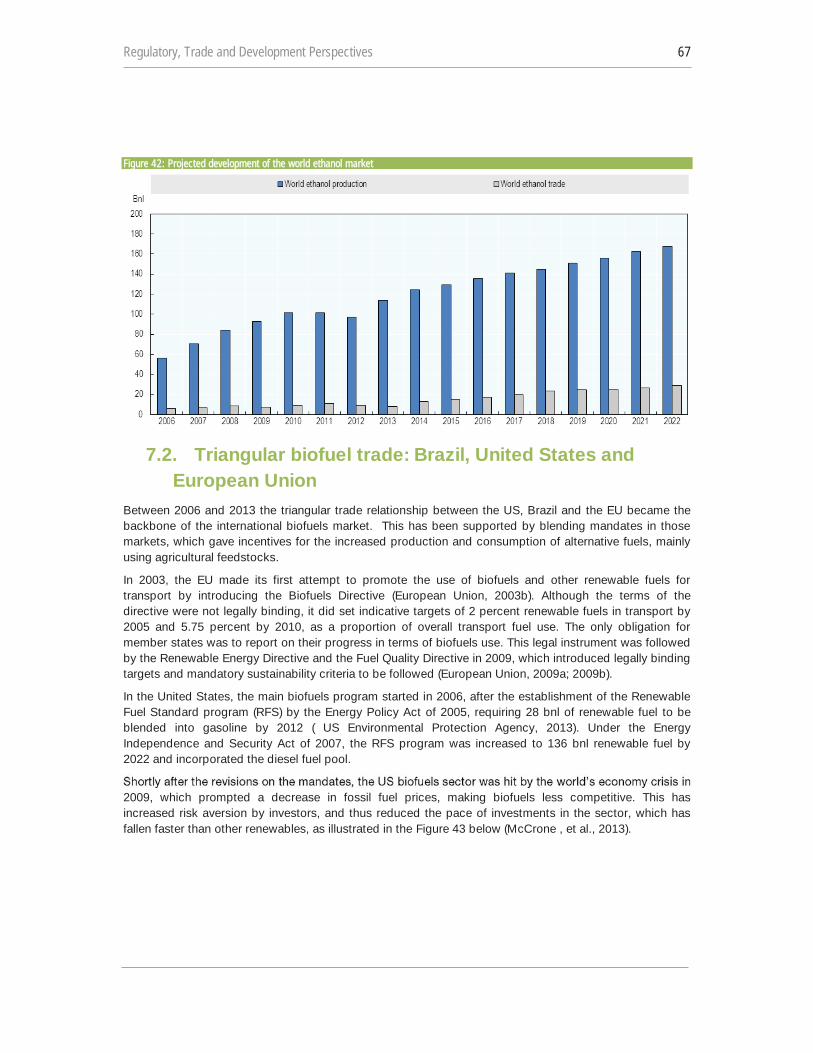
Regulatory, Trade and Development Perspectives 67
Figure 42: Projected development of the world ethanol market
7.2. Triangular biofuel trade: Brazil, United States and European Union
Between 2006 and 2013 the triangular trade relationship between the US, Brazil and the EU became the backbone of the international biofuels market. This has been supported by blending mandates in those markets, which gave incentives for the increased production and consumption of alternative fuels, mainly using agricultural feedstocks.
In 2003, the EU made its first attempt to promote the use of biofuels and other renewable fuels for transport by introducing the Biofuels Directive (European Union, 2003b). Although the terms of the directive were not legally binding, it did set indicative targets of 2 percent renewable fuels in transport by 2005 and 5.75 percent by 2010, as a proportion of overall transport fuel use. The only obligation for member states was to report on their progress in terms of biofuels use. This legal instrument was followed by the Renewable Energy Directive and the Fuel Quality Directive in 2009, which introduced legally binding targets and mandatory sustainability criteria to be followed (European Union, 2009a; 2009b).
In the United States, the main biofuels program started in 2006, after the establishment of the Renewable Fuel Standard program (RFS) by the Energy Policy Act of 2005, requiring 28 bnl of renewable fuel to be blended into gasoline by 2012 ( US Environmental Protection Agency, 2013). Under the Energy Independence and Security Act of 2007, the RFS program was increased to 136 bnl renewable fuel by 2022 and incorporated the diesel fuel pool.
2009, which prompted a decrease in fossil fuel prices, making biofuels less competitive. This has increased risk aversion by investors, and thus reduced the pace of investments in the sector, which has fallen faster than other renewables, as illustrated in the Figure 43 below (McCrone , et al., 2013).
g j p
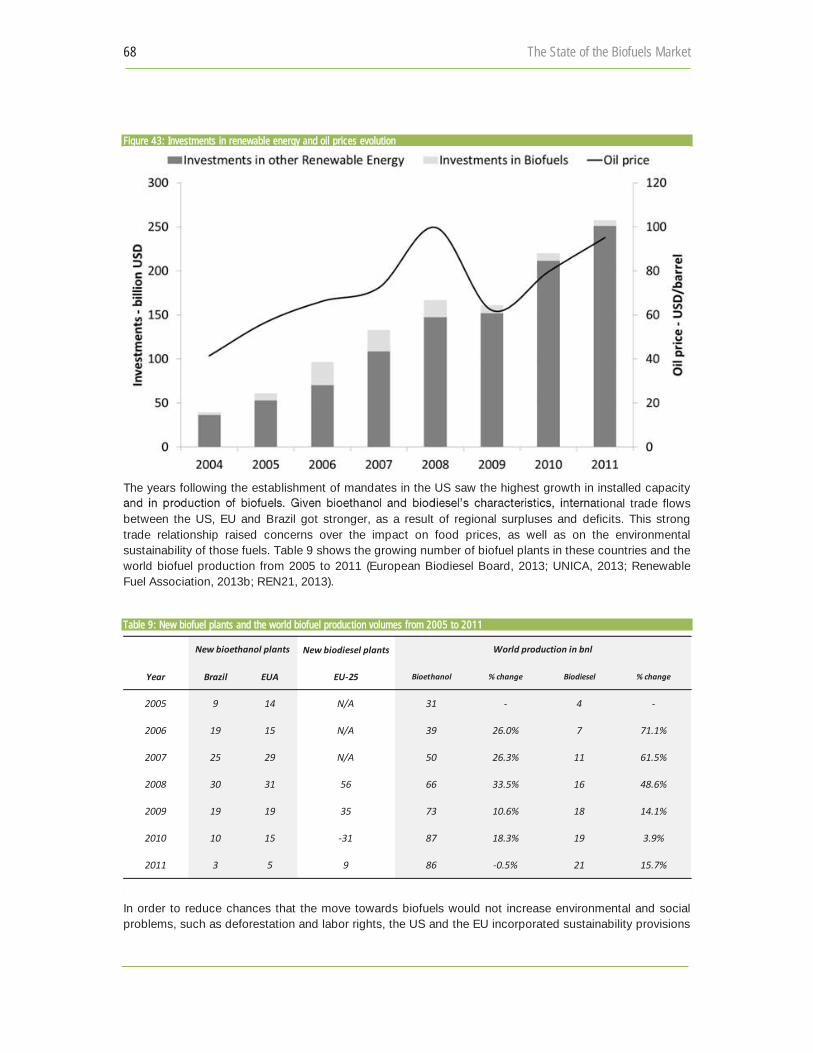
68 The State of the Biofuels Market
Figure 43: Investments in renewable energy and oil prices evolution
The years following the establishment of mandates in the US saw the highest growth in installed capacity
tional trade flows between the US, EU and Brazil got stronger, as a result of regional surpluses and deficits. This strong trade relationship raised concerns over the impact on food prices, as well as on the environmental sustainability of those fuels. Table 9 shows the growing number of biofuel plants in these countries and the world biofuel production from 2005 to 2011 (European Biodiesel Board, 2013; UNICA, 2013; Renewable Fuel Association, 2013b; REN21, 2013).
Table 9: New biofuel plants and the world biofuel production volumes from 2005 to 2011
In order to reduce chances that the move towards biofuels would not increase environmental and social problems, such as deforestation and labor rights, the US and the EU incorporated sustainability provisions
New biodiesel plants
Year Brazil EUA EU-25 Bioethanol % change Biodiesel % change
2005 9 14 N/A 31 - 4 -
2006 19 15 N/A 39 26.0% 7 71.1%
2007 25 29 N/A 50 26.3% 11 61.5%
2008 30 31 56 66 33.5% 16 48.6%
2009 19 19 35 73 10.6% 18 14.1%
2010 10 15 -31 87 18.3% 19 3.9%
2011 3 5 9 86 -0.5% 21 15.7%
New bioethanol plants World production in bnl
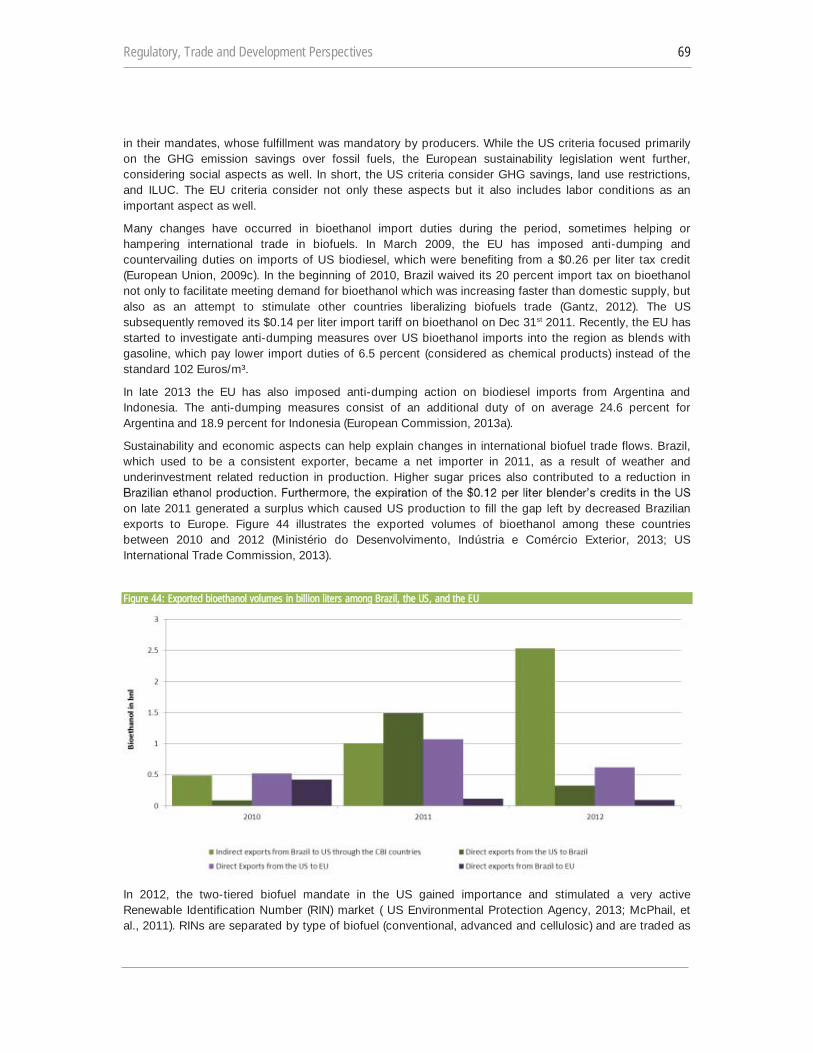
Regulatory, Trade and Development Perspectives 69
in their mandates, whose fulfillment was mandatory by producers. While the US criteria focused primarily on the GHG emission savings over fossil fuels, the European sustainability legislation went further, considering social aspects as well. In short, the US criteria consider GHG savings, land use restrictions, and ILUC. The EU criteria consider not only these aspects but it also includes labor conditions as an important aspect as well.
Many changes have occurred in bioethanol import duties during the period, sometimes helping or hampering international trade in biofuels. In March 2009, the EU has imposed anti-dumping and countervailing duties on imports of US biodiesel, which were benefiting from a $0.26 per liter tax credit (European Union, 2009c). In the beginning of 2010, Brazil waived its 20 percent import tax on bioethanol not only to facilitate meeting demand for bioethanol which was increasing faster than domestic supply, but also as an attempt to stimulate other countries liberalizing biofuels trade (Gantz, 2012). The US subsequently removed its $0.14 per liter import tariff on bioethanol on Dec 31st 2011. Recently, the EU has started to investigate anti-dumping measures over US bioethanol imports into the region as blends with gasoline, which pay lower import duties of 6.5 percent (considered as chemical products) instead of the standard 102 Euros/m³.
In late 2013 the EU has also imposed anti-dumping action on biodiesel imports from Argentina and Indonesia. The anti-dumping measures consist of an additional duty of on average 24.6 percent for Argentina and 18.9 percent for Indonesia (European Commission, 2013a).
Sustainability and economic aspects can help explain changes in international biofuel trade flows. Brazil, which used to be a consistent exporter, became a net importer in 2011, as a result of weather and underinvestment related reduction in production. Higher sugar prices also contributed to a reduction in
on late 2011 generated a surplus which caused US production to fill the gap left by decreased Brazilian exports to Europe. Figure 44 illustrates the exported volumes of bioethanol among these countries between 2010 and 2012 (Ministério do Desenvolvimento, Indústria e Comércio Exterior, 2013; US International Trade Commission, 2013).
Figure 44: Exported bioethanol volumes in billion liters among Brazil, the US, and the EU
In 2012, the two-tiered biofuel mandate in the US gained importance and stimulated a very active Renewable Identification Number (RIN) market ( US Environmental Protection Agency, 2013; McPhail, et al., 2011). RINs are separated by type of biofuel (conventional, advanced and cellulosic) and are traded as
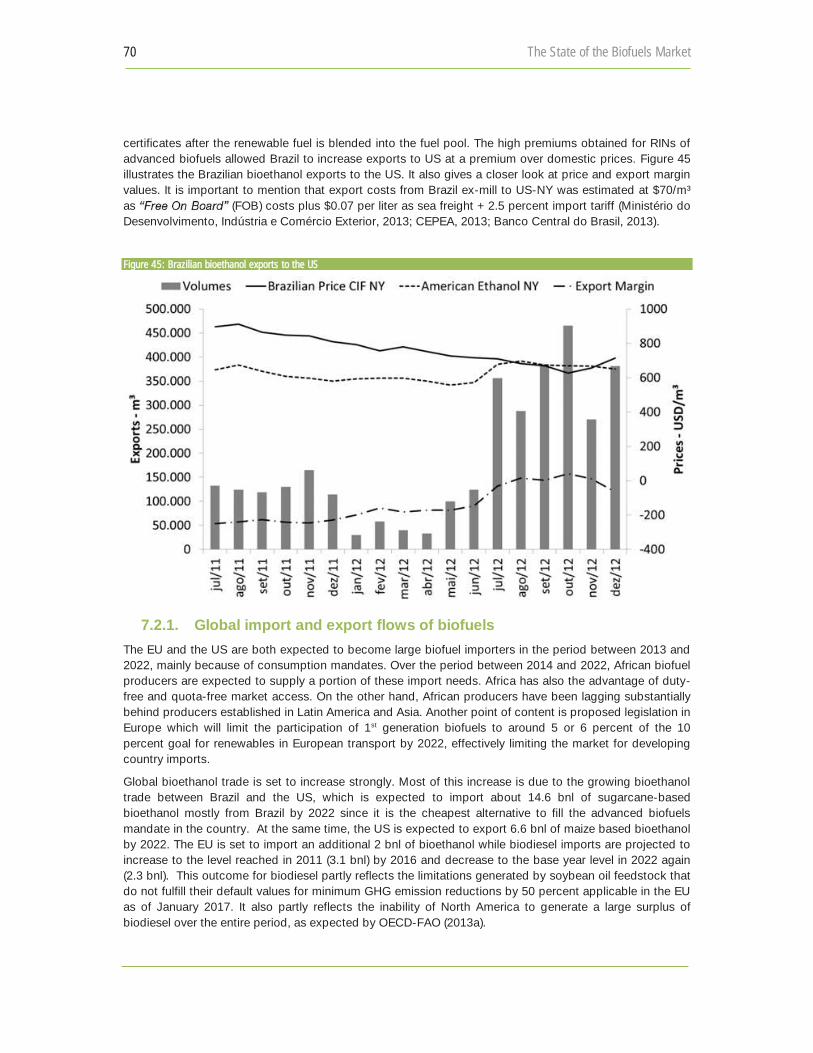
70 The State of the Biofuels Market
certificates after the renewable fuel is blended into the fuel pool. The high premiums obtained for RINs of advanced biofuels allowed Brazil to increase exports to US at a premium over domestic prices. Figure 45 illustrates the Brazilian bioethanol exports to the US. It also gives a closer look at price and export margin values. It is important to mention that export costs from Brazil ex-mill to US-NY was estimated at $70/m³ as (FOB) costs plus $0.07 per liter as sea freight + 2.5 percent import tariff (Ministério do Desenvolvimento, Indústria e Comércio Exterior, 2013; CEPEA, 2013; Banco Central do Brasil, 2013).
Figure 45: Brazilian bioethanol exports to the US
7.2.1. Global import and export flows of biofuels The EU and the US are both expected to become large biofuel importers in the period between 2013 and 2022, mainly because of consumption mandates. Over the period between 2014 and 2022, African biofuel producers are expected to supply a portion of these import needs. Africa has also the advantage of duty-free and quota-free market access. On the other hand, African producers have been lagging substantially behind producers established in Latin America and Asia. Another point of content is proposed legislation in Europe which will limit the participation of 1st generation biofuels to around 5 or 6 percent of the 10 percent goal for renewables in European transport by 2022, effectively limiting the market for developing country imports.
Global bioethanol trade is set to increase strongly. Most of this increase is due to the growing bioethanol trade between Brazil and the US, which is expected to import about 14.6 bnl of sugarcane-based bioethanol mostly from Brazil by 2022 since it is the cheapest alternative to fill the advanced biofuels mandate in the country. At the same time, the US is expected to export 6.6 bnl of maize based bioethanol by 2022. The EU is set to import an additional 2 bnl of bioethanol while biodiesel imports are projected to increase to the level reached in 2011 (3.1 bnl) by 2016 and decrease to the base year level in 2022 again (2.3 bnl). This outcome for biodiesel partly reflects the limitations generated by soybean oil feedstock that do not fulfill their default values for minimum GHG emission reductions by 50 percent applicable in the EU as of January 2017. It also partly reflects the inability of North America to generate a large surplus of biodiesel over the entire period, as expected by OECD-FAO (2013a).
Regulatory, Trade and Development Perspectives 71
Developing countries are net exporters for both biodiesel and bioethanol. Argentina (2 bnl), Indonesia (0.8 bnl) and Malaysia (0.1 bnl) are projected by FAO-OECD (2013a) to be the largest net exporters of biodiesel by 2022 while Brazil (12 bnl) Pakistan and Thailand (0.5 bnl each) are expected to be the largest net exporters of bioethanol among developing countries.
7.2.2. EU Biofuel Import Tariffs and Prices Bioethanol is imported into the EU under two tariff codes, denatured and undenatured, but fuel bioethanol still does not have a separate tariff code as of 2013. Denatured bioethanol is ethanol that is blended with a
bioethanol has not been blended with a chemical additive to make it unsuitable for human consumption liter.
Most EU Member States require that undenatured bioethanol be used for blending with gasoline, but there are exceptions. The United Kingdom and the Netherlands allow denatured bioethanol to be used as well, and Sweden is allowed to import bioethanol for use in E85 or E95 blends under a separate tariff code for chemical products, which has a lower tariff (Pacini & Silveira, 2010). Biodiesel is imported under several different tariff codes, with most imported under the most-favored-nation import tariff of 6.5 percent. Vegetable oils for technical or industrial uses face a most-favored-nation tariff ranging from 3.2 percent to 5.1 percent. Oilseeds have duty-free access on the EU market (Mitchell, 2011).
Countries aiming to export towards the EU markets face significantly higher tariffs for bioethanol than on biodiesel or biodiesel feedstocks. Thus, at least in what concerns 1st generation biofuels trade, flows from areas enjoying preferential trade agreements such as Africa towards the EU will likely primarily be for bioethanol exports. While the EU is expected to require large imports of biodiesel or feedstocks to produce biodiesel, African producers may be able to supply a portion of that import demand, even though they do not enjoy significant tariff advantages over other exporters in the market for biodiesel. The US, on the other hand, is expected to require large imports of bioethanol rather than biodiesel, and African exporters may be able to supply a portion of that market if supplies from Central and South America are not large enough to satisfy US import demand. Other countries, such as Japan and the Republic of Korea, will also become significant biofuel importers if they meet their biofuel mandates, which will offer opportunities for African exporters. China, India, and other Asian and Latin American biofuel consumers are expected to rely mostly on domestic production (Mitchell, 2011; OECD/Food and Agriculture Organization of the United Nations, 2013a).
7.2.3. African Countries with Duty-Free Access to the EU for Biofuel Exports
All African countries, except those bordering the Mediterranean sea, were given preferential access to the EU because of their inclusion in the group of Africa, Caribbean, and Pacific countries under the Lomé Convention and later by the Cotonou Agreement of June 2000, which replaced the Lomé Convention (Mitchell, 2011). The Cotonou Agreement lapsed at the end of 2007 and was to be replaced by economic partnership agreements (EPAs), which are being negotiated by several regional groups. However, progress on EPAs has been slow, and as of mid-2013, no African region had managed to reach a full agreement. Provisional EPAs with the EU have been agreed to with several countries or regions, which allow temporary duty-free access. With the exception of the Republic of Congo, Gabon, and South Africa, all African Cotonou Agreement countries still enjoy duty-free access to the EU on biofuel exports. In addition, LDCs are guaranteed duty-African countries. The duty-free access provided by the EBA has no time limit and is not subject to the period Table 10 presents a list
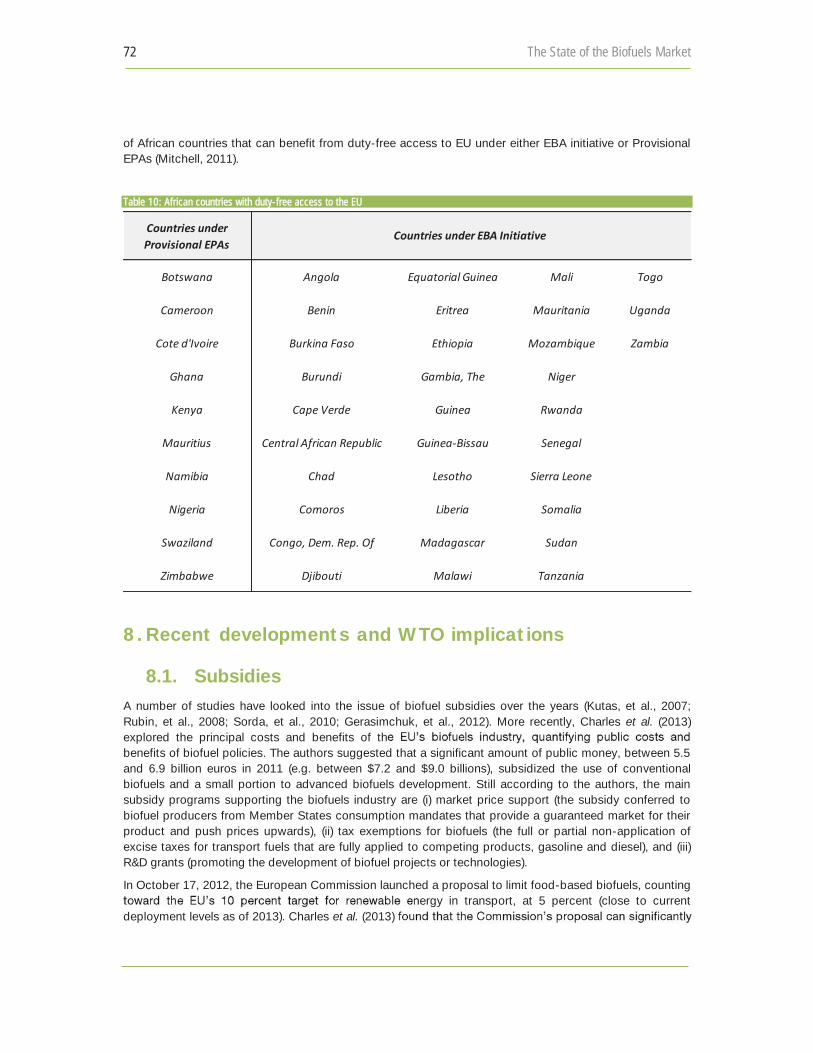
72 The State of the Biofuels Market
of African countries that can benefit from duty-free access to EU under either EBA initiative or Provisional EPAs (Mitchell, 2011).
Table 10: African countries with duty-free access to the EU
8. Recent developments and WTO implications
8.1. Subsidies A number of studies have looked into the issue of biofuel subsidies over the years (Kutas, et al., 2007; Rubin, et al., 2008; Sorda, et al., 2010; Gerasimchuk, et al., 2012). More recently, Charles et al. (2013) explored the principal costs and benefits of thbenefits of biofuel policies. The authors suggested that a significant amount of public money, between 5.5 and 6.9 billion euros in 2011 (e.g. between $7.2 and $9.0 billions), subsidized the use of conventional biofuels and a small portion to advanced biofuels development. Still according to the authors, the main subsidy programs supporting the biofuels industry are (i) market price support (the subsidy conferred to biofuel producers from Member States consumption mandates that provide a guaranteed market for their product and push prices upwards), (ii) tax exemptions for biofuels (the full or partial non-application of excise taxes for transport fuels that are fully applied to competing products, gasoline and diesel), and (iii) R&D grants (promoting the development of biofuel projects or technologies).
In October 17, 2012, the European Commission launched a proposal to limit food-based biofuels, counting ergy in transport, at 5 percent (close to current
deployment levels as of 2013). Charles et al. (2013)
Countries under Provisional EPAs
Botswana Angola Equatorial Guinea Mali Togo
Cameroon Benin Eritrea Mauritania Uganda
Cote d'Ivoire Burkina Faso Ethiopia Mozambique Zambia
Ghana Burundi Gambia, The Niger
Kenya Cape Verde Guinea Rwanda
Mauritius Central African Republic Guinea-Bissau Senegal
Namibia Chad Lesotho Sierra Leone
Nigeria Comoros Liberia Somalia
Swaziland Congo, Dem. Rep. Of Madagascar Sudan
Zimbabwe Djibouti Malawi Tanzania
Countries under EBA Initiative
Regulatory, Trade and Development Perspectives 73
limit both the additional costs and benefits associated with moving to a 10 percent market penetration of food-based biofuels. The main costs or savings would be saving between 5.5 and 6.9 billion euros per year in 2020 (e.g. between $7.2 and $9.0 billions) if the level of biofuel consumption remained at 4.5 percent of emotorists would also take place, according to the study, in case biofuels increase from 5 percent (as of 2012) energy in road transport to around 8.5 up to 9.5 percent in 2020 an additional 808 million euros or $1.5 billion on bioethanol and an additional 8.9 billion euros or $11.6 billion could be spent on biodiesel consumption.
In the US biofuel subsidies, including mandates, have been accessed by Gerasimchuk et al. (2012) and they were estimated as amounting between $6.3 to $7.7 billion in 2006, $8.1 to $9.9 billion in 2007, and $10.7 to $12.9 billion in 2008. In the US, still according to the authors, subsidies were made of (i) direct budgetary spending such as R&D Grants, cellulosic grants, small-scale biorefineries, and loan guarantees; and (ii) Tax relief mechanisms, such as reductions in state motor fuel taxes, small producer tax credits (expired in 2011) and domestic production tax deduction for cellulose-based biofuels. The authors also mention relaxation of emissions regulations as a form of subsidy for biofuels in the US (Gerasimchuk, et al., 2012, p. 30). It must be recognized, however, that accounting practices for biofuel subsidies assessments are not standardized, and all figures in literature are linked to specific assumptions which can be revised as better information emerges (IISD, 2013).
Analysts have also explored the relationship between biofuel subsidies and the law of the World Trade Organization. Harmer (2009) noticed that government subsidies and other incentives have played a fundamental role in shaping domestic biofuel industries, supporting investment in biofuels where such businesses would not otherwise have been commercially viable. While the growth of biofuel production has attracted considerable attention to its relationships with global food prices, less attention has been paid to the broader trade and economic impacts of the subsidies in particular their WTO implications. According to Harmer (2009), there is little evidence that domestic policymakers have taken into account WTO disciplines when crafting biofuel policies. Below is a list with issues for policymakers to consider on the relationship between biofuel subsidies and the law of the WTO (Harmer, 2009).
(a) WTO subsidy disciplines do not prohibit all subsidies or support to biofuels. Rather, the WTO rules concern themselves with subsidies that have a trade-distorting effect.
(b) Although often cited in discussions about the WTO and biofuel subsidies, the green box provisions of the WTO Agreement on Agriculture (AoA) do not provide a broad category sheltering measures on the basis that they offer some environmental benefits. To qualify as green box support, specific requirements must be met. For example, payments under environmental program must be limited to the costs of compliance with the program.
(c) The issue of whether subsidies have been passed on to the benefit of other participants in the biofuel production chain may be particularly relevant in a biofuels context, where subsidies are provided at various stages of the production and use chain.
(d) Attempts to provide assistance by way of decoupled payments are likely to be scrutinized closely
Importantly, if there is some condition attached to the payment that would have an impact on production positive or negative, direct or indirect then it is not likely to qualify as a decoupled payment.
(e) Many countries have sought to foster domestic production and use of biofuels, raising the prospect of policies that favor domestically sourced biofuels. For this reason, biofuel polices that express a preference for domestic over foreign-sourced biofuels raise may present problems as prohibited on local content subsidies.
In addition, Harmer (2009) identified issues that arise from the interaction between trade rules and biofuel subsidies, such as how bioethanol subsidies should be notified under the WTO, the multiplicity of biofuel subsidies and other incentives leading to trade-distorting impact; as well as issues arising from the shifting
74 The State of the Biofuels Market
focus of support to 2nd generation, especially how these biofuels feedstocks, such as switchgrass, be classified for WTO purposes.
litigation between countries on biofuels matters as of 2013, industry groups have already commissioned studies which could serve as support material if litigation arises in the future (Sidley Austin LLP, 2013). Of special relevance to the future is the potential inconsistency of ILUC rules with the rules of WTO, as this matter shall be revisited by the EU in 2020.
8.2. Environmental goods and services The Doha Development Agenda adopted in 2001 has launched negotiations on ion or, as appropriate, elimination of tariff and non- (World Trade Organization, 2001, p. 7) This launched the possibility to make biofuels subject to special negotiations to reduce tariff barriers according to paragraph 31 of the Doha Ministerial Declaration (Sugathan, 2009). Talks about the application of this paragraph and the development of criteria to include an environmental good had not progressed far when the Doha Round was suspended in 2006. A number of countries wanted to have negotiations on Environmental Goods and Services (EGS) including biofuels. In specific, three types of possible environmental goods were identified: (i) low-carbon fuels, which included ethanol and biodiesel; (ii) renewable technologies as solar cells or wind turbines; and (iii) environmentally preferable and energy-efficient products, such as efficient refrigerators. While discussions on EGS started in the early 2000s, as of 2013 there is no agreed-upon list of environmental goods. While a recent list has been discussed by APEC countries, there has been no biofuels in the draft (APEC , 2013).
8.3. Sustainability certification One of the most important developments in biofuel markets since the publication of the 2006 version of this review was certainly the issue of sustainability certification. Between 2006 and 2013 the international market for biofuels became subject to stringent regulations, specially focusing the on lifecycle GHG performances of biofuels when compared to their fossil counterparts.
The main biofuels certification initiatives took place in the EU and in the US (Scarlat & Dallemand, 2011). In laws adopted during 2007 and 2013, different environmental, economic and social aspects were mandated into biofuels production and trade, including indirect effects of production.
While there was consensus on the need for sustainability in biofuels, the production and usage of biofuels is a complex system, which can be subdivided in several steps (Lewandowski & Faaij, 2006). These include cultivation, harvesting, transport, storage, processing and distribution to fuel blenders and final users. Any effort seeking sustainability requires information from all these steps in the production chain. Details on certification procedures and costs were largely unknown by the time the RES Directive was adopted in the EU on April 2009. Policy makers and private agents at member state level in the EU had 20 months to comply with the directive nevertheless.
There are different possibilities for sustainability information in chains of custody. In the EU, the Commission impact assessment which accompanied the RES Directive proposal contained three options for regulating the chain of custody of biofuels, namely track and trace, book and claim and mass balance (Hodson, et al., 2010, p. 201)
Track and trace is a path of identity preservation, where all shipments claiming biofuels sustainability need to be physically separate from other biofuels in each step of the production chain. This system results in high costs given the logistics of duplicating containers along the chain, and was thus not endorsed by the European Commission (EC)17.
A book and claim system requires no physical link between production of biofuels which comply with the sustainability criteria and a claim of compliance (Hodson, et al., 2010, p. 201). Under this system,
Regulatory, Trade and Development Perspectives 75
operators register production of sustainable biofuels (thus booking this into a central registry), for which they receive a tradable certificate. In this system, certificates are traded in the market and there is no physical requirement that biofuels used meet any sustainability criteria, given they are matched with a certificate proving the same amount of sustainable biofuel has been produced and presumably consumed elsewhere.
Finally, a mass balance system is one in which a mix of sustainable and non-sustainable biofuels can take place. By establishing a flexible form of physical tracking, mass balance is more rigorous than a book and claim approach, but less so than full-identity preservation approach used in the track and trace option.
The EC opted for a mass balance system for biofuels certification and tracking in the chains of custody. Reasons for this choice included the need to change behavior of market actors and provide price premiums for sustainable biofuels. According to the EC, this was better safeguarded through physical tracking of shipments (European Union, 2009a, p. Recital 76 and §18). The EU directive also argued against a very stringent system of track and trace due to risks of unreasonable burden on the industry. The practical guidelines for market operators were published by the EC in 2010, and member states were charged with the task to verify compliance and promote audits (Hodson, et al., 2010, pp. 202-203; European Union, 2010).
The broad methodological scope and fact that the EU took on the task of designing sustainability criteria instead of using market agents (e.g. private, such as International Organizations for Standardization (ISOs)) has led to the development of a large number of parallel sustainability certification schemes for biofuels. Desplechin (2010) pointed 27 different biofuel sustainability schemes in early 2010. In fact, the RES Directive delegated the certification process itself to private agents, entrusting EU Member States (MS) with the responsibility of monitoring the system. MS were required to source information and audit local biofuel producers and operators. The RES Directive opened three options for market agents to obtain certification of sustainable biofuels: (i) via voluntary schemes for producers irrespective of origin; (ii) through agreements with third countries; and (iii) via agreements with EU member states.
Voluntary schemes include industry, NGOs and governmental schemes which, unlike the mandatory RES Directive, are of voluntary compliance by operators. Examples include the
Roundtable on Sustainable Biomaterials (RSB), Roundtable on sustainable Palm Oil (RSPO) and Bonsucro (RSB, 2013; RSPO, 2013; Bonsucro, 2013). The EC can examine voluntary schemes and decide that a voluntary scheme is at least as stringent as the requirements of the RES Directive (European Union, 2009a, p. Art. 18 § 4). MS can support and promote voluntary schemes via national agencies, but they cannot require mandatory compliance to sustainability requirements that are more stringent than those in the Directive. By November 2013, fourteen voluntary certification schemes were recognized by the EU as adequately covering the requirements in the RES Directive (European Commission, 2013b). Alternatively, market operators in third countries can obtain sustainability certification if their governments reach an agreement with the EC, again based on proof of attaining the same requirements as the minimum sustainability requirements for biofuels laid at RES Directive. The alternative of bilateral agreements path, however, has not been much used (Westberg & Johnson, 2013).
The comparative costs of the three certification options remains somewhat unclear. While some biofuel supplying countries will likely have institutional and scientific capacity to obtain bilateral certification with the EU such as Brazil, other emerging biofuel producers in developing regions will lack regional information on GHG lifecycles, land-use patterns and carbon stocks of arable land, all important for obtaining sustainability certification (Khatiwada, et al., 2012). Production of such information (and subsequent scientific validation) might represent a large financial and temporal burden delaying access to foreign markets and harming competitiveness. However, biofuel trading groups such as Greenergy and Abengoa are already funding the certification of biofuels from partners in developing countries to guarantee the availability of suppliers able to access the EU market. This could be an indication that the cost barrier may not be as significant as anticipated.
76 The State of the Biofuels Market
In the US two key legislations are applied in what concerns sustainability regulations, one at the federal level and other at the state level. At the federal level, the key instrument is the US Renewable Fuels Standard (RFS and RFS2 since 2010). The RFS2 requires a reduction of life cycle GHG emissions depending on the renewable fuel category: 20 percent for 1st generation biofuels (corn bioethanol), 50 percent for advanced biofuels (biodiesel and sugarcane bioethanol) and 60 percent GHG emission reductions for cellulosic biofuels (lignocellulosic bioethanol). However, the RFS2 thresholds do not constitute compliance levels for biofuels and they do not exclude certain biofuels if they do not meet the GHG performance thresholds. At the State level, the California Low Carbon Fuel Standard (CARB) adopted a Low Carbon Fuel Standard (LCFS) in 2007, calling for a reduction of at least 10 percent of carbon intensity of fuels by 2020 (see Table 2). This leads to a reduction of GHG emissions from transport sector in California by about 16 million metric tons in 2020 (Scarlat & Dallemand, 2011).
While the sustainability regulations in Europe and in the US had the effect of defining a new baseline standard for international biofuel trade, some issues were not mandated into law as of 2013. An example is the lack of dedicated official schemes for the use of solid biomass for energy purposes. Another area has seen slow progress was international harmonization in sustainability requirements for liquid biofuels, which while desired did not happen beyond initial technical discussions (Tripartite Task Force Brazil, European Union & United States of America, 2007).
9.
The UNCTAD BioFuels Initiative was conceived in 2005 to offer a facilitating hub for programs already underway in a number of institutions. While several initiatives already exist among UN and non-UN bodies,
countries.
The Initiative, with its partners, seeks to add value by providing interested countries with access to sound economic and trade policy analysis, capacity building activities and consensus building tools.
The Initiative tailors national strategies according to specific national circumstances and needs. It shares lessons from success, as well as to illustrating problems encountered by developed and developing countries alike in dealing with the technical, political, economic and sustainability-related aspects of biofuels.
The BioFuels Initiative works closely with other international organizations, NGOs and academia, with the purpose of advancing discussions on current issues faced by countries interested in exploring the biofuels option. The Initiative also works with the private sector, debating themes of relevance to biofuels trade, domestic use and policy design which directly or indirectly concern developing and least developed countries. More specifically, the initiative helps assess the potential that specific developing countries enjoy to engage in the growing worldwide production, use and trade of biofuels. It looks at the possible opportunities and impacts on domestic energy policies, food security, environmental management, employment creation and rural development.
BioFuels Initiative also deals with trade flows, tariff regimes, market access, and market entry issues affecting international trade in biofuels. Similarly to the goals of the CDM under the Kyoto Protocol and the Nairobi Framework, the initiative seeks to help developing countries to find cost-effective options to reduce the environment impact of their development. Activities do so by providing policy guidance, ideas and examples on how to overcome barriers when engaging biofuels markets. An International Advisory Expert Group provides guidance on technical issues related to biofuel production and international trade.
Regulatory, Trade and Development Perspectives 77
Between 2005 and 2013, the BioFuels Initiative has produced a number of studies on key issues concerning the synergies among biofuels, trade and development. Thematic studies included assessments of global biofuel markets, technology options, sustainability certification, as well as a survey of south-south initiatives on biofuels cooperation. The initiative also engaged in concrete capacity building initiatives, benefiting countries like Guatemala and Mexico. In the United Nations Conference on Sustainable Development (Rio+20) the UNCTAD BioFuels initiative held a side-event along with partners, discussing issues of relevance for biofuels development in different national contexts.
10. Conclusions
The provision of affordable energy is needed to achieve, expand and sustain prosperity for all. In the years after 2015 the UN system will be guided by sustainable development goals, one of which is very likely to be on energy. Increasing energy access and renewable energy utilization is key to avoiding environmental disruption and allowing human development to continue. This challenge cannot be met without the participation of bioenergy, which required global innovation and pioneer regulatory efforts on its sustainability.
Several developed and developing countries have established regulatory frameworks for biofuels, often including blending mandates of biofuels with fossil fuels. Countries have also provided different kinds of subsidies and incentives to support biofuel industries. These developments have created a large international biofuel market, which amounted to 22.5 bnl of biodiesel and 83.1 bnl of bioethanol by 2012. Furthermore, while in 2006 the market that was mostly focused on supplying energy demand in road transport, in 2013 it has expanded considerably into other sectors, such as aviation, electricity generation and household cooking.
The contribution of biofuels as a renewable fuel in the fight against global warming has been relatively small in global terms, as the participation of biofuels still amount to less than 5 percent of the international oil market in 2013. However, their usage and international trade gave countries options to reduce the carbon intensity of especially sensitive sectors, such as transport.
The growth in international biofuel markets between 2006 and 2013 has produced substantial diversification in agricultural production. By 2006, emerging biofuel markets were seen as holding great promise to enhance rural income and livelihoods, especially for the poor in developing countries. While market growth for bioethanol and biodiesel stabilized between 2010 and 2013, qualitative changes were constant in this period. The incorporation of sustainability regulations in major markets such as the EU and the US defined new baselines for businesses in the sector, which now have to engage in sustainability certification to operate. Many developing countries also included sustainability regulations in their biofuels strategies, with special focus on social equity, biodiversity protection and impacts on poverty, land tenure and food security. Some studies have raised questions about the costs linked to sustainability certification, and especially how developing country producers can cope with them.
Key developments in the biofuel market, however, were confined to a relatively small number of countries. Developing nations who made progress in this market are located in the same regions as 2006 (mostly Latin America and Asia), with little production taking place in Africa.
Biofuels have helped to enhance energy security and reduce expenditure on imported fossil energy, especially in countries like Brazil, the US and in the EU. Efficient production however has taken the form of large scale mills for starch, sugar and oilseeds-based feedstocks, predominantly at large scales. The participation of small producers to engage in biofuel production continues to be pursued in different models, but small scale production has not gained substantial traction in the major producing countries.
78 The State of the Biofuels Market
There is now an ongoing race towards the mass deployment of 2nd generation biofuels, which finally became commercially available in 2013 with the first batches being sold on the US market. Strategies to do so involve a mix of technology deployment initiatives and regulatory incentives. Since advanced biofuels avoid many of the socio-environmental problems tied to the dominant 1st generation, technical cooperation and joint investment initiatives will be necessary to keep developing countries involved in the production, trade and usage of advanced biofuels. Transfer of technology and capacity-building will contribute to facilitate developing country access to relevant energy technology and know-how. This gains special relevance as proposed regulations aim to limit the market for 1st generation biofuels towards 2020.
In 2006 it was believed that geographic, soil and weather considerations favorable to the production of feedstock would provide an edge for several developing countries to enter the biofuels market. Still, while having land to devote to biomass production, favorable climate conditions to grow them, and low-cost farm labor, the bulk of 1st generation biofuels production took place in the northern hemisphere. Trade in biofuels has consolidated itself as a balancing force (covering for gaps between local supply and total demand) rather than a major source of biofuels.
For exporting countries, especially small and medium-sized developing countries, export markets were thought to be instrumental for the achievement of efficient production scales in 2006; in 2013 is clear that scales are mostly determined by domestic demand within countries. Still, international trade in biofuels has provided win-win opportunities to many countries, since for several importing countries it is a necessary option for meeting the blending targets included in their domestic regulation. This interdependency has made evident by mutual reduction in import tariffs between in the United States and Brazil over the last years.
International trade in bioethanol has increased substantially, but has stabilized in line with overall market growth in the period between 2010 and 2013. While smaller in overall volume, international biodiesel markets have seen growing trade over the same period. There has been little international trade in bioethanol feedstocks and this situation is unlikely to change. The opposite occurs in biodiesel, where trade of feedstocks of semi-processed products (e.g. soybeans and palm oil) has been important contributors to international trade in the sector. While in 2006 biodiesel production outside the EU was still limited, by 2013 countries like Malaysia, Indonesia and Argentina have achieved considerable status as producers and exporters of this fuel. The traditional structure of the plant-oil industry partially explains this situation.
Producing countries will likely continue to rely on domestically produced feedstocks for bioethanol manufacturing for the near future, but this is likely to change if the participation of cellulosic feedstocks increases as 2nd generation biofuels starts to be deployed.
Subsidies on conventional biofuels have been gradually reduced in the EU and in the US, which are shifting support mechanisms towards residue and non-edible biomass-based feedstocks. Some biofuel imports are allowed into these markets duty-free and quota-free under different preferential trade arrangements. The remaining imports, however, face tariffs which sometimes offset lower production costs in producing countries and represent significant barriers to imports. Moreover, export performance is often penalized by the graduation of the successful exporting countries from the preferential schemes. This uncertainty in tariff regimen presents a barrier to investments especially in developing and least developed countries.
While tariffs have generally been reduced since 2006, non-tariff barriers applicable to biofuels (such as difficulties in adhering to predictable sustainability standards) bring negative implications on investments in the sector. The Doha negotiations on environmental goods and services provided an avenue for reducing tariffs and non-tariff barriers affecting trade in biofuels and related products. However, the suspension of the negotiations on July 2006 has prompted countries to look to bilateral and regional agreements as
Regulatory, Trade and Development Perspectives 79
quicker and more predictable tools for the removal of tariffs and non-tariff measures affecting international trade in biofuels and sustainable energy technologies.
Labeling and certification have become important traits in the biofuels market of 2013. While sustainability certification is paramount to a better, more responsible biofuels industry, the implications of sustainability certification of biofuels and related feedstocks for developing countries remains a rather complex issue. More in-depth understanding of such implications is needed, especially concerning the distribution of sustainability costs along supply chains, the ability of developing countries to absorb novel technologies, especially those concerning advanced environmental stewardship. Another issue facing many countries is how to strike optimal regulatory setups to promote technological progress in the sector, at the same time including additional producers into the market. The development of biofuels sustainability towards 2020 faces therefore the challenge of progressing without creating unnecessary barriers to international trade, especially to exports from developing countries.
Continued demand for biofuels, and especially the start of market deployment of 2nd generation biofuels imply that production and export opportunities may multiply worldwide. However, biofuels will continue to provide different types of opportunities to different countries. UNCTAD, through its BioFuels Initiative, is providing developing countries with access to economic and trade policy analysis, capacity building activities, and consensus building tools to help them exploring these opportunities.
80 The State of the Biofuels Market
References
US Environmental Protection Agency, 2013. Renewable Fuel Standard (RFS). [Online] Available at: http://www.epa.gov/otaq/fuels/renewablefuels/index.htm [Accessed 27 November 2013].
Aatola, H., Larmi, M. & Sarjovaara, T., 2008. Hydrotreated Vegetable Oil (HVO) as a Renewable Diesel Fuel:Trade-off between NOx, Particulate Emission, and Fuel Consumption of a Heavy Duty Engine, Helsinki: SAE International.
AfDB, 2006. High Oil Prices and the African Economy: Concept paper prepared for the 2006 African Development Bank Annual Meetings, Burkina Faso: AfDB.
Ajanovic, A., 2011. Biofuels versus food production: Does biofuels production increase food prices?. Energy, 36(4), p. 2070 2076.
Amigun, B., Musango, J. K. & Stafford, W., 2011. Biofuels and sustainability in Africa. Renewable and Sustainable Energy Reviews, 15(2), pp. 1360-1372.
Andersen, A. D., 2011. Innovation systems and natural resources - the case of sugarcane in Brazil, Aalborg: Aalborg University.
APEC , 2013. Environmental Goods and Services. [Online] Available at: http://egs.apec.org/index.php [Accessed 3 December 2013].
Aradhey, A. & Lagos, J., 2013. India Biofuels Annual 2013, New Delhi: USDA Foreign Agricultural Service. ASPO, 2006. Newsletter No. 64. [Online]
Available at: http://www.peakoil.ie/downloads/newsletters/newsletter64_200604.pdf ASTM Committee, 2011. Standard Specification for Aviation Turbine Fuel Containing Synthesized Hydrocarbons.
Cincinnati: ASTM International. Aylott, M. & Higson, A., 2013. How will the changing biofuels market affect the development of bio-based
chemicals?. Biofuels, Bioproducts and Biorefining, 7(1), pp. 9-11. Banco Central do Brasil, 2013. Centro de Estudos Avançados em Economia Aplicada. [Online]
Available at: http://www.bcb.gov.br/?cambio [Accessed 27 November 2013].
Barros, S., 2013. Brazil Biofuels Annual 2013, São Paulo: USDA Foreign Agricultural Service. Batidzirai, B., Smeets, E. & Faaij, A., 2012. New Conversion Technologies for liquid biofuels production in Africa.
In: R. Janssen & D. Rutz, eds. Bioenergy for Sustainable Development in Africa. London: Springer, pp. 117-130.
BBI International, 2013. Ethanol Producers Magazine. [Online] Available at: http://www.ethanolproducer.com/plants/listplants/US/Existing/All [Accessed 8 October 2013].
Bergek, A. & Jacobsson, S., 2010. Are tradable green certificates a cost-efficient policy driving technical change or a rent-generating machine? Lessons from Sweden 2003 2008. Energy Policy, 38(3), p. 1255 1271.
Bierregaard Jr, R., Gascon, C., Lovejoy, T. E. & Mesquita, R. eds., 2001. Lessons from Amazonia: The Ecology and Conservation of a Fragmented Forest. New Haven: Yale University Press.
Bird, L. & Sumner, J., 2010. Green Power Marketing in the United States: A Status Report (2009 Data), Colorado: National Renewable Energy Laboratory.
Boeing & CANSO, 2012. ATM Global Environment Efficiency Goals for 2050, The Netherlands: Boeing & CANSO. Bonsucro, 2013. Bonsucro. [Online]
Available at: http://www.bonsucro.com/ [Accessed 28 November 2013].
BP, 2013. BP Statistical Review of World Energy 2013, London: BP. British Airways, 2013. Corporate Responsibility Report 2012, London: British Airways. Cartwright, A., 2010. Biofuels trade and sustainable development: the case of South African bioethanol. In: A.
Dufey & M. Grieg-Gran, eds. Biofuels production, trade and sustainable development. London: International Institute for Environment and Development, pp. 65-102.
Regulatory, Trade and Development Perspectives 81
CEPEA, 2013. Centro de Estudos Avançados em Economia Aplicada. [Online] Available at: http://cepea.esalq.usp.br/indicador/ [Accessed 27 November 2013].
Charles, C. et al., 2013. Biofuels at what cost? A review of costs and benefits of EU biofuel policies, Winnipeg: The International Institute for Sustainable Development.
Chavez, L. & Berman, D., 2012. Mexico Biofuels Annual: Uncertainty on the Future of Mexican Biofuels, Mexico City: USDA Foreign Agricultural Service.
Chen, X. & Khanna, M., 2013. Food vs. Fuel: The Effect of Biofuel Policies. American Journal of Agricultural Economics, 95(2), pp. 289-295.
COMPETE Network, 2009. ANNEX 2-3-2: Report on potential contribution to sustainable energy supply, Utrecht: Utrecht University.
Corpuz, P. & Shull, P., 2013. Philippine Biofuels Situation and Outlook, Manila: USDA Foreign Agricultural Service.
Dahlbacka, B., 2009. Sweden Biofuels Annual 2009, Stockholm: USDA Foreign Agricultural Service. Damuri, Y. R. & Atje, R., 2012. Investment Incentives for Renewable Energy: Case study of Indonesia, Manitoba:
International Institute for Sustainable Development. Deenanath, E. V., Iyuke, S. & Rumbold, K., 2012. The Bioethanol Industry in Sub-Saharan Africa: History,
Challenges, and Prospects. Journal of Biomedicine and Biotechnology, Volume 2012, pp. 1-11. Denruyter, J. et al., 2010. Bioenergy in Africa Time for a Shift?. Recherche scientifique & Innovation
technologique, Issue 19-20, pp. 1-16. Desplechin, E., 2010. The Br Sugar Industry /
Zuckerindustrie, 135(4), pp. 222-224.
biodiesel from used domestic waste oils: A review. Process Safety and Environmental Protection, 90(3), pp. 164-179.
Elobeid, A. & Tokgoz, S., 2008. Removing Distortions in the U.S. Ethanol Market: What Does It Imply for the United States and Brazil?. American Journal of Agricultural Economics, 90(4), pp. 919-932.
EPAMIG, 2005. Biodiesel: tendência no mundo e no Brasil. Informe Agropecuário, 26(229), pp. 7-13. European Biodiesel Board, 2013. Statistics: The EU biodiesel industry. [Online]
Available at: http://www.ebb-eu.org/stats.php [Accessed 27 November 2013].
European Biofuels Technology Platform, 2013. Global biofuels - an overview. [Online] Available at: http://www.biofuelstp.eu/global_overview.html [Accessed 7 November 2013].
European Commission, 2010. Report from the Commission on indirect land-use change related to biofuels and bioliquids. [Online] Available at: http://eur-lex.europa.eu/LexUriServ/LexUriServ.do?uri=CELEX:52010DC0811:EN:HTML:NOT [Accessed 26 November 2013].
European Commission, 2012. New Commission proposal to minimise the climate impacts of biofuel production. [Online] Available at: http://europa.eu/rapid/press-release_IP-12-1112_en.htm [Accessed 15 October 2013].
European Commission, 2013a. EU to impose definitive anti-dumping duties on biodiesel from Argentina and Indonesia. [Online] Available at: http://trade.ec.europa.eu/doclib/press/index.cfm?id=989 [Accessed 27 November 2013].
European Commission, 2013b. Sustainability certification schemes adopted in the European Union. [Online] Available at: http://ec.europa.eu/energy/renewables/biofuels/sustainability_schemes_en.htm [Accessed 28 November 2013].
European Union, 2003a. Directive 2003/96/EC of 27 October 2003 restructuring the Community framework for the taxation of energy products and electricity. Brussels: Official Journal of the European Union.
European Union, 2003b. Directive 2003/30/EC of the European Parliament and of the Council on the promotion of the use of biofuels or other renewable fuels for transport. Brussel: Official Journal of the European Union.
82 The State of the Biofuels Market
European Union, 2009a. Directive 2009/28/EC. Promotion of the use of energy from renewable sources and amending and subsequently repealing Directives 2001/77/EC and 2003/30/EC. Brussels: Official Journal of the European Union.
European Union, 2009b. Directive 2009/30/EC of the European Parliament and of the Council of 23 April 2009 amending Directive 98/70/EC as regards the specification of petrol, diesel and gas-oil and introducing a mechanism to monitor and reduce greenhouse gas emissions. Brussels: Official Journal of the European Union.
European Union, 2009c. Commission Regulation (EC) No 193/2009. Brussels: Official Journal of the European Union.
European Union, 2010. Communication from the Commission on the practical implementation of the EU biofuels and bioliquids sustainability scheme and on counting rules for biofuels. Brussels: Official Journal of the European Union.
European Union, 2013. Decision No. 377/2013/EU of the European Parliament and of the Council of 24 April 2013 derogating temporarily from Directive 2003/87/EC establishing a scheme for greenhouse gas emission allowance trading within the Community. Brussels: Official Journal of the European Union.
F.O. Lichts, 2013. World Ethanol & Biofuel Reports - Vol. 12, No. 4 from October 21,2013, Ratzeburg: F.O. Lichts.
Farley, P., 2011. Introduction: Next-Generation Biofuels. Nature, 474(7352), pp. S2-S5. Flach, R., Bendz, K., Krautgartner, R. & Lieberz, S., 2013. EU Biofuels Annual 2013, USDA Foreign Agricultural
Service: Hague. Flach, R., Bendz, K., Lieberz, S. & Smith, M. E., 2012. EU-27 Biofuels Annual, The Hague: USDA Foreign
Agricultural Service. Gantz, R., 2012. Brazil Extends Suspension of 20% Ethanol Import Tariff. [Online]
Available at: http://english.unica.com.br/clipping/show.asp?cppCode=07AB42F0-4CFB-463E-A767-4B8CB51D1320 [Accessed 27 November 2013].
Gerasimchuk, I., Bridle, R., Beaton, C. & Charles, C., 2012. State of Play on Biofuel Subsidies: Are policies ready to shift?, Winnipeg: The International Institute for Sustainable Development.
Gilbert, A., Pinzon, L. & Lopez, J., 2013. Colombia Biofuels Annual: Blend Mandates Maintain Status Quo as a Biofuel Policy Vision Remains Unclear, Bogota: USDA Foreign Agricultural Service.
Gilbert, N., 2011. Local benefits: The seeds of an economy. Nature, 474(7352), pp. S18-S19. Gnansounou, E., Panichelli, L., Dauriat, A. & Villegas, J. D., 2008. Accounting for indirect land-use changes in
GHG balances on biofuels. Review of current approaches, Lausanne: EPFL-ENAC-LASEN. Goldemberg, J., Teixeira, S. C., Nastari, P. M. & Lucos, O., 2004. Ethanol learning curve - the Brazilian
experience. Biomass & Bioenergy, 26(3), pp. 301-304. Gómez, M. F. & Sanches-Pereira, A., 2013. Technology for social inclusion: the case of electricity access in the
Brazilian Amazon. Journal of Sustainable Development of Energy, Water and Environment Systems, 1(3), pp. 238-260.
Government of Sweden, 2010. The Swedish National Action Plan for the promotion of the use of renewable energy in accordance with Directive 2009/28/EC and the Commission Decision of 30.06.2009, Stockholm: Regeringskansliet.
Grau, B. et al., 2010. Small-scale production of straight vegetable oil from rapeseed and its use as biofuel in the Spanish territory. Energy Policy, 38(1), p. 189
ig196.
Harmer, T., 2009. Biofuel subsidies and the law of the WTO, Geneva: International Centre for Trade and Sustainable Development.
Henzen, C., 2008. The Impact of Land Use on Biodiversity in the Framework of Life Cycle Assessment, Zürich: University of Basel.
Hira, A., 2011. Sugar rush: Prospects for a global ethanol market. Energy Policy, 39(11), pp. 6925-6935. Hira, A. & Oliveira, L. G., 2009. No substitute for oil? How Brazil developed its ethanol industry.. Energy Policy,
37(6), pp. 2450-2456. HLPE, 2013. Biofuels and food security, Rome: High Level Panel of Experts on Food Security and Nutrition of the
Committee on World Food Security. Hodson, P., Jones, C. & van Steen, H. eds., 2010. EU Energy Law: Vol. III - Renewable Energy Law and Policy in
the European Union. The Netherlands: Claeys & Casteels.
Regulatory, Trade and Development Perspectives 83
Idígoras, G. & Papendieck, S., 2011. Argentina Biodiesel Industry. Buenos Aires: BIM - Business Issue Management.
IISD, 2013. Addendum to Biofuels At what cost? A review of costs and benefits of EU biofuel policies, Winnipeg: International Institute for Sustainable Development.
IndexMundi, 2013. Country facts. [Online] Available at: http://www.indexmundi.com/ [Accessed 23 October 2013].
Instituto Brasileiro de Petróleo, Gás e Biocombustíveis, 2013. Informações e estatísticas da indústria. [Online] Available at: http://200.189.102.61/SIEE/ [Accessed 21 October 2013].
Integrated Regional Information Networks , 2013. IRIN Africa: More ethanol could lighten Malawi's fuel bill. [Online] Available at: http://www.irinnews.org/report/97337/more-ethanol-could-lighten-malawi-apos-s-fuel-bill [Accessed 11 November 2013].
International Council on Clean Transportation, 2012. Global Transportation Energy and Climate ROADMAP: the impact of transportation policies and their potential to reduce oil consumption and greenhouse gas emissions, Washington: ICCT.
International Energy Agency, 2000. CO2 Emissions from Fuel Combustion - Edition 2000, Paris: OECD/IEA. International Energy Agency, 2001. CO2 Emissions from Fuel Combustion - Edition 2001, Paris: OECD/IEA. International Energy Agency, 2002. CO2 Emissions from Fuel Combustion - Edition 2002, Paris: OECD/IEA. International Energy Agency, 2003. CO2 Emissions from Fuel Combustion - Edition 2003, Paris: OECD/IEA. International Energy Agency, 2004a. Biofuels For Transport: An International Perspective. Paris: OECD/IEA. International Energy Agency, 2004b. CO2 Emissions from Fuel Combustion - Edition 2004, Paris: OECD/IEA. International Energy Agency, 2005. CO2 Emissions from Fuel Combustion - Edition 2005, Paris: OECD/IEA. International Energy Agency, 2006. CO2 Emissions from Fuel Combustion - Edition 2006, Paris: OECD/IEA. International Energy Agency, 2007. CO2 Emissions from Fuel Combustion - Edition 2007, Paris: OECD/IEA. International Energy Agency, 2008a. CO2 Emissions from Fuel Combustion - Edition 2008, Paris: OECD/IEA. International Energy Agency, 2008b. End User Petroleum Product Prices and Average Crude Oil Import Costs,
Paris: OECD/IEA. International Energy Agency, 2009. CO2 Emissions from Fuel Combustion - Edition 2009, Paris: OECD/IEA. International Energy Agency, 2010a. Sustainable production of second-generation biofuels - Potential and
perspectives in major economies and developing countries, Paris: OECD/IEA. International Energy Agency, 2010b. CO2 Emissions from Fuel Combustion - Edition 2010, Paris: OECD/IEA. International Energy Agency, 2011. CO2 Emissions from Fuel Combustion - Edition 2011, Paris: OECD/IEA. International Energy Agency, 2012a. World Energy Outlook 2012, Paris: OECD/IEA. International Energy Agency, 2012b. CO2 Emissions from Fuel Combustion - Edition 2012, Paris: OECD/IEA. International Energy Agency, 2013a. Key World Energy Statitistics, Paris: OECD/IEA. International Energy Agency, 2013b. Topic: Biofuels. [Online]
Available at: http://www.iea.org/topics/biofuels/ [Accessed 2 October 2013].
International Energy Agency, 2013c. Tracking Clean Energy Progress 2013: IEA Input to the Clean Energy Ministerial, Paris: OECD/IEA.
International Maritime Organization, 2011. Study shows significant reductions in CO2 emissions from ships from IMO measures. [Online] Available at: http://www.imo.org/MediaCentre/PressBriefings/Pages/57-EEDIstudy.aspx [Accessed 1 October 2013].
International Maritime Organization, 2012. Shipping, World Trade and the reduction of CO2 emissions, London: International Chamber of Shipping.
International Maritime Organization, 2013. Technical and Operational Measures. [Online] Available at: http://www.imo.org/OurWork/Environment/PollutionPrevention/AirPollution/Pages/Technical-and-Operational-Measures.aspx [Accessed 1 October 2013].
84 The State of the Biofuels Market
International Sugar Organization, 2012. World Fuel Ethanol Outlook to 2020, London: International Sugar Organization.
International Transport Forum, 2009. Reducing transport GHG emissions: opportunities and costs (Preliminary Findings), Paris: OECD/ITF.
Janssen, R. & Rutz, D. eds., 2012. Bioenergy for Sustainable Development in Africa. London: Springer. Jatropha Alliance, 2008. Global Market Study on Jatropha - Final Report. [Online]
Available at: http://www.jatropha-alliance.org/fileadmin/documents/GEXSI_Global-Jatropha-Study_FULL-REPORT.pdf [Accessed 23 October 2013].
Johnson, F. X. & Matsika, E., 2006. Bio-energy trade and regional development: the case of bio-ethanol in southern Africa. Energy for Sustainable Development, 10(1), p. 42
p53.
Johnson, F. X. & Seebaluck, V. eds., 2012. Bioenergy for Sustainable Development and International Competitiveness: The Role of Sugar Cane in Africa. Oxford: Routledge.
Joseph, K. & Sallyards, M., 2013a. Paraguay Biofuels Annual 2013, Buenos Aires: USDA Foreign Agricultural Service.
Joseph, K. & Sallyards, M., 2013b. Argentina Biofuels Annual 2013, Buenos Aires: USDA Foreign Agricultural Service.
Jumbe, C. B. L., Msiska, F. B. M. & Madjera, M., 2009. Biofuels development in Sub-Saharan Africa: Are the policies conducive?. Energy Policy, 37(11), p. 4980 4986.
Khatiwada, D., 2013. Assessing the sustainability of bioethanol production in different development contexts: a systems approach, Stockholm: KTH Royal Institute of Technology.
Khatiwada, D., Seabra, J., Silveira, S. & Walter, A., 2012. Accounting greenhouse gas emissions in the lifecycle of Brazilian sugarcane bioethanol: Methodological references in European and American regulations. Energy policy, Volume 47, p. 384 397.
Kim, J. E., Popp, D. & Prag, A., 2013. The Clean Development Mechanism and neglected environmental technologies. Energy Policy, 55(Special section: Long Run Transitions to Sustainable Economic Structures in the European Union and Beyond), p. 165 179.
KLM Royal Dutch Airlines, 2013. Sustainable biofuels. [Online] Available at: http://www.klm.com/csr/en/climate/footprint/biofuels/index.html
Komarudin, H., Obidzinski, K. & Andrianto, A., 2012. Biofuel development in Indonesia: Progress and challenges. [Online] Available at: http://www.slideshare.net/CIFOR/biofuel-development-in-indonesia-progress-and-challenges [Accessed 6 November 2013].
Kong-Win Chang, J. T. L. K. Y., 2013. Comparative Energy and Greenhouse Gases Analysis between small- and large-scale sugarcane production in Mauritius, Stockholm: KTH Royal Institute of Technology.
Kumar, S., Singh, S. P., Mishra, I. M. & Adhikari, D. K., 2009. Recent Advances in Production of Bioethanol from Lignocellulosic Biomass. Chemical Engineering & Technology, 32(4), pp. 517-526.
Kuronen, M., Mikkonen, S., Aakko, P. & Murtonen, T., 2007. Hydrotreated vegetable oil as fuel for heavy duty diesel engines, Helskinki: SAE International.
Kutas, G., Lindberg, C. & Steenblik, R., 2007. BIOFUELS - AT WHAT COST ? Government support for ethanol and biodiesel in the European U, Geneva: International Institute for Sustainable Development.
Lewandowski, I. & Faaij, A. P., 2006. Steps towards the development of a certification system for sustainable bio-energy trade. Biomass and Bioenergy, 30(2), p. 83 104.
Low, S. & Isserman, A. M., 2009. Ethanol and the Local Economy. Industry Trends, Location Factors, Economic Impacts and Risks. Economic Development Quaterly, 23(1), pp. 71-88.
Lundgren, T., Marklund, P., Brännlund, R. & Kriström, B., 2008. The Economics of Biofuels. International Review of Environmental and Resource Economics, 2(3), pp. 237-280.
Martinot, E., 2006. Renewable Energy Gains Momentum: Global Markets and Policies in the Spotlight. Environment, 48(6), pp. 26-43.
Mata, T. M., Martins, A. A. & Caetano, N. S., 2010. Microalgae for biodiesel production and other applications: A review. Renewable and Sustainable Energy Reviews, 14(1), p. 217 232.
Mathews, J. A., 2007. Biofuels: What a Biopact between North and South could achieve. Energy Policy, 35(7), p. 3550 3570.
Regulatory, Trade and Development Perspectives 85
Matheys, J. et al., 2008. Alternative Road Vehicles, Electric Rail Systems, Short Flights: An Environmental Comparison. The World Electric Vehicle Journal, 2(4), pp. 236-241.
McCrone , A. et al. eds., 2013. Global Trends in Renewable Energy Investment 2013. New York: UNEP. McPhail, L., Westcott, P. & Lutman, H., 2011. The Renewable Identification Number System and U.S. Biofuel
Mandates, Washington: US Department of Agriculture. Ministério de Minas e Energia, 2013. Programa Nacional de Produção e Uso do Biodiesel. [Online]
Available at: http://www.mme.gov.br/programas/biodiesel [Accessed 21 October 2013].
Ministério do Desenvolvimento, Indústria e Comércio Exterior, 2013. Comércio Exterior. [Online] Available at: http://www.mdic.gov.br//sitio/interna/index.php?area=5 [Accessed 27 November 2013].
Mitchell, D., 2011. Biofuels in Africa: Opportunities, Prospects, and Challenges, Washington: The International Bank for Reconstruction and Development / The World Bank.
Møller, F. & Martinsen, L., 2013. Socio-economic evaluation of selected biogas technologies, Aahus: Danish Centre for Environment and Energy.
Monreal, C. M., 2008. La utilización de los residuos agrícolas y otros desechos para la producción de Bioenergia, Biocombustibles y Bioproductos, Ottawa: Agriculture and Agri-Food Canada .
Neves, M. F. & Chabbad, F. R., 2012. International Food and Agribusiness Management Review, 15(1), pp. 159-166.
Nolte, G. E. & Purdy, E., 2013. Peru Biofuel Annual , Lima: USDA Foreign Agricultural Service. OECD/Food and Agriculture Organization of the United Nations, 2011. OECD-FAO Agricultural Outlook 2011-
2020, Paris: OECD/FAO. OECD/Food and Agriculture Organization of the United Nations, 2013a. OECD-FAO Agricultural Outlook 2013,
Paris: OECD. OECD/Food and Agriculture Organization of the United Nations, 2013b. FAOSTAT. [Online]
Available at: http://faostat.fao.org/ [Accessed 25 November 2013].
Oxford Analytica, 2006. NORTH AMERICA/BRAZIL: Ethanol key in fuel market. [Online] Available at: https://www.oxan.com/display.aspx?ItemID=DB127689 [Accessed 7 October 2013].
Pacini, H. & Batidzirai, B., 2011. The Development of Biofuels Capacities - Strengthening the position of African Countries through increased energy security. In: F. X. Johnson & V. Seebaluck, eds. Bioenergy for Sustainable Development and International Competitiveness - The role of sugar cane in Africa. London: Routledge.
Pacini, H. & Silveira, S., 2010. Ethanol or gasoline? Consumer choice in face of different fuel pricing systems in Brazil and Sweden. Biofuels, 1(5), pp. 685-695 .
Pacini, H. & Silveira, S., 2011. Consumer choice between ethanol and gasoline: Lessons from Brazil and Sweden. Energy Policy, 39(11), p. 6936 6942.
Pacini, H. & Strapasson, A. B., 2012. Innovation subject to sustainability: The European policy on biofuels and its effects on innovation in the Brazilian bioethanol industry. Journal of Contemporary European Research, 8(3), pp. 1-31.
Palupi , P. S., 2012. ISPO dan RSPO Sama Pentingnya. [Online] Available at: http://www.agrina-online.com/redesign2.php?rid=20&aid=3862 [Accessed 4 February 2013].
PETROBRAS, 2010. Price Composition. [Online] Available at: http://www.petrobras.com.br/en/products/price-composition/ [Accessed 22 Novembro 2013].
Pires, A. & Schechtman, R., 2010. International Biofuels Policies. In: E. L. Sousa & I. C. Macedo, eds. ethanol and bioelectricity sugarcane in the future of the energy matrix. São Paulo: UNICA, pp. 191-224.
Preechajarn, S., Prasertsri, P. & Santella, R., 2013. Thailand Biofuel Annual , Bangkok: USDA Foreign Agricultural Service.
PREEM, 2010. Drivmedelspriser. [Online] Available at: http://www.preem.se/templates/page____781.aspx [Accessed 22 November 2013].
86 The State of the Biofuels Market
Purohit, P. & Michaelowa, A., 2007. CDM potential of bagasse cogeneration in India. Energy Policy, 35(10), p. 4779 4798.
Qiu, H., Sun, L., Huang, J. & Rozellec, S., 2012. Liquid biofuels in China: Current status, government policies, and future opportunities and challenges. Renewable and Sustainable Energy Reviews, 16(5), p. 3095 3104.
Red Mexicana de Bionergía, 2011. La Bioenergía en Mexico - Situación actual y perspectivas, Mexico: REMBIO. REN21, 2013. Renewables 2013: Global Status Report, Paris: REN21. Renewable Fuel Association, 2012. Global Ethanol Production to Reach 85.2 Billion Litres in 2012. [Online]
Available at: http://www.ethanolrfa.org/news/entry/global-ethanol-production-to-reach-85.2-billion-litres-in-2012/ [Accessed 4 October 2013].
Renewable Fuel Association, 2013a. World Fuel Ethanol Production. [Online] Available at: http://ethanolrfa.org/pages/World-Fuel-Ethanol-Production [Accessed 23 October 2013].
Renewable Fuel Association, 2013b. Statistics. [Online] Available at: http://www.ethanolrfa.org/pages/statistics [Accessed 27 November 2013].
RFA, 2008. The Gallagher Review of the indirect effects of biofuels production, London: The Renewable Fuels Agency.
Rodrigues, R. A. & Accarini, J. H., 2007. Brazil's biodiesel program. In: G. o. Brazil, ed. Biofuels in Brazil: Realities and Prospects. Brasilia: Ministério das Relações Exteriores, pp. 159-181.
Rosillo-Calle, F. & Johnson, F. X. eds., 2010. Food versus Fuel - an informed introduction to biofuels. London: Zed Books.
RSB, 2013. Roundtable on Sustainable Biomaterials. [Online] Available at: http://rsb.org/ [Accessed 28 November 2013].
RSPO, 2013. Roundtable on Sustainable Palm Oil. [Online] Available at: http://www.rspo.org [Accessed 28 November 2013].
Rubin, O. D., Carriquiry, M. & Hayes, D. J., 2008. Implied Objectives of U.S. Biofuel Subsidies, Ames: Iowa State University.
Sanches-Pereira, A. & Gómez, M. F., 2013. Towards a Cleaner Vehicle Fleet: the Dynamics of the Swedish Biofuel System. São Paulo, UNIP.
Savage, N., 2011. Algae: The scum solution. Nature, 474(7352), pp. S15-S16. Scarlat, N. & Dallemand, J., 2011. Recent developments of biofuels/bioenergy sustainability certification: A
global overview. Energy Policy, 39(3), p. 1630pm
1646. Scott, R., Junyang, J. & Riedel, M., 2013. People's Republic of China Biofuels Annual 2013, Beijing: USDA
Foreign Agricultural Service. SENER, 2006. Potenciales y Viabilidad del Uso de Bioetanol y Biodiesel para el Transporte en Mexico, Mexico:
Secretaría de Energía. Serra, T., Zilberman, D. & Gil, J. M., 2011b. Price Volatility in Ethanol Markets. European Review of Agricultural
Economics, 38(2), pp. 259-280. Serra, T., Zilberman, D., Gil, J. M. & Goodwin, B. K., 2011a. Nonlinearities in the US Corn-Ethanol-Oil Price
System. Agricultural Economics, 42(1), pp. 35-45. Sidley Austin LLP, 2013. WTO-Consistency of the application of proposed amendments to the EU Renewable
Energy Directive to Trade in Biofuels. São Paulo: UNICA. Slette, J., Wiyono, I. E. & Abdi, A., 2012. Indonesia Biofuel Annual 2012, Jakarta: USDA Foreign Agricultural
Service. Slette, J. & Wiyonoi, I. E., 2013. Indonesia Biofuels Annual 2013, Jakarta: USDA Foreign Agricultural Service. Smeets, E., Johnson, F. X. & Ballard-Tremeer, G., 2012. Keynote Introduction: Traditional and Improved Use of
Biomass for Energy in Africa. In: R. Janssen & D. Rutz, eds. Bioenergy for Sustainable Development in Africa. London: Springer, pp. 3-25.
Sokona, Y., Mulugetta, Y. & Gujba, H., 2012. Widening energy Access in Africa: Towards energy transition. Energy Policy, 47(Supplement 1), pp. 3-10.
Regulatory, Trade and Development Perspectives 87
Solecki, M., Dougherty, A. & Epstein, R., 2012. Advanced Biofuel Market Report 2012, San Francisco: E2 | Environmental Entrepreneurs.
Sorda, G., Banse, M. & Kemfert, C., 2010. An overview of biofuel policies across the world. Energy Policy, 38(11), p. 6977 6988.
Potential for the production and use of Biodiesel in the South African Mining Industry - Presentation to the NTSF Symposium Mintek. Johannesburg: MINTEK.
Sticklen, M. B., 2008. Plant genetic engineering for biofuel production: towards affordable cellulosic ethanol. Nature Reviews Genetics, Volume 9, pp. 433-443.
Sugathan, M., 2009. Liberalization of Climate-friendly Environmental Goods: Issues for Small Developing Countries. International Centre for Trade and Sustainable Development : San Francisco.
Svenska Petroleum och Biodrivmedel Institutet, 2013. Utlevererad volym av drivmedel. [Online] Available at: http://spbi.se/statistik/volymer/volymer-drivmedel/ [Accessed 28 March 2013].
Swedish Energy Agency, 2009. Transportsektorns energianvändning 2008, Eskilstuna: Statens energimyndighet. Swedish Energy Agency, 2011. Energy in Sweden 2011, Eskilstuna: Statens energimyndighet. Swedish Energy Agency, 2012a. Analys av marknaderna för biodrivmedel, Eskilstuna: Statens energimyndighet. Swedish Energy Agency, 2012b. Transportsektorns energianvändning 2011, Eskilstuna: Statens
energimyndighet. Swedish Energy Agency, 2013. Transportsektorns energianvändning 2012, Eskilstuna: Statens energimyndighet. Tay, K. & Hoff, R., 2009. Guatemala Biofuels Annual, Guatemala City: USDA Foreign Agricultural Service. Tay, K. & Sporkin-Morrison, B. G., 2013. Guatemala Biofuels Annual, Guatemala City: USDA Foreign Agricultural
Service. Timilsina, G. R. & Shrestha, A., 2011. How much hope should we have for biofuels?. Energy, 36(4), pp. 2055-
2069. Tripartite Task Force Brazil, European Union & United States of America, 2007. White paper on internationally
compatible biofuel standards. Brussels: European Commission. UK Department of Energy and Climate Change, 2009. The UK Low Carbon Transition Plan: National Strategy for
Climate Change, London: Stationery Office. UNCTAD, 2006. The Emerging Biofuels Market: Regulatory, Trade and Development Implications, Geneva:
United Nations. UNCTAD, 2008. Biofuel production technologies: status, prospects and implications for trade and development,
Geneva: United Nations. UNCTAD, 2013. Mexico's Agriculture Development: Perspectivews and Outlook, Geneve: United Nations. UNDESA, 2007. Small-Scale Production and Use of Liquid Biofuels in Sub-Saharan Africa: Perspectives for
Sustainable Development, New York: United Nations Department of Economic and Social Affairs. UNEP, 2009. Towards Sustainable Production and Use of Resources: Assessing Biofuels, New York: United
Nations. UNFCCC, 2013a. Land Use, Land-Use Change and Forestry (LULUCF). [Online]
Available at: http://unfccc.int/methods/lulucf/items/1084.php [Accessed 26 November 2013].
UNFCCC, 2013b. Views on land use, land-use change and forestry issues referred to in decision 2/CMP.7, paragraphs 5-7. Submissions from Parties and admitted observer organizations. [Online] Available at: http://unfccc.int/documentation/documents/advanced_search/items/6911.php?priref=600007379 [Accessed 26 November 2013].
UNICA, 2013. UNICADATA. [Online] Available at: http://www.unicadata.com.br/ [Accessed 27 November 2013].
United Nations, 2013a. UN Sustainable Development Knowledge Platform. [Online] Available at: http://www.un.org/esa/dsd/dsd_aofw_ni/ni_pdfs/NationalReports/germany/transport.pdf [Accessed 25 September 2013].
88 The State of the Biofuels Market
United Nations, 2013b. United Nations Commodity Trade Statistics Database. [Online] Available at: http://comtrade.un.org/ [Accessed 23 October 2013].
UNU-IAS, 2012. Biofuels in Africa: Impacts on Ecosystem Services,Biodiversity and Human Well-being, Yokohama: United Nations University - Institute of Advance Studies .
US Department of Agriculture, 2013. Economics, Statistics and Market Information System. [Online] Available at: http://usda.mannlib.cornell.edu/MannUsda/homepage.do;jsessionid=0784080F1BAE2B83C8EFA92EBCDE05A1 [Accessed 26 November 2013].
US Department of Energy, 2010. Current State of the U.S. Ethanol Industry, Washington: US Department of Energy.
US Energy Information Administration, 2012. Biofuels Issues and Trends , Washington: US Department of Energy.
US Energy Information Administration, 2013a. International Energy Outlook 2013, Washington: US Department of Energy.
US Energy Information Administration, 2013b. Monthly Energy Review - September 2013, Washington: US Department of Energy.
US Energy Information Administration, 2013c. Monthly Biodiesel Production Report, Washington: US Department of Energy.
US Energy Information Administration, 2013d. U.S. Fuel Ethanol Plant Production Capacity. [Online] Available at: http://www.eia.gov/petroleum/ethanolcapacity/index.cfm [Accessed 8 October 2013].
US Energy Information Administration, 2013e. Independent Statisitcs & Analysis. [Online] Available at: http://www.eia.gov/petroleum/data.cfm [Accessed 12 October 2013].
US International Trade Commission, 2013. USITC Interactive Tariff and trade DataWeb database. [Online] Available at: http://dataweb.usitc.gov/ [Accessed 27 November 2013].
van Eijck, J., Smeets, E. & Faaij, A., 2012. Jatropha: a promissing crop for Africa's biofuel production?. In: R. Janssen & D. Rutz, eds. Bioenergy for Sustainable Development in Africa. London: Springer, pp. 27-40.
WABB, 2013. Project Waste-to-Biogas in Bolivia (WABB). [Online] Available at: http://www.kth.se/en/itm/inst/energiteknik/forskning/ecs/projects/biogas-bolivia/waste-to-biogas-in-bolivia-1.287063 [Accessed 13 November 2013].
Wahab, A. G. & Rittgers, C., 2013. Malaysia Biofuel Annual 2013, Kuala Lumpur: USDA Foreign Agricultural Service.
Watson, H. K., 2011. Potential to expand sustainable bioenergy from sugarcane in southern Africa. Energy Policy, 39(10), p. 5746 5750.
Westberg, C. J. & Johnson, F. X., 2013. The path not yet taken: Bilateral agreements to promote sustainable biofuels under the EU Renewable Energy Directive, Stockholm: Stockholm Environment Institute.
World Bank, 2013. Energy use (kg of oil equivalent per capita). [Online] Available at: http://data.worldbank.org/indicator/EG.USE.PCAP.KG.OE
World Trade Organization, 2001. Doha Mandate. Doha: WTO. Zhang, Z., Lohr, L., Escalante, C. & Wetzstein, M., 2010. Food versus fuel: What do prices tell us?. Energy
Policy, 38(1), p. 445 451. Zilberman, D. et al., 2013. The impact of Biofuels on Commodity Food Prices: Assessment of Findings. American
Journal of Agricultural Economics, 95(2), pp. 275-281.
Regulatory, Trade and Development Perspectives 89
Notes
1 Our estimative is based on a linear regression with coefficient of determination (R2) of 0.8507 and used
historical data related to CO2 emissions from 1998 to 2010 (International Energy Agency, 2000; 2001; 2002; 2003; 2004b; 2005; 2006;2007; 2008;2009;2010; 2011; 2012b).
2 A tonne-mile is a unit of freight transportation equivalent to a metric ton of freight moved one mile. 3 $ means US dollars (USD). 4 The energy output/input ratio for maize is around 1.3 up to 1.8, as compared to 8.3 for sugarcane. Moreover,
bioethanol plant using sugarcane can be energy self-sufficient, export surplus electricity to the grid, and generate commercial by-products.
5 Dried distillers grains is a mix of unfermented grain residues, typically malted barley with supplementary grains such as corn, sorghum, rye or wheat, that have an almost indefinite shelf life and can be shipped to any market.
6 Soybean-based biodiesel does not comply with the iodine value prescribed by the EU standard. The iodine value functions as a measure for oxidation stability. Palm oil-based biodiesel reportedly does not provide enough winter stability in northern Europe.
7 Undenatured bioethanol presents strength greater than 80 percent alcohol per volume. 8 Assuming that bioethanol provides 72 percent of the energy of gasoline. 9 One South African Rand equals to $0.10 in October 2013. 10 These corporations are usually international grain traders and/or large agricultural local companies. 11 Guatemala produces about 7 Mt/ha of palm oil while the world average is between 3 and 4 Mt/ha. 12 One Mexican peso equals to $0.08 in October 2013. 13 Thermochemical processes also include gas-to-liquid technologies, also known as syngas or biomass
gasification (Kumar, et al., 2009). 14
ga between production of biofuels and consumption in a
specific area. Under this system, operators register production of biofuels (thus booking this into a central registry), for which they receive a tradable certificate. Operators at the end of the chain need to hand over a certificate for each unit of biofuel they sell. In this system, certificates are traded in the market and there is no physical requirement that any biofuels are used in the demanding region, given they are matched with a certificate proving the same amount of biofuel has been produced
eg and presumably consumed elsewhere.
15 Indirect land use changes produce other significant social and environmental impacts, affecting biodiversity, water quality, food prices and supply, land tenure, worker migration, and community and cultural stability. Indirect land use change is however not limited to biofuels, but happens for any activity that requires land (agriculture or else).
16 The NFIDCs is made up of the following 19 countries: Barbados, BotswanRepublic, Egypt, Honduras, Jamaica, Kenya, Mauritius, Morocco, Pakistan, Peru, Saint Lucia, Senegal, Sri Lanka, Trinidad and Tobago, Tunisia and Venezuela. This list is often grouped with least developed countries (LDCs) during trade negotiations involving food because they share similar food security challenges.
17 A Track and trace mechanism is the rule on genetically modified organisms (GMOs) in the European Union. GMOs are shipped in separate containers from conventional organisms as cross-contamination is undesired.