ADVANCE UNEDITED COPY General Assembly report_Promotion… · United Nations ADVANCE UNEDITED COPY...
24
United Nations ADVANCE UNEDITED COPY A/66/…….. General Assembly Distr.: General 15 August 2011 Original: English Sixty-sixth session Item 20 (j) of the provisional agenda ∗ Promotion of new and renewable sources of energy Report of the Secretary-General Summary A transformation of the global energy system is needed to provide sustainable energy for all, to satisfy rapid growth in energy demand, particularly in developing countries, and to diminish the negative impacts of climate change. New and renewable sources of energy stand at the center of global efforts to induce a paradigm shift towards green economies, poverty eradication and ultimately sustainable development. Record investments are being made by some countries to propel innovation, development and commercialization of renewable energy technologies. Nevertheless, much more cooperation and action is needed to substantially increase the contribution of these technologies to the global energy system. A coordinated global energy strategy needs to be adopted, in conjunction with consistent and stable national policies, to bring down the cost of renewable energy technologies, including off-grid systems, for use by the poorest segments of the population living in rural areas. ∗ A/66/100
-
Upload
truonghanh -
Category
Documents
-
view
222 -
download
0
Transcript of ADVANCE UNEDITED COPY General Assembly report_Promotion… · United Nations ADVANCE UNEDITED COPY...
United Nations ADVANCE UNEDITED COPY A/66/……..
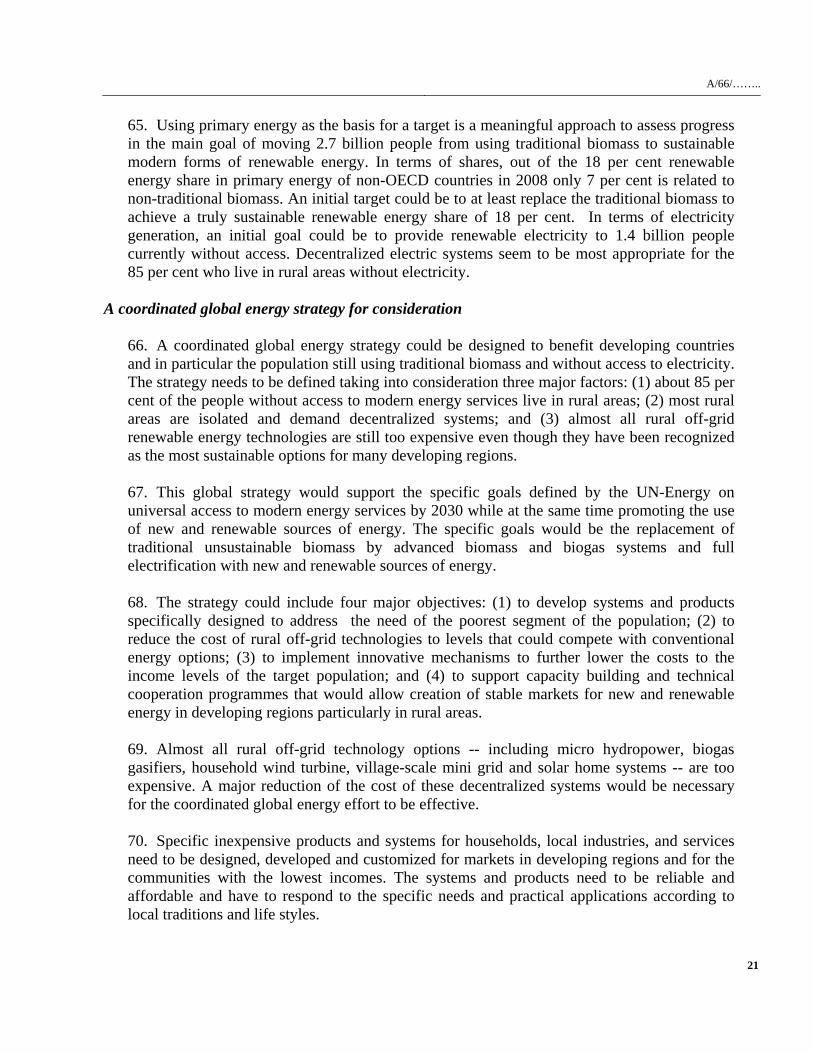
General Assembly Distr.: General 15 August 2011 Original: English
Sixty-sixth session Item 20 (j) of the provisional agenda∗
Promotion of new and renewable sources of energy Report of the Secretary-General Summary A transformation of the global energy system is needed to provide sustainable energy for all, to satisfy rapid growth in energy demand, particularly in developing countries, and to diminish the negative impacts of climate change. New and renewable sources of energy stand at the center of global efforts to induce a paradigm shift towards green economies, poverty eradication and ultimately sustainable development. Record investments are being made by some countries to propel innovation, development and commercialization of renewable energy technologies. Nevertheless, much more cooperation and action is needed to substantially increase the contribution of these technologies to the global energy system. A coordinated global energy strategy needs to be adopted, in conjunction with consistent and stable national policies, to bring down the cost of renewable energy technologies, including off-grid systems, for use by the poorest segments of the population living in rural areas.
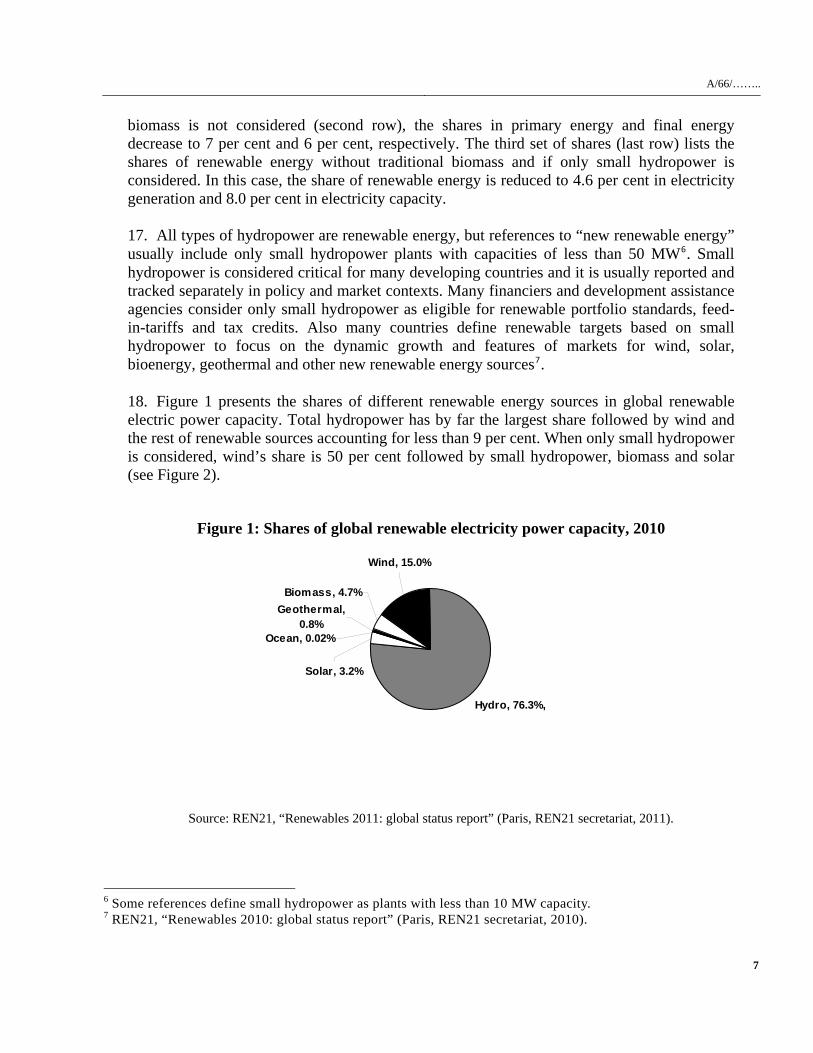
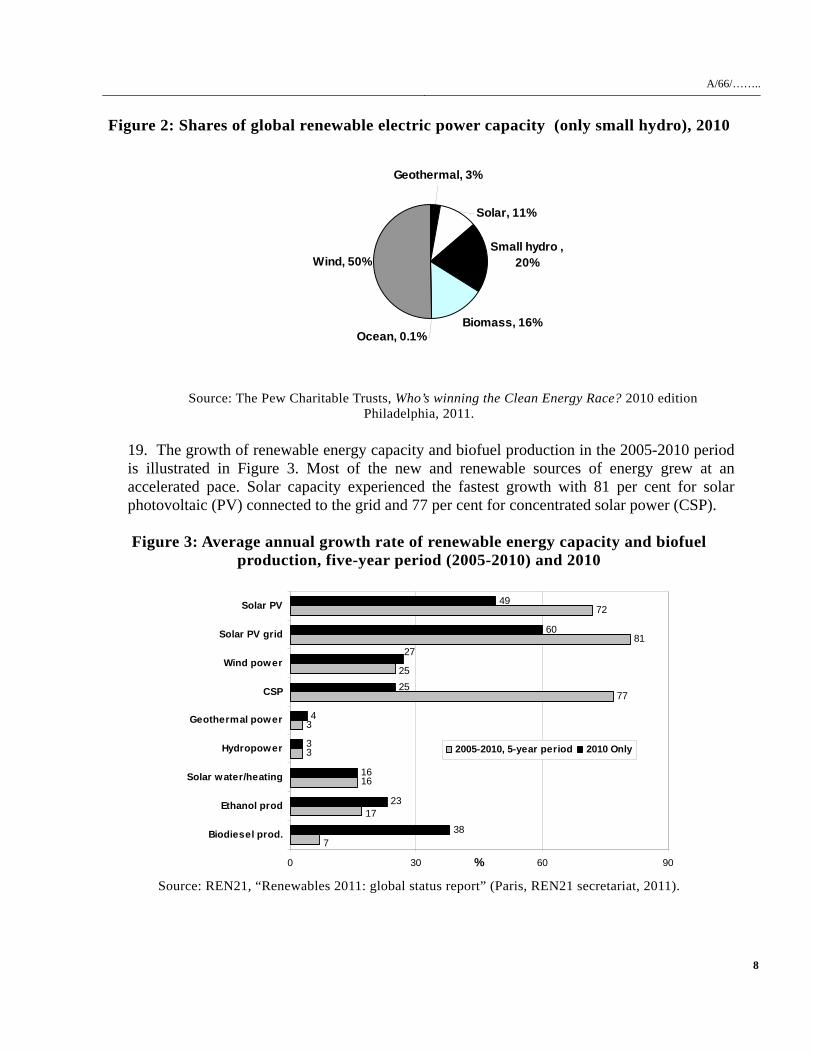
∗ A/66/100
A/66/……..
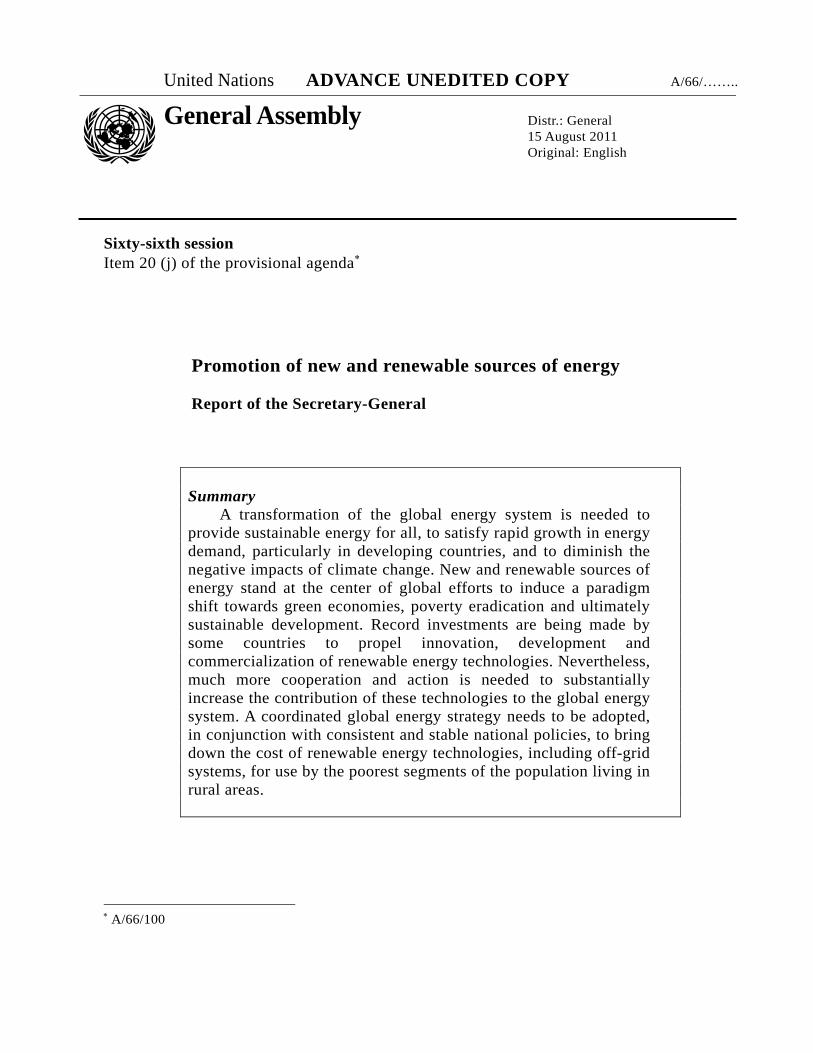
Contents
Paragraphs I. Introduction A. Mandates and Resolutions ……………………………………. 1 - 4 B. Sustainable energy for all …………………………….............. 5 - 10 C. Global energy systems ……………………………………….. 11 - 12 II. Overview of new and renewable sources of energy A. Status ………………..……………………………………….. 13 - 26 B. Prospects…………. ……………………………..................... 27 - 34 III. Promotion of new and renewable energy
A. National efforts ………………………………………………... 35 - 42 B. International institutional arrangements and efforts …………. 43 - 55 C. Options for coordinated global energy strategies …………….. 56 - 75
IV. Conclusions ………………………………………………………. 76 - 87
2
A/66/……..
I. INTRODUCTION
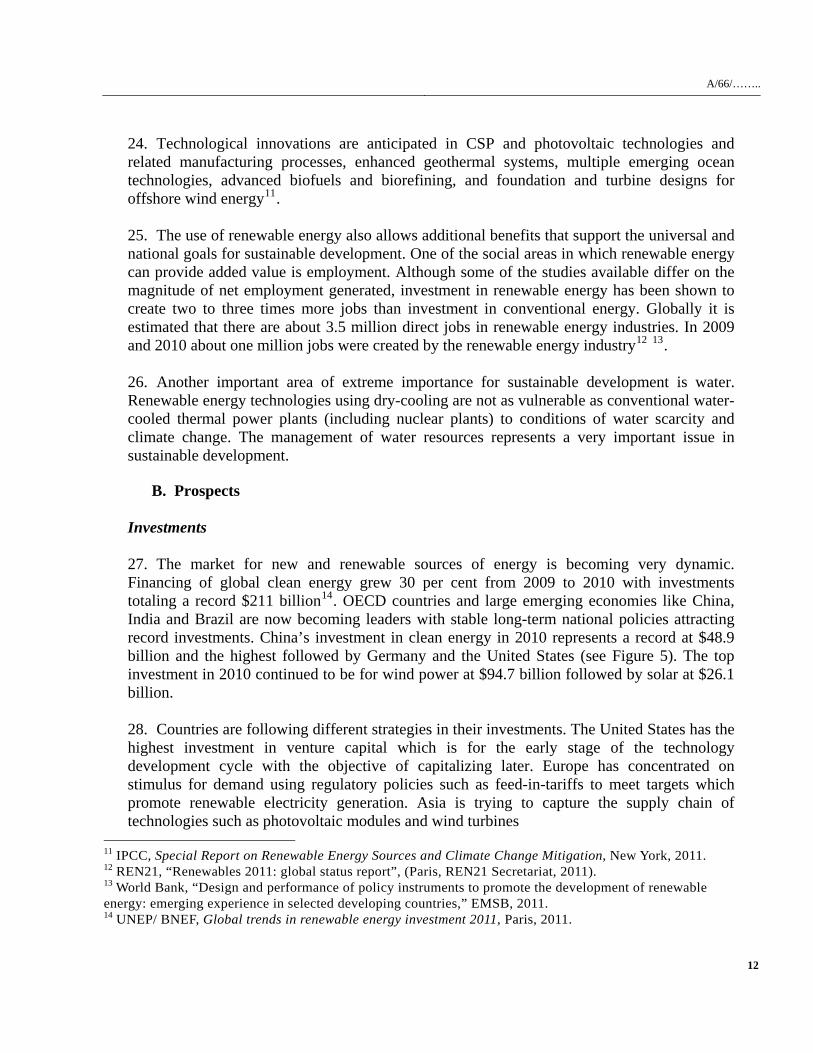
A. Mandates and Resolutions
1. The General Assembly, in its resolution 62/197, reaffirmed the need for putting into action the full Plan of Implementation of the World Summit on Sustainable Development (WSSD)1 as the intergovernmental framework for energy for sustainable development. The Johannesburg Plan of Implementation in Chapter III calls for action at all levels to “with a sense of urgency, substantially increase the global share of renewable energy sources with the objective of increasing its contribution to total energy supply”2. The General Assembly encouraged the United Nations system to continue to raise awareness of the importance of energy for sustainable development and poverty eradication, including the need for the promotion of new and renewable sources of energy and the increased role these sources could play in the global energy supply. 2. In recalling the outcome of the 2005 World Summit resolution 60/1, the General Assembly welcomed initiatives aimed at improving access to reliable, affordable, economically viable, socially acceptable and environmentally sound energy services for sustainable development in order to contribute to the achievement of internationally agreed development goals, including the Millennium Development Goals (resolution 55/2). In addition, it recognized the contribution of new and renewable sources of energy to the reduction of greenhouse gases and in addressing climate change. The General Assembly also called on the international community to support least developed countries, landlocked developing countries and Small Island Developing States (SIDS) in their efforts to develop and utilize energy resources, including new and renewable energy.
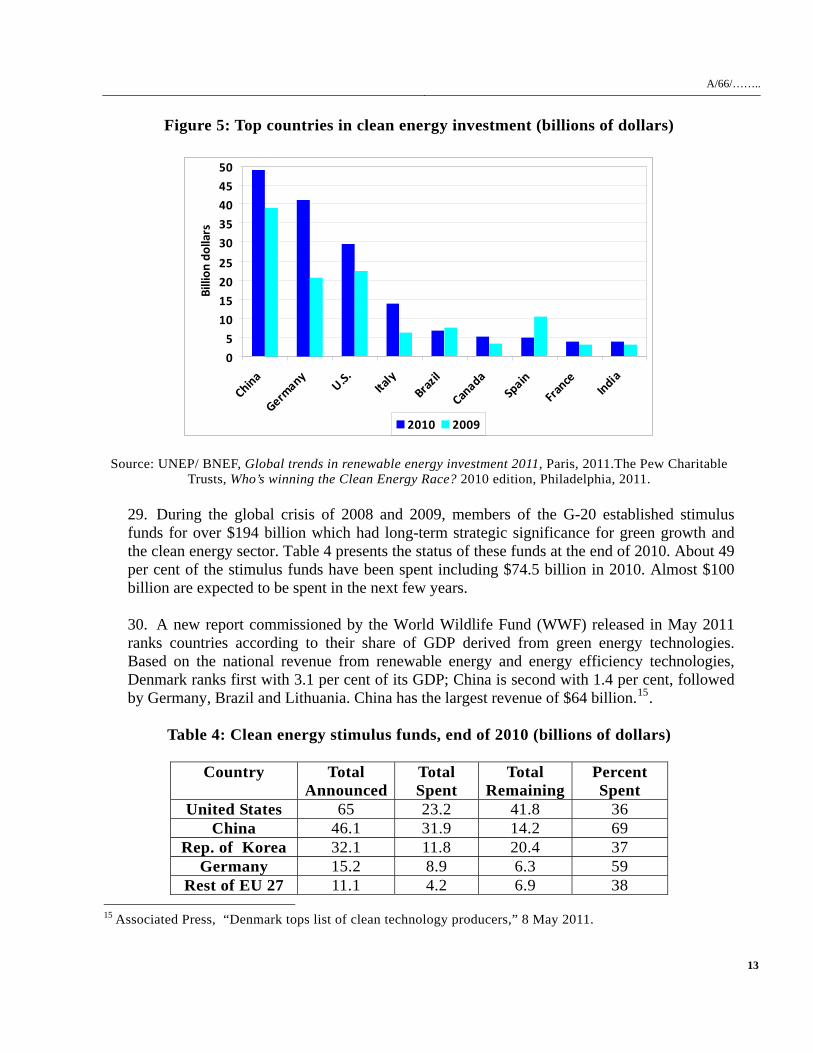
3. The General Assembly, in its resolution 64/206, requested the Secretary-General to submit at its sixty-sixth session a report on the promotion of new and renewable sources of energy. The present report is submitted pursuant to that request. 4. The General Assembly also decided to declare 2012 the “International Year of Sustainable Energy for All” in its resolution 65/15. Initiatives by Member States and international organizations are being undertaken to create at all levels an enabling environment for the promotion of access to energy and energy services and the use of new and renewable energy technologies.
1 Report of the World Summit on Sustainable Development, Johannesburg, South Africa, 26 August-4 September 2002 (United Nations publication, Sales No. E.03.II.A.1 and corrigendum), chap. I, resolution 2, annex. 2 Political Declaration and Plan of Implementation, paragraph 20 (e), United Nations, 2003.
3
A/66/……..
B. Sustainable energy for all 5. The availability of adequate, affordable and reliable energy services is essential for alleviating poverty, improving human welfare, raising living standards and ultimately for achieving sustainable development. As global development challenges continue to be undertaken, it is increasingly recognized that provision of adequate energy services has a multiplier effect on health, education, transport, telecommunications, and water availability and sanitation. Consequently, energy is an important factor for achieving the Millennium Development Goals. 6. Securing “sustainable energy for all” involves the development of systems that support the optimal use of energy resources in an equitable and socially supportive manner while minimizing environmental impacts. Integrated national and regional infrastructures for energy supply, efficient transmission and distribution systems as well as demand programmes that emphasize energy efficiency are necessary for sustainable energy systems. 7. Universal energy access is essentially related to access to modern energy fuels that can replace traditional biomass consumption for cooking, heating and lighting. It also relates to access to electricity. Traditional biomass is solid biomass used in an unsustainable manner and includes fuelwood, agricultural waste and animal dung. It usually represents the only available or affordable fuel to the poor in many developing regions. Worldwide about 2.7 billion people depend on traditional biomass for cooking of which 83 per cent live in rural areas3. Modern or commercial biomass is produced in a sustainable way and can be used for electricity generation, heat production and transportation. 8. The use of solid fuels and the lack of ventilation in households in developing countries are associated with very high levels of pollutants such as particulates, carbon monoxide, and formaldehyde. Women and young children represent the segments of the population with the highest exposure to these pollutants4. Therefore, lack of or insufficient commercial energy use has been found to be correlated with high infant mortality, illiteracy, and with low life expectancy. It is estimated that about 1.45 million premature deaths occur each year from household indoor pollution due to inefficient biomass combustion. This corresponds to more than 4,000 deaths per day. Many of these premature deaths are young children and women. 9. Electricity has many uses and it is irreplaceable for a number of applications. Globally about 1.4 billion people live without electricity of whom 85 per cent live in rural areas. Sub-Saharan Africa has the largest number of people (about 585 million) without electricity. Over 400 million people in India, mostly living in rural areas, also lack access to electricity. Electricity access in rural areas is restricted by the need for capital to extend the national electric grids and by the lack of available and affordable modern fuels that could be used for electricity generation.
3 IEA, World Energy Outlook 2010 (Paris, OECD/IEA, 2010). 4 UNDP/WHO, The energy access situation in developing countries, New York, 2009.
4
A/66/……..
10. World challenges -- including impacts from climate change, limited natural resources, rapid increase in energy demand, and the loss of biodiversity -- demand a greater reliance on new and renewable sources of energy. Accessibility and affordability of renewable energy technologies are key to ensure sustainable energy for all.
C. Global energy systems
11. Global primary energy demand continued to grow in the last several years and amounted to 12,271 million tons of oil equivalent (Mtoe) in 2008. The world still relies largely on oil, coal and gas (see Table 1). In 2008, over 80 per cent of the primary energy consumed was from fossil fuels with oil and coal accounting for about 60 per cent.
Table 1: World primary energy demand by fuel (Mtoe) 1980 1990 2000 2008 Coal 1,792 2,233 2,292 3,315 Oil 3,107 3,222 3,655 4,059 Gas 1,234 1,674 2,085 2,596 Nuclear 186 526 676 712 Hydropower 148 184 225 276 Biomass 749 904 1,031 1,225 Other renewables 12 36 55 89 Total 7,228 8,779 10,019 12,271 Sources: IEA, World Energy Outlook 2009 (Paris, OECD/IEA, 2009); IEA, World Energy Outlook 2010 (Paris, OECD/IEA, 2010).
12. Major increases in world energy demand are expected to continue in the next decades, especially in developing countries. The accelerated demand for energy is resulting from rapid economic growth in emerging economies and projected increases in the world’s population, from 6.7 billion in 2008 to 8.5 billion by 2035. The International Energy Agency (IEA) in its 2010 World Energy Outlook (WEO 2010) projects that global primary energy demand will grow to values ranging between 14,900 Mtoe and 18,000 Mtoe, depending on the scenario being considered. In the New Policies scenario, which takes into account the broad policy commitments and plans that have been announced by many countries around the world, global primary energy demand will grow 36 per cent by 2035 and non-OECD countries will account for 93 per cent of this increase. Fossil fuels maintain their central role in primary energy but their share declines 74 per cent in 2035. China accounts for 35 per cent of the global increase and India for 18 per cent5.
5 IEA, World Energy Outlook 2010 (Paris, OECD/IEA, 2010).
5
A/66/……..
II. OVERVIEW OF NEW AND RENEWABLE SOURCES OF ENERGY A. Status
13. The role of renewable energy in global energy supply continues to increase in some world regions. The trends of the last decade and in particular of the last five years reflect strong growth in all the energy sectors, including power generation, heating and cooling, and transport fuels. Nevertheless, the overall contribution of new and renewable sources of energy to the global energy system still remains very limited. 14. Recent global events, such as the oil spill in the Gulf of Mexico in 2010 and the impact of the natural disasters in the Fukushima nuclear plant in Japan in 2011, highlight the importance of continuing to develop cost-competitive new and renewable sources of energy. In many countries policy makers and the public and private sectors are becoming more supportive of global and national strategies to accelerate the deployment of renewable energy technologies and to expand their corresponding markets. These efforts are key to sustain the transformation of the energy systems and to fuel the green economies of the future. 15. In order to assess the role of renewable energy in the satisfaction of global energy demand, it is necessary to look at its shares in the categories of primary energy, final energy, electricity generation and electric generating capacity. Table 2 lists the shares of global renewable energy in these four energy categories.
Table 2: Shares of renewable energy
In
Primary Energy
In Final Energy
Consumption
In Electricity Generation
In ElectricityCapacity
Total Renewable energy share
13% 16% 19% 27%
Renewable energy share (excluding traditional biomass)
7% 6% 19% 27%
Renewable energy share (excluding traditional biomass and considering only small hydropower (<50 MW)
4.9% 3.0% 4.6% 8.0%
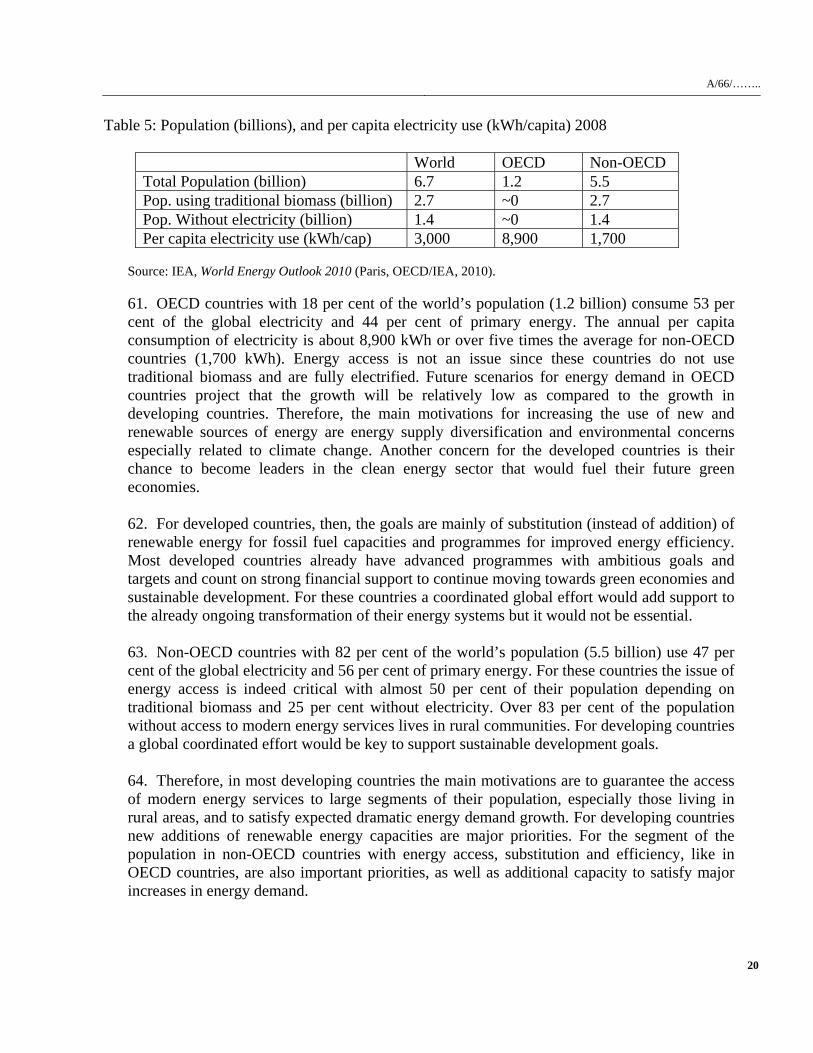
Sources: REN21, “Renewables 2011: global status report” (Paris, REN21 secretariat, 2011); IEA, World Energy Outlook 2010 (Paris, OECD/IEA, 2010). Notes: TPES and FEC for 2009; Electricity generation and capacity for 2010.
16. The table includes three sets of values for these four energy types. The first set (first row) shows the total shares of renewable energy including traditional biomass. If traditional
6
A/66/……..
biomass is not considered (second row), the shares in primary energy and final energy decrease to 7 per cent and 6 per cent, respectively. The third set of shares (last row) lists the shares of renewable energy without traditional biomass and if only small hydropower is considered. In this case, the share of renewable energy is reduced to 4.6 per cent in electricity generation and 8.0 per cent in electricity capacity. 17. All types of hydropower are renewable energy, but references to “new renewable energy” usually include only small hydropower plants with capacities of less than 50 MW6. Small hydropower is considered critical for many developing countries and it is usually reported and tracked separately in policy and market contexts. Many financiers and development assistance agencies consider only small hydropower as eligible for renewable portfolio standards, feed-in-tariffs and tax credits. Also many countries define renewable targets based on small hydropower to focus on the dynamic growth and features of markets for wind, solar, bioenergy, geothermal and other new renewable energy sources7. 18. Figure 1 presents the shares of different renewable energy sources in global renewable electric power capacity. Total hydropower has by far the largest share followed by wind and the rest of renewable sources accounting for less than 9 per cent. When only small hydropower is considered, wind’s share is 50 per cent followed by small hydropower, biomass and solar (see Figure 2).
Figure 1: Shares of global renewable electricity power capacity, 2010
Wind, 15.0%
Geothermal, 0.8%
Solar, 3.2%
Ocean, 0.02%
Biomass, 4.7%
Hydro, 76.3%,
Source: REN21, “Renewables 2011: global status report” (Paris, REN21 secretariat, 2011).
6 Some references define small hydropower as plants with less than 10 MW capacity. 7 REN21, “Renewables 2010: global status report” (Paris, REN21 secretariat, 2010).
7
A/66/……..
Figure 2: Shares of global renewable electric power capacity (only small hydro), 2010
Small hydro , 20%
Biomass, 16%
Wind, 50%
Geothermal, 3%
Solar, 11%
Ocean, 0.1%
Source: The Pew Charitable Trusts, Who’s winning the Clean Energy Race? 2010 edition
Philadelphia, 2011.
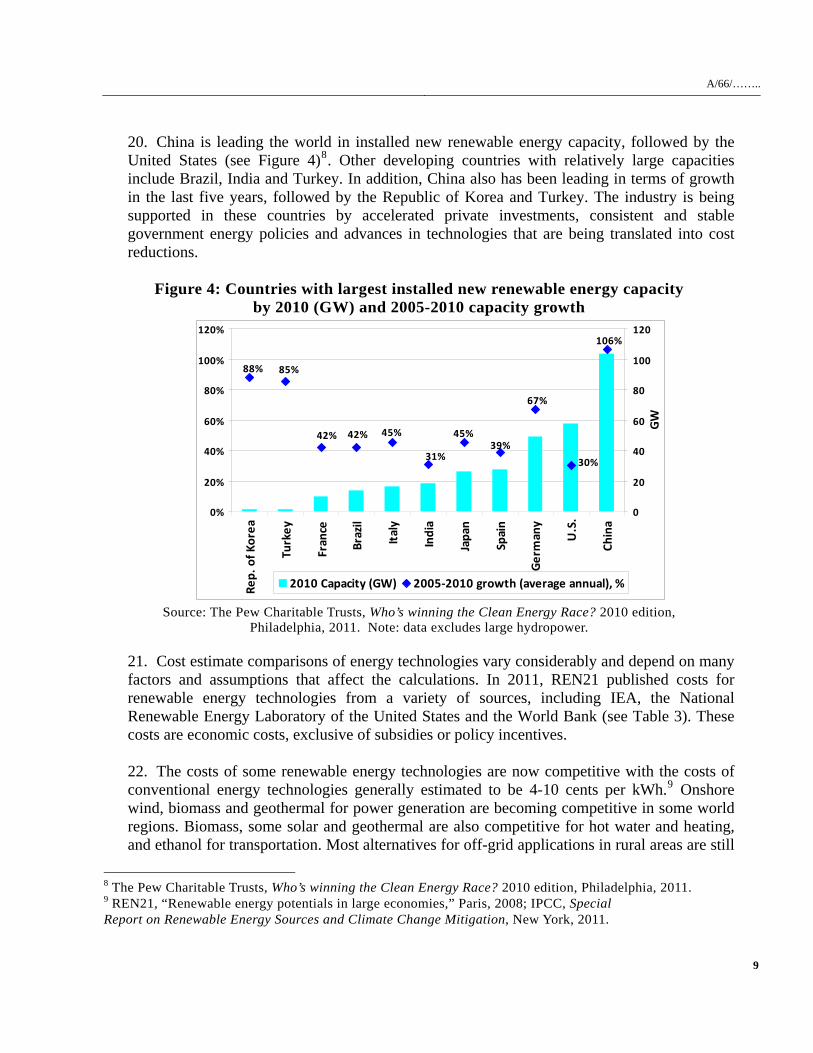
19. The growth of renewable energy capacity and biofuel production in the 2005-2010 period is illustrated in Figure 3. Most of the new and renewable sources of energy grew at an accelerated pace. Solar capacity experienced the fastest growth with 81 per cent for solar photovoltaic (PV) connected to the grid and 77 per cent for concentrated solar power (CSP).
Figure 3: Average annual growth rate of renewable energy capacity and biofuel
production, five-year period (2005-2010) and 2010
16
3
3
77
81
72
38
23
16
3
4
25
60
49
7
17
25
27
0 30 60
Biodiesel prod.
Ethanol prod
Solar water/heating
Hydropower
Geothermal power
CSP
Wind power
Solar PV grid
Solar PV
% 90
2005-2010, 5-year period 2010 Only
Source: REN21, “Renewables 2011: global status report” (Paris, REN21 secretariat, 2011).
8
A/66/……..
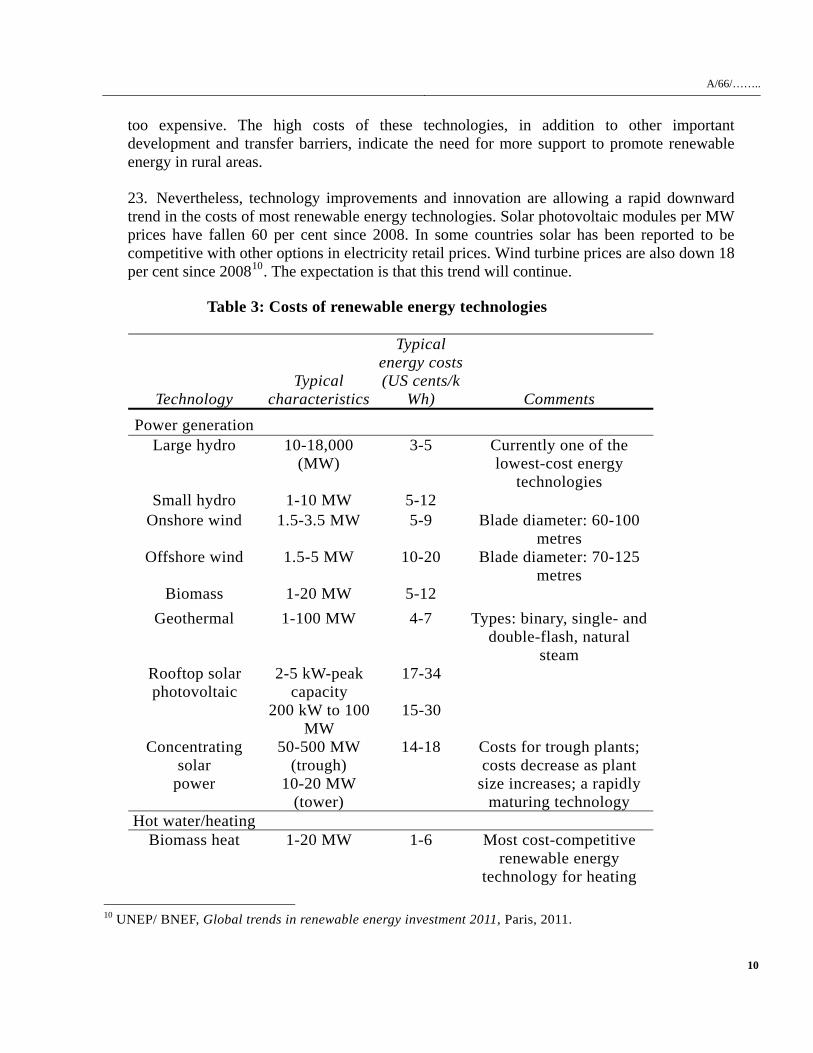
20. China is leading the world in installed new renewable energy capacity, followed by the United States (see Figure 4)8. Other developing countries with relatively large capacities include Brazil, India and Turkey. In addition, China also has been leading in terms of growth in the last five years, followed by the Republic of Korea and Turkey. The industry is being supported in these countries by accelerated private investments, consistent and stable government energy policies and advances in technologies that are being translated into cost reductions.
Figure 4: Countries with largest installed new renewable energy capacity
by 2010 (GW) and 2005-2010 capacity growth
88% 85%
30%
67%
39%31%
45%45%42%42%
106%
0%
20%
40%
60%
80%
100%
120%
Rep. of K
orea
Turkey
France
Brazil
Italy
India
Japan
Spain
Germany
U.S.
China
0
20
40
60
80
100
120
GW
2010 Capacity (GW) 2005‐2010 growth (average annual), %
Source: The Pew Charitable Trusts, Who’s winning the Clean Energy Race? 2010 edition, Philadelphia, 2011. Note: data excludes large hydropower.
21. Cost estimate comparisons of energy technologies vary considerably and depend on many factors and assumptions that affect the calculations. In 2011, REN21 published costs for renewable energy technologies from a variety of sources, including IEA, the National Renewable Energy Laboratory of the United States and the World Bank (see Table 3). These costs are economic costs, exclusive of subsidies or policy incentives. 22. The costs of some renewable energy technologies are now competitive with the costs of conventional energy technologies generally estimated to be 4-10 cents per kWh.9 Onshore wind, biomass and geothermal for power generation are becoming competitive in some world regions. Biomass, some solar and geothermal are also competitive for hot water and heating, and ethanol for transportation. Most alternatives for off-grid applications in rural areas are still
8 The Pew Charitable Trusts, Who’s winning the Clean Energy Race? 2010 edition, Philadelphia, 2011. 9 REN21, “Renewable energy potentials in large economies,” Paris, 2008; IPCC, Special Report on Renewable Energy Sources and Climate Change Mitigation, New York, 2011.
9
A/66/……..
too expensive. The high costs of these technologies, in addition to other important development and transfer barriers, indicate the need for more support to promote renewable energy in rural areas. 23. Nevertheless, technology improvements and innovation are allowing a rapid downward trend in the costs of most renewable energy technologies. Solar photovoltaic modules per MW prices have fallen 60 per cent since 2008. In some countries solar has been reported to be competitive with other options in electricity retail prices. Wind turbine prices are also down 18 per cent since 200810. The expectation is that this trend will continue.
Table 3: Costs of renewable energy technologies
Technology Typical
characteristics
Typical energy costs (US cents/k
Wh) Comments Power generation
Large hydro 10-18,000 (MW)
3-5 Currently one of the lowest-cost energy
technologies Small hydro 1-10 MW 5-12
Onshore wind 1.5-3.5 MW 5-9 Blade diameter: 60-100 metres
Offshore wind 1.5-5 MW 10-20 Blade diameter: 70-125 metres
Biomass 1-20 MW 5-12 Geothermal 1-100 MW 4-7 Types: binary, single- and
double-flash, natural steam
2-5 kW-peak capacity
17-34 Rooftop solar photovoltaic
200 kW to 100 MW
15-30
Concentrating solar
power
50-500 MW (trough)
10-20 MW (tower)
14-18 Costs for trough plants; costs decrease as plant
size increases; a rapidly maturing technology
Hot water/heating Biomass heat 1-20 MW 1-6 Most cost-competitive
renewable energy technology for heating
10 UNEP/ BNEF, Global trends in renewable energy investment 2011, Paris, 2011.
10
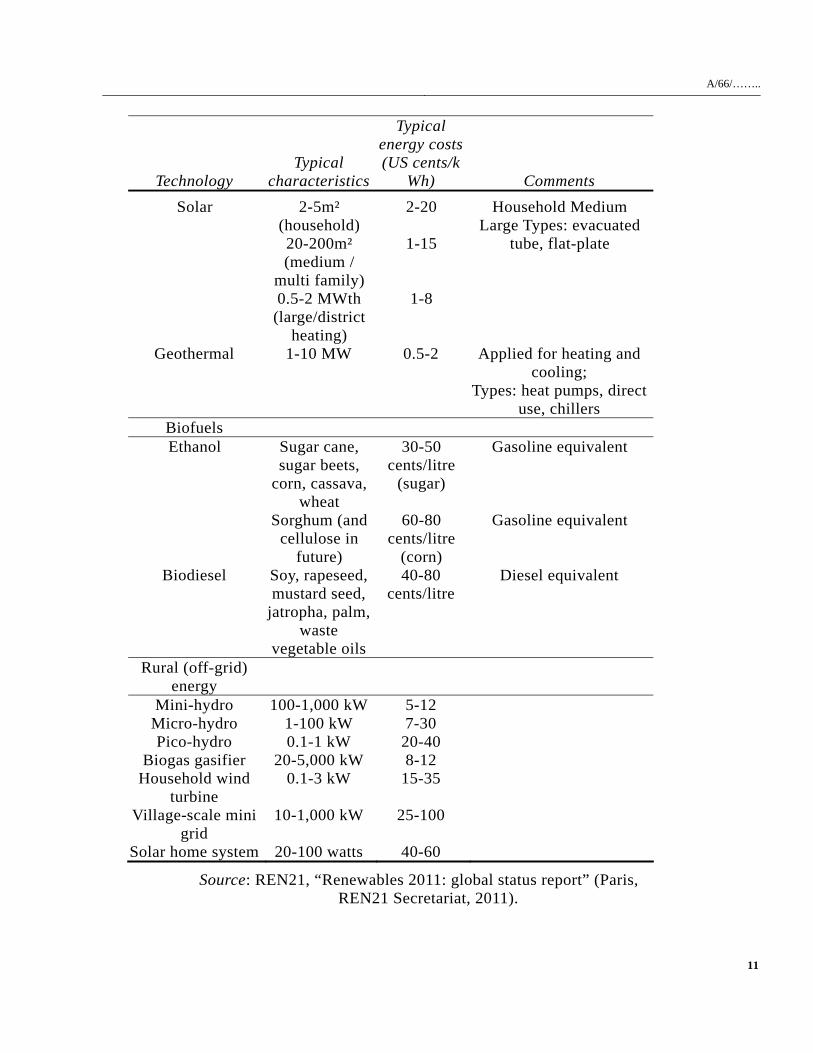
A/66/……..
Technology Typical
characteristics
Typical energy costs (US cents/k
Wh) Comments 2-5m²
(household) 2-20
20-200m² (medium /
multi family)
1-15
Solar
0.5-2 MWth (large/district
heating)
1-8
Household Medium Large Types: evacuated
tube, flat-plate
Geothermal 1-10 MW 0.5-2 Applied for heating and cooling;
Types: heat pumps, direct use, chillers
Biofuels Sugar cane, sugar beets,
corn, cassava, wheat
30-50 cents/litre
(sugar)
Gasoline equivalent Ethanol
Sorghum (and cellulose in
future)
60-80 cents/litre
(corn)
Gasoline equivalent
Biodiesel Soy, rapeseed, mustard seed,
jatropha, palm, waste
vegetable oils
40-80 cents/litre
Diesel equivalent
Rural (off-grid) energy
Mini-hydro 100-1,000 kW 5-12 Micro-hydro 1-100 kW 7-30 Pico-hydro 0.1-1 kW 20-40
Biogas gasifier 20-5,000 kW 8-12 Household wind
turbine 0.1-3 kW 15-35
Village-scale mini grid
10-1,000 kW 25-100
Solar home system 20-100 watts 40-60
Source: REN21, “Renewables 2011: global status report” (Paris, REN21 Secretariat, 2011).
11
A/66/……..
24. Technological innovations are anticipated in CSP and photovoltaic technologies and related manufacturing processes, enhanced geothermal systems, multiple emerging ocean technologies, advanced biofuels and biorefining, and foundation and turbine designs for offshore wind energy11. 25. The use of renewable energy also allows additional benefits that support the universal and national goals for sustainable development. One of the social areas in which renewable energy can provide added value is employment. Although some of the studies available differ on the magnitude of net employment generated, investment in renewable energy has been shown to create two to three times more jobs than investment in conventional energy. Globally it is estimated that there are about 3.5 million direct jobs in renewable energy industries. In 2009 and 2010 about one million jobs were created by the renewable energy industry12 13.
26. Another important area of extreme importance for sustainable development is water. Renewable energy technologies using dry-cooling are not as vulnerable as conventional water-cooled thermal power plants (including nuclear plants) to conditions of water scarcity and climate change. The management of water resources represents a very important issue in sustainable development.
B. Prospects
Investments 27. The market for new and renewable sources of energy is becoming very dynamic. Financing of global clean energy grew 30 per cent from 2009 to 2010 with investments totaling a record $211 billion14. OECD countries and large emerging economies like China, India and Brazil are now becoming leaders with stable long-term national policies attracting record investments. China’s investment in clean energy in 2010 represents a record at $48.9 billion and the highest followed by Germany and the United States (see Figure 5). The top investment in 2010 continued to be for wind power at $94.7 billion followed by solar at $26.1 billion. 28. Countries are following different strategies in their investments. The United States has the highest investment in venture capital which is for the early stage of the technology development cycle with the objective of capitalizing later. Europe has concentrated on stimulus for demand using regulatory policies such as feed-in-tariffs to meet targets which promote renewable electricity generation. Asia is trying to capture the supply chain of technologies such as photovoltaic modules and wind turbines
11 IPCC, Special Report on Renewable Energy Sources and Climate Change Mitigation, New York, 2011. 12 REN21, “Renewables 2011: global status report”, (Paris, REN21 Secretariat, 2011). 13 World Bank, “Design and performance of policy instruments to promote the development of renewable energy: emerging experience in selected developing countries,” EMSB, 2011. 14 UNEP/ BNEF, Global trends in renewable energy investment 2011, Paris, 2011.
12
A/66/……..
Figure 5: Top countries in clean energy investment (billions of dollars)
0
5
10
15
20
25
30
35
40
45
50
China
Germany
U.S.
Italy
Brazil
Canada
Spain
France
India
Billion
dollars
2010 2009
Source: UNEP/ BNEF, Global trends in renewable energy investment 2011, Paris, 2011.The Pew Charitable
Trusts, Who’s winning the Clean Energy Race? 2010 edition, Philadelphia, 2011. 29. During the global crisis of 2008 and 2009, members of the G-20 established stimulus funds for over $194 billion which had long-term strategic significance for green growth and the clean energy sector. Table 4 presents the status of these funds at the end of 2010. About 49 per cent of the stimulus funds have been spent including $74.5 billion in 2010. Almost $100 billion are expected to be spent in the next few years. 30. A new report commissioned by the World Wildlife Fund (WWF) released in May 2011 ranks countries according to their share of GDP derived from green energy technologies. Based on the national revenue from renewable energy and energy efficiency technologies, Denmark ranks first with 3.1 per cent of its GDP; China is second with 1.4 per cent, followed by Germany, Brazil and Lithuania. China has the largest revenue of $64 billion.15.
Table 4: Clean energy stimulus funds, end of 2010 (billions of dollars)
Country Total
AnnouncedTotal Spent
Total Remaining
Percent Spent
United States 65 23.2 41.8 36 China 46.1 31.9 14.2 69
Rep. of Korea 32.1 11.8 20.4 37 Germany 15.2 8.9 6.3 59
Rest of EU 27 11.1 4.2 6.9 38 15 Associated Press, “Denmark tops list of clean technology producers,” 8 May 2011.
13
A/66/……..
Japan 10.4 8.9 1.5 86 Australia 3.7 1.6 2.1 44
United Kingdom
3.4 1.1 2.3 34
Brazil 2.5 0.2 2.3 7 France 2.1 2.1 0 100 Spain 1.7 0.6 1.1 36
Canada 0.8 0.13 .65 17 TOTAL 194.3 94.8 99.5 49
Sources: UNEP/BNEF, Global Trends in Sustainable Energy Investment 2011. The Pew Charitable Trusts,
Who’s winning the Clean Energy Race?, 2010 edition, Philadelphia, 2011. Renewable energy scenarios
31. A variety of long-term energy scenarios have been developed by different institutions that provide projections for renewable energy in primary energy, final energy, electricity generation and electric generating capacity. The estimates vary greatly from shares in primary energy remaining at the same level they are now (around 13 per cent) throughout 2035 to 95 per cent by 2050. 32. The IEA in its WEO 2010 considers three scenarios: (1) Current Policies, (2) New Policies, and (3) 450 part per million (ppm). These scenarios project that, by 2035, renewable shares will range between 15 per cent and 26 per cent for primary energy, 23 per cent and 34 per cent for final energy, 23 per cent and 46 per cent for electricity generation and 31 per cent to 54 per cent for electricity capacity. 33. The IPCC in its 2011 special report on renewable energy indicated that a significant increase in the deployment of renewable energy by 2030, 2050 and beyond is shown in its scenarios. A contribution of the renewable energy share in excess of 17 per cent in primary energy supply by 2030 and more than 27 per cent by 2050 is projected. The scenario with the highest share of renewable energy in total primary energy projects 43 per cent by 2030 and 77 per cent by 2050. The IPCC estimates that global cumulative renewable energy investments will be $1.36 to $5.1 billion up to 2020 and $1.5 to $7.2 billion for the decade 2021 to 203016. 34. A 2011 WWF study concluded that the world can meet its energy demand by 2050 with a 95 per cent share of renewable energy but that, although technically feasible, this would face difficult challenges. The scenario assumes significant improved energy efficiency and expanded electrification as key to achieving this goal17. A 2011 report by Pricewaterhouse Coopers (PwC), Potsdam Institute and IIASA evaluates progress in moving towards 100 per
16 IPCC, Special Report on Renewable Energy Sources and Climate Change Mitigation, New York, 2011. 17 World Wildlife Fund, The energy report: 100 percent renewable energy by 2050, Washington DC, 2011.
14
A/66/……..
cent renewable electricity in Europe and North Africa by 205018. The 2011 IEA Blue High Renewable scenario projects 75 per cent of world electricity generation based on renewable energy.19
III. PROMOTION OF NEW AND RENEWABLE ENERGY
A. National efforts 35. Countries are using different policies for promoting research, development, demonstration, deployment and commercialization of new and renewable sources of energy. Over 115 countries now have some type of policy support to promote renewable energy. Most of these efforts are coordinated only at national levels. One example at the regional level is the European Union which has advanced the goal of 20 per cent renewable energy in final energy use by 2020. 36. Policies promoting renewable energy can be classified into: (1) regulatory policies, (2) fiscal incentives, (3) public finance mechanisms, and (4) climate-led policies. Regulatory policies include feed-in-tariffs, quotas or portfolio standards, priority grid access, building mandates, and biofuel blending requirements. Fiscal incentives refer to tax policies and direct government payments such as rebates and grants. Public finance includes mechanisms such as loans and guarantees. Climate-led efforts include carbon pricing mechanisms, cap and trade, emission targets, and others20. 37. Many countries are using a menu of policy incentives instead of a single policy approach. Policy makers realize that these incentives need to be coherent, stable and designed for the long-term to be able to attract the necessary funds for robust deployment and strong markets that ultimately will reduce the cost of renewable energy. 38. The type of policy incentives varies by country, region and type of renewable source of energy that countries are promoting. Feed-in-tariffs represent one of the most common policies being widely used in many countries, especially to promote renewable electricity generation. 39. Many of these incentive policies are associated with national targets which by 2010 have been announced in almost 100 countries. Targets are being defined in terms of renewable shares in primary energy, final energy, electricity generation and electric capacity. Most targets are defined for shares of electricity generation and typically aim at 10 per cent to 30 per cent of renewable energy in total electricity generation within one or two decades. More specific targets are also being defined in terms of various technologies.
18 PwC, Potsdam Institute and IIASA, Moving towards 100 per cent renewable electricity in Europe and North Africa (London, PwC, 2011). 19 IEA, Climate & electricity annual: data and analysis, Paris, 2011. 20 IPCC, Special Report on Renewable Energy Sources and Climate Change Mitigation, New York, 2011; REN21, “Renewables 2010: global status report”, (Paris, REN21 Secretariat, 2010).
15
A/66/……..
40. A number of countries have been very successful in the promotion of renewable energy through the use of coherent and stable policies. Germany, with a strong policy of feed-in-tariffs supporting investments in wind, solar and biomass, has been able to sustain an accelerated growth in the use of renewable energy. In 2010, there was a sharp increase in deployment of small-scale solar projects to about 9 GW of new solar capacity. 41. China is leading the world in installed new renewable energy capacity with an annual five-year growth rate of 106 per cent. A combination of national clean energy policies, including feed-in-tariffs for wind and subsidies for rooftop and building integrated PV solar, has been very successful. China is also leading in manufacturing producing almost 50 per cent of all wind turbines and solar module shipments. The Republic of Korea shows one of the highest annual five-year growth rates in capacity (88 per cent). Its stimulus package of $32.2 billion is one of the most generous. Renewable energy is promoted by feed-in-tariffs, tax exemptions for dividends and long-term loans for manufacturing facilities. 42. Brazil is using electricity generation subsidies and preferential loans to provide incentives for the use of wind, small hydropower and biomass. Its key renewable energy sectors include ethanol for transport with a production of 36 billion litres annually and biomass electric capacity of about 8 GW. India is using different policy instruments to promote renewable energy including feed-in-tariffs for wind and solar, accelerated depreciation for small hydropower and biomass, and preferential tax rates for other renewable energy projects. Its new renewable power capacity now totals 19 GW based on biomass, small hydropower and solar.
B. International institutional arrangements and efforts
43. Organizations of the United Nations system continue to support the promotion and expansion of new and renewable sources of energy in developing countries. Efforts during 2009 and 2010 have brought attention and awareness in particular to the important issue of universal energy access, energy efficiency and the promotion of new and renewable sources of energy. 44. The United Nations Secretary General’s Advisory Group on Energy and Climate Change (AGECC), created in 2009, called on the United Nations system and its Member States to support the goals of ensuring universal access to modern energy services and reducing energy intensity by 40 per cent by 203021. 45. UN-Energy, the inter-agency mechanism of the United Nations system, continues to promote system-wide collaboration in the area of energy with a coherent and consistent approach. It is playing a pivotal role in promoting action and awareness of the importance of energy for sustainable development and is following up the work initiated by the AGECC.
21 UN, AGECC, Energy for a Sustainable Future, New York, April 2010.
16
A/66/……..
UN-Energy has been instrumental in defining three major goals to induce sustainable energy for all. The goals, defined to be achieved by 2030, include: universal access to modern energy services, a 40 per cent reduction in overall global energy intensity and an increase in the share of renewable energy in primary energy to 30 per cent. UN-Energy is also promoting relevant activities supporting the General Assembly’s resolution that declared 2012 as the “International Year of Sustainable Energy for All.” 46. The United Nations Conference on Sustainable Development (UNCSD) or Rio+20 scheduled to take place in June 2012 will provide an opportunity to assess progress in the development and utilization of new and renewable sources of energy. The UNCSD has two major themes: the green economy in the context of sustainable development and poverty eradication, and the institutional framework for sustainable development. The role that renewable energy technologies will play in sustainable development and poverty eradication as well as the major challenges and barriers still faced by many developing countries in the effective adoption of these technologies will be an important part of the debate at UNCSD. Furthermore, UNCSD will represent an opportunity to establish global strategies for: (1) expanding access to clean energy, (2) enhancing energy efficiency, and (3) accelerating worldwide deployment of renewable energy technologies. International finance institutions 47. International financial institutions continue to play an important role in mobilizing resources for the promotion of new and renewable energy. The World Bank Group provided loans for the energy sector totaling $13 billion during 2010. Lending for low-carbon energy projects and programmes reached a record of over $5.5 billion. Since 2003, the World Bank Group has invested about $17 billion in low-carbon projects, of which $14.2 billion have been in renewable energy and energy efficiency. Excluding large hydropower, new renewable energy investment contributed $4.9 billion. 48. In 2008, the World Bank established the Climate Investment Funds (CIF) which is a collaborative effort among multilateral development banks. As of 2010, contributors have pledged $6.4 billion in new funds. The Clean Technology Fund, which is a component of the CIF, is designed to finance the scaling up of demonstration, deployment and transfer of clean technologies including renewable energy technologies. The first group of projects includes CSP, wind power, bus rapid transit and energy efficiency projects in 13 countries. 49. Regional development banks are also playing a crucial role promoting new and renewable sources of energy. The Inter-American Development Bank is planning to double its lending capacity for clean energy to $3 billion annually by 2012. The African Development Bank has made rural electrification a major priority, along with renewable energy development and multi-national grid interconnections. Clean energy has become one of the highest priorities of the Asian Development Bank with over 25 per cent of the total approved loans supporting projects with clean energy components. The energy policy of the Asian Development Bank has a target of annual lending for energy projects of $2 billion by 2013.
17
A/66/……..
50. Since 1991, the Global Environment Facility (GEF) has provided financing for projects totaling $8.8 billion, with additional $38.7 billion in co-financing. In 2010, the GEF received a record finance boost from 30 donor countries of $4.25 billion for climate change adaptation and mitigation for the next four years. By the end of 2009, GEF had invested $1.1 billion in renewable energy initiatives in almost 100 developing countries and economies in transition with additional $8.3 billion in co-financing. UNFCCC 51. The Parties of the United Nations Framework Convention on Climate Change (UNFCCC), through the Expert Group on Technology Transfer, have been undertaking analysis of the gaps and barriers to finance climate change technologies. A number of mechanisms and initiatives to tackle climate change have emerged that support energy technology cooperation and promote financing for new and renewable energy. 52. The sixteenth session of the Conference of Parties (COP16) in 2010 decided to establish a Technology Mechanism with a Technology Executive Committee and the Climate Technology Centre and Network. This Centre is designed to support the transfer of relevant technologies including renewable energy technologies. 53. Elements in the agreement from COP16 include a total of $30 billion in fast finance from industrialized countries to support climate action in the developing world up to 2012 and the intention to raise $100 billion by 2020. In addition, the decision was made to establish a Green Climate Fund. 54. The Clean Development Mechanism (CDM) under the Kyoto Protocol of the UNFCCC is designed to promote clean energy technology transfer to developing countries. It is expected that in 2012 about 61 per cent of the total number of CDM projects will be for renewable energy projects. During COP16, the Parties decided to strengthen the CDM to drive major investments and technology into environmentally sound and sustainable emission projects in the developing world. Other institutional arrangements 55. An important international institution promoting renewable energy is the International Renewable Energy Agency (IRENA) which was established in 2009. To date 148 states and the European Union signed the Statute of the Agency. Its mandate promotes the widespread and increased adoption and sustainable use of all forms of renewable energy. IRENA will facilitate access to all relevant renewable energy information, including technical, economic and renewable resource potential data. IRENA will share experiences on best practices and lessons learned regarding policy frameworks, capacity-building projects, available finance mechanisms and renewable energy-related energy efficiency measures. Abu Dhabi has been designated as the interim headquarters for IRENA.
18
A/66/……..
C. Options for coordinated global energy strategies 56. Although considerable progress has been made in technology development and transfer, investment and policy implementation, much more is needed to increase the contribution of renewable sources of energy and to secure the continuation of the current positive momentum for a strong deployment. Additional coordinated strategies are necessary at the global level to advance the transformation of the energy system especially in the poorest regions of the world so that the goals of sustainable energy for all, increased energy efficiency and reductions in carbon emissions can be achieved.
Defining strategies and goals
57. There are a number of issues that need to be assessed while defining global energy strategies, goals and targets. To move beyond the international agreed goals on energy, set out in the decisions of the ninth session of the Commission on Sustainable Development (CSD-9) and the WSSD, a focus on specific actions and targets that could effectively help in the formulation of a more comprehensive road map to sustainable energy for all is needed. 58. The first issue is whether goals need to be defined in terms of primary energy, final energy, electricity generation or electric capacity. This is important because the mechanisms for promotion of renewable energy depend on the specific form of energy for which the goals or targets have been selected. The choice of policies will depend on whether the main objective is to promote new and renewable sources of energy at the first step of the energy cycle (primary energy) or at the final step (final energy for the main sectors of the economy, e.g., household, industry, transport). Alternatively, since many countries are interested in renewable technologies for electricity, goals may be defined in terms of electricity generation, which would imply specific incentive policies for generation such as feed-in-tariffs, or in terms of electric capacity which would stress the need for substantial investment for building the infrastructure to ensure the right generation. 59. Another issue is whether goals are based on all renewable energy including traditional biomass. Without the traditional unsustainable biomass, the current renewable share in primary energy is only 7 per cent. Also, if new renewable energy is defined excluding large hydropower, then the shares of global electricity generation of 19 per cent and electric capacity of 27 per cent (see Table 1) drop to only 4.6 per cent and 8 per cent, respectively. The decision would allow establishing the most relevant points of departure in the process towards a particular goal or target. 60. Probably the most important issue is whether goals should be defined separately for developed and developing countries. A close look at these two groups indicates that their circumstances, motivations and objectives are sufficiently different as to justify separate goals. Table 5 summarizes the difference between OECD countries and non-OECD countries in terms of total population, population using traditional biomass, population without electricity, and per capita use of electricity.
19
A/66/……..
Table 5: Population (billions), and per capita electricity use (kWh/capita) 2008
World OECD Non-OECD Total Population (billion) 6.7 1.2 5.5 Pop. using traditional biomass (billion) 2.7 ~0 2.7 Pop. Without electricity (billion) 1.4 ~0 1.4 Per capita electricity use (kWh/cap) 3,000 8,900 1,700
Source: IEA, World Energy Outlook 2010 (Paris, OECD/IEA, 2010).
61. OECD countries with 18 per cent of the world’s population (1.2 billion) consume 53 per cent of the global electricity and 44 per cent of primary energy. The annual per capita consumption of electricity is about 8,900 kWh or over five times the average for non-OECD countries (1,700 kWh). Energy access is not an issue since these countries do not use traditional biomass and are fully electrified. Future scenarios for energy demand in OECD countries project that the growth will be relatively low as compared to the growth in developing countries. Therefore, the main motivations for increasing the use of new and renewable sources of energy are energy supply diversification and environmental concerns especially related to climate change. Another concern for the developed countries is their chance to become leaders in the clean energy sector that would fuel their future green economies. 62. For developed countries, then, the goals are mainly of substitution (instead of addition) of renewable energy for fossil fuel capacities and programmes for improved energy efficiency. Most developed countries already have advanced programmes with ambitious goals and targets and count on strong financial support to continue moving towards green economies and sustainable development. For these countries a coordinated global effort would add support to the already ongoing transformation of their energy systems but it would not be essential. 63. Non-OECD countries with 82 per cent of the world’s population (5.5 billion) use 47 per cent of the global electricity and 56 per cent of primary energy. For these countries the issue of energy access is indeed critical with almost 50 per cent of their population depending on traditional biomass and 25 per cent without electricity. Over 83 per cent of the population without access to modern energy services lives in rural communities. For developing countries a global coordinated effort would be key to support sustainable development goals. 64. Therefore, in most developing countries the main motivations are to guarantee the access of modern energy services to large segments of their population, especially those living in rural areas, and to satisfy expected dramatic energy demand growth. For developing countries new additions of renewable energy capacities are major priorities. For the segment of the population in non-OECD countries with energy access, substitution and efficiency, like in OECD countries, are also important priorities, as well as additional capacity to satisfy major increases in energy demand.
20
A/66/……..
65. Using primary energy as the basis for a target is a meaningful approach to assess progress in the main goal of moving 2.7 billion people from using traditional biomass to sustainable modern forms of renewable energy. In terms of shares, out of the 18 per cent renewable energy share in primary energy of non-OECD countries in 2008 only 7 per cent is related to non-traditional biomass. An initial target could be to at least replace the traditional biomass to achieve a truly sustainable renewable energy share of 18 per cent. In terms of electricity generation, an initial goal could be to provide renewable electricity to 1.4 billion people currently without access. Decentralized electric systems seem to be most appropriate for the 85 per cent who live in rural areas without electricity.
A coordinated global energy strategy for consideration
66. A coordinated global energy strategy could be designed to benefit developing countries and in particular the population still using traditional biomass and without access to electricity. The strategy needs to be defined taking into consideration three major factors: (1) about 85 per cent of the people without access to modern energy services live in rural areas; (2) most rural areas are isolated and demand decentralized systems; and (3) almost all rural off-grid renewable energy technologies are still too expensive even though they have been recognized as the most sustainable options for many developing regions. 67. This global strategy would support the specific goals defined by the UN-Energy on universal access to modern energy services by 2030 while at the same time promoting the use of new and renewable sources of energy. The specific goals would be the replacement of traditional unsustainable biomass by advanced biomass and biogas systems and full electrification with new and renewable sources of energy. 68. The strategy could include four major objectives: (1) to develop systems and products specifically designed to address the need of the poorest segment of the population; (2) to reduce the cost of rural off-grid technologies to levels that could compete with conventional energy options; (3) to implement innovative mechanisms to further lower the costs to the income levels of the target population; and (4) to support capacity building and technical cooperation programmes that would allow creation of stable markets for new and renewable energy in developing regions particularly in rural areas. 69. Almost all rural off-grid technology options -- including micro hydropower, biogas gasifiers, household wind turbine, village-scale mini grid and solar home systems -- are too expensive. A major reduction of the cost of these decentralized systems would be necessary for the coordinated global energy effort to be effective. 70. Specific inexpensive products and systems for households, local industries, and services need to be designed, developed and customized for markets in developing regions and for the communities with the lowest incomes. The systems and products need to be reliable and affordable and have to respond to the specific needs and practical applications according to local traditions and life styles.
21
A/66/……..
71. Cost reductions need to be realized for both the capital cost necessary to acquire and install the systems, and for their corresponding operating and maintenance costs. Three mechanisms are envisioned to support the cost reduction goals: (1) a coordinated effort by international R&D institutions to provide innovations that can make the systems more efficient, practical and cheaper; (2) international and national programmes in the form of technology funds and subsidies to lower the capital cost of the systems ensuring their affordability at the lowest income levels; and (3) policies in the form of regulations, fiscal incentives and public finance mechanisms that will allow affordable operating and maintenance costs. 72. Research and development activities specifically defined to reduce the cost of rural off-grid technologies can be performed in regional or national technology centres that can be established in developing regions. These centres could benefit from local and endogenous knowledge as well as advances in technology innovation directed to increase efficiency and reduce costs and would provide support in all phases of the innovation process from system development to full market deployment. The dedicated centres would serve as regional innovation hubs that would develop renewable energy systems shaped by regional and local needs and rooted in local context. 73. Furthermore financial instruments such as micro-finance initiatives and other innovative mechanisms will be necessary at the national level so that these technologies remain below a threshold and can be afforded by the people with the lowest incomes. These mechanisms supported by an international global strategy will allow the development of stable and coherent markets for the long-run of these technologies. 74. The cost to the consumers of such a global initiative should be based on energy poverty indicators related to the share of income used for fuels and electricity. Although there is no consensus yet in such indicators, a household energy affordability limit of no more than 10 per cent of income could be considered22. Assuming that the populations at the lowest income levels have an average income of no more than $2 per day, this corresponds to 20 cents per day. Further assuming that a person needs at least about 3 to 4 kWh a day23, the highest cost of the overall energy systems that can be afforded by the target population would be about five to six cents per kWh of energy equivalent. A coordinated global initiative would need to be designed to cover the cost above such maximum affordable threshold. 75. The global coordinated effort would also need to address the fundamental requirements for statistical data and indicators still unavailable in many developing countries. Substantial financial resources, capacity building and institutional changes are necessary to build
22 See for example: Jill Insley, “Fuel poverty figures are understated, says consumer body,” Guardian, London, 14 July 2011; Department of Energy and Climate Change, Full Poverty Methodology Handbook, London, October 2010. 23 UN, AGECC, Energy for a Sustainable Future, April 2010.
22
A/66/……..
statistical programmes that would allow the monitoring of progress and the development of integrated energy planning strategies for the long-run.
IV. CONCLUSIONS 76. The accelerated deployment of renewable technologies over the last five years indicates the potential for a significant role in the future. Record investments are being made by countries to propel innovation, development, and commercialization of these technologies. Furthermore, some countries are competing for leadership positions in markets for the technologies perceived to be the ones that will power the green economies of the future. 77. Nevertheless, the contribution of new and renewable sources of energy to the global energy system is still very limited. Furthermore, for many developing countries the lack of access to modern energy services and low-carbon technologies represents one of the most important factors affecting the achievement of their sustainable development goals. 78. The boom in the growth of the renewable energy industry has not been balanced. Most of the growth is taking place in developed countries and in some developing countries with large emerging economies. Many poor countries, with large rural populations, have only seen relatively low growth in the use and commercialization of these technologies. 79. New renewable sources of energy such as on-shore wind, geothermal, small hydropower and biomass are now becoming competitive in some world regions. Others such as solar photovoltaic and CSP are still too expensive but their costs are dropping rapidly. Unfortunately, the costs of most rural off-grid renewable energy including solar home systems and village-scale mini grids, have remained high. 80. Although the world is facing major financial austerity programmes, the coherent and stable national policies supporting renewable energy should stay in place, expand to other countries, and extend for a considerable number of additional years. Market mechanisms are necessary to ensure: (1) further reduction of the cost of technologies; (2) establishment of secure and stable markets; and (3) progress in the transformation of the global energy system towards low-carbon economies. 81. Main motivations for a strong deployment of new and renewable sources of energy in most developing countries is to guarantee access of modern energy services to everyone and to satisfy expected rapid demand increases. The access is seen as indispensable to accelerate the movement towards green economies within the context of poverty eradication and sustainable development. Cheap and decentralized systems are major incentives for these countries, since their rural populations are the most affected. Other major concerns for both developing and developed countries are diversification of energy supplies and reduction of climate change impacts.
23
24
A/66/……..
82. Challenging but achievable goals and specific but meaningful targets can contribute to the promotion of new and renewable sources of energy. Given the differences in factors affecting the energy systems of developing and developed countries, separate but coordinated energy strategies may be more effective. According to the specific goals, targets may be defined in terms of shares in primary energy, final energy, electricity generation and electricity capacity. Furthermore, how the targets are defined will allow determining the most effective incentive mechanisms for the promotion of new and renewable sources of energy. 83. A coordinated global energy strategy is necessary especially to support developing countries particularly the poorest. The effort should concentrate on solutions for the rural areas that are the most affected by the use of traditional biomass and by the lack of electricity. Support at the international level is necessary to help remove financial, technological, infrastructural and institutional barriers to be able to create enabling environments. 84. Reducing the high cost of decentralized systems for rural applications should be one of the main cores of any major coordinated global energy strategy. Specific targets and programmes are required to enable the right environment to induce sustainable energy for the rural populations of the world. 85. There is a need to establish regional and national technology centres to develop systems and products specifically designed to address local needs at the appropriate levels of income and to benefit from endogenous capacities and local knowledge. The global strategy needs to include a strong component on statistical data and the development of integrated programmes for long-term energy planning. 86. International institutional arrangements including the different organizations of the UN system, international financial institutions and international organizations such as IRENA continue playing an important role in promoting international cooperation through capacity building and technical cooperation. UN-Energy is leading global efforts to create awareness and coordinate activities undertaken by the United Nations to secure sustainable energy for all, to increase the share of renewable energy and to reduce the intensity of energy use. 87. New and renewable sources of energy represent a major priority issue for the United Nations Conference on Sustainable Development (UNCSD) of 2012 or Rio+20. Strengthening the global institutional framework for the promotion of new and renewable sources of energy in line with the two themes of UNCSD is an important objective. UNCSD represents an opportunity to secure renewed international support for the promotion and effective use of new and renewable sources of energy.