
Dr. Sudhi Mary Kurian and Dr. Ashalatha Thampuran
12
Dr. Sudhi Mary Kurian and Dr. Ashalatha Thampuran Institute of Town Planners, India Journal 8 - 2, 74 - 85, April - June 2011 74 Dr. Sudhi Mary Kurian, Faculty, TKM College of Engg., kollam Dr. Ashalatha Thampuran ,Principal,MCET,Trivandrum Abstract The paper gives a brief account of a methodology developed for assessing housing quality requirements of a target population. Peoples’ perceptions on housing quality are examined by conducting questionnaire survey among the target population under study in Kerala. The usability of a house is dependent not only on its size but also on whether it can be organized to suit the way the residents wish to live. Accordingly, a methodology was evolved that can be used to assess the housing quality requirements of a selected group. Based on this methodology, various indicators that contribute to the housing quality requirements of the MIG of Kerala and their relative weightage have been identified. The dependency of factors on various indicators has been explored in this paper. This methodology can be applied to identify indicators to assess housing quality requirements of any homogeneous population. Assessment of Housing Quality Dr. Sudhi Mary Kurian and Dr. Ashalatha Thampuran 1. INTRODUCTION A house in a general sense represents the smallest unit from where the town planning scheme emerges. It is the first unit of society and it is the primary unit of human habitation. The need for a house does not confine itself to the availability of a structurally stable unit to stay. Houses must be so located and designed that they afford convenience, amenity, health and social life to community. Housing has potentiality to a great extent in promoting human welfare, social life, economic growth, health of community and various other aspects of human life. Housing is a commodity which is very much heterogeneous in nature. The definition for housing quality varies widely based on peoples’ perspectives. A good habitat requires enough space, separate rooms for different purposes and enough privacy, good climatic conditions such as enough sunlight, free passing of air and availability of water nearby, good drainage and sanitary facilities. This list will extend and vary with respect to demography. Planners and designers definitely need inputs in this area. Effects of globalization and urbanization considerably influence living patterns. This in turn brings about changes in perceptions and preferences. These changes will appear in the housing scenario and it is essential that planners incorporate these changes during initial planning of any housing project. It is a peculiar feature in Kerala that the dwellings of people are not congregated in villages of the type seen elsewhere in India. Majority of people of Kerala live in detached houses surrounded by a fence or compound wall. Other important living habit of Keralite is that of intermingling of the rural and urban characteristics.
Transcript of Dr. Sudhi Mary Kurian and Dr. Ashalatha Thampuran
Dr. Sudhi Mary Kurian and Dr. Ashalatha Thampuran
Institute of Town Planners, India Journal 8 - 2, 74 - 85, April - June 2011
74
Dr. Sudhi Mary Kurian, Faculty, TKM College of Engg., kollamDr. Ashalatha Thampuran ,Principal,MCET,Trivandrum
abstractThe paper gives a brief account of a methodology developed for assessing housing quality requirements of a target population. Peoples’ perceptions on housing quality are examined by conducting questionnaire survey among the target population under study in Kerala. The usability of a house is dependent not only on its size but also on whether it can be organized to suit the way the residents wish to live. Accordingly, a methodology was evolved that can be used to assess the housing quality requirements of a selected group. Based on this methodology, various indicators that contribute to the housing quality requirements of the MIG of Kerala and their relative weightage have been identified. The dependency of factors on various indicators has been explored in this paper. This methodology can be applied to identify indicators to assess housing quality requirements of any homogeneous population.
Assessment of Housing Quality
Dr. Sudhi Mary Kurian and Dr. Ashalatha Thampuran
1. IntroduCtIonA house in a general sense represents the smallest unit from where the town planning scheme emerges. It is the first unit of society and it is the primary unit of human habitation. The need for a house does not confine itself to the availability of a structurally stable unit to stay. Houses must be so located and designed that they afford convenience, amenity, health and social life to community. Housing has potentiality to a great extent in promoting human welfare, social life, economic growth, health of community and various other aspects of human life. Housing is a commodity which is very much heterogeneous in nature. The definition for housing quality varies widely based on peoples’ perspectives. A good habitat requires enough space, separate rooms for different purposes and enough privacy, good climatic conditions such as enough sunlight, free passing of air and availability of water nearby, good drainage and sanitary facilities. This list will extend and vary with respect to demography. Planners and designers definitely need inputs in this area. Effects of globalization and urbanization considerably influence living patterns. This in turn brings about changes in perceptions and preferences. These changes will appear in the housing scenario and it is essential that planners incorporate these changes during initial planning of any housing project.
It is a peculiar feature in Kerala that the dwellings of people are not congregated in villages of the type seen elsewhere in India. Majority of people of Kerala live in detached houses surrounded by a fence or compound wall. Other important living habit of Keralite is that of intermingling of the rural and urban characteristics.
Dr. Sudhi Mary Kurian and Dr. Ashalatha Thampuran
Institute of Town Planners, India Journal 8 - 2, 74 - 85, April - June 2011
75
Exhaustive survey of literature provided data on various factors that contribute to housing quality. An questionnaire was then developed through a pilot survey done among the designers/builders, academicians and practitioners in the housing industry in the state of Kerala, India. The two aspects of validity namely content validity, and face validity of the instrument were assured in the initial stages of questionnaire development.
For content validity, the questionnaire was developed on the basis of a detailed review and analysis of the prescriptive, conceptual, practitioner and empirical literature, so as to ensure the content validity. For face validity, the questionnaire was supplied to three groups of experts covering different areas namely, academicians (three), designers/builders (six) and practitioners in the housing field (three). Each of them was briefed about the purpose of the study and its scope. These experts then scrutinized the questionnaire and gave their comments regarding the relevance and contents of the questionnaire. They were requested to critically examine the questionnaire, and to give objective feedback and suggestions with regard to comprehensiveness/coverage, redundancy level, consistency and the number of factors. Based on the above, the relevance of each factor in the questionnaire were ranked on a five point scale, viz., (1) Not important (2) Fairly important (3) Important (4) Very important (5) Extremely important. The questionnaire which originally had 55 factors was thus refined and only 47 were retained. These were then grouped under 7 major heads (indicators).
The middle income group was taken as the target population. After detailed discussions with experts in the field, forty seven factors which influenced the quality of housing were identified. These were then grouped under seven major indicators. A questionnaire based on the indicators was prepared and survey was carried out at the Trivandrum, Kollam, Ernakulam, Trichur and Calicut districts of the state of Kerala. The results of this study are discussed in detail in this paper.
A survey research method was used to collect data. The individuals among the target population were identified on a random basis but it has been ensured that they belong to Middle Income Group (MIG - Annual income Rs. 2 lakh to Rs. 3 lakh) from more than 5 districts in the state of Kerala. Moreover, the respondents were selected in such a way that they have constructed a house of their own within the last five years. This is to ensure that they have applied thought on these issues and therefore possibility of a realistic response. Out of the identified 64 respondents, 19 percent did not respond. The main objective in question design was to make the questions clear, concise and unambiguous. Ordinal scale measures were extensively used for eliciting data on respondents’ ratings. The respondents were asked to rate the factors contributing to housing quality subjectively on a five point scale by suitably varying the phrasing of the five scales. Here the respondents were asked to show their rating (degree of

Dr. Sudhi Mary Kurian and Dr. Ashalatha Thampuran
Institute of Town Planners, India Journal 8 - 2, 74 - 85, April - June 2011
76
preference) on a five point scale viz., (1) Not important (2) Fairly important (3) Important (4) Very important (5) Extremely important.
2. HousInG QualItY IndICatorsThe usability of a house is dependent not only on its size but also on whether it can be organized to suit the way the residents wish to live. It is recognized that larger dwellings have implications of cost and land use, and consequently sustainability. Site design characteristics are mostly evaluated when client requirements state the overall objective and these are used in conjunction with a site-specific brief, allowing particular relevant features to be emphasized. The cost of regular maintenance and of making changes to a unit as new living patterns emerge over time is an important part of the quality of the unit.
2.1 location Location has a major impact on occupants and the long term desirability of housing. It is important to be aware from the outset how good it will be for residents, even if a developer or builder may have little influence over it. This indicator in turn gives weightage in terms of the facilities available in the vicinity. Various factors considered under this head are proximity of bus stop, proximity to bank, proximity to hospital, proximity to market place, nearness to place of worship, nearness to post office, nearness to school and nearness to park or playfield.
2.2 InfrastructureThe ever increasing urbanization and migration to the urban centres led to congestion in the residential areas and so the plot sizes have come down drastically. This in turn has resulted in the increased importance accorded to the common facilities and infrastructure. The factors therefore considered are public water supply system, public drainage system, common waste disposal facilities, garbage disposal facility, independent well and neighboring building 5m away.
2.3 designHouses need to be planned according to the needs of occupants and whatever may be the kind of dwelling, there has to be rooms facilitating either one specific activity or overlapping activities along with passage, services and utilities. There should be flexibility in the design. The rooms have to be well ventilated and lighted. Keeping in view the various considerations in designing a house, the factors identified are separate rooms for living and dining, separate study room for children, casual eating place in kitchen, provision to build additional room, garage with lock and key, rooms facing specific direction, two bed rooms in ground floor, and additional car park for guests.
2.4 aesthetics
Utility and beauty must be considered in the design to satisfy the aesthetic aspirations of the occupants. It is to be noted that residential buildings are meant
Dr. Sudhi Mary Kurian and Dr. Ashalatha Thampuran
Institute of Town Planners, India Journal 8 - 2, 74 - 85, April - June 2011
77
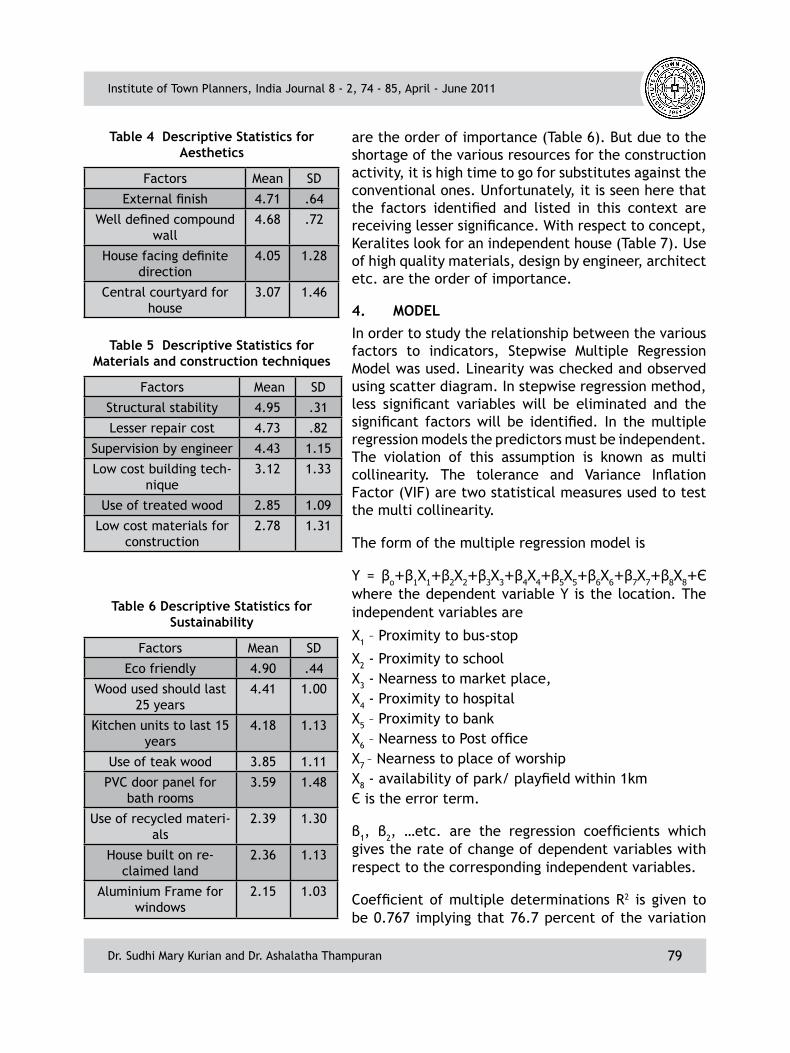
not only to provide enclosed spaces but also to have a good aesthetic appearance that may be obtained by the provision of a variety of designs and novel ideas. Architectural expression is the outward manifestation of the function of the building. Factors identified are good external finish, house facing a definite direction, well defined compound wall, and central courtyard for the house.
2.5 Materials and Construction techniques
Due to the ever increasing construction activities going on in the state, conventional building materials like bricks, cement, steel, sand, aggregates, and wood are running short in supply and is generating many environmental impacts. The factors identified are low cost materials for construction, the instruments which originally had 55 factors were thus refined and only 47 were retained, which were then grouped under 7 major heads (indicators). These are low cost building techniques, use of treated wood, structural stability, supervision by an engineer and less repair costs.
2.6 sustainability
It is necessary that the broad environmental concerns of climate change, resource use and impact on wild life are considered and balanced against the need for a high quality, safe and healthy internal environment. The factors identified are house built on reclaimed area, kitchen units to last 15 years, wood used to last 25 years, use of teak wood, PVC door panel for bath rooms, aluminum frames for windows, ecofriendly, and use of recycled material.
2.7 Concept
Every human being is ought to have an idea regarding his or her house. Therefore the dwelling unit will be the outcome of the numerous experiences, culture, heritage, and a desire to live in pleasant, peaceful and healthy surroundings with social, cultural and recreational facilities. The factors considered are traditional styling, design by an architect, design by an engineer, avoiding contractors, independent house, use of high quality materials, and innovative materials for construction.
3. HousInG QualItY In tHe dIstrICts
The data collected was analyzed using SPSS 9.0. Mean scores were used to compare the factors. In order to study the relationship between the various factors to indicators, Stepwise Multiple Regression Model was used. The results are tabulated. Mean scores for each factor is given with respective standard deviations. Since there is no major deviation in the standard deviations, the mean scores can be considered as an important tool to compare the factors.
The first three factors have least standard deviation (Table 1). Thus we can infer that the respondents have a consistent opinion about these factors. Under

Dr. Sudhi Mary Kurian and Dr. Ashalatha Thampuran
Institute of Town Planners, India Journal 8 - 2, 74 - 85, April - June 2011
78
location, bus stop, proximity to school, nearness to market place, proximity to hospital, bank, post office, place of worship, etc. are the order of importance. Due to the changing lifestyle, it is seen that nearness to parks and playgrounds are becoming less significant though people still prefer to live near a school as well as a bus stop.
It is seen that people of Kerala still give weightage for ample water availability (Table 2). The order of importance shows that people still depend to a large extent on the common infrastructure facilities. Due to the smaller plot sizes, garbage, waste disposal and drainage systems are also gaining importance.
Mean scores for each factor are given with respective standard deviations (Table 3). With respect to design it can be seen that two bedrooms built on the ground floor is getting the highest importance. This is the effect of nucleus family setup. Here separate rooms for each activity, garage, provision for extension, etc. are the order of importance. It is seen that less importance is given to accommodate guests as is evident from the last two factors.
Everyone is concentrating on the external finish as is evident from the Table 4. Well defined compound wall, house facing a definite direction, central courtyard, etc. are the order of importance. This shows that the people of Kerala are not particular in following the traditional styling of ‘Vaastu’ as being called in India.
Mean scores and the respective standard deviations show that under materials and construction, structural stability, lesser repairs, supervision by engineer, etc. are the order of importance (Table 5). People are not much interested in low cost building techniques, materials, or treated wood. This is due to the lack of awareness in these techniques or lack of confidence on these techniques.
Under sustainability, comfort, longevity of wood and kitchen units, use of teak wood, etc.
table 1 descriptive statistics for location
Factors Mean SD
Proximity to bus stop 4.41 .95
Proximity to school 4.40 .96
Nearness to market place
4.10 1.00
Proximity to hospital 3.90 1.32
Proximity to bank 3.70 1.30
Nearness to post office 3.63 1.09
Nearness to place of worship
3.46 1.40
Park / play field within 1 km
3.20 1.23
table 2 descriptive statistics for Infrastructure
Factors Mean SD
Public water supply system
4.56 1.05
Independent well 4.46 1.23
Garbage disposal facility 4.45 1.30
Public drainage system 4.44 1.14
Neighboring building 5 meter away
4.18 1.06
Common waste disposal facilities
4.15 1.35
table 3 descriptive statistics for design
Factors Mean SD
Two bed rooms in ground floor 4.29 1.15
Separate study room for children 4.27 1.20
Separate rooms for living and dining
4.13 1.04
Garage with lock and key 3.95 1.48
Provision to build additional room
3.75 1.28
Rooms facing specific directions 3.66 1.28
Casual eating place in kitchen 3.63 1.41
Additional car park for guests 2.83 1.53
Dr. Sudhi Mary Kurian and Dr. Ashalatha Thampuran
Institute of Town Planners, India Journal 8 - 2, 74 - 85, April - June 2011
79
table 4 descriptive statistics for aesthetics
Factors Mean SD
External finish 4.71 .64
Well defined compound wall
4.68 .72
House facing definite direction
4.05 1.28
Central courtyard for house
3.07 1.46
table 5 descriptive statistics for Materials and construction techniques
Factors Mean SD
Structural stability 4.95 .31
Lesser repair cost 4.73 .82
Supervision by engineer 4.43 1.15
Low cost building tech-nique
3.12 1.33
Use of treated wood 2.85 1.09
Low cost materials for construction
2.78 1.31
table 6 descriptive statistics for sustainability
Factors Mean SD
Eco friendly 4.90 .44
Wood used should last 25 years
4.41 1.00
Kitchen units to last 15 years
4.18 1.13
Use of teak wood 3.85 1.11
PVC door panel for bath rooms
3.59 1.48
Use of recycled materi-als
2.39 1.30
House built on re-claimed land
2.36 1.13
Aluminium Frame for windows
2.15 1.03
are the order of importance (Table 6). But due to the shortage of the various resources for the construction activity, it is high time to go for substitutes against the conventional ones. Unfortunately, it is seen here that the factors identified and listed in this context are receiving lesser significance. With respect to concept, Keralites look for an independent house (Table 7). Use of high quality materials, design by engineer, architect etc. are the order of importance.
4. ModelIn order to study the relationship between the various factors to indicators, Stepwise Multiple Regression Model was used. Linearity was checked and observed using scatter diagram. In stepwise regression method, less significant variables will be eliminated and the significant factors will be identified. In the multiple regression models the predictors must be independent. The violation of this assumption is known as multi collinearity. The tolerance and Variance Inflation Factor (VIF) are two statistical measures used to test the multi collinearity.
The form of the multiple regression model is
Y = βo+β1X1+β2X2+β3X3+β4X4+β5X5+β6X6+β7X7+β8X8+Є where the dependent variable Y is the location. The independent variables are
X1 – Proximity to bus-stop
X2 - Proximity to schoolX3 - Nearness to market place,X4 - Proximity to hospitalX5 – Proximity to bankX6 – Nearness to Post officeX7 – Nearness to place of worshipX8 - availability of park/ playfield within 1km Є is the error term.
β1, β2, …etc. are the regression coefficients which gives the rate of change of dependent variables with respect to the corresponding independent variables.
Coefficient of multiple determinations R2 is given to be 0.767 implying that 76.7 percent of the variation
Dr. Sudhi Mary Kurian and Dr. Ashalatha Thampuran
Institute of Town Planners, India Journal 8 - 2, 74 - 85, April - June 2011
80
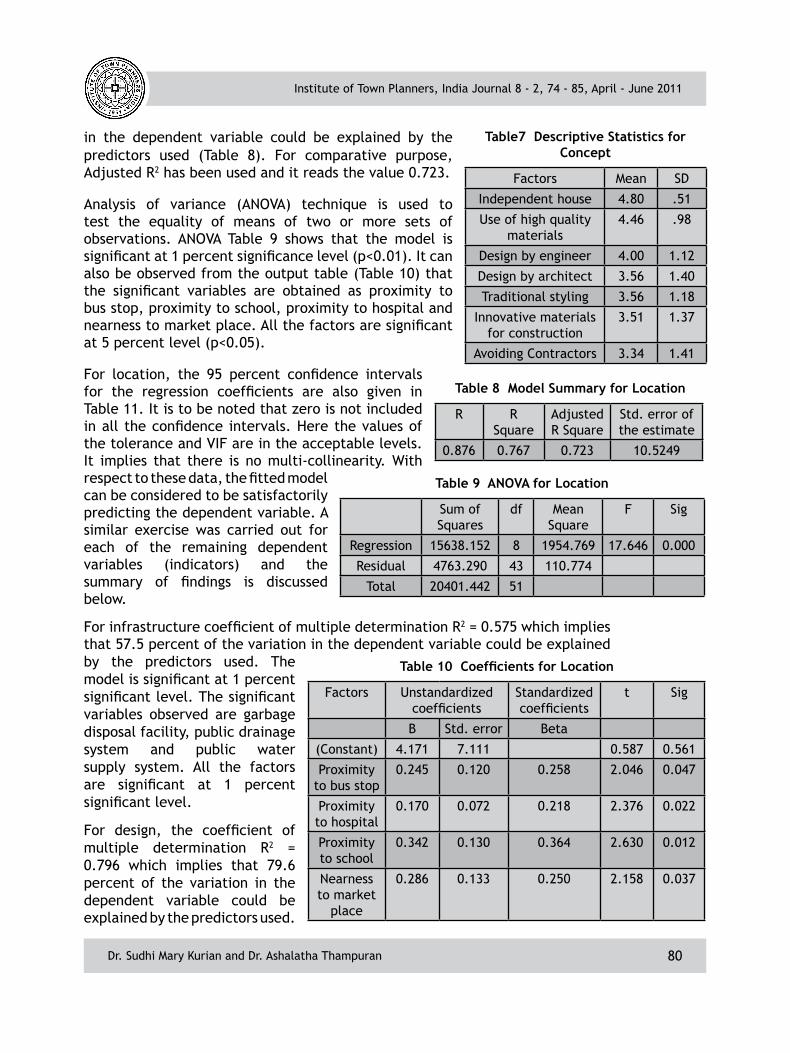
in the dependent variable could be explained by the predictors used (Table 8). For comparative purpose, Adjusted R2 has been used and it reads the value 0.723.
Analysis of variance (ANOVA) technique is used to test the equality of means of two or more sets of observations. ANOVA Table 9 shows that the model is significant at 1 percent significance level (p<0.01). It can also be observed from the output table (Table 10) that the significant variables are obtained as proximity to bus stop, proximity to school, proximity to hospital and nearness to market place. All the factors are significant at 5 percent level (p<0.05).
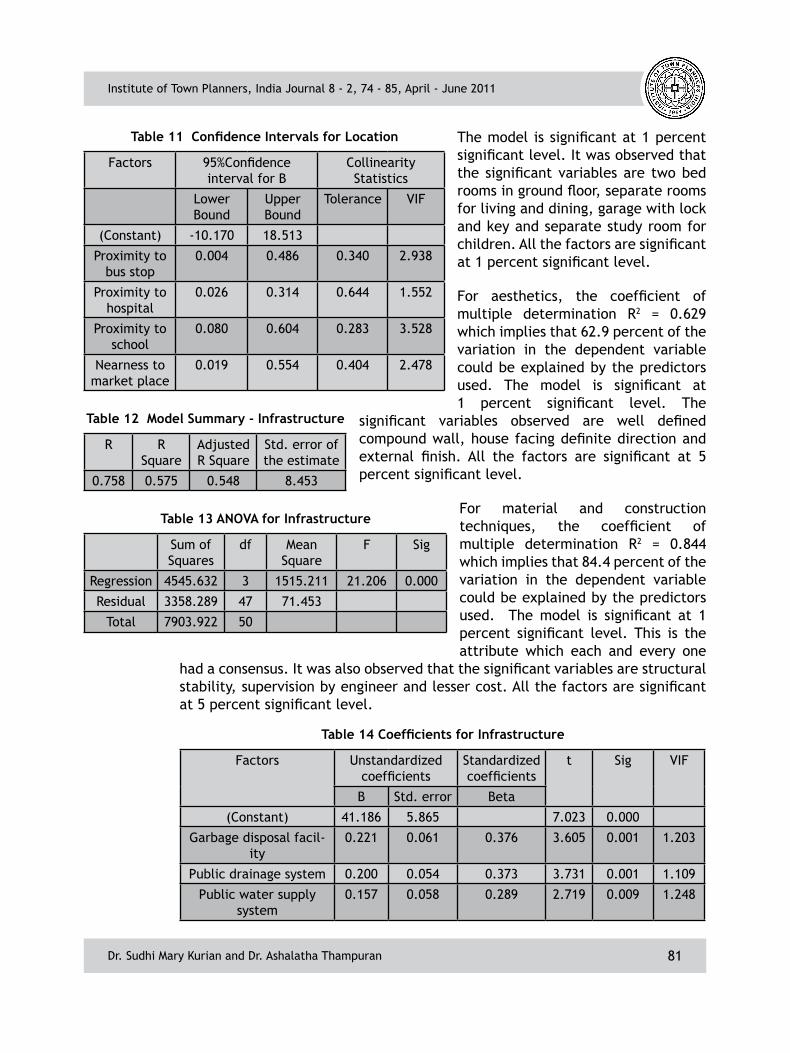
For location, the 95 percent confidence intervals for the regression coefficients are also given in Table 11. It is to be noted that zero is not included in all the confidence intervals. Here the values of the tolerance and VIF are in the acceptable levels. It implies that there is no multi-collinearity. With respect to these data, the fitted model can be considered to be satisfactorily predicting the dependent variable. A similar exercise was carried out for each of the remaining dependent variables (indicators) and the summary of findings is discussed below.
For infrastructure coefficient of multiple determination R2 = 0.575 which implies that 57.5 percent of the variation in the dependent variable could be explained by the predictors used. The model is significant at 1 percent significant level. The significant variables observed are garbage disposal facility, public drainage system and public water supply system. All the factors are significant at 1 percent significant level.
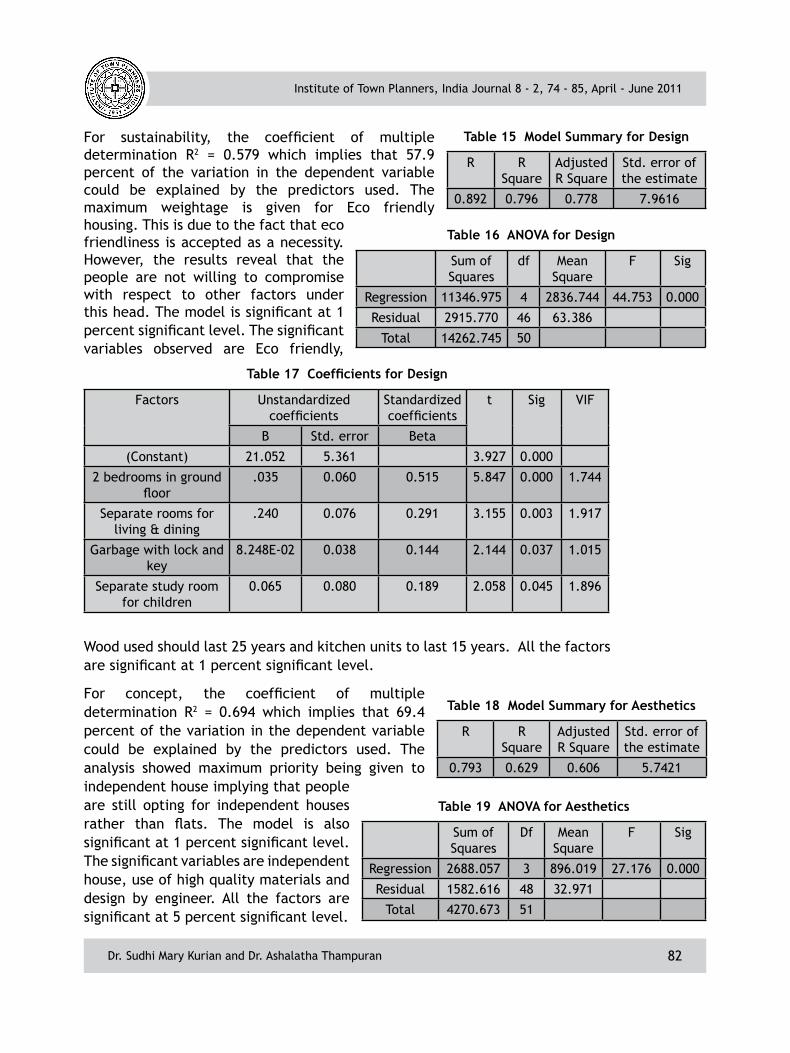
For design, the coefficient of multiple determination R2 = 0.796 which implies that 79.6 percent of the variation in the dependent variable could be explained by the predictors used.
table7 descriptive statistics for Concept
Factors Mean SD
Independent house 4.80 .51
Use of high quality materials
4.46 .98
Design by engineer 4.00 1.12
Design by architect 3.56 1.40
Traditional styling 3.56 1.18
Innovative materials for construction
3.51 1.37
Avoiding Contractors 3.34 1.41
table 8 Model summary for location
R R Square
Adjusted R Square
Std. error of the estimate
0.876 0.767 0.723 10.5249
table 9 anoVa for location
Sum of Squares
df Mean Square
F Sig
Regression 15638.152 8 1954.769 17.646 0.000
Residual 4763.290 43 110.774
Total 20401.442 51
Table 10 Coefficients for Location
Factors Unstandardized coefficients
Standardized coefficients
t Sig
B Std. error Beta
(Constant) 4.171 7.111 0.587 0.561
Proximity to bus stop
0.245 0.120 0.258 2.046 0.047
Proximity to hospital
0.170 0.072 0.218 2.376 0.022
Proximity to school
0.342 0.130 0.364 2.630 0.012
Nearness to market
place
0.286 0.133 0.250 2.158 0.037
Dr. Sudhi Mary Kurian and Dr. Ashalatha Thampuran
Institute of Town Planners, India Journal 8 - 2, 74 - 85, April - June 2011
81
The model is significant at 1 percent significant level. It was observed that the significant variables are two bed rooms in ground floor, separate rooms for living and dining, garage with lock and key and separate study room for children. All the factors are significant at 1 percent significant level.
For aesthetics, the coefficient of multiple determination R2 = 0.629 which implies that 62.9 percent of the variation in the dependent variable could be explained by the predictors used. The model is significant at 1 percent significant level. The
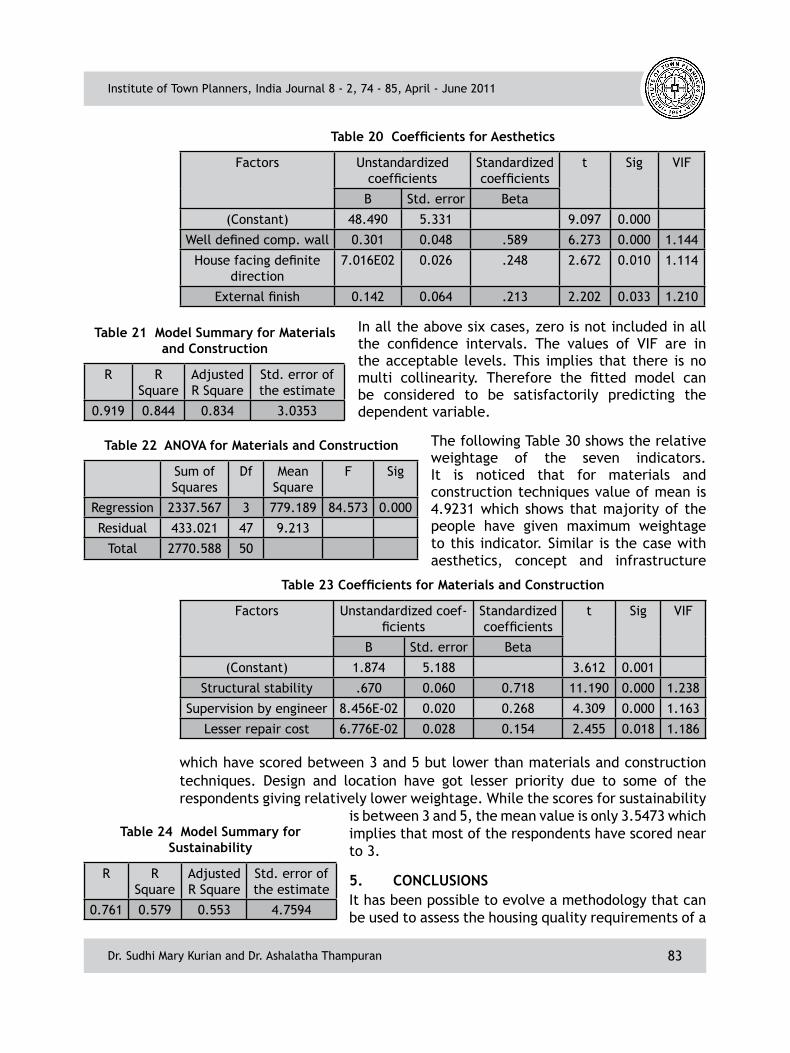
significant variables observed are well defined compound wall, house facing definite direction and external finish. All the factors are significant at 5 percent significant level.
For material and construction techniques, the coefficient of multiple determination R2 = 0.844 which implies that 84.4 percent of the variation in the dependent variable could be explained by the predictors used. The model is significant at 1 percent significant level. This is the attribute which each and every one
had a consensus. It was also observed that the significant variables are structural stability, supervision by engineer and lesser cost. All the factors are significant at 5 percent significant level.
Table 11 Confidence Intervals for Location
Factors 95%Confidence interval for B
Collinearity Statistics
Lower Bound
Upper Bound
Tolerance VIF
(Constant) -10.170 18.513
Proximity to bus stop
0.004 0.486 0.340 2.938
Proximity to hospital
0.026 0.314 0.644 1.552
Proximity to school
0.080 0.604 0.283 3.528
Nearness to market place
0.019 0.554 0.404 2.478
table 12 Model summary - Infrastructure
R R Square
Adjusted R Square
Std. error of the estimate
0.758 0.575 0.548 8.453
table 13 anoVa for Infrastructure
Sum of Squares
df Mean Square
F Sig
Regression 4545.632 3 1515.211 21.206 0.000
Residual 3358.289 47 71.453
Total 7903.922 50
Table 14 Coefficients for Infrastructure
Factors Unstandardized coefficients
Standardized coefficients
t Sig VIF
B Std. error Beta
(Constant) 41.186 5.865 7.023 0.000
Garbage disposal facil-ity
0.221 0.061 0.376 3.605 0.001 1.203
Public drainage system 0.200 0.054 0.373 3.731 0.001 1.109
Public water supply system
0.157 0.058 0.289 2.719 0.009 1.248
Dr. Sudhi Mary Kurian and Dr. Ashalatha Thampuran
Institute of Town Planners, India Journal 8 - 2, 74 - 85, April - June 2011
82
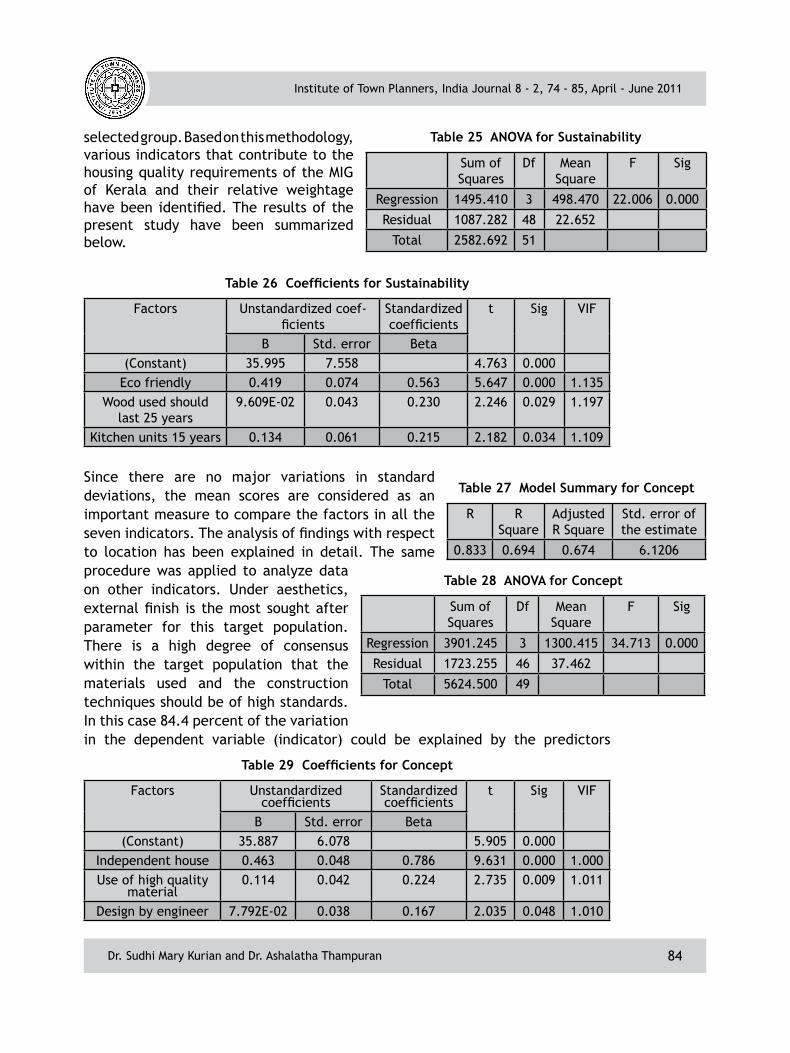
For sustainability, the coefficient of multiple determination R2 = 0.579 which implies that 57.9 percent of the variation in the dependent variable could be explained by the predictors used. The maximum weightage is given for Eco friendly housing. This is due to the fact that eco friendliness is accepted as a necessity. However, the results reveal that the people are not willing to compromise with respect to other factors under this head. The model is significant at 1 percent significant level. The significant variables observed are Eco friendly,
Wood used should last 25 years and kitchen units to last 15 years. All the factors are significant at 1 percent significant level.
For concept, the coefficient of multiple determination R2 = 0.694 which implies that 69.4 percent of the variation in the dependent variable could be explained by the predictors used. The analysis showed maximum priority being given to independent house implying that people are still opting for independent houses rather than flats. The model is also significant at 1 percent significant level. The significant variables are independent house, use of high quality materials and design by engineer. All the factors are significant at 5 percent significant level.
table 15 Model summary for design
R R Square
Adjusted R Square
Std. error of the estimate
0.892 0.796 0.778 7.9616
table 16 anoVa for design
Sum of Squares
df Mean Square
F Sig
Regression 11346.975 4 2836.744 44.753 0.000
Residual 2915.770 46 63.386
Total 14262.745 50
Table 17 Coefficients for Design
Factors Unstandardized coefficients
Standardized coefficients
t Sig VIF
B Std. error Beta
(Constant) 21.052 5.361 3.927 0.000
2 bedrooms in ground floor
.035 0.060 0.515 5.847 0.000 1.744
Separate rooms for living & dining
.240 0.076 0.291 3.155 0.003 1.917
Garbage with lock and key
8.248E-02 0.038 0.144 2.144 0.037 1.015
Separate study room for children
0.065 0.080 0.189 2.058 0.045 1.896
table 18 Model summary for aesthetics
R R Square
Adjusted R Square
Std. error of the estimate
0.793 0.629 0.606 5.7421
table 19 anoVa for aesthetics
Sum of Squares
Df Mean Square
F Sig
Regression 2688.057 3 896.019 27.176 0.000
Residual 1582.616 48 32.971
Total 4270.673 51
Dr. Sudhi Mary Kurian and Dr. Ashalatha Thampuran
Institute of Town Planners, India Journal 8 - 2, 74 - 85, April - June 2011
83
In all the above six cases, zero is not included in all the confidence intervals. The values of VIF are in the acceptable levels. This implies that there is no multi collinearity. Therefore the fitted model can be considered to be satisfactorily predicting the dependent variable.
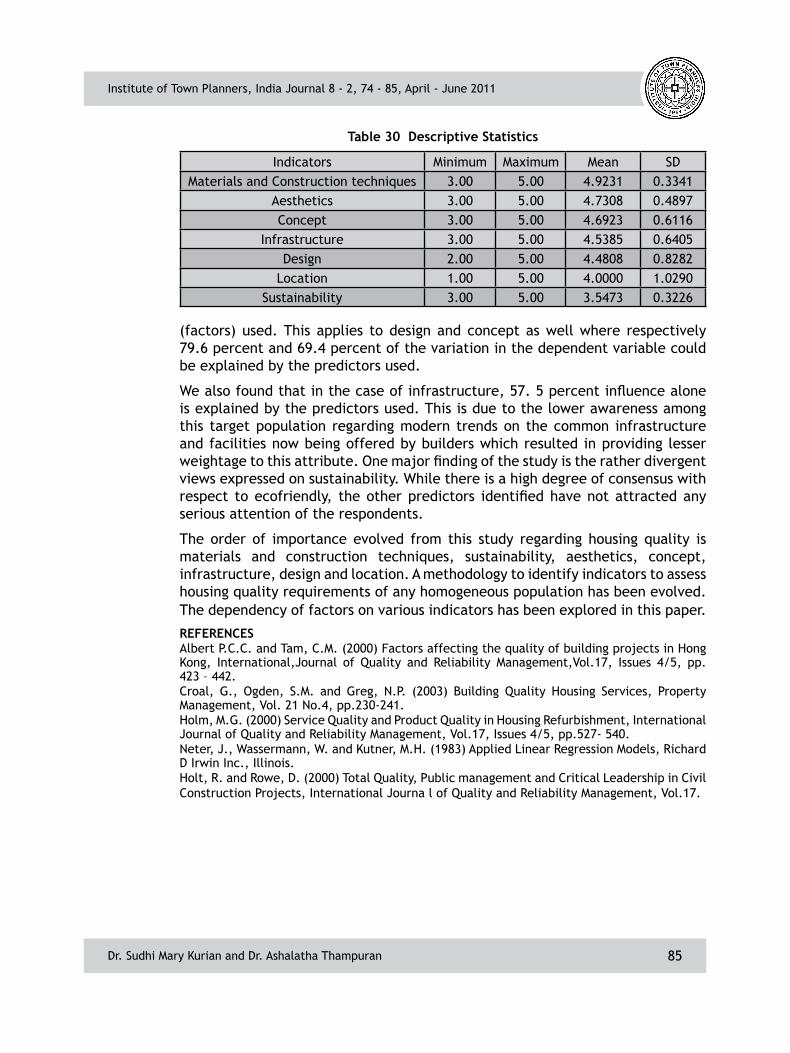
The following Table 30 shows the relative weightage of the seven indicators. It is noticed that for materials and construction techniques value of mean is 4.9231 which shows that majority of the people have given maximum weightage to this indicator. Similar is the case with aesthetics, concept and infrastructure
which have scored between 3 and 5 but lower than materials and construction techniques. Design and location have got lesser priority due to some of the respondents giving relatively lower weightage. While the scores for sustainability
is between 3 and 5, the mean value is only 3.5473 which implies that most of the respondents have scored near to 3.
5. ConClusIonsIt has been possible to evolve a methodology that can be used to assess the housing quality requirements of a
Table 23 Coefficients for Materials and Construction
Factors Unstandardized coef-ficients
Standardized coefficients
t Sig VIF
B Std. error Beta
(Constant) 1.874 5.188 3.612 0.001
Structural stability .670 0.060 0.718 11.190 0.000 1.238
Supervision by engineer 8.456E-02 0.020 0.268 4.309 0.000 1.163
Lesser repair cost 6.776E-02 0.028 0.154 2.455 0.018 1.186
Table 20 Coefficients for Aesthetics
Factors Unstandardized coefficients
Standardized coefficients
t Sig VIF
B Std. error Beta
(Constant) 48.490 5.331 9.097 0.000
Well defined comp. wall 0.301 0.048 .589 6.273 0.000 1.144
House facing definite direction
7.016E02 0.026 .248 2.672 0.010 1.114
External finish 0.142 0.064 .213 2.202 0.033 1.210
table 21 Model summary for Materials and Construction
R R Square
Adjusted R Square
Std. error of the estimate
0.919 0.844 0.834 3.0353
table 22 anoVa for Materials and Construction
Sum of Squares
Df Mean Square
F Sig
Regression 2337.567 3 779.189 84.573 0.000
Residual 433.021 47 9.213
Total 2770.588 50
table 24 Model summary for sustainability
R R Square
Adjusted R Square
Std. error of the estimate
0.761 0.579 0.553 4.7594
Dr. Sudhi Mary Kurian and Dr. Ashalatha Thampuran
Institute of Town Planners, India Journal 8 - 2, 74 - 85, April - June 2011
84
selected group. Based on this methodology, various indicators that contribute to the housing quality requirements of the MIG of Kerala and their relative weightage have been identified. The results of the present study have been summarized below.
Since there are no major variations in standard deviations, the mean scores are considered as an important measure to compare the factors in all the seven indicators. The analysis of findings with respect to location has been explained in detail. The same procedure was applied to analyze data on other indicators. Under aesthetics, external finish is the most sought after parameter for this target population. There is a high degree of consensus within the target population that the materials used and the construction techniques should be of high standards. In this case 84.4 percent of the variation in the dependent variable (indicator) could be explained by the predictors
table 25 anoVa for sustainability
Sum of Squares
Df Mean Square
F Sig
Regression 1495.410 3 498.470 22.006 0.000
Residual 1087.282 48 22.652
Total 2582.692 51
Table 26 Coefficients for Sustainability
Factors Unstandardized coef-ficients
Standardized coefficients
t Sig VIF
B Std. error Beta(Constant) 35.995 7.558 4.763 0.000
Eco friendly 0.419 0.074 0.563 5.647 0.000 1.135Wood used should
last 25 years9.609E-02 0.043 0.230 2.246 0.029 1.197
Kitchen units 15 years 0.134 0.061 0.215 2.182 0.034 1.109
table 27 Model summary for Concept
R R Square
Adjusted R Square
Std. error of the estimate
0.833 0.694 0.674 6.1206
table 28 anoVa for Concept
Sum of Squares
Df Mean Square
F Sig
Regression 3901.245 3 1300.415 34.713 0.000
Residual 1723.255 46 37.462
Total 5624.500 49
Table 29 Coefficients for Concept
Factors Unstandardized coefficients
Standardized coefficients
t Sig VIF
B Std. error Beta(Constant) 35.887 6.078 5.905 0.000
Independent house 0.463 0.048 0.786 9.631 0.000 1.000Use of high quality
material0.114 0.042 0.224 2.735 0.009 1.011
Design by engineer 7.792E-02 0.038 0.167 2.035 0.048 1.010
Dr. Sudhi Mary Kurian and Dr. Ashalatha Thampuran
Institute of Town Planners, India Journal 8 - 2, 74 - 85, April - June 2011
85
(factors) used. This applies to design and concept as well where respectively 79.6 percent and 69.4 percent of the variation in the dependent variable could be explained by the predictors used.
We also found that in the case of infrastructure, 57. 5 percent influence alone is explained by the predictors used. This is due to the lower awareness among this target population regarding modern trends on the common infrastructure and facilities now being offered by builders which resulted in providing lesser weightage to this attribute. One major finding of the study is the rather divergent views expressed on sustainability. While there is a high degree of consensus with respect to ecofriendly, the other predictors identified have not attracted any serious attention of the respondents.
The order of importance evolved from this study regarding housing quality is materials and construction techniques, sustainability, aesthetics, concept, infrastructure, design and location. A methodology to identify indicators to assess housing quality requirements of any homogeneous population has been evolved. The dependency of factors on various indicators has been explored in this paper.
referenCesAlbert P.C.C. and Tam, C.M. (2000) Factors affecting the quality of building projects in Hong Kong, International,Journal of Quality and Reliability Management,Vol.17, Issues 4/5, pp. 423 – 442.Croal, G., Ogden, S.M. and Greg, N.P. (2003) Building Quality Housing Services, Property Management, Vol. 21 No.4, pp.230-241.Holm, M.G. (2000) Service Quality and Product Quality in Housing Refurbishment, International Journal of Quality and Reliability Management, Vol.17, Issues 4/5, pp.527- 540.Neter, J., Wassermann, W. and Kutner, M.H. (1983) Applied Linear Regression Models, Richard D Irwin Inc., Illinois. Holt, R. and Rowe, D. (2000) Total Quality, Public management and Critical Leadership in Civil Construction Projects, International Journa l of Quality and Reliability Management, Vol.17.
table 30 descriptive statistics
Indicators Minimum Maximum Mean SDMaterials and Construction techniques 3.00 5.00 4.9231 0.3341
Aesthetics 3.00 5.00 4.7308 0.4897Concept 3.00 5.00 4.6923 0.6116
Infrastructure 3.00 5.00 4.5385 0.6405Design 2.00 5.00 4.4808 0.8282
Location 1.00 5.00 4.0000 1.0290Sustainability 3.00 5.00 3.5473 0.3226


![[XLS] 2006-2007.xls · Web viewRAJESH SOMABHAI NAYANABEN RAJESHBHAI SHEELA NIRAJ KANUBHAI SONAL MATULYA MANISHA PARIMAL BACHUBHAI GAURANG NARENDRABHAI RAWAL BHADRESH SUDHI MISRA SHAMALDAS](https://static.fdocuments.us/doc/165x107/5acab4627f8b9aa1298dddfe/xls-2006-2007xlsweb-viewrajesh-somabhai-nayanaben-rajeshbhai-sheela-niraj-kanubhai.jpg)


