Dr Simon Denny Adolescent Health Research Group Auckland HPE Symposium December 2011.
46
YOUTH TODAY – WHO ARE WE TEACHING? Dr Simon Denny Adolescent Health Research Group Auckland HPE Symposium December 2011
-
Upload
lynne-dawson -
Category
Documents
-
view
214 -
download
0
Transcript of Dr Simon Denny Adolescent Health Research Group Auckland HPE Symposium December 2011.

YOUTH TODAY – WHO ARE WE
TEACHING?Dr Simon Denny
Adolescent Health Research Group
Auckland HPE Symposium
December 2011
Youth2000: The National Youth Health Surveys New Zealand has a poor record of
adolescent health Monitoring youth health is important to
address and understand youth health issues
Health and education often have common goals and aims

Aims of today
Present findings from the national youth health surveys
Show some recent analyses of truanting behaviours among secondary schools students
What does taking part mean for schools?

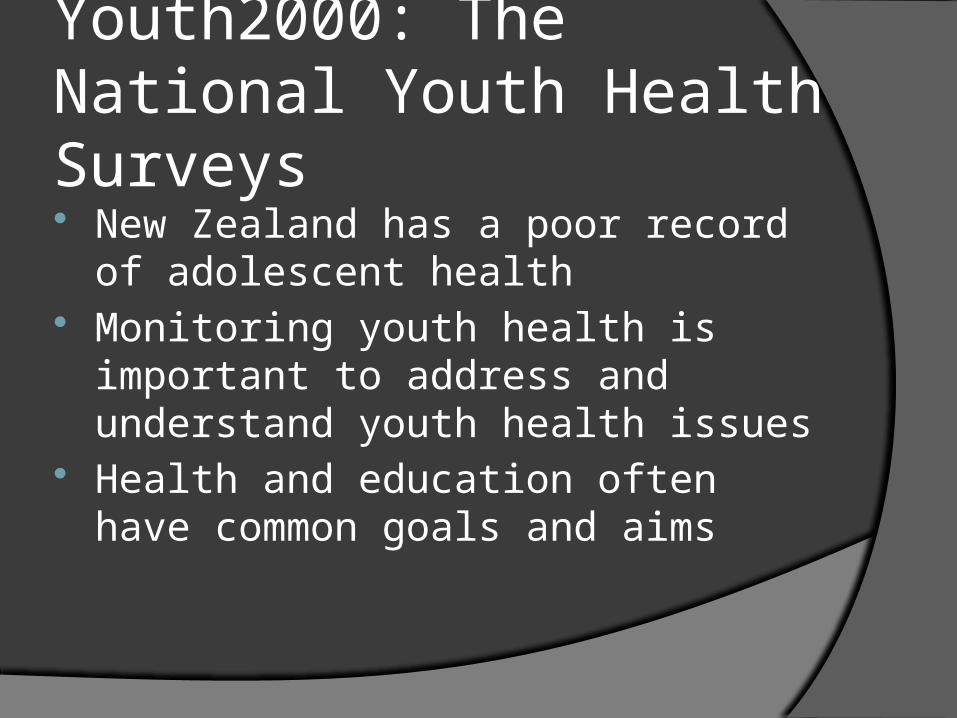
Methodology
Two stage random sample96/115 schools agreed to participate (84%)9,107/12,549 students participated (75%)
Overall response rate 63%
Methodology


What do students enjoy about school?
hanging out with friends
sports doing school work
other arts and/or music
being away from home
some other reason
Kapa-haka or cultural activities
I don't enjoy school
0
20
40
60
80
100
Pe
rce
nt
(%)

Student engagement in school
Feel part of their school
Belong to a sports team
Belongs to school clubs or teams (not
sports teams)
Spend time in activities helping others at school
Students who have been truant from school this
year
0
20
40
60
80
100
Male Female
Pe
rce
nt
(%)
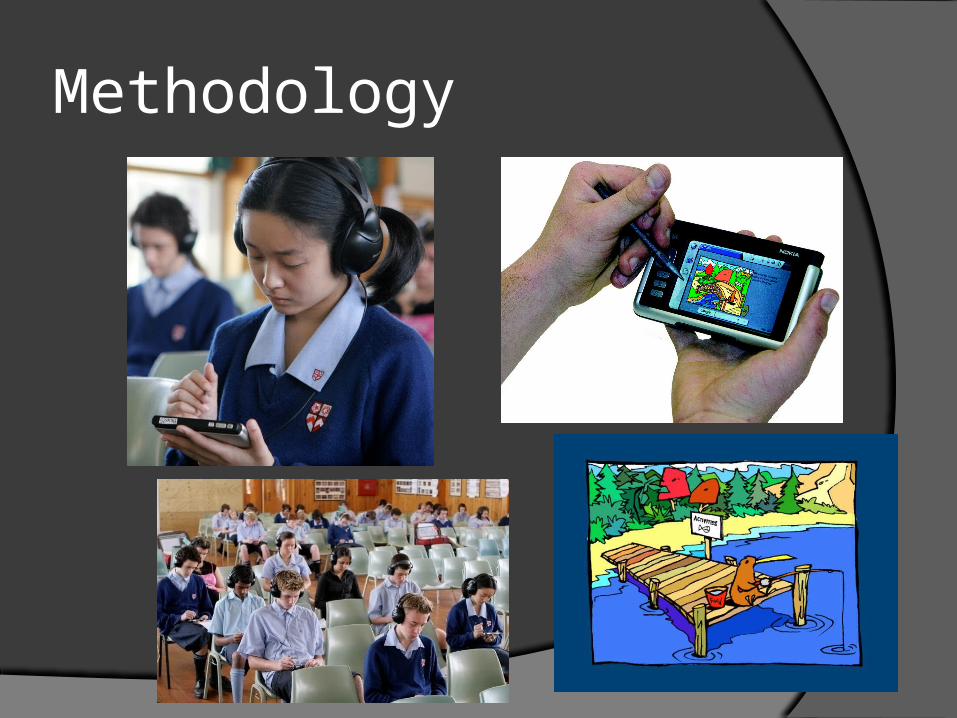
Connectedness at School
13 years or less 14 years 15 years 16 years 17 years or older0
20
40
60
80
100
People at school care some or a lot (like teachers, coaches or other adults)
Usually gets along with teachers
Age
Pe
rce
nt
(%)
Source: 2007 National Youth Survey

Comparison of School Engagement Indicators 2001 to 2007
89%
43%
86%82%
91%
49%
88% 88%
2001 2007

Comparison of School Safety 2001 to 2007
7%
3%
6%
4%
2001 2007

Cyber-bullying
0
2
4
6
8
10
12
14
16
18
20 Letters or notes
Internet
Mobile phone
Pe
rce
nt
(%)
Source: 2007 National Youth Survey

Comparison of Family Relationships 2001 to 2007
Students who feel parents care about them (a lot)
Students who get enough time with their parents (most
of the time)
Students' relationship with family – I’m happy how we
get along
93%
62%59%
90%
57%
71%
2001 2007

Comparison of Activities2001 to 2007
20 minutes or more of vig-orous activity on three or
more occasions in the last week
Watch more than 1 hour of TV a day
Use the internet for more than 1 hour a day
54% 55%
18%
64%
73%
52%
2001 2007

Comparison of Cigarette, Alcohol and Marijuana Use 2001 to 2007
Ever tried ci-garettes
Weekly or more often cigarette use
Episode of binge drinking in last 4
weeks
Ever used marijuana
Weekly or more often marijuana
use
53%
16%
40% 38%
7%
32%
8%
34%
27%
5%
2001 2007

Cigarette, Alcohol and Marijuana Use
Weekly or more often cigarette use
Episode of binge drinking in last 4 weeks
Weekly or more often marijuana use
6%
36%
6%
10%
33%
3%
Male Female

had friends or family tell you to cut down your alcohol drinking
had your performance at school or work affected by your alcohol use
had unsafe sex (no condom) after you had been drinking alcohol
had unwanted sex after you had been drinking alcohol
done things that could have got you into serious trouble (stealing, etc)
been injured after you had been drinking alcohol
been injured and required treatment by a doctor or nurse after drinking alcohol
injured someone else after you had been drinking alcohol
had a car crash after you had been drinking alcohol
16%
10%
13%
7%
24%
20%
4%
10%
3%
16%
9%
16%
7%
15%
23%
3%
6%
2%
FemaleMale
Problems from Alcohol Use

Depression Symptoms, Suicidal thoughts and Suicide attempts 2001 and 2007
12%
24%
8%
11%
14%
5%
2001 2007

Proportion of students who have had sex 2001 and 2007
Male Female
32% 30%
38%35%
2001 2007

Violent behaviours during the last 12 months 2001 and 2007
Hit or physically harmed by another person one or more times in the last 12 months
Been in a serious physical fight one or more times in
the last 12 months
Carried a weapon (e.g. knife) one or more times in
the last 12 months
45%
21%
6%
41%
20%
6%
2001 2007
Source: 2001/ 2007 National Youth Surveys

Violence and harm in the last 12 months
Hit or physically harmed by another person one or more times in the last 12 months
Been in a serious physical fight one or more times in the last 12
months
Carried a weapon (e.g. knife) one or more times in the last 12
months
48%
26%
9%
33%
12%
3%
Male Female

Witnessing violence in students' homes in the last 12 months
Seen adults in your home yelling or swear-
ing at a child (other than yourself)
Seen adults in your home hitting or physic-
ally hurting a child (other than yourself)
Seen adults in your home yelling or swear-
ing at each other
Seen adults in your home hitting or phys-
ically hurting each other
46% 48%
17%10%
25%
32%38%
48%
Percentage witnessing violence once or more often in the last 12 monthsPercentage reporting violence as pretty bad, really bad or terrible
Source: Youth'07 National Youth Survey

Witnessing violence within the home and Sexual abuse 2001 and 2007
Witnessed adults at home hit-ting or physically hurting a child (other than yourself) - once or
more often in the last 12 months
Witnessed adults at home hit-ting or physically hurting each
other - once or more often in the last 12 months
Ever been touched in a sexual way or made to do sexual
things not wanted
16%
6%
18%17%
10%12%
2001 2007
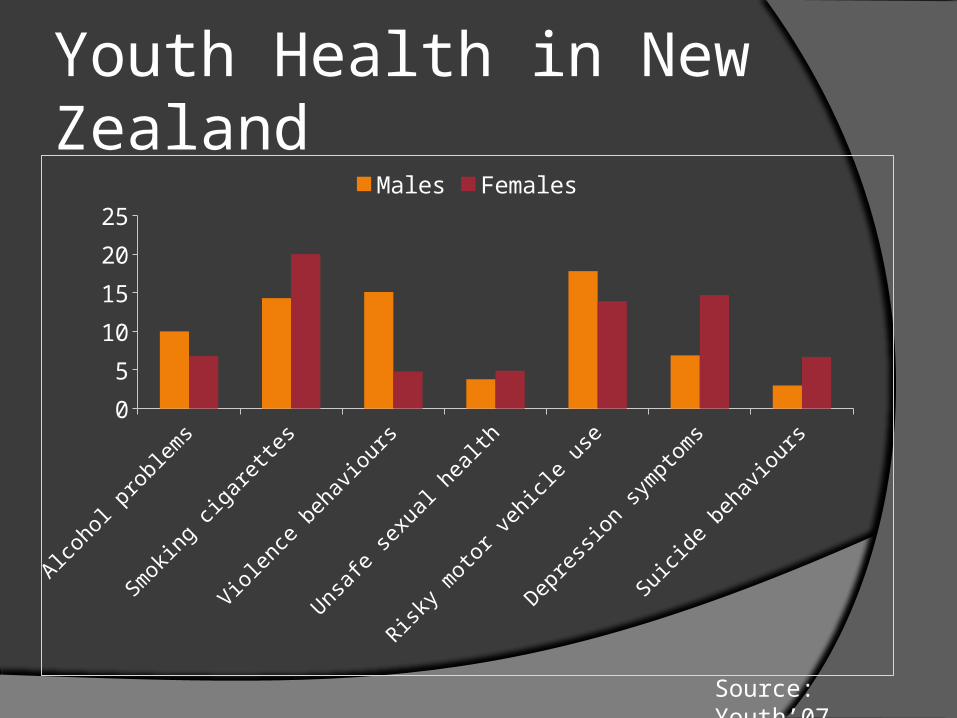
Youth Health in New Zealand
Alcoho
l pro
blem
s
Smok
ing
cigar
ette
s
Viole
nce
beha
viour
s
Unsaf
e se
xual
hea
lth
Risky
mot
or v
ehicl
e us
e
Depre
ssio
n sy
mpt
oms
Suicid
e be
havio
urs
0
5
10
15
20
25
Males Females
Source: Youth’07

Social determinants of Youth Health
Alcoho
l pro
blem
s
Smok
ing
cigar
ette
s
Viole
nce
beha
viour
s
Unsaf
e se
xual
hea
lth
Risky
mot
or v
ehicl
e us
e
Depre
ssio
n sy
mpt
oms
Suicid
e be
havio
urs
0
5
10
15
20
25
30
Low deprivation Medium deprivation High deprivation

0%
10%
20%
30%
40%
50%
60%
13 14 15 16 17
Dangerous/ Reckless Driving
Binge Drinking
Drinking and Driving
Alcohol Consumption
Risky Sexual Behaviour
Age
Prevalence of youth health risk behaviours by age

Current monthly use of alcohol, cigarettes, marijuana and other illicit drugs
Chen and Kandel 1995

Co-occurrence of these behaviours is common

Potentially Risky Behaviours
Ever drunk alcohol Ever smoked cigarette Ever used marijuana Ever had sex Been in a fight in last 12
months Thought of killing themselves
in last 12 months
84.1% reported at least one of these 6 behaviours
11.8% reported either 5 or all 6 of these health risk behaviours.

Health and Education:Truanting Behaviours

Truanting
Young people who truant are a major problem for schools and our communities
Educational achievement is critical for young people’s wellbeing and for their community
Traditionally health has not paid much attention to this group of students
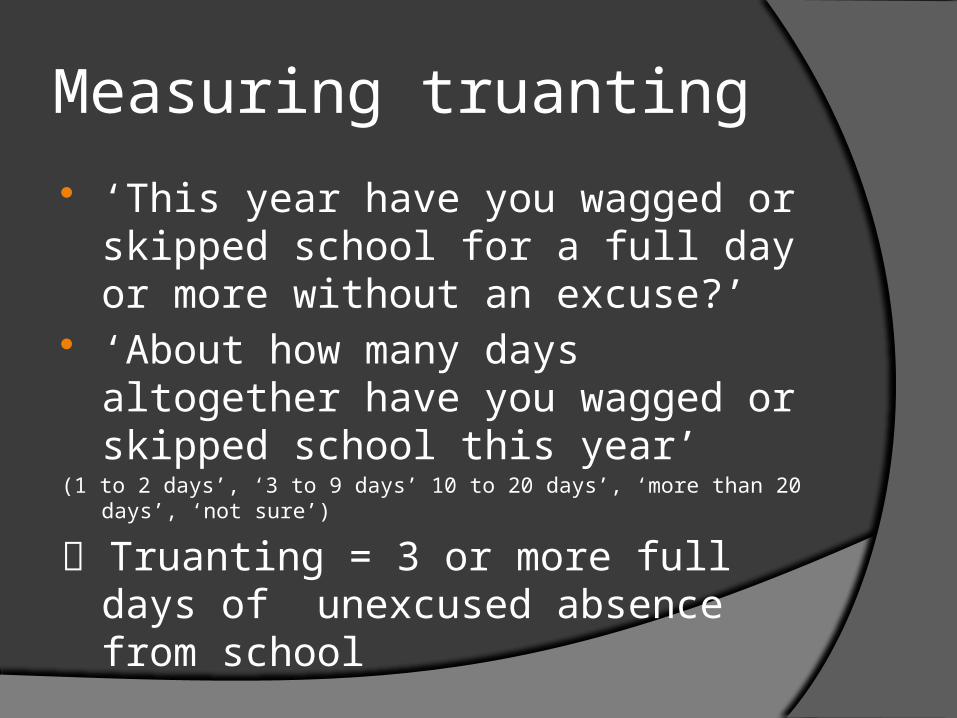
Measuring truanting
‘This year have you wagged or skipped school for a full day or more without an excuse?’
‘About how many days altogether have you wagged or skipped school this year’
(1 to 2 days’, ‘3 to 9 days’ 10 to 20 days’, ‘more than 20 days’, ‘not sure’)
Truanting = 3 or more full days of unexcused absence from school

13 years and younger
14 15 16 17 years and older
8.5
12.6
16
19.922.1
Truanting by age
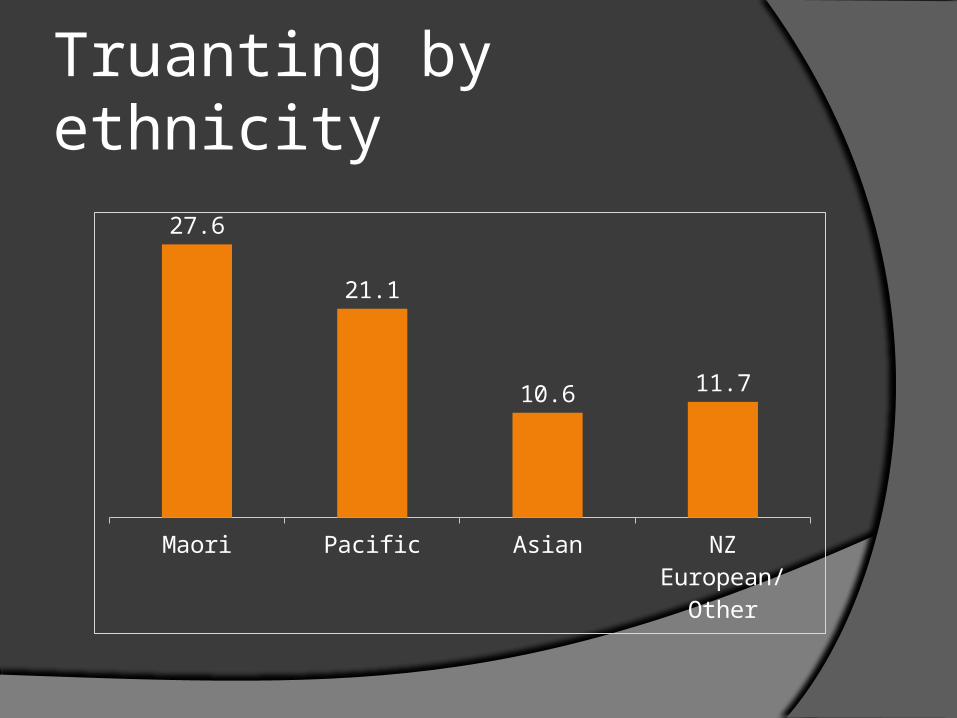
Truanting by ethnicity
Maori Pacific Asian NZ European/ Other
27.6
21.1
10.6 11.7

Truanting by socio-economic deprivation
i (low deprivation) ii iii iv (high deprivation)
12.2 12.915.1
21.6

What about differences among students? Students are not the same and vary by
individual characteristics, family circumstances and emotional and behavioural issues
How do school environments impact of these students?
Are students with behavioural problems more likely to truant?
Do supportive school environments reduce the risk of truanting?

Strengths and Difficulties Questionnaire Emotional symptoms: Impulsive/aggressive behaviour
problems: Hyperactivity/inattention problems: Peer problems
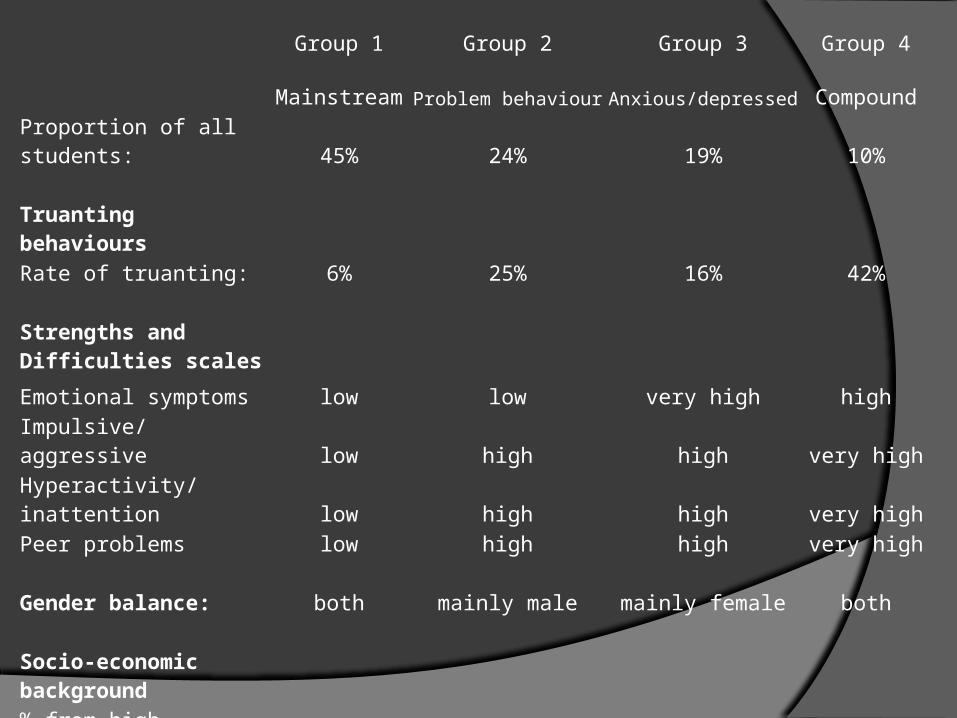
Group 1 Group 2 Group 3 Group 4
Mainstream Problem behaviour Anxious/depressed Compound
Proportion of all students: 45% 24% 19% 10%
Truanting behavioursRate of truanting: 6% 25% 16% 42%
Strengths and Difficulties scales
Emotional symptoms low low very high high
Impulsive/aggressive low high high very highHyperactivity/inattention low high high very highPeer problems low high high very high
Gender balance: both mainly male mainly female both
Socio-economic background
% from high deprivation backgrounds: 14% 26% 28% 36%

How do school environments impact of truanting among these groups of students?

Student MeasuresStudent relationships
‘Students in this school have difficulty getting along with each other’
Student participation in extra-curricular activities
‘Do you belong to any school sports teams?’, ‘Do you belong to any clubs or teams other than sports teams at school? (e.g. musical or singing group, cultural club, library group)’, ‘Do you do any activities to help others at school? (e.g. peer support, tutoring, coaching, being a leader, helping others with work’
School engagement
‘Teachers go out of their way to help students’, ‘Students try to get the best grades that they can’, ‘How often do the teachers at your school treat students fairly?’, ‘How much do people at school care about you?’, ‘Do you feel like you are part of your school?’, ‘Do people at your school expect you to do well?
School safety ‘Do you feel safe in your school?’, ‘During this school year, how often have you been afraid that someone will hurt or bother you at school?’, ‘This year how often have you been bullied in school?’

Teacher Measures
Innovation culture and vision
Family involvement
Teacher-student interactions
Support for ethnic diversity
Supports for disruptive students
Health and welfare services

Findings

Mainstream
Problem
behaviour
Anxious/
depressed Compound
School climate factor
Students get on well yes yes yes -
Student participate in sports etc yes - - -
Students feel part of the school and feel teachers care - - yes -
Students feel safe - - - -
Teacher-student interactions - - - -
Family involvement - - - -
Innovation - - - -
Support for disruptive students - yes - -
Support for ethnic diversity - - - -
Health and support services provided - - - -

Students differ considerably in their propensity to truant – students with emotional and behavioural problems are much more likely to truant than students without such problems.
Most students – those with low to moderate emotional or
behavioural problems – are less likely to truant from schools where students get on well together, join in activities beyond the classroom, and feel part of the school.
However, this is not the case with students with high levels of emotional and behavioural problems. They are very likely to truant from any type or condition of school, whether there is a climate encouraging engagement or not. For these students, targeted mental health services are needed to provide treatment for their emotional health concerns and behavioural problems.

Why is information from the Youth2000 surveys important? Nationally representative Largest surveys of young people in New
Zealand Comprehensive Robust and accurate Trends over time Identifies areas of concern Dispels myths Gives young people a voice

Taking part in the National Survey in 2012 The success and validity of the national
survey depends on high response rates We randomly select 100 schools and
15% of students from each school to take part
We will do everything we can to accommodate each schools needs to minimise disruption
Each school gets a school report


![[Richard denny] communicate_to_win](https://static.fdocuments.us/doc/165x107/559cbddd1a28ab76268b46ae/richard-denny-communicatetowin.jpg)