Download the Plan - Fix Social Security NOW
24
Draft Copy v1.51 Spend Less, Make More: Solving the Social Security Crisis Without Higher Taxes, Lower Benefits, Or Privatization Joe The Economist August 2011
Transcript of Download the Plan - Fix Social Security NOW

Draft Copy v1.51
Spend Less, Make More: Solving
the Social Security Crisis Without
Higher Taxes, Lower Benefits, Or
Privatization Joe The Economist
August 2011

Draft Copy v1.51
Contents Abstract ......................................................................................................................................................... 4
Introduction .................................................................................................................................................. 4
Executive Summary ....................................................................................................................................... 4
Executive Detail ............................................................................................................................................. 5
The State of Social Security Today ............................................................................................................ 5
Progressively Worse Returns on Contribution(“ROC”) ......................................................................... 6
Inefficiencies in the System ...................................................................................................................... 6
Risk Allocation ....................................................................................................................................... 7
Cost Allocation and Buyer Discrimination ............................................................................................ 7
Investment Allocation ........................................................................................................................... 8
Welfare.................................................................................................................................................. 9
Spend Less, Make More ............................................................................................................................ 9
Impact on Social Security .................................................................................................................... 11
Impact on the Trust Fund .................................................................................................................... 11
Impact on the Private Sector .............................................................................................................. 13
Impact on the Private Sector .............................................................................................................. 13
Impact on the Financial Sector Specifically ......................................................................................... 13
Conclusions ............................................................................................................................................. 14
Appendix A: How Is Your Social Security Money Invested ......................................................................... 15
What Is A Special Public-debt Obligation? ............................................................................................ 15
What Is The Investment Policy Of The Social Security Trust Fund? ..................................................... 15
Appendix B: What Is the Return for Money Invested in Social Security ..................................................... 18
Our Contrasting View of Returns ........................................................................................................... 19
Appendix C: Risk in the System ................................................................................................................... 20
Appendix D: Economic Assumptions .......................................................................................................... 21
Appendix E: A Working Example ................................................................................................................. 22
Workers ................................................................................................................................................... 22
Financial Intermediaries.......................................................................................................................... 22
Sources ........................................................................................................................................................ 24
Government Documents ......................................................................................................................... 24
Research Papers ...................................................................................................................................... 24

Draft Copy v1.51
About the Author
Joe The Economist is the Internet Face of www.FixSSNow.Org. He has a PhD in economics from the
School of Hard Knocks – most of which can be attributed to the PhDs of lesser schools that have
been hired to run the Federal Reserve System.

Draft Copy v1.51
Abstract This paper introduces an alternative approach for solving the financial imbalances in the Social Security
system without increasing taxes, lowering benefits, or privatizing the system. This paper identifies four
economic inefficiencies within the system. The paper will subsequently outline a solution which deals
with one inefficiency, risk allocation. The point of this paper is to offer an exit to the false dichotomy
which has reduced the public debate about Social Security reform to a stalemate.
Our approach fixes a broken system. Raising taxes and cutting benefits merely pays for one.
Introduction
American retirement planning has traditionally rested on four pillars of funding. Work provided
a defined pension. People lived in and improved the value of a home. The government provided
tax incentives to create your own retirement savings. And finally, the back-up of all retirement
planning was Social Security1. Between the four most Americans felt certain that they would not
face abject poverty in retirement.
These pillars are under pressure. Defined benefit pensions are rapidly disappearing. The house
values are subject to the volatility of the housing market. Personal retirement savings have been
an uneven experience. Not one of these pillars has failed completely, but weakness in each has
collectively come to mean that a larger number of retirees will depend upon Social Security to a
greater extent.
While more people expect Social Security to play a greater role in their retirement, the system is
less prepared to serve as a safety net than at any time since the Trust Fund started accumulating
cash in 1983. The system is primarily supported by the working generation through payroll
taxes. Payroll taxes will come under pressure as the working generation is forced to support the
interest on the deficit. The working generation supports both the cost of Social Security and the
cost of the deficit through income taxes. Both of these financial obligations are growing at rates
that far exceed real wages.
Executive Summary
This paper will discuss the state of Social Security today. It will argue that the question of
solvency of the system is really a symptom rather than a disease. These questions are the
unavoidable outcome of a deeper problem – terrible economic returns. Those returns stem from
structural inefficiencies in the system. Finally, we introduce a new approach in which creating
new benefits lowers nominal cost of benefits, and gives people more of what they want: security. 1 For The purposes of this paper, Social Security is treated as an insurance company separate and distinct from the
US Government. We treat payroll taxes as insurance premiums. We treat the Trust Fund as an investment portfolio holding securities backed by the full-faith and credit of the US Government, indistinguishable from treasuries publically traded in the capital markets.

Draft Copy v1.51
This paper will argue that Social Security is very inefficient from an economic point of view.
We will identify four inefficiencies which introduce significant costs into the system, and lower
the quality of the benefits received by the retirees. All four could have stand-alone solutions
which would improve the system. The paper pursues only one because this paper serves
primarily to open new discussion points in a public debate that is stalemated in a false dichotomy
of raising taxes or lowering benefits.
The solution (Spend Less, Make More) introduces risk to the benefits equation such that we can
lower the perceived risk across the entire delivery platform. It will create new benefits that are
cheaper to deliver, and subsequently allows people to choose what they want. By allocating risk
more efficiently we can increase the quality of benefits while lowering the nominal cost of the
benefits.
Beyond dealing with the solvency issue of Social Security, the solution carries additional
objectives. This solution does not change the structure of Social Security, like privatization
does. The solution must carry minimal costs. Existing retirees are completely unaffected. The
majority of American workers are unaffected. The only difference that Americans will see is the
mix of the Trust Fund portfolio.
While the changes do not make Social Security a good deal, the new benefits make Social
Security a better deal for all generations.
Executive Detail
The Executive Detail is divided into five parts. The first part discusses the current state of Social
Security. The second part outlines four economic inefficiencies with the system. The third part
describes how the proposed changes will improve the system for beneficiaries. The fourth part
discusses the projected impact on the Social Security system. The fifth part is a brief conclusion.
The State of Social Security Today
Social Security today is insolvent by any standard of the insurance industry. The Social Security
Administration projects ―OASDI tax income will be sufficient to finance about 75 percent of
scheduled annual benefits in 2037 through 2084 after the combined OASI and DI Trust Funds
are projected to be exhausted‖2 This projection assumes that future working generations fully
support the system3. Without the support of the working generation the Trust Fund would last
about 4 years based on the 2010 Trustee Report.4
2 ―A Summary of the 2010 Annual Reports‖, Social Security and Medicare Boards of Trustees, Page 1
3 The basis for this assumption is not explained by the Social Security Administration. The Social Security
Administration assumes a completely inelastic demand for Social Security. That is inconsistent with recent studies.

Draft Copy v1.51
This paper will argue that the question of solvency of the system is really a symptom rather than
a disease. These questions are the unavoidable outcome of a deeper problem – terrible economic
returns. What should concern policy makers is that the economic returns of the system have
gotten worse over time, and are continuing to erode.
Progressively Worse Returns on Contribution(“ROC”)
Nothing is more destructive to Social Security than the ROC of the system, particularly for
younger workers. The ROC is the present value of expected future benefits that a worker
receives for contributing to the system. At this point, it is terrible. It provides an incentive for
workers and businesses to avoid the system either through avoidance or outright evasion.
The government reports on ROC in a study called ―Moneys-Worth Ratio‖. The most recent
study, July 2010, showed that many people can expect to get as little as .50 cents back for every
dollar that is put into the system5. We believe that the study paints an overly optimistic view of
the system by using unrealistic assumptions. And while the report shows that the returns are
terrible, we think that the returns are much worse.
The poor economic return from the system leads workers and business to avoid or evade the
system. A recent study has already shown that tax evasion is directly correlated to effective tax
rate6. That report projected that the underground economy annually hides roughly 2 trillion
dollars from the tax authorities on which Social Security can lose as much as 250 billion dollars.
The government gives business a significant incentive and tools to bypass the system. Business
can allocate labor earnings to benefits which are not subject to FICA taxes. Why does business
avoid the system? Businesses want to maximize the value of its compensation dollar. When a
dollar of wages generates 50 cents in taxes, the effective wage is 50% less than the nominal
wage. As the ratio effective/nominal wage drops, business allocates labor earnings away from
wages into non-taxed benefits because business wants its compensation dollar to reach the
employee. According to the latest Bureau of Labor Statistics statistics, business allocates 30% of
labor earnings to benefits7 without factoring in stock options.
8
Inefficiencies in the System
It is safer to assume that as people perceive that the benefits are at risk that they will treat Social Security more as a tax than as a insurance premium. 4 Assuming that outlays remain constant and the effective interest rate on the trust is 5%. It is probably more
accurate to assume that outlays grow and the effective interest rate trends down as the Trust replaces high yield debt issued in the 1990s with debt yielding much lower rates. If the outlays increase by 2% every year and the effective interest falls to 4%, the Trust is exhausted in 3 years. 5 “Money’s Worth Ratios Under the OASDI Program For Hypothetical Workers”, Social Security Administration, July
2010 6 ―America’s Underground Economy: Measuring the Size, Growth and Determinants of Income Tax Evasion in the
U.S‖, Richard Cebula and Edgar L. Feige, January 2011,Page 17 7 “Employer Costs for Employee Compensation – USDL-11-0304‖, Bureau Of Labor Statistics March 9, 2011
8 Author research with BLS

Draft Copy v1.51
How did the system get into this shape? Many conclude that the system overpaid beneficiaries
who participated early in the system. Without agreeing or disagreeing with that belief, this paper
will argue that the system cannot attract money well, manage what money it has, or allocate
benefits efficiently. It is basically the U.S. Post Office of the investment world.
Risk Allocation
Social Security is possibly the only retirement product in the United States that is completely
insensitive to risk tolerance. The inability to measure risk not only makes benefits cost more, but
materially degrades the quality of the benefit. Without a sense of risk tolerance, the government
will never be able to deliver the one thing that people want more than money: security.
Payment risk is spread mostly by age rather than by willingness to absorb risk. The increased
costs are staggering. I would gladly concede half of my benefits in exchange for a greater sense
of certainty. The government does not provide that option. So the government is literally paying
twice as much as it needs to pay, and delivering lower quality benefits.
The problem is that the system is a one-size-fits-all product. You can retire early. You can retire
later in your career. What you cannot do is manage your risk. Workers cannot avoid risk that
they do not want. Workers cannot take on additional risk to increase their returns. Workers are
stuck with whatever risk the system distributes whether they like it or not.
This approach is not only expensive but it is dangerous as well. The only way for expectant
retirees to express risk is to retire early. As workers retire early, there is more stress on the
system which propagates the risk in the system, leading more workers to retire as soon as they
can. The current configuration of Social Security has a serious potential to create an unstable
end for the system.
To learn more about risk in the Social Security system, please see: Appendix C: Risk in the
System.
Cost Allocation and Buyer Discrimination
Social Security sells insurance at the same price to every buyer even though the costs are
extremely different. Most insurance companies employ selective pricing models. In the auto
insurance business, for example, a buyer will pay more if he has had speeding tickets. Every
insurance business practices some degree of selective pricing and buyer exclusion. The less the
selective pricing in a system, the more one buyer subsidizes another buyer. Social Security has
no selective pricing.
This structural limitation presents different levels of economic consequence as the cost varies
substantially between buyers. The biggest economic impact is survivor benefits which are free.
The price for survivor benefits is the exact same for a young healthy single person as for an
unhealthy, very wealthy cardiologist who has two young children. According to the Social
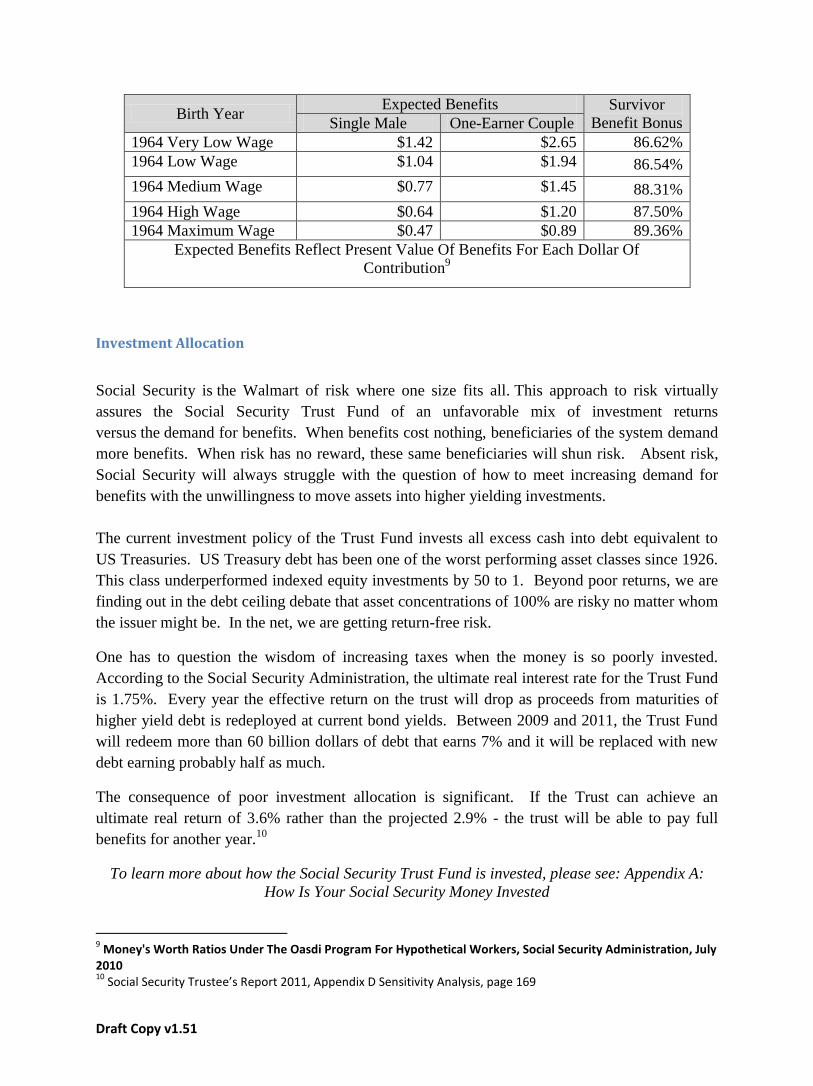
Security Administration, survivor benefits roughly double the nominal cost of benefits. Here is a
sample chart showing that the average married worker with children born in 1964 enjoys roughly
86% more benefits than an unmarried worker despite the fact that both pay at the same rate.
Draft Copy v1.51
Birth Year Expected Benefits Survivor
Benefit Bonus Single Male One-Earner Couple
1964 Very Low Wage $1.42 $2.65 86.62%
1964 Low Wage $1.04 $1.94 86.54%
1964 Medium Wage $0.77 $1.45 88.31%
1964 High Wage $0.64 $1.20 87.50%
1964 Maximum Wage $0.47 $0.89 89.36%
Expected Benefits Reflect Present Value Of Benefits For Each Dollar Of
Contribution9
Investment Allocation
Social Security is the Walmart of risk where one size fits all. This approach to risk virtually
assures the Social Security Trust Fund of an unfavorable mix of investment returns
versus the demand for benefits. When benefits cost nothing, beneficiaries of the system demand
more benefits. When risk has no reward, these same beneficiaries will shun risk. Absent risk,
Social Security will always struggle with the question of how to meet increasing demand for
benefits with the unwillingness to move assets into higher yielding investments.
The current investment policy of the Trust Fund invests all excess cash into debt equivalent to
US Treasuries. US Treasury debt has been one of the worst performing asset classes since 1926.
This class underperformed indexed equity investments by 50 to 1. Beyond poor returns, we are
finding out in the debt ceiling debate that asset concentrations of 100% are risky no matter whom
the issuer might be. In the net, we are getting return-free risk.
One has to question the wisdom of increasing taxes when the money is so poorly invested.
According to the Social Security Administration, the ultimate real interest rate for the Trust Fund
is 1.75%. Every year the effective return on the trust will drop as proceeds from maturities of
higher yield debt is redeployed at current bond yields. Between 2009 and 2011, the Trust Fund
will redeem more than 60 billion dollars of debt that earns 7% and it will be replaced with new
debt earning probably half as much.
The consequence of poor investment allocation is significant. If the Trust can achieve an
ultimate real return of 3.6% rather than the projected 2.9% - the trust will be able to pay full
benefits for another year.10
To learn more about how the Social Security Trust Fund is invested, please see: Appendix A:
How Is Your Social Security Money Invested
9 Money's Worth Ratios Under The Oasdi Program For Hypothetical Workers, Social Security Administration, July
2010 10
Social Security Trustee’s Report 2011, Appendix D Sensitivity Analysis, page 169

Draft Copy v1.51
Welfare
Social Security embeds many economic transfers mainly between generations but also between
income classes as part of promoting public welfare. Whether welfare should be distributed is a
question of public policy. This paper only suggests that the Social Security system is poorly
suited for this task because it has no way to measure need.
Social Security uses former reported-wages as a proxy for need. Social Security cannot account
for changes in income and wealth at all. A low wage worker who wins the lottery really doesn’t
need welfare. The lazy heir of the billionaire does not need welfare. However, if the lazy son
takes on 40 quarters of work he will qualify. The CEO who works for $10,000 and stock options
probably doesn’t need welfare. Having Social Security dispense welfare is simply inefficient
because the system has no view of where welfare should be given.
The economic outcomes are significant. According to the Social Security Administration, the
economic returns on contributions for low wage workers are roughly double that of high wage
workers. Moreover, there are few legal investments which offer the return of Social Security for
low wage workers. This is highly problematic in a world where businesses seek to avoid taxes,
and can do so by realigning labor cost from wages to benefits. With these kinds of incentives
one should expect Americans to minimize the wage component of their labor costs.
Year of
Birth Year
Single Male Single
Female
One-earner Two-earner
Relative Hypothetical Economic Returns Of Low Wage
Workers Versus Very High Wage Workers
1955 $1.31/191% $1.48/196% $2.54/189% $1.46/186%
1964 $1.42/202% $1.60/202% $2.65/198% $1.56/194%
1973 $1.52/198% $1.71/200% $2.77/195% $1.66/191%
1985 $1.57/202% $1.73/203% $2.79/197% $1.69/197%
1997 $1.60/202% $1.76/203% $2.82/197% $1.72/197%
For a very low wage worker born in 1955, a dollar invested in Social Security returned $1.31 in constant dollar benefits over the life of the beneficiary. That is
roughly double the expected return for high wage earner born the same year.
Spend Less, Make More

Draft Copy v1.51
The principle here is simple, more choice. Choice is the departure from the false dichotomy of
raising taxes and lowering benefits. The dichotomy is false because it is rooted in the idea that
Social Security cannot be improved. Choice will improve the quality of benefits, and can
actually lower the cost to deliver benefits.
This paper outlines a new benefit which would widen Social Security’s offerings, giving workers more
choice. Specifically, this plan would create a benefit which would give a risk management capacity to
workers. It would enable those who want less risk to trade future benefits for future security. It
also would enable those who want greater returns to share risk with the Trust Fund in higher
yielding investments. This change would allow the Trust Fund to have greater investment
income and lower on-going costs.
Workers would be free to choose the new benefits or stay with the existing package of benefits.
Those who choose the new benefits would trade existing benefits for a different benefits package
with risk management embedded into the payment plan. The new benefit would save the system
substantial resources while providing better benefits to the workers that the system serves.
The new benefit formula is variable. Retirement benefits will be tied to the performance of
underlying portfolios, embedded within the Trust Fund itself11
just like a variable annuity. These
accounts would be funded by on-going FICA contributions of the individual, and directed by the
worker until retirement. At retirement, the account would be invested in Treasury securities to
pay the individual an ongoing annuity of income only. When the retiree dies, the Treasury debt
in the account is passed back to the Trust Fund.
It is important to understand two aspects of a segregated account. While the worker may direct
the investment policy of the segregated account, the assets ultimately belong to the Social
Security Trust Fund. While the assets may belong to the Social Security Trust Fund, it may not
interfere in any way with the investments or use the assets in any way without the agreement of
the worker. So if the Trust Fund is exhausted, the Trust Fund may not use these funds to pay
other beneficiaries.
The segregated accounts would be maintained and marketed through traditional financial
brokerages under a contract negotiated by the government (please see Appendix E for a working
example). The broker would provide four services. They would:
1. Contact the Treasury Department to collect all FICA contributions associated to the
account.
2. Offer the worker a range of investment options in the form of mutual funds.
3. Convert the savings into an annuity at a time of the workers choosing
11
The Trust Fund will own all of the securities in the sub-portfolios, just as the Trust Fund owns the Special Debt Obligations currently held in the Trust Fund.
Draft Copy v1.51
4. Collect any early retirement taxes, or pay a bonus for deferring retirement12
A longer discussion of the process can be found in Appendix E: A Working Example. This discusses
the typical worker, and how that worker will interact with Social Security under the alternative
benefits package.
Impact on Social Security
The plan that we outline creates four positive impacts on Social Security. It allows individual
Americans more choice, and gives them the freedom to choose benefits which cost the system
less to deliver. Workers get what they want, and the system saves money. Our plan ….
Lowers risk in the system by creating variable benefits which will be more closely
matched with revenues. Benefits rise when the sub-accounts perform well. And benefits
contract when the sub-accounts do not perform well.
Increases the choices offered by Social Security. Choice means better benefits. These
better benefits happen to cost less to provide. By introducing choice into the equation it
is possible to lower the cost of benefits while increasing the effective value of them. We
don’t raise taxes. We actually fix the system by raising benefits.
Addresses the flaw in the system’s investment policy. We enable the system to invest
money for the Trust Fund in a shared-risk arrangement with workers who want more risk.
When the investment does well, the Trust Fund wins. When the investment loses, the
worker is taking most of the cost.
Fixes the perceived ROC by younger workers. As the ROC rises, the system will
experience less resource flight, where the combination of high taxes and low returns
chase capital into tax avoidance.
Impact on the Trust Fund
The Trust Fund will experience a mix of positive consequences from our plan. In short, it will have
greater revenue, lower expenses, and a lower risk profile. On an operational basis, the Trust Fund will
redeem Special Obligation Bonds earlier than currently expected. These accounts will provide a stream
of capital dedicated to purchasing US Treasury Debt in the open market which will help the US
Government refinance the debt held by the Trust Fund. We view all of these outcomes as a general
positive for the country.
Lower Expenses
12
Just like today, early retirement incurs a reduction in benefit. This plan would add incentives to defer retirement later in life. The definition of full-retirement would be defined within this law and would not be subject to changes in the retirement age defined by Social Security.

Draft Copy v1.51
The Trust Fund will have lower obligations. To get a segregated account, workers will have to concede
future benefits. This is effectively a write-off. So the nominal benefit that is paid to the retiree will in
most cases be smaller. The worker may receive higher nominal benefits but only to the extent that the
value of the segregated account has grown.
Increasing Revenue
The primary goal of our plan is to move assets to more productive uses. This process will increase the
revenue paid to the system. As capital moves to more productive uses wages will rise and jobs will be
more abundant. Second, once people realize a higher return on their contribution, people will retire
later and participate in the system to a greater extent. All of these are process that will increase the
FICA taxes that support Social Security.
Separately, our plan will increase the effective yield of the trust’s portfolio. While the Segregated
Account is directed by individual goals, it is fair to assume that the productive use will exceed that of US
Treasury Debt. Treasury Debt has been one of the lowest performing assets classes in modern history.
According to InvestorFriend.Com, stocks have outperformed Treasuries since 1926 by 50 to 1.
According to the Social Security Administration, increasing ultimate real interest from 2.9 to 3.6 will
extend the life of the Trust Fund by a whole year.
Portfolio Risk
Some will criticize this plan because it allocates some portion of assets to equity investments. Critics of
shifting Trust Funds to equity investment largely believe that investing in equities is risky and
complicated. We believe that the risk that is acquired in equity will be more than offset by the reduced
risk in Treasury Debt. Beyond that trade-off, the Trust Fund will have a shared-loss arrangement with
the worker.
We believe that there is nothing more risky than what we are doing today. This belief was re-enforced
during the discussions of the debt ceiling, in which the President said that Social Security checks were at
risk. Today we have 100% of the Trust Fund is invested in a single asset class which has enjoyed a 30
year bull market. Frankly, we believe that the investment policy is not only mismatched with the
objectives of the Social Security Trust Fund, but it is irresponsible from a fiduciary’s position.
On a first dollar basis, a portfolio of Treasuries is as safe today as any investment that can be made. It is
backed by the full faith and credit of the United States Government, and the capital markets provide
sufficient liquidity to sell the asset before maturity. On a last dollar basis, the portfolio is considerably
more risky because the sale of the first dollar affects the sale of the last dollar. Last dollar risk measures
what is the risk to capital if the Trust Fund had to liquidate its $2.3 trillion portfolio. That risk is sizable,
and it is likely to be more risky than the equity investment that we are proposing.
Redemption of Special Obligation Debt

Draft Copy v1.51
This plan would divert the payroll taxes of participants to individualized segregated accounts. The funds
would be directed to the broker representing the worker. This would reduce the overall payroll taxes
available to pay benefits. Given that benefits must be paid, our plan will force the Trust Fund to redeem
assets sooner than would normally occur.
Initiating debt redemption is a good thing in that increases the amount of time in which the government
can refinance the debt held by the Trust Fund. As it stands, the Trust Fund is scheduled to increase in
size until 2025 at which point the Treasury Department would have to start refinancing the debt held by
the Trust Fund. Currently the Treasury would have to refinance a projected $4.2 trillion over an 11 year
period. By diverting assets into segregated accounts, the system would be able to extend the
refinancing over a much longer period of time.
Assuming a 4% participation rate, one can expect roughly $60 billion dollars to be allocated to
segregated accounts every year. We assume that the 4% of the population which does participate will
statistically be at the high end of the earnings curve. So we expect 6,000,000 participants contributing
roughly 13,000 per year.
This process will be mitigated to some extent as workers retire. As workers retire, their Segregated
Accounts will be redeployed in US Debt to generate an annuity. This process will produce a steady
demand for US Debt which will help refinance the Special Obligation Bonds held by the Trust Fund.
Impact on the Private Sector
The most important aspect of our plan is that it works within the existing infrastructure of the American
business. Our plan requires no new forms, no new computer systems, and no new taxes. American
business will continue as though nothing happened.
Impact on the Private Sector
This plan will have two minor positive impacts:
First, the plan will open up a small percentage of the Trust Fund to higher yielding investments. This is a
good thing because it will lower to some extent the cost of capital. This will be somewhat offset by the
crowding-out effect of increase in public debt of the government.
Second, our plan will increase the certainty that the working generation will get something for its
contributions. This will lower the pressure on business to avoid the system. As the incentive to avoid
the system declines, businesses will allocate more wages which are subject to FICA taxes.
Impact on the Financial Sector Specifically
Draft Copy v1.51
This plan is highly dependent upon the existing infrastructure within the financial community. Without
the support of the financial community, the costs associated with this plan would increase considerably.
It is assumed that the participation of the financial community will be directly tied to the profitability of
these accounts. Accordingly our plan is designed to appeal to people who will form a base of highly
profitable accounts. Account profitability will decrease as marginal accounts are added, so the terms of
the exchange must cull out the most profitable accounts.
The plan is designed to work within the existing infrastructure. The segregated accounts will be
completely consistent with an IRA account where the Trust Fund owns the principal, and the beneficiary
is the annuity account for the worker. The brokerage industry has systems in place which can handle
the changing investment profiles. The sales force exists. The call centers exist. The forms exist. The
success of this plan depends upon controlling costs.
Conclusions
The problems of Social Security are systemic. The low return on contribution drives people to avoid or
evade the system. As participation drops, the ability to maintain the system drops. Any solution must
make the system more appealing to the working generation rather than less appealing. Our approach
widens the choices available which will improve both the quality of the benefits and increase the
confidence that the public has in the system. These are two cornerstones of any solution.
Draft Copy v1.51
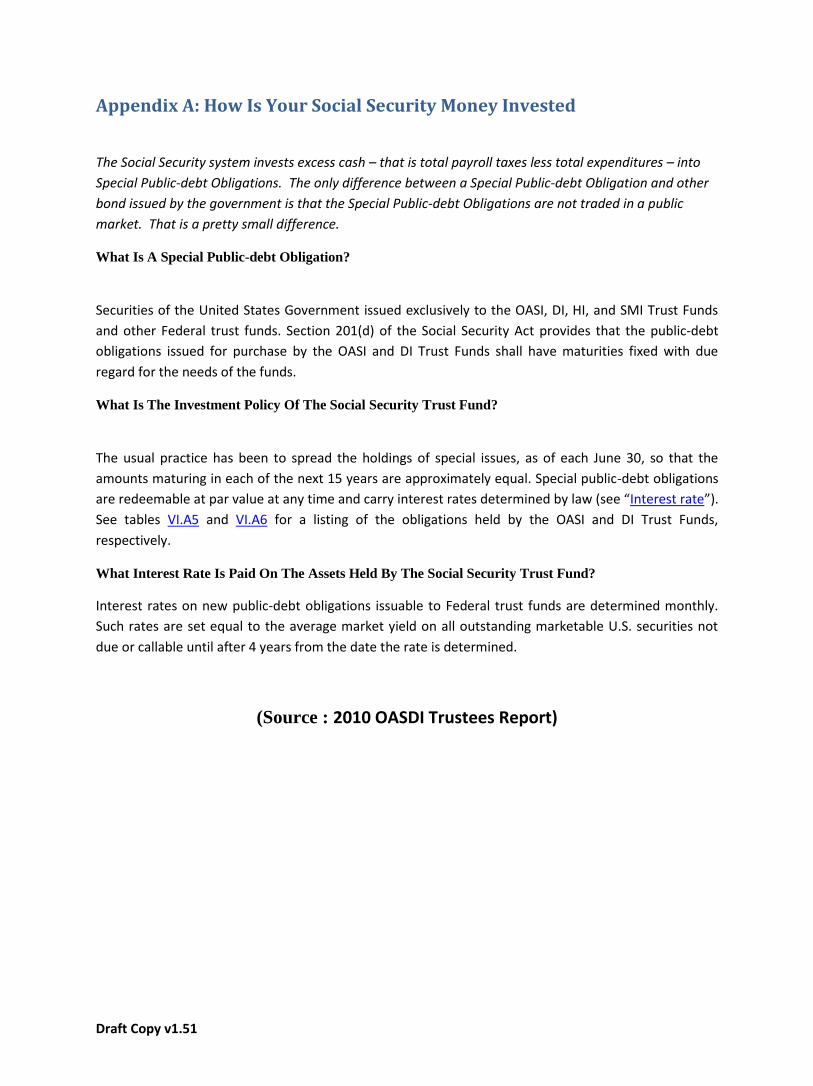
Appendix A: How Is Your Social Security Money Invested
The Social Security system invests excess cash – that is total payroll taxes less total expenditures – into
Special Public-debt Obligations. The only difference between a Special Public-debt Obligation and other
bond issued by the government is that the Special Public-debt Obligations are not traded in a public
market. That is a pretty small difference.
What Is A Special Public-debt Obligation?
Securities of the United States Government issued exclusively to the OASI, DI, HI, and SMI Trust Funds
and other Federal trust funds. Section 201(d) of the Social Security Act provides that the public-debt
obligations issued for purchase by the OASI and DI Trust Funds shall have maturities fixed with due
regard for the needs of the funds.
What Is The Investment Policy Of The Social Security Trust Fund?
The usual practice has been to spread the holdings of special issues, as of each June 30, so that the
amounts maturing in each of the next 15 years are approximately equal. Special public-debt obligations
are redeemable at par value at any time and carry interest rates determined by law (see “Interest rate”).
See tables VI.A5 and VI.A6 for a listing of the obligations held by the OASI and DI Trust Funds,
respectively.
What Interest Rate Is Paid On The Assets Held By The Social Security Trust Fund?
Interest rates on new public-debt obligations issuable to Federal trust funds are determined monthly.
Such rates are set equal to the average market yield on all outstanding marketable U.S. securities not
due or callable until after 4 years from the date the rate is determined.
(Source : 2010 OASDI Trustees Report)

Draft Copy v1.51
Assets of the OASI Trust Fund, End of Calendar Years 2008 and 2009
Rate Description
Position On Dec 31, 2008
Position On Dec 31, 2009
2.750 2.750 percent, 2009 $ 68,361,774.00 —
2.875 2.875 percent, 2010 — $ 52,423,996.00
3.750 3.750 percent, 2009 $ 7,420,648.00 —
3.875 3.875 percent, 2009 $ 4,440,134.00 —
Bonds:
3.250 3.250 percent, 2011-12 — $ 21,256,540.00
3.250 3.250 percent, 2013-15 — $ 31,884,813.00
3.250 3.250 percent, 2016-23 — $ 85,026,160.00
3.250 3.250 percent, 2024 — $ 153,311,163.00
3.500 3.500 percent, 2010 $ 9,513,751.00 —
3.500 3.500 percent, 2011-15 $ 47,568,755.00 $ 47,568,755.00
3.500 3.500 percent, 2016-17 $ 19,027,504.00 $ 19,027,504.00
3.500 3.500 percent, 2018 $ 86,900,994.00 $ 86,900,994.00
4.000 4.000 percent, 2009 $ 4,526,627.00 —
4.000 4.000 percent, 2010 $ 12,075,192.00 —
4.000 4.000 percent, 2011 $ 12,075,192.00 $ 12,075,192.00
4.000 4.000 percent, 2012 $ 12,075,193.00 $ 12,075,193.00
4.000 4.000 percent, 2013-22 $ 120,751,920.00 $ 120,751,920.00
4.000 4.000 percent, 2023 $ 142,682,893.00 $ 142,682,893.00
4.125 4.125 percent, 2009 $ 10,516,946.00 —
4.125 4.125 percent, 2010 $ 10,516,946.00 $ 9,423,199.00
4.125 4.125 percent, 2011-19 $ 94,652,514.00 $ 94,652,514.00
4.125 4.125 percent, 2020 $ 106,585,700.00 $ 106,585,700.00
4.625 4.625 percent, 2009 $ 9,167,664.00 —
4.625 4.625 percent, 2010-15 $ 55,005,984.00 $ 55,005,984.00
4.625 4.625 percent, 2016-18 $ 27,502,989.00 $ 27,502,989.00
4.625 4.625 percent, 2019 $ 96,068,657.00 $ 96,068,657.00
5.000 5.000 percent, 2009 $ 12,454,234.00 —
5.000 5.000 percent, 2010-11 $ 24,908,466.00 $ 24,908,466.00
5.000 5.000 percent, 2012-21 $ 124,542,320.00 $ 124,542,320.00
5.000 5.000 percent, 2022 $ 130,607,701.00 $ 130,607,701.00
5.125 5.125 percent, 2009 $ 11,567,865.00 —
5.125 5.125 percent, 2010-19 $ 115,678,660.00 $ 115,678,660.00
5.125 5.125 percent, 2020 $ 11,567,769.00 $ 11,567,769.00
5.125 5.125 percent, 2021 $ 118,153,469.00 $ 118,153,469.00
5.250 5.250 percent, 2009 $ 9,235,912.00 —
5.250 5.250 percent, 2010-15 $ 55,415,472.00 $ 55,415,472.00

Draft Copy v1.51
5.250 5.250 percent, 2016 $ 9,235,911.00 $ 9,235,911.00
5.250 5.250 percent, 2017 $ 77,387,242.00 $ 77,387,242.00
5.625 5.625 percent, 2009 $ 9,621,438.00 —
5.625 5.625 percent, 2010-11 $ 19,242,876.00 $ 19,242,876.00
5.625 5.625 percent, 2012-15 $ 38,485,748.00 $ 38,485,748.00
5.625 5.625 percent, 2016 $ 68,151,331.00 $ 68,151,331.00
5.875 5.875 percent, 2009 $ 6,169,273.00 —
5.875 5.875 percent, 2010-12 $ 18,507,819.00 $ 18,507,819.00
5.875 5.875 percent, 2013 $ 43,258,869.00 $ 43,258,869.00
6.000 6.000 percent, 2009 $ 6,693,627.00 —
6.000 6.000 percent, 2010-11 $ 13,387,254.00 $ 13,387,254.00
6.000 6.000 percent, 2012-13 $ 13,387,256.00 $ 13,387,256.00
6.000 6.000 percent, 2014 $ 49,952,497.00 $ 49,952,497.00
6.500 6.500 percent, 2009 $ 11,008,650.00 —
6.500 6.500 percent, 2010 $ 38,320,240.00 $ 38,320,240.00
6.500 6.500 percent, 2011-14 $ 34,309,584.00 $ 34,309,584.00
6.500 6.500 percent, 2015 $ 58,529,893.00 $ 58,529,893.00
6.875 6.875 percent, 2009 $ 3,975,271.00 —
6.875 6.875 percent, 2010-11 $ 7,950,544.00 $ 7,950,544.00
6.875 6.875 percent, 2012 $ 37,089,596.00 $ 37,089,596.00
7.000 7.000 percent, 2009 $ 3,371,480.00 —
7.000 7.000 percent, 2010 $ 3,371,480.00 $ 3,371,480.00
7.000 7.000 percent, 2011 $ 33,114,324.00 $ 33,114,324.00
7.250 7.250 percent, 2009 $ 27,311,591.00 —
$ 2,203,403,639.00 $ 2,318,780,487.00
$ (518,033.00) $ 18,017,594.00
Total assets $ 2,202,885,606.00 $ 2,336,798,081.00

Draft Copy v1.51
Appendix B: What Is the Return for Money Invested in Social Security
The government provides a Money’s-Worth report which compares the projected value of benefits and
the present value of contributions. The latest report offers two substantial findings. First, return on
contribution is directly correlated to generation where successive generations get progressively worse
returns. Second, the economic returns of the system are not very good. The report can be found on
the web at: http://www.ssa.gov/oact/NOTES/ran7/index.html (While the report does not explicit state
it, according to the Office of the Actuary, employer matches are treated the same as employee payroll
taxes.)
The report shows that the system is tilted toward low-wage workers, but we believe that the report
overstates the advantage. First, it is believed that wage and longevity are correlated. If so, wage will
lead to a longer life expectancy and longer benefits periods. Low-wage workers tend to start work
earlier as high-wages require training which postpones work. The low-wage worker probably starts
work at 18 rather than 22. There is a bias in the system for lower wage workers, but it is not as large as
this report shows.
Interest rate assumptions play a significant role in this report. The report uses historical performance
from the Trust Fund which roughly tracks the US Treasury market. We believe that this approach will
materially affect the outcome of the report.
First, US Treasury Debt approximates the return on a riskless investment. A Treasury bond is a financial
obligation backed by the full faith and credit of the US government. Social Security is a legislative
obligation which can be changed at any time. These are not compatible risks.
Second, the interest rate earned by the Trust Fund is the average of all outstanding debt with a maturity
of longer than 4 years. This rate of interest is basically a medium term note which is not consistent with
a retirement product that delivers returns as much as 75 years later.
Third, the bond duration of the government changes over time. For example, the bond duration was
shortened when the government decided to stop issuing 30 year debt. Using the Effective Rate of the
Trust introduces an unpredictable bias into the report
The report is based on a time series which draws into the report market fluctuations which will materially affect the conclusions in the report. The Treasury market has enjoyed a 30 year bull market. The changes in market prices have significant consequences. From 1941-1982 the real interest rate averaged -0.77% real interest. From 1982-2007, real interest increased to nearly 5%. Going forward, real interest of the Trust Fund is projected to average 2.5%. We believe that the report would be more effective if one applied a 4% real interest rate. This would reflect the longer term investment nature of Social Security, and reflect more fully the risks associated with the system.

Draft Copy v1.51
Our Contrasting View of Returns
My Returns
According to the Social Security Administration, I have paid roughly $100,000 in FICA contributions over
my working life. For this contribution, I am entitled to an annuity of $16,800 if I continue working until I
am 67. If I had invested my Social Security contributions into the S&P instead of Social Security, I would
have today roughly $350,000, which would grow to $800,000 assuming a 5% real return13 over the next
17 years without working another day in my life.
The Cost Of Social Security From Social Security Internal Account If I Die Before 67 $18,000 Survivor
Benefits $17,000 Increasing To $46,000
67 Until Death $16,800 Income Annuity
$46,000 In Annuity
Survivor Benefits $40,000 Income Annuity
$46,000 Income Annuity
Inheritable Wealth 0 $800,000
My cost and benefits are not a good example ….
My wages have been highest in years immediately before market downturns. In my case, 30% of my
contributions would have been invested at market tops in 1999, 2006, 2007. So my account return is
substantially below what should be expected.
40 Year Old ½ Median Income Worker14
The Cost Of Social Security Internal Account If Worker Dies Before 67
$12,000 In Income Increasing to 32,000
67 Until Death $32,000 In Annuity Survivor Benefits $32,000 Income
Annuity
Inheritable Wealth $558,320.5015
13
According To Crestmont Research The S&P has returned 4-6% since 1900, inflation adjusted, dividends reinvested for the tax exempt investor 14
Born 1969, Started Work At 18, Wages ½ median income as provided by The Tax Policy Center Available At http://www.taxpolicycenter.org/taxfacts/displayafact.cfm?Docid=227 15
Assuming a 4% real return, dividend reinvested for a tax exempt investor
Draft Copy v1.51
Appendix C: Risk in the System
Social Security is at present filled with uncertainty.
Political risk is the uncertainty of how Congress will modify the benefits calculation. The benefits
calculation has modified many times in the past, and more changes are under consideration today.
Financial risk is the way that the Trust invests its assets. The Trust invests 100% of its assets in US
Treasury Debt. Asset concentrations of 100% even in the safest sectors of the investment spectrum are
unwise. Issuer concentrations of 100% even with the safest issuers of the investment spectrum are
unwise. The risks have been acknowledged by the rating agencies, leading portfolio managers, and
even the Congressional Budget Office: “a growing level of federal debt would also increase the
probability of a sudden fiscal crisis, during which investors would lose confidence in the government’s
ability to manage its budget, and the government would thereby lose its ability to borrow at affordable
rates.”16
We believe that the greatest risk to Social Security is from the interest cost of the deficit. These costs
are not optional. Absent a significant rise in real wages, these costs will at some point force America to
prioritize all of its public expenditures.
Social Security is a likely target for two reasons. First, its obligations are legislative rather than
contractual. Second, Social Security adds to the deficit in one sense. FICA Taxes and Income taxes are
economic substitutes. The payroll taxes collected for Social Security are an opportunity cost in that they
cannot be collected for the general fund. If payroll taxes and income taxes are substitutes, it is very
possible that the working generation will vote to increase income taxes go up, lower FICA taxes, and re-
define Social Security on less generous terms.
16 “Federal Debt and the Risk of a Fiscal Crisis”, Congressional Budget Office, Page 1

Draft Copy v1.51
Appendix D: Economic Assumptions
Hauser’s Law And Payroll Taxes
Traditional economic analysis treats payroll taxes and income taxes as separate and distinct where one
does not affect the other.
We believe that these taxes have significant interaction. Each tax is applied to wages, so these taxes
must compete with each other for tax revenue within the wage tax base. They are like two straws
drinking from the same soda. If I raise a dollar in FICA taxes, it is a dollar that cannot be raised for the
general fund in the form of income taxes. For example it would be impossible to raise both the
effective income tax rate and FICA to 51% because you cannot tax more than 100% of the wages.
In the extreme world, traditional economic thinking will suggest that Social Security lowers the cost of
the deficit. One would conclude that the excess cash lowers the borrowing costs of the government,
and thereby lowers the deficit. At the other end of extremes, payroll taxes and income taxes are
substitutes where increasing one will force the other down over time. Literally every dollar of FICA
could have been raised for the general fund through income taxes. In that world, Social Security not
only contributes to the deficit, but may well be responsible for it entirely.
We believe that the truth lies between the extremes. Today 47% of American households have no tax
liability, other than FICA. We believe that the high cost of FICA has forced the government to lower
general income taxes to a point of zero for these people. Basically, we are diverting our tax base to pay
for our retirement while putting the rest of the government on our credit card.
We also believe that the relationship between payroll taxes and income taxes is not constant across
time or age demographic. The more the return on contribution of payroll taxes drops to zero, the more
the payroll tax becomes a direct competitor with income taxes. People willingly pay the payroll tax
when they believe that they are going to be well compensated for their money. As the return drops,
contributions start to look like taxes. The economic returns have dropped steadily since 1937.
The relationship between payroll taxes and income taxes has consequences to the extent that you
accept Hauser's Law. Hauser’s Law suggests that there is a maximum amount of taxes that our country
can take out of the economy (19.5% of GDP). If you accept any economic boundary to tax collection,
the more that the expected return of payroll taxes falls the greater the relationship between payroll
taxes and income taxes.
Payroll Taxes And Benefits
Currently the experts believe that Social Security benefits can cut without consequence to payroll tax
revenue. To the extent that payroll taxes are exempt from Hauser’s Law, it is because the tax has a
direct benefit. As you cut that benefit, you will see greater resistance to the payroll tax though
avoidance, evasion, and popular vote.

Draft Copy v1.51
Appendix E: A Working Example
Workers
This product will appeal to a wide-ranging number of people.
The typical worker who might select this offering is someone who fears means-testing
will reduce his benefits from Social Security. Once the account is funded, the worker has
an income stream that cannot be touched by Congress.
Another typical worker might select this offering because they believe that the stock
market will generate better returns than the generic system. While they would make a
substantial concession it is possible for equity investments to dramatically outpace the
performance of Treasury Debt.
Another typical worker might select this offering because they want to have more choice
about the terms on which they retire.
Financial Intermediaries
These plans are marketed and supported by government approved financial intermediaries. The
brokerage provides an important layer of protection against fraud and misconduct. The brokerage
also already has all of the infrastructure needed to support these accounts. In order to keep the
costs of the solution low and the deployment quick, the plan must work within the systems
infrastructure that exists today. If the Social Security Administration has to add a call center to
support questions, the plan is defeated.
While the worker may direct the segregated account, the assets of the segregated accounts belong
to the Social Security Trust Fund, so the government will negotiate the terms of the brokerage
relationship.
We discourage limits placed on what the broker can offer. The government needs to
shrink its footprint on the capital markets. Controlling access to these funds will create a
gap in the cost of capital in the private markets. That is an invitation to fraud and
malfeasance.
We strongly discourage any implied guarantee with these accounts. If the person is going
to get a minimum payment, the account must buy the insurance from a third party.

Draft Copy v1.51
We strongly encourage an aggressively negotiated fee schedule. These accounts are
likely to be highly profitable for the brokerage, and represent significant relationship
value. The fees should reflect both of these aspects.
We strongly encourage limits on number of transactions per year. This will hold down
the cost, and keep day traders from gambling with the assets which BELONG to the
Social Security Trust Fund.
Opening the Account
Workers would open an IRA account where the Social Security Trust Fund is the beneficiary.
The account would be funded by Social Security based on the number of quarters worked and
contributions made. Additionally, the accounts would receive 100% of the FICA contributions
of the worker, including the employer match.
Maintaining the Account
Workers would select from a wide range of mutual funds. It is likely that these accounts would
have transaction limits. Funding from on-going FICA contributions would be invested under a
set pattern, and would not count as a transaction if transaction limits were enforced.
Retirement
Workers select when and how they shift assets from the segregated account. They can move any
or all assets at any time. The worker can defer retirement past full-retirement age, and collect a
premium. The conversion is subject to an early retirement tax (just like today).
The worker would have a choice of investing in either a muni-annuity or a range of government
bond funds.
Without choices, workers will be at a significant reinvestment risk. For example, if a worker is
forced to convert his segregated account at a specific time, the worker may find that his or her
entire retirement plan has been invested at the top of the market – see bond yields from
December 2008. It is expected that the brokerages will offer some products to offset that risk,
but it should not be expected that they will be successful at completely offsetting that risk.
Upon Death
The assets held by the segregated account are transferred to the Social Security Trust Fund.
Survivor Benefits
The plan allows for survivor benefits, but there is a charge for them.

Draft Copy v1.51
Sources
Government Documents
The 2010 OASDI Trustees Report, Social Security Administration
“Federal Debt and the Risk of a Fiscal Crisis”, Congressional Budget Office
“Money’s Worth Ratios Under the OASDI Program For Hypothetical Workers”, Social Security
Administration, July 2010
Research Papers “America’s Underground Economy: Measuring the Size, Growth and Determinants of Income Tax
Evasion in the U.S”, Richard Cebula and Edgar L. Feige, January 2011
Websites
www.pollingreport.com, http://www.pollingreport.com/social.htm
www.InvestorsFriend.Com