DOTTORATO DI RICERCA - unica.it
148
Università degli Studi di Cagliari DOTTORATO DI RICERCA Scienze e Tecnologie Chimiche e Farmaceutiche Ciclo XXIII Structural and morphological characterization of hydrozincite and its interaction with organic molecules Settore scientifico disciplinare di afferenza CHIM/2-Chimica Fisica Presentata da: Dott.ssa Roberta Sanna Coordinatore Dottorato Prof. Mariano Casu Relatore Prof. Mariano Casu Esame finale anno accademico 2009 - 2010
Transcript of DOTTORATO DI RICERCA - unica.it
Università degli Studi di Cagliari
DOTTORATO DI RICERCA
Scienze e Tecnologie Chimiche e Farmaceutiche
Ciclo XXIII
Structural and morphological characterization of hydrozincite and its
interaction with organic molecules
Settore scientifico disciplinare di afferenza
CHIM/2-Chimica Fisica
Presentata da: Dott.ssa Roberta Sanna
Coordinatore Dottorato Prof. Mariano Casu
Relatore Prof. Mariano Casu
Esame finale anno accademico 2009 - 2010

i

ii
Abstract
The morphological diversity and complexity of naturally occurring forms and
patterns have been a motivation for humans to copy and adopt ideas from Nature
to achieve functional, aesthetic and social value. Common biogenic materials, such
as biominerals, constructed with mineral phases and an organic matrix exhibit
delicate structure with unusual optimal chemical-physical, morphological and
mechanical properties, and have inspired ideas for the design and synthesis of
biomimetic functional materials. The organic templates play an important role in
directing assembly of the mineral/organic composites, and in controlling the
nucleation and subsequent crystallization. Consequently, knowledge about the
molecular interactions at mineral/organic interfaces is essential for understanding
the principles of the organic-matrix-mediated biomineralization process.
The microscopic properties of biomineral hydrozincite [Zn5(CO3)2(OH)6] from
Naracauli Creek (SW Sardinia) were investigated by using X-ray Diffraction (XRD),
Fourier Transform Infrared (FT-IR), Nuclear Magnetic Resonance (NMR), Scanning
Electron Microscopy (SEM), and High-Resolution Transmission Electron
Microscopy (HR-TEM) and the organic matrix present has been extracted and
characterized by using Fourier Transform Infrared (FT-IR).
In the context of molecular interactions at mineral/organic interfaces we describe
an experimental study of the interaction of Bis(2-ethylhexil)phthalate (DEHP) with
hydrozincite. This interaction, under controlled laboratory experiments, was
investigated by using Fourier Transform Infrared (FT-IR) and Nuclear Magnetic
Resonance Spectroscopy (NMR).

iii

iv
Acknowledgement
First, I would like to thank my supervisor Prof. Mariano Casu. He has given me the
opportunity to explore the world of science and research in a really working
environment. His enthusiasm for all the aspects of research was contagious,
always helping me to do my best. His guidance, I could learn and explore several
aspects of biomineralization and the interaction between minerals and organic
molecules, applying different techniques for structural characterization.
I would really like to thank Prof. Anna Musinu for her help during my academic
career. She has nicely and patiently answered to all of my questions, even the
silliest ones. In particular, I would like to thank her for the valuable contribution to
my first scientific publication.
I want also to thank Dr. Giovanni De Giudici, Dr. Francesca Podda, Dr. Elodia
Musu, Dr. Riccardo Tombolini and Dr. Carla Cannas who contributed to my first
paper making it possible.
In particular, I would like to thank Dr. Carla Cannas and Dr.Andrea Ardu for the
XRD, TEM and HRTEM, Dr. Elodia Musu for the SEM and Dr. Marzia Fantauzzi for
the XPS experiments, as well as Prof. Constantino Floris who helped me often with
the organic chemistry involved in my job. Many thanks to Brian Phillips of the Stony
Brook University for having hosted me in his group, where I could enlarge my
knowledge and experise on the Nuclear Magnetic Resonance, but also, giving me
a valuable opportunity of personal growth.
During these three years I enjoyed discussing about science, as well as many
other aspects of my life as Ph.D student, with Federica Orrù, Mauro Mureddu,
Andrea Ardu, Alessandro Valente, Carla Cannas, Andrea Scorciapino, Cristina
Piras, Marzia Fantauzzi and Davide Peddis, who largely contributed to my scientific
and personal growth.

v
Also, I would like to thank the Bachelor and Master students I worked with:
Michela, Alessio Cuccu, Valentina Mameli, Denise Carta, Roberto Piras, Giulia
Casula and Silvia Meloni.
Last, but not least, I thank my parents Gina and Nicola, my brother Francesco, my
sisters Rossana and Alessandra, my nephews Giuseppe, Elisa, Chiara, Giacomo,
Giovanni and Simone, my brothers in law Giorgio and Giulio, my sister in law
Simona whose constant support and encouragement has brought me so far.
I have no words to thank Barbara and Roberta, who have been my best friends all
my life long. They have always helped whenever I was in trouble but, also, I hope
they remember all the fun and laughs we have had.
Finally I would like to thank Salvatore for being my first supporter both when we
were together and when I was abroad. I thank his parents for being so proud of
me. I hope to live up to the expectations of all of you.

vi
Preface
This PhD was born from the collaboration with the Department of Earth Sciences
Cagliari University. The research team superintended by Dr. Giovanni De Giudici
from several years deal with the heavy metal abatement in the water of Naracauli
creek (Sardinia, Italy) that follows the precipitation of biomineral hydrozincite. In
this context the aim of my doctoral work was above all devoted to characterize the
structural of biogenic hydrozincite deposition using spectroscopic, difractometric
and microscopic technique, such as X-ray Diffraction, Fourier Transform Infrared,
Nuclear Magnetic Resonance, Scanning Electron Microscopy, and High-Resolution
Transmission Electron Microscopy, and in a second time my interest was adressed
to the chemical physical study of the interaction between synthetic hydrozincite and
phthalates using Fourier Transform Infrared and Nuclear Magnetic Resonance.
This thesis reports the experimental work carried out at the Chemical Science
Department, Cagliari University (Italy) under the supervision of Prof. Mariano Casu
and a semester at the Geosciences Department of the Stony Brook University
(New York, USA) under the supervision of Prof. Brian Phillips.
This description is divided into five sections:
a) The first section presents a literature review about the interactions between
minerals and organic molecules.
b) The second section contains the experimental methods and the descriptions of
the samples object of the study.
c) The third section illustrates the general theory concerning the Solid State NMR.
d) The fourth section is devoted to the results concerning the structural
characterization of the biomineral hydrozincite.
e) The fifth section examines the results concerning the interaction between
synthetic hydrozincite mineral and Bis(2-ethylexyl)phthalate.

vii

viii
Table of Contents
Abstract………………………………………………………………………….…. ….…ii
Acknowledgement…………………………………………………………….……...…iv
Preface…………………………………………………………………………….….......vi
Chapter I Introduction……………………………………….………....…….....pp 1-34
1.1 Biomineralization and biomineral………….……………………........………..2
1.1.1 Biologically induced mineralization…….…………..…….………..….5
1.1.2 Biologically controlled mineralization…………………….…....….….6
1.2 The nature of mineral surfaces………………………………………….….….7
1.3 The organic mineral interface…………………………………………....…...10
1.4 The role of mineral in the pollution immobilization…………………........…12
1.5 Objectives………………………………………………………………....…....15
1.6 Overview on hydrozincite mineral……………………………………...……16
1.7 Phthalates and Bis(2-ethylexyl)phthalate……………………………....…..18
1.8 References…………………………………………………………………......21
Chapter II Materials and experimental procedures……………………..pp 35-46
2.1 The samples object of the study…………………………………....…...…...35
2.2 Extractions…………………………………………………………...……...…40
2.3 Techniques – Structural Characterization………………………...….….....41
2.4 Analytical Analysis…………………………………………………..….….....44
2.5 References…………………………………………………………..….……..45
Chapter III High Resolution Solid-State 13
C Nuclear Magnetic Resonance
Spectroscopy……...……………………………………...…...…pp 47-58

ix
3.1 Introduction………………………………………………………….…....……47
3.2 Magic Angle Spinning………………………………………………………....48
3.3 High Power Proton Decupling…………………………………......................49
3.4 Cross-Polarization………………………………………………………..........50
3.5 Relaxation phenomena………………………………………...…………..54
3.5.1 Transverse relaxation (T2)…….……………………………........…54
3.5.2 Transverse relaxation (T1)…….……………………………........…55
3.6 References………………………………..…………………………………...57
Chapter IV Structural and morphological properties of hydrozincite
minerals …………………………………………………………..pp 59-97
4.1 X-Ray diffraction measurement………………………………….........…….59
4.2 Infrared Spectroscopy investigation ……………………….........................61
4.3 The morphologies analized by Scanning Electron Microscopy….......…..65
4.4 HR-Trasmission Electron Microscopy structural information……….…...67
4.5 Solid State Nuclear Magnetic Resonance……………………………..…...70
4.5.1 13
C MAS experiments …………………………………………….71
4.5.2 13
C CPMAS experiments ……………………………….......…….73
4.5.3 Individual Gaussian decomposition of
13C CPMAS
overlapped signals ………………………………………..…...….75
4.5.4 Consideration on overlapped signals …………………….......….78
4.5.5 Evidence of organic matrix in hydrozincite biomineral…...…......…82
4.6 FT-IR characterization of organic matrix………………………….….......…83
4.6.1 Characterization of insoluble extract………………………………..85
4.6.2 Characterization of lipidic extract…………………………….......…..87
4.7 Conclusions…………………………………………………………………....89
4.8 References……………………………………………………………….....….91
Chapter IV Characterization of the interaction hydrozincite/DEHP...pp 99-126

x
5.1 Hydrozincite in vitro synthesis……………………………………………..….….99
5.2 Identification of extract molecule………………………………………….…….101
5.3 Origin of DEHP pollution……………………………………………...…….…....106
5.4 FT-IR study of hydrozincite synthesized in presence of PVC……………......107
5.5 FT-IR study of hydrozincite /DEHP mixture…………………………………….109
5.6 13
C MAS NMR investigation of hydrozincite /DEHP……………………….….112
5.7 13
C CPMAS NMR investigation of hydrozincitte /DEHP…………………...…116
5.8 13
C CPMAS experiments with different contact time………………………....119
5.9 1H MAS information ……………………………………………………………...121
5.10 X-Ray complementary information……………………………………....……123
5.11 Conclusions…………………………………………………………………......125
5.12 References…………………………………………………………………….…127
General consideration………………………………………………………………129
Appendix…………………………………………………………………….………...131
Scientific publications………………………………………………………………135

xi

1
Chapter I Introduction
Generalities
Chemical interactions at crystal-water interfaces are crucial to a wide range of
scientific and technological topics, including corrosion, heterogeneous catalysts,
chemical sensors, teeth and bones, titanium implants and other prosthetic medical
devices, and myriad commercial products including paints, glues, dyes, lubricants,
solvents, and cleaners. Geochemists pay special attention to reactions between
mineral surfaces and aqueous species interactions central to weathering, soil
formation, hydrothermal ore-forming fluids, biomineralization, biofilm formation,
uptake and release of chemicals that affect water quality, and many other natural
processes (Davis and Kent, 1990; Stumm, 1992; Vaughan, 1995; Hochella, 1995;
Drever, 1997; Langmuir, 1997; Brown et al., 1998; Brown and Parks, 2001; Davis
et al., 2004; De Yoreo and Dove, 2004; Lee et al., 2006, 2007; Glamoclija et al.,
2009). Studies of mineral-molecule interactions related to origins of life build on this
vast geochemical literature. The study of the interaction of organic molecules on
mineral surface is a very fascinating field that attracts the attention of researchers
in different area: they go to the chemistry, the biology, the earth sciences and the
material sciences. Mineral surface commonly include structural defects which
provide promising docking loci for organic molecules, and this surface order-
disorder provide some of the most fundamental constrains on reactions such a
sorption, coprecipitation, crystal growth and dissolution.
At the same time, however, in nature are present organic pollutants and the
mineral surfaces play an important role controlling the fate and transport of

2
contaminants in the environment. It is very fundamental to understand the
molecular level interaction between surface mineral and organic pollutants for
translate the information in the large scale for the design of chemical and biological
remediation strategies.
1.1 Biomineralization and biominerals
Biomineralization refers to the process by which organisms form minerals. Over 60
different types of minerals with biological origins are known (Lowenstam and
Weiner, 1989). Of the many essential elements required by living organisms,
Figure 1.1 Elegant examples of biomineralized products, in (A) radiolarians and (B) nautilus shell.
calcium is the most common of those found in biological minerals. Typical
examples of these biominerals are certain layers of seashell, corals and eggshells.
A variety of biomineral materials existing in nature present abundant morphologies
and structure (Lowestam and Weiner, 1989). Examples include the widely varied
scale produce by radiolarians (Fig. 1.1 A), and the impressive logarithmic
symmetry of the nautilus shell (Fig. 1.1 B).

3
Organisms have evolved the ability to direct the formation of minerals into
morphologies not naturally found in their inorganically derived counterparts. The
resulting biominerals have unique morphologies, hierarchical structures and
specific functions and often exhibit remarkable properties.The biomacromolecules
exert a precise control on the deposition of the minerals and, thereby, create
minerals with different shape and sizes. For example, human teeth show significant
durability due to the well-aligned structure of hydroxiapatite crystals contains a
small amount of protein (Furedimilhofer et al., 1994). With the study of biomineral
systems, the biological concept, mechanism, function and design feature are
abstracted as starting point on the road to new synthetic materials and devices with
advanced structure and functions, this are called bio-inspired materials that have
various application in different field as bioceramics, biosensing, biomedicals
engineering end bionanothecnology.
Numerous living organisms form minerals, biogenic minerals, or biominerals that
are composite materials that contain an organic matrix and nano or macro scale
amorphous or crystalline minerals. Biomineral composite materials include bone,
dentine, enamel, statoliths, otoliths, mollusk and crustacean shells, coccolith
scales, eggshells, sponge silica skeletons, algal, radiolarian and diatom silica
micro-shells, and a variety oftransition metal minerals produced by different
bacteria (Lowenstam and Weiner, 1989; Weiner and Addadi, 1997; Banfield and
Nealson, 1997; Fortin et al., 1997; Fitts et al., 1999; Lower et al., 2001; Mann,
2001; De Yoreo and Vekilov, 2003; Weiner and Dove, 2003; De Yoreo and Dove,
2004). Calcium is the most common essential element found in biological minerals.
For example, familiar skeletal structures such as shell are built from calcium
carbonate whereas the bones of higher organisms are composed of calcium
phosphate. The biomineralization of calcium carbonate is found across many forms
of life from the cell wall scales of coccolithophores to the inner ears of mammals

4
(Mann, 2001). These different structures are formed by a wide variety of organisms
that initialize substantially different biological process to result in at various
polymorphs of CaCO3 with distinctive mineralogies and composition (Morse and
Mackenzie, 1990). Organism are evolved the ability to direct the formation of
minerals into morphologies not naturally present in their inorganically counterparts.
As results the biominerals present specific functions and exhibit particular
properties. From a materials science perspective, organic molecules are soft,
compliant and fracture resistant while inorganic crystals are hard and brittle.
Biomineral composites combine the best of these properties and minimize the
weaknesses: they are both hard and fracture resistant (Currey, 1977; Schäffer et
al., 1997; Kamat et al., 2000). This is due to several factors: structure, nano-size
and chemical composition. Only recently materials scientists have begun to learn
how to build a synthetic composite material that outperforms each component
taken separately, and have done so inspired by shell nacre (Tang et al., 2003).
These unique process and particular properties of biomineralization are of interest
for many scientific disciplines as chemistry, geology and materials science. The
morphological control exerted in biomineralization may be separated into a three
component system (Mann, 1983; Weiner, 1991):
an insoluble organic matrix, which can play a role in compartmentalization
of the growing mineral, and/or templating the nucleation for controlled
crystallographic orientation and /or phase;
soluble acid macromolecules (e.g. sulphate and/orphosphorylated
glycoproteins contain large amounts of glutamic and aspartic acid) which
are frequently occluded within the crystals (Weiner, 1991) and are thought
to play a role in the control of crystal shape;
vesicular compartments, which provide spatial and temporal control of ion
and additive transport to the mineralization front.

5
There are two types of biomineralization depending on the level of biological
control: “biologically induced” and “organic matrix-mediated” mineralization
(Lowenstam, 1981), with the latter generalized in “biologically controlled”
mineralization (Mann, 1983).
Biologically induced mineralization (BIM) occurs as result of chemical change in
environment of an organism which can promote mineral precipitation as in the case
of coral formation; in biologically controlled mineralization (BCM) morphologically
complex structures nucleate and grow in concert with a genetically programmed
macromolecules matrix of proteins.
1.1.1 Biologically induced mineralization
Minerals that form by biologically induced mineralization (BIM) processes
generally nucleate and grow extracellularly as a result of metabolic activity of the
organism and subsequent chemical reactions involving metabolic byproducts. In
many cases, the biological system has a little control on the mineralization (Weiner
and Dove, 2003) and the organisms secrete one or more metabolic products that
react with ions or compounds in the environment resulting in the subsequent
deposition of mineral particles. The minerals that form are often characterized by
poor crystallinity, broad particle-size distributions, and lack of specific crystal
morphologies. In addition, the lack of control over mineral formation often results in
poor mineral specificity and/or the inclusion of impurities in the mineral lattice. BIM
is equivalent to inorganic mineralization under the same environmental conditions
and the minerals are therefore likely to have crystallochemical features that are
generally indistinguishable from minerals produced by inorganic chemical
reactions. In some cases, the metabolic products diffuse away and minerals form
from solution (Bazylinski and Frankel, 2003). However, bacterial surfaces such as

6
cell walls or polymeric materials (exopolymers) exuded by bacteria, including
slimes, sheaths, or biofilms, and even dormant spores, can act as important sites
for the adsorption of ions and mineral nucleation and growth (Beveridge, 1989;
Konhauser, 1998; Banfield and Zhang, 2001; Bäuerlein, 2003).
1.1.3 Biologically controlled mineralization
In biologically controlled mineralization BCM, the organism exerts a great degree of
crystallochemical control over the nucleation and growth of the mineral particles.
For the most part, the minerals are directly synthesized at a specific location within
or on the cell and only under certain conditions. The mineral particles produced by
bacteria in BCM are characterized as well-ordered crystals with narrow size
distributions, and specific, consistent particle morphologies. Because of these
features, BCM processes are likely to be under specific chemical/biochemical and
genetic control. In the microbial world, the most characterized example of BCM is
magnetosome formation by the magnetotactic bacteria, a group of microorganisms
in which BCM-produced magnetic crystals appear to have a relatively specific
function. Biologically controlled mineralization can be described as occurring extra,
inter or intracellular, and this distinctions refer to the location of the mineralization
sites. However, not all the mineralization processes can be classified in this simple
manner.

7
1.2 The nature of mineral surfaces
The theoretical crystalline surface terminates in an arrangement of atoms that
approximates the planar truncation of a periodic three-dimensional crystal
structure, but in real crystals this ideal situation is altered in several ways (e.g.,
Hochella and White, 1990; Somorjai, 1994; Hochella, 1995; Vaughan, 1995; Brown
et al., 1998):
surface atoms reside in an environment quite different from those below
the surface, and thus undergo relaxation owing to boundary effects
typically slight deviations from their formal crystallographic positions
(Hochella, 1990; Stipp and Hochella, 1991; Wright et al., 2001);
mineral surfaces in air or an aqueous medium are commonly subject to
chemical alteration through oxidation, hydration, or hydroxylation
(Guevremont et al., 1998; Biino et al., 1999; Stipp, 2002);
crystals invariably have defects and impurities that alter local surface
physical properties and chemical reactivity (Hochella, 1990; Cygan et al.,
2002).
The topology of real crystal surfaces also represents an important deviation from
ideality because crystal surfaces are seldom flat.
Mineral surfaces, with their low-level symmetries and multiple crystallographically
distinct atomic sites, present additional complexities compared for example with the
metals (Lasaga, 1990; Hazen, 2004). Although some common surfaces of rock-
forming minerals can be ideally planar at the atomic scale (e.g., the [100] plane of
quartz [SiO2], the [001] planes of graphite [C] and molybdenite [MoS2], and the
[001] planes of varied layer silicates such as micas and chlorites), most surfaces
are intrinsically irregular. Mineral surfaces also commonly include growth defects,
step edges and kink sites, which provide promising docking loci for organic

8
molecules (Lasaga, 1990; Teng and Dove, 1997; Teng et al., 1998; Orme et al.,
2001; Hazen and Sholl, 2003; De Yoreo and Dove, 2004). For example, Teng et
al., 2006) showed the step-dependent adsorption of succinic acid (1,4-dicaboxlyic
acid) on irregular growth surfaces of calcite. The presence of succinic acid in
solution blocks certain growth directions and thus dramatically modifies calcite
surface growth morphology. Additional complexities arise from a variety of
geological materials that do not have periodic two-dimensional surfaces, notably
amorphous materials such as basaltic glass from seafloor volcanoes. Mesoporous
zeolites and nano-particulate clays (including layer phyllosilicates and hydroxide
minerals) interact with organic molecules in complex three-dimensional
environments (Smith, 1998; Greenwell and Coveney, 2006; Benetoli et al., 2007).
For example, Pitsch et al. (1995) showed that double-layer hydroxide minerals
such as hydrotalcite efficiently adsorb glycoaldehyde phosphate and formaldehyde,
presumably into their relatively spacious inter-layer regions, and promote
condensation reactions to tetrose and hexose sugar phosphates. Given these
complexities, any realistic modeling of interactions between biomolecules and
mineral surfaces must take into account the geometries of both molecules and
surfaces. Mineral surfaces undergo important modifications in an aqueous
environment, especially in an electrolyte solution such as sea water (Parks, 1990;
Davis and Kent, 1990; Van Cappellen et al., 1993; De Leeuw and Parker, 1997; De
Leeuw et al., 1999; Wright et al., 2001; Stipp, 2002). In the classic electrical double
layer (EDL) model, a crystal surface in pure water directly contacts a compact
quasi-periodic layer of H+ or OH
− ions, whereas a second diffuse layer of mobile
ions extends from the compact layer a few Ångstroms into the fluid. The nature of
the EDL is strongly dependent on pH: At lower pH, the surface is typically
protonated and thus positively charged, whereas at higher pH, the surface is
negatively charged with hydroxyls. Adsorbed ionic and molecular species modify
9
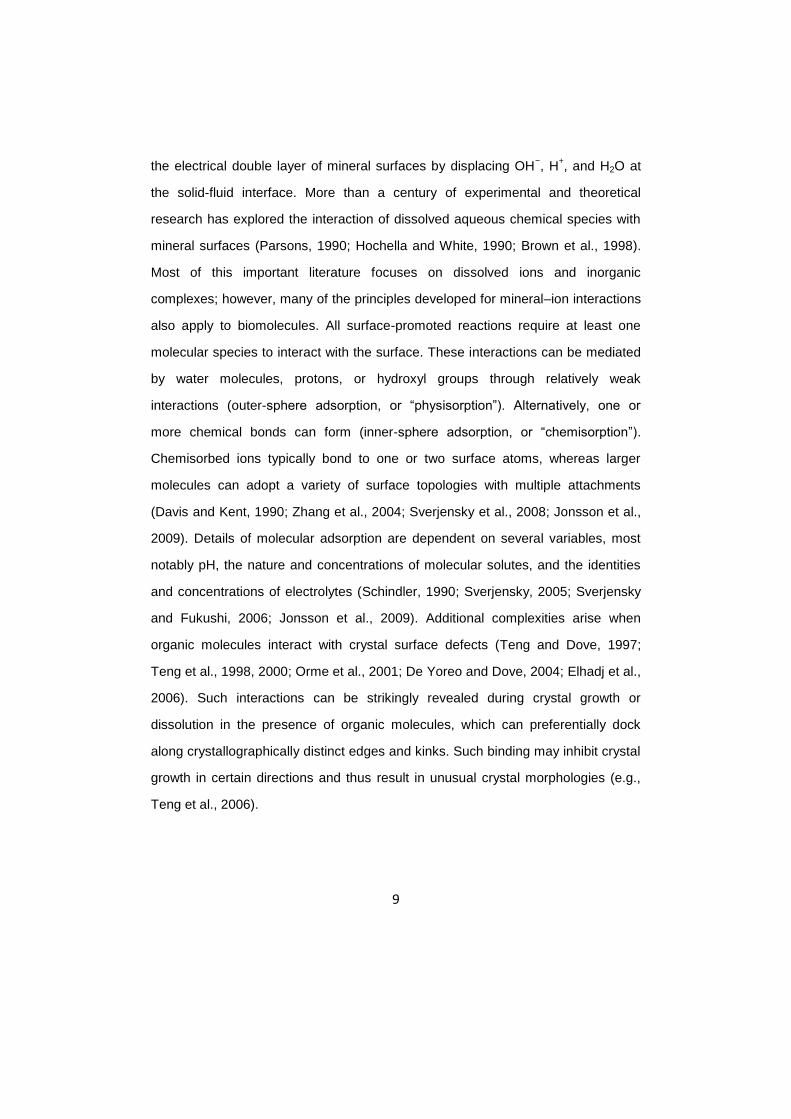
the electrical double layer of mineral surfaces by displacing OH−, H
+, and H2O at
the solid-fluid interface. More than a century of experimental and theoretical
research has explored the interaction of dissolved aqueous chemical species with
mineral surfaces (Parsons, 1990; Hochella and White, 1990; Brown et al., 1998).
Most of this important literature focuses on dissolved ions and inorganic
complexes; however, many of the principles developed for mineral–ion interactions
also apply to biomolecules. All surface-promoted reactions require at least one
molecular species to interact with the surface. These interactions can be mediated
by water molecules, protons, or hydroxyl groups through relatively weak
interactions (outer-sphere adsorption, or “physisorption”). Alternatively, one or
more chemical bonds can form (inner-sphere adsorption, or “chemisorption”).
Chemisorbed ions typically bond to one or two surface atoms, whereas larger
molecules can adopt a variety of surface topologies with multiple attachments
(Davis and Kent, 1990; Zhang et al., 2004; Sverjensky et al., 2008; Jonsson et al.,
2009). Details of molecular adsorption are dependent on several variables, most
notably pH, the nature and concentrations of molecular solutes, and the identities
and concentrations of electrolytes (Schindler, 1990; Sverjensky, 2005; Sverjensky
and Fukushi, 2006; Jonsson et al., 2009). Additional complexities arise when
organic molecules interact with crystal surface defects (Teng and Dove, 1997;
Teng et al., 1998, 2000; Orme et al., 2001; De Yoreo and Dove, 2004; Elhadj et al.,
2006). Such interactions can be strikingly revealed during crystal growth or
dissolution in the presence of organic molecules, which can preferentially dock
along crystallographically distinct edges and kinks. Such binding may inhibit crystal
growth in certain directions and thus result in unusual crystal morphologies (e.g.,
Teng et al., 2006).

10
1.3 The organic mineral interface
Biomineralization mechanisms are not completely clear (Mount et al., 2004), their
understanding may provide models for new material, inspired design solutions and
give new insight into the genetic control of biological structure (e.g. Schäffer et al.,
1997). The mechanism of biomineralization are poorly understood at the molecular
level, in the bone, shell and some bacterial filaments, the organic matrix direct the
formation of specific crystal phase, habit, size and orientation of the mineral. In the
Figure 1.2 is shows a biomineralization paradigm (Gilbert et al., 2005), but is not
generalized and it is a simply intended to guide our reasoning and gives a visual
model, however, it not included all biomineralization systems. To this day, the
organic molecular components have been identified in only few biominerals. This
paradigm, therefore, is to be interpreted as a conceptual mechanism, not a detailed
model of interaction between known molecules. This paradigm can simplify the
idea of the organic mineral interface and the chemical bonds at the interface. In
BCM and BIM process (Lowenstam, 1981) the organic components are formed
first, then these bind a few ions, which serve as nucleation sites for crystal growth
(Lowenstam and Weiner, 1989; Falini et al., 1996). In Figure 1.2, the organic matrix
(A) is composed from macromolecules which depending on the particular
biomineral may include a single organic molecule, e.g., a polysaccharide or a
complex arrangement of proteins and glycoproteins. In all cases the organic
components have charged functional groups that attract ions from solution (B). The
steric arrangement of organic macromolecules, their sequence, and folding
determines the precise position in three dimensions of the ions. Such positions are
only compatible with a specific mineral, even more: they are only compatible with a
well-determined polymorph of a specific mineral (C).

11
The crystal structure shown (C) is aragonite, the large white ions in (B) are Ca2+
,
while the small-white and large-dark atoms are C and O, respectively in (C). In (D)
is showed the zoom of the organic mineral interface, the inner-atomic bonds are
indicated by dashed lines.
Figure 1.2 The organic matrix (A) is composed of macromolecules, the organic components have charged functional groups that attract ions from solution (B). The steric arrangement of organic macromolecules, their sequence, and folding determines the precise position in three dimensions of the ions. Such positions are only compatible with a specific mineral, even more: they are only compatible with a well-determined polymorph of a specific mineral (C).The crystal structure shown (C) is aragonite, the large white ions in (B) are Ca
2+, while
the small-white and large-dark atoms are C and O, respectively in (C). (D) Zooming in on the organic-mineral interface: the inter-atomic bonds are indicated by dashed lines.
Several authors suggest that the negatively charged amino acids, aspartate and
glutamate, along their proteins sequences attract positive ions from solution and
iniziate crystal nucleation and growth (Mann, 2001; Weiner and Dove, 2003; Gotliv
et al., 2005). The concentration of amino acid usually constitute between 30 and 40
mol% of the protein matrix. Gotliv et al. (Gotliv et al., 2005) show that the “Asprich”

12
family of proteins from the bivalve mollusk Atrina rigida contained more than 50
mol% of aspartate and 10 mol% of glutamate. For this reason, the paradigm by
which negatively charged amino acid collect ions from solution provide the
nucleation sites and direct growth biomineralization, is very interesting.
1.4 The role of mineral in the pollution immobilization
Minerals play an important role in the regulation of contaminants in ecosystems. In
fact they can attenuate potentially toxic concentrations of contaminants and
accordingly diminish the risk of surface water and groundwater contamination. For
instance, silicates and oxides can adsorb organic pollutants, promoting their
degradation to nontoxic forms, attenuating their movement through the
environment, or preventing their uptake by plants and their introduction into the
food chain. The characteristic of minerals as particle distribution, high specific area,
structural order-disorder, and chemical groups in the surface make them highly
reactive and permitted strong physical and chemical interaction with pollutant
species, but at the other and also the physical chemical properties of the organic
pollutant are dedicate by the structure of the molecule and the nature of the atom
present in it, have an important role in the interactions.
For example, an important feature of clay minerals is the presence of structural
negative charges, which enables clay minerals to adsorb different kind of
molecules, especially organic and inorganic cations (Rytwo et al., 2002; Gürses et
al., 2004; Lombardi et al., 2006), and at very low pH, the edges of 2:1 and 1:1 clay
minerals carry a positive charge, which makes them capable to interact with
anionic compounds. Fe, Al, Mn, Si and Ti oxides exhibit variable or pH-dependent
surface charge, which is due to the amphoteric character of their surface hydroxyl
groups. As a result, most oxides exhibit positive charge at low pH and negative
13
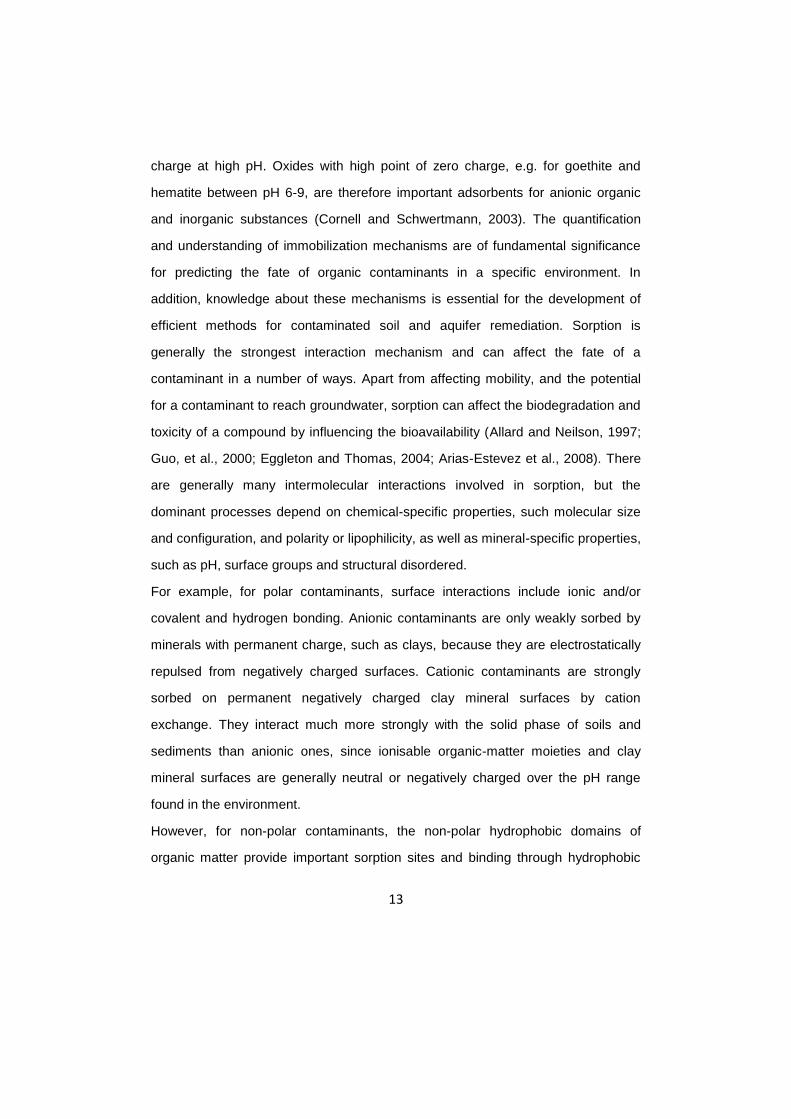
charge at high pH. Oxides with high point of zero charge, e.g. for goethite and
hematite between pH 6-9, are therefore important adsorbents for anionic organic
and inorganic substances (Cornell and Schwertmann, 2003). The quantification
and understanding of immobilization mechanisms are of fundamental significance
for predicting the fate of organic contaminants in a specific environment. In
addition, knowledge about these mechanisms is essential for the development of
efficient methods for contaminated soil and aquifer remediation. Sorption is
generally the strongest interaction mechanism and can affect the fate of a
contaminant in a number of ways. Apart from affecting mobility, and the potential
for a contaminant to reach groundwater, sorption can affect the biodegradation and
toxicity of a compound by influencing the bioavailability (Allard and Neilson, 1997;
Guo, et al., 2000; Eggleton and Thomas, 2004; Arias-Estevez et al., 2008). There
are generally many intermolecular interactions involved in sorption, but the
dominant processes depend on chemical-specific properties, such molecular size
and configuration, and polarity or lipophilicity, as well as mineral-specific properties,
such as pH, surface groups and structural disordered.
For example, for polar contaminants, surface interactions include ionic and/or
covalent and hydrogen bonding. Anionic contaminants are only weakly sorbed by
minerals with permanent charge, such as clays, because they are electrostatically
repulsed from negatively charged surfaces. Cationic contaminants are strongly
sorbed on permanent negatively charged clay mineral surfaces by cation
exchange. They interact much more strongly with the solid phase of soils and
sediments than anionic ones, since ionisable organic-matter moieties and clay
mineral surfaces are generally neutral or negatively charged over the pH range
found in the environment.
However, for non-polar contaminants, the non-polar hydrophobic domains of
organic matter provide important sorption sites and binding through hydrophobic
14
interactions (Van der Waals forces) will dominate the contaminant sorption
(Wauchope et al., 2002; Semple et al. 2003). Sorption of hydrophobic organic
contaminants to soil organic matter may be controlled by the amount of aromatic
carbon (Abelmann et al., 2005), aliphatic carbon (Simpson et al., 2003, Chen et al.,
2007), or the polarity of the soil organic matter (Tanaka et al., 2005). Müller et al.
(2007) showed that also mineral surfaces could significantly contribute to the
retention of hydrophobic organic contaminants, especially in subsurface soil
horizons and aquifer sediments with small amounts of organic matter. The link
between structure and physico-chemical properties of geosorbents and sorption
activity of hydrophobic organic pollutants upon interaction with solid matrices has
been established recently (Ehlers and Loibner, 2006). The conclusions are from
high importance for studies on risk assessment and remediation. Currently
research has focused on the development of low cost and highly reactive
innovative materials. These modified natural or designed materials can be very
useful in treating aqueous systems, including wastewater and aqueous waste
streams, by removing undesired substances. In addition, it might be possible to
incorporate or inject these materials into soil and subsoil, in order to enhance the
sorption and retention of organic contaminants. From these studies it can be
concluded that operative mechanisms for any particular interaction between
contaminants, soil constituents and soil biota depends on the nature and properties
of the soil surfaces, the chemistry of the system (e.g. pH, kind of exchangeable
cations, water saturation degree) and the chemical nature of the organic
contaminant.

15
1.5 Objectives
The main purpose of this study was to investigate and gain understanding of the
fascinating word of biominerals and their interaction with organic molecules.
The first part of the thesis presents the structural and morphological
characterization of biomineral hydrozincite and inorganic hydrozincite. This
biomineral is a zinc carbonate [Zn5(CO3)2(OH)6] that has been found in a mine
environment at Naracauli creek (Sardinia, Italy) in association with cyanobacteria
(Scytonema sp.) and algae (Chlorella) (Podda et al., 2000). At Naracauli creek, as
already shown in the literature, the precipitation of this biomineral results in the
abatement of zinc concentration from hundreds ppm to few ppm in few hundred
meters downstream. The presence of organic matter and the structural differences
compared to inorganic mineral surface is presented is highlighted.
In the second part of the thesis the study has been devoted to the physics
chemical study of the interaction between synthetic hydrozincite and several
phthalate. The problem of phthalate was born later when during investigation of the
molecular-level basis of biomineralization, we found the presence of bis-(2-
ethylexyl)phthalate (DEHP) in some of the in-vitro synthesized samples. The DEHP
was released by the tubing in PVC used for the synthetic preparation and capture
by the mineral synthetic surface. The DEHP have an important role in the
environmental sounds, due to the human health risk.

16
1.6 Overview on hydrozincite mineral
Hydrozincite [Zn5(CO3)2(OH)6] is a mineral formed in the oxidized zones of zinc
deposits and is found as masses or crusts and is often not readily observed and
may be confused with other minerals such as calcite. The mineral is often
associated with other minerals such as smithsonite, calcite, hemimorphite,
aurichalcite (Anthony et al., 2003).
The crystal structure of hydrozincite was first studied in a museum sample by
Subrata Ghose in 1964 (Ghose, 1964) using single crystal X-ray diffraction. The
structure is monoclinic with a0=13.62, b0=6.30, c0=5.42 A, β = 95°50’, the space
group is C2/m. There are two Zn sites, one in octahedral and one in tetrahedral
coordination as shown in Figure 1.3. The octahedral sites outnumber the
tetrahedral in the 3:2 ratio. Zinc atoms in tetrahedral coordination occur above
holes that are present in sheets of octahedral zinc atoms. CO3 groups are binding
the sheets parallel to (100). Out of the three oxygen atoms in the CO3 group the
first is bonded to an octahedral, the second to the tetrahedral oxygen site while the
remaining one is hydrogen bonded to three OH groups. The tetrahedral Zn-O
distance is limited to 1.95 Å and is significantly smaller than the octahedral Zn-O
distance at 2.10 Å. This author found also that synthetic crystals of hydrozincite
have low crystallinity, and speculated that plane defects are the likely cause for the
observed decrease in crystal order. After Ghose other authors studied the mineral
hydrozincite, Infrared spectra from several hydrozincite specimens can differ
significantly and show peak broadening (Jambor, 1966; Zabinsky, 1966). This
difference was explained to the contributions of different plane defects. Conversely,
Jambor (1964) and, more recently, Hales and Frost (2007) proposed that hydrous
zinc carbonate could have two, or more, polymorphs.

17
Figure 1.3 The crystal structure of [Zn5(CO3)2(OH)6]. The atoms of Zn are represented with cyan balls and they can be in octahedral and tetrahedral environment, as can be seen from the outline of the polyhedra shaded in gray. The atoms of O (red balls) are at the vertices of the polyhedra either stand-alone or bound with a hydrogen atom into an OH bond depicted as a black ball. The atom of C is shown as a yellow ball and finds itself in CO3 group bridging the Zn(OH)2 that grow parallel to (100).
Beside structural issues, hydrozincite attracted the interest of many authors
because of its role in the corrosion of Zn-rich materials (Stoffyn-Egli et al., 1998;
Morales et al., 2006; Ghosh and Singh, 2007), for its involvement in controlling the

18
mobility of zinc in soils (Uygur and Rimmel, 2000) and waters (Mercy et al., 1998;
Podda et al., 2000; Zuddas and Podda, 2005). Occurrence of hydrozincite forming
in Zn-polluted calcareous soils was recently found by Jacquat et al. (2008). In
addition, bioprecipitation of hydrozincite could represent an alternative biological
approach for bioremediation of zinc-contaminated waters. A zinc carbonate,
hydrozincite [Zn5(CO3)2(OH)6], has been found in a mine environment at Naracauli
creek (Sardinia, Italy) in association with cyanobacteria (Scytonema sp.) and algae
(Chlorella) (Podda et al., 2000). At Naracauli creek, as already shown in the
literature, the precipitation of this biomineral results in the abatement of zinc
concentration from hundreds ppm to few ppm in few hundreds meters downstream.
In addition, the bioprecipitation is also effective in the uptake of other heavy metals
(Cd, Pb, etc) that are concentrated in the precipitate sediments.
1.7 Phthalates and Bis-(2-ethylexyl)phthalate
Phthalate esters are a large group of chemical compounds that are frequently used
as plasticizers, solvents, and adhesives cosmetics, pesticides, building
maintenance products, lubrificants, and personal care goods that surround
consumers at home, work, and in hospitals (Kato et al., 2004).
Phthalates are principal components of flexible polyvinyl chloride (PVC) products.
PVC, after polyethylene is the second most widely used thermoplastic polymer, this
material without additive is inherently a rigid and brittle material, requiring large
amounts of plasticizer to make flexible products. In fact, approximately 90% of
global plasticizer production is destined for use in PVC plastic (Bizzari et al., 2000;
Houhhan and Wiles, 2000). The remaining 10% is used in other applications as
adhesives, caulks, skin creams, detergents, electrical capacitors, hairspray, ink,
solvents, lubrification oils, lotions, nail polish, paint, fragrances, and
19
pharmaceuticals (Shah and Shertukde, 2003). In personal care products, phthalate
provide flexibility, create a film, and help dissolve and fix other cosmetics
ingredients. The film forming and flexibility properties imparted by phthalates are
also useful in paint, inks, fillers, adhesive and caulks and insulating properties in
electrical cabling and capacitors (Gil et al., 2006).
The oily plasticizing properties of phthalates come from their chemical structure.
Phthalate represent a broad chemical family containing a benzene ring, two
carbonyl groups, and two alcohol groups to generate a diester structure. Common
branched phthalates such as bis(2-ethylhexyl)phthalate, di-n-butyl phthalate, n-
butyl-benzyl phthalate and di-isononyl phthalate features branched chain alcohol
moieties of 6 to 13 carbons. The linear phthalates containing linear alcohol groups
and include short chain phthalates such as DEP and DMP, and other phthalate
which chain lengths of 7 to 11 carbons are use to impart increased flexibility at low
temperature.
The benzene ring based structure of phthalates helps reduce their viscosity but
also makes them harder to degrade (Hatco Corp., 2002). Plasticizers act by
breaking up the secondary bonds holding the polymer chains together and forming
relatively weaker polymer-plasticizer bonds and thus impart mobility to the polymer
chain and/or polymer chain segments. Plasticizing efficiency is generally
considered to be a function of organic/inorganic moiety, functional groups present
in the plasticizer molecule, the structure, a chain length, a molecular weight, etc.
Thus, different plasticizers confer different plasticization effects because of the
differences in the strength of plasticizer- polymer and plasticizer-plasticizer
interactions. Phthalates move freely through the PVC polymer to impart flexibility
and other characteristics (Tickner et al., 1999). Since they are not covalently bound
to the polymer humans are exposed to contaminants in numerous ways, they are
fairly easily released to air, water, saliva, blood, nutritional formula and other

20
extracting materials (National Chemicals Inspectorate, 1977; Petersen and
Breindahl, 2000; Koch et al., 2003).This is especially true for bis-(2-
ethylhexyl)phthalate (DEHP). DEHP is the most important phthalate and more than
two million tons alone are produced worldwide each year (Lorz et al., 2002). DEHP,
in fact, is extensively used to plasticize polyvinylchloride (PVC), which in turn is
used to coat wires and flexible cables (Scholz et al., 2003). There is a large
literature on the release of DEHP from plastic devices into the environment
(Thuren, 1986; Calafant et al., 2004; Morrentsen et al., 2005).
DEHP migrates from the surface of the polymeric matrix during the use and
distribution of products, or after their disposal (Petersen et al., 1997). DEHP has
been a subject of public debate during recent years because it is suspected of
being a human cancer-causing agent and could cause liver and kidney damage.
Moreover it might damage the development of the reproductive organs and
interfere with their development by acting as a mimic of the sex hormone, estrogen
(Nielsen and Larsen, 1996). Environmental degradation of phthalates can occur by
hydrolysis, photodegradation and biodegradation (Staples et al., 1997). These
processes, however, are slow and therefore doing not play an important role in
degradation under typical environmental conditions (Asaoka et al., 2000). The most
common methods for DEHP removal from water are aerobic (Khan and Jung,
2008) and anaerobic biological stabilisation, chemical stabilisation by lime, before
or after dewatering and aerobic composting of the dewatered sludge (Marttinen et
al., 2004).

21
1.8 References
Abelmann, K., Kleineidam, S., Knicker, H., Gratwohl, P., Kogel-Knaber, I. Sorption
of HOCs in soils with carbonaceous contamination: influence of organic matter
composition. J. Plant Nutr. Soil Sci., 168, 293 - 306 (2005).
Allard, A.S. and Neilson, A.H. Bioremediation of Organic Waste Sites: A Critical
Review of Microbiological Aspects. Int. Biodeter. Biodeg., 39, 253-285 (1997).
Anthony, J.W., Bideaux, R.A., Bladh, K.W., Nichols, M.C. Handbook of Mineralogy,
Mineral Data Publishing, Tiscon, Arizona, USA, (2003).
Arias-Estevez, M., Lopez-Periago, E., Martinez-Carballo, E., Simal-Gandara, J.,
Mejuto ,J.C., Garcia-Rio, L. Review: The mobility and degradation of pesticides
in soils and the pollution of groundwater resources. Agr. Ecosyst. Environ.,
123, 247–260 (2008).
Asaoka, K., Hagihara, K., Kabaya, H., Sakamoto, Y., Katayama, H., Yano, K.
Uptake of phthalate esters, di(n-butyl)phthalate and di(2-ethylhexyl)phthalate,
as environmentalchemicals in monkeys in Japan. Bull. Envirom. Cont. Toxicol.,
64, 679-685 (2000).
Banfield, J.F. and Nealson, K.H. Geomicrobiology: interactions between microbes
and minerals. Rev. Mineral., 35 (1997).
Banfield, J. F. and Zhang, H. Nanoparticles in the environment. Rev. Mineral.
Geochem., 44, 1 (2001).
Bauerlein, E. Biomineralization of unicellular organisms: an unusual membrane
biochemistry for the production of inorganic nano-and microstructures. Angew.
Chem. Int. Ed. Engl., 42, 614-641 (2003).
Bazylinski, D.A., and Frankel, B.R. Biologically controlled mineralization in
prokaryotes. Rev. Mineral. Geochem., 54, 1, 217-247 (2003).
22
Benetoli, L., de Souza, C., da Silva, K., de Souza, I. Jr, de Santana, H., Paesano,
A. Jr, da Costa, A., Zaia, C., Zaia, D. Amino acid interaction with and
adsorption on clays: FT-IR and Mossbauer spectroscopy and X-ray
diffractometry investigations. Orig. Life Evol. Biosph., 37, 479–493 (2007).
Beveridge, T.J. The role of cellular design in bacterial metal accumulation and
mineralization. Annu. Rev.Microbiol., 43, 147-171 (1989).
Biino, G., Mannella, N., Kay, A., Mun, B., Fadley, C. Surface chemical
characterization and surface diffraction effects of real margarite (001): An
angle-resolved XPS investigation. Am. Mineral., 84, 629–638 (1999).
Bizzari, S.N., Oppenberg, B., Isktkawa, Y. Plasticizers. Chemical Economics
Handbook. Palo Alto, CA, SRI International (2000).
Brown, G.E. Jr., Heinrich, V.E., Casey, W.H., Clark, D.L., Eggleston, C., Felmy, A.,
Goodman, D.W., Grätzel, M., Maciel, G., McCarthy, M.I. Metal oxide surfaces
and their interactions with aqueous solutions and microbial organisms. Chem.
Rev., 99, 77–174 (1998).
Brown, G.E. Jr., Parks, G.A. Sorption of trace elements on mineral surfaces:
Modern perspectives from spectroscopic studies, and comments on sorption in
the marine environment. Int. Geol. Rev., 43, 963–1073 (2001).
Calafant, A.M., Slakman, A.R., Silva, M.J., Herbert A.R., Needham L.L. Automate
solid phase and quantitative analysis of human milk for 13 phthalat metabolites.
J.Chromatogr. B., Anal. Technol. Biomed.Life Sci., 805, 49-56 (2004).
Chen, G., Abichou, T., Tawfiq, K., Subramaniam, P.K. Impact of surface charge
density on colloid deposition in unsaturated porous media. Colloids Surf. A:
Physicochem. Eng. Aspects, 302, 342–348 (2007).
Cornell, R.M. and Schwertmann, U. The Iron Oxides. 2nd ed. Wiley-VCH,
Weinheim (2003).

23
Cygan, R.T., Wright, K., Fisler, D.K, Gale, J.D., Slater, B. Atomistic models of
carbonate minerals: Bulk and surface structures, defects, and diffusion. Molec.
Sim., 28, 475–495 (2002).
Currey, J.D. Mechanical properties of mother of pearl in tension. Proc. R. Soc
.Lond. B, 196, 443-463 (1977).
Davis, J.A., and Kent, D.B. Surface complexation modeling in aqueous
geochemistry. In Mineral-water interface geochemistry (ed. MF Hochella Jr, AF
White), Rev. Mineral., 23, 177–260 (1990).
Davis, J.A., Meece, D.E., Kohler, M., Curtis, G.P. Approaches to surface
complexation modeling of uranium (VI) adsorption on aquifer sediments.
Geochim. Cosmochim. Acta, 68, 3621–3642 (2004).
De Leeuw, N.H., Parker, S.C. Atomistic simulation of the effect of molecular
adsorption of water on the surface structure and energies of calcite surfaces. J.
Chem. Soc., Faraday Trans 93, 467–475 (1997).
De Leeuw, N.H., Parker, S.C., Harding, J.H. Molecular dynamics simulation of
crystal dissolution from calcite steps. Phys. Rev. B, 60, 13792–13799 (1999).
De Yoreo, J.J. and Dove, P.M. Shaping crystals with biomolecules. Science, 306,
1301–1302 (2004).
Drever, J.I. The geochemstry of natural waters. Prentice Hall, New York. (1997).
Elhadj, S., Salter, E.A., Wierzbicki, A., De Yoreo, J.J., Han, N., Dove, P.M. Peptide
controls growth on calcite mineralization: Polyaspartate chain length affects
growth kinetics and acts as a stereochemical switch on morphology. Cryst.
Growth Des., 6, 197–201 (2006).
Eggleton, J. and Thomas, K.V. A review of factors affecting the release and
bioavailability of contaminants during sediment disturbance events. Environ.
International 30, 973-980 (2004).

24
Ehlers, G.A.C. and Loibner, A.P. Linking organic pollutant (bio)availability with
geosorbent properties and biomimetic methodology: A review of geosorbent
characterisation and (bio)availability prediction. Environ. Poll., 141, 494-512
(2006).
Falini, G., Albeck. S., Weiner, S., Addadi, L. Control of aragonite or calcite
polymorphism by mollusk shell macromolecules. Science, 271, 67-69 (1996).
Fitts, J.P., Persson, P., Brown, G.E. Jr, Parks, G.A. Structure and bonding of
Cu(II)-glutamate complexes at the γ-Al2O3-water interface. J. Colloid Surface
Sci., 220, 133–147 (1999).
Fortin, D., Ferris, F.G., Beveridge, T.J. Surface-mediated mineral development by
bacteria. In Geomicrobiology: Interactions Between Microbes and Minerals
(eds BanfieldJ, NealsonKH). 35, 161–180. Mineralogical Society of America,
Washington, DC. (1997).
Furedimilhofer H., Moradianoldak J., Weiner S., Veis A., Mintz K.P., Addadi L.
Connect. Tissue Res., 30-251 (1994).
Ghose, S. The crystal structure of hydrozincite, Zn5(OH)6(CO3)2. Acta Cryst., 17,
1051-1057 (1964).
Ghosh, R. and Singh, D.D.N. Kinetics, mechanism and characterisation of passive
film formed on hot dip galvanized coating exposed in simulated concrete pore
solution. Surf. and Coat. Techn., 201 (16-17), 7346-7359 (2007).
Gil, N., Saka, M., Negulescu, I. (2006) Evaluation of the effects of biobased
plasticizers on the thermal and mechanical properties of poly(vinyl chloride). J.
Appl. Polymer Sci., 102(2): 1366
Gilbert, B. and Banfield, J.F. Molecular scale processes involving nanoparticulate
minerals in biogeochemicalsystems. Rev. Mineral. Geochem., 59,109-156
(2005).

25
Glamoclija, M., Steele, A., Fries, M., Schieber, J., Voytek, M.A., Cockell, C.S.
Association of anatase (TiO2) amd microbes: unusual fossilization effect or a
potential biosignature? In The ICDP-USGS Deep Drilling Project in the
Chesapeake Bay Impact Structure: Results from the Eyreville Core Holes (ed.
Gohn GS, et al. ) Geol. Soc. Am. Spec. Pap., 458, 965–975 (2009).
Gotliv, B.A., Kessler, N., Sumerel, J.L., Morse, D.E., Tuross, N., Addadi, L.,
Weiner, S. Asprich: a novel aspartic acid-rich protein family from the prismatic
shell matrix of the bivalve Atrina rigida. Chembiochem, 6,304-314 (2005).
Greenwell, H.C., and Coveney, P.V. Layered double hydroxide minerals as
possible prebiotic information storage and transfer compounds. Orig. Life Evol.
Biosph., 36, 13–37 (2006).
Guevremont, J.M., Strongin, D.R., Schoonin, M.A.A. Thermal chemistry of H2S and
H2O on the (100) plane of pyrite: unique reactivity of defect sites. Am. Mineral.,
83, 1246–1255 (1998).
Guo, L., Jury, W.A. Wagenet, R.J., Flury, M. Dependence of pesticide degradation
on sorption:nonequilibrium model and application to soil reactors. J. Cont.
Hydrol., 43, 45–62 (2000).
Gürses, A., Karaca, S., Dogar, Ç., Bayrak, R., Açikyildiz, M., Yalçin, M.
Determination of adsorptive properties of clay/ water system: methylene blue
sorption. J. Colloid Interface Sci., 269, 310–314 (2004).
Hales, M.C., and Frost, R.L. Synthesis and vibrational spectroscopic
chararacterization of synthetic smithsonite and hydrozincite. Polyhedron, 26,
4955-4962 (2007).
Hatco Corp. About esters, (2002).
Hazen, R.M. Chiral crystal faces of common rock-forming minerals. In Progress in
Biological Chirality (Eds. Palyi G et al.), Elsevier, New York 137–151 (2004).

26
Hazen, R.M. and Sholl, D.S. Chiral selection on inorganic crystalline surfaces.
Nature Mater, 2, 367–374 (2003).
Hochella, M.F. Jr. Atomic structure, microtopography, composition, and reactivity
of mineral surfaces. In Mineral-water interface geochemistry, (ed. MF Hochella
Jr, AF White), Rev. Miner., 23, 87–132 (1990).
Hochella, M.F. Jr. Mineral surfaces: their characterization and their physical and
reactive nature. Mineral surfaces (ed. DJ Vaughan, RAD Pattrick), Chapman
and Hall, New York 17–60 (1995).
Hochella, M.F.Jr., and White, A.F. Editors. Mineral-Water Interface Geochemistry.
Rev. Mineral., 23, Mineralogical Society of America, Chantilly, VA. (1990).
Houhhan, J., and Wiles, R. Beauty Secrets: Does a common chemical nail polish
pose risks to human health? Environ. Working Group, (2000).
Jacquat O., Voegelin A., Villard A., Marcus M.A., Kretzschmar R. Formation of Zn-
rich phyllosilicate, Zn-layered double hydroxide and hydrozincite in
contaminated calcareous soils. Geochim. Cosmochim. Acta., 72, 5037-5054
(2008).
Jambor, J. L. Studies of basic copper and zinc carbonates: I—Synthetic zinc
carbonates and their relationship to hydrozincite. Can. Mineral., 8, 92-108
(1964).
Jambor, L.J. Natural and synthetic hydrozincites. Can. Mineral., 8, 652-653 (1966).
Jonsson, C.M., Jonsson, C.L., Sverjensky, D.A., Cleaves, H.J., Hazen, R.M.
Attachment of L-glutamate to rutile (α-TiO2): a potentiometric, adsorption and
surface complexation study. Langmuir, 25, 12127–12135 (2009).
Kamat, S., Su, X., Ballarini, R., Heuer, A.H. Structural basis for the fracture
toughness of the shell of the conch Strombus gigas. Nature, 405, 1036–1040
(2000).

27
Kato, K., Silva, M.J., Reidy, J.A., Hurtz, D. 3rd, Malek, N.A., Needham, L.L.,
Nakazawa, H., Barr, D.B., Calafat, A.M.. Mono(2-ethyl-5-hydroxyhexyl)
phthalate and mono-(2-ethyl-5-oxohexyl) phthalate as biomarkers for human
exposure assessment to di-(2-ethylhexyl) phthalate. Environ. Health Perspec.,
112(3), 327-30 (2004).
Khan, M.H. and Jung, J.Y. Ozonation catalyzed by homogeneous and
heterogeneous catalysts for degradation of DEHP in aqueous phase.
Chemosphere, 72, 690–696 (2008).
Koch, H., Drexler, H., Angerer, J. An estimation of the daily intake of di(2-
ethylhexyl)phthalate (DEHP) and other phthalates in the general population.
Int. J. Hyg. Occup. Health, 77–83 (2003).
Konhauser, K.O. Diversity of bacterial iron mineralization. Earth Sci. Rev., 43, 91–
121 (1998).
Lasaga, A.C., Holland, H.D., Dwyer, M.J. Primordial oil slick. Science, 174, 53–55
(1971).
Langmuir, D. Aqueous environmental geochemistry Prentice-Hall, New York.
(1997).
Lee, H., Lee, B.P., Messersmith, P.B. A reversible wet/dry adhesive inspired by
mussels and geckos. Nature, 448, 338–342 (2007).
Lee, H., Scherer, N.F., Messersmith, P.B. Single-molecule mechanics of mussel
adhesion. Proc. Natl. Acad. Sci., 103, 12999–13003 (2006).
Lombardi, B.M., Torres Sanchez, R.M., Eloy, P., Genet, M. Interaction of
thiabendazole and benzimidazole with montmorillonite. Appl. Clay Sci. 33, 59–
65 (2006).
Lorz, P.M., Towae, F.K., Enke, W., Jäckh, R., Bhargava, N.. Phthalic acid and
derivatives. In: Wiley-VCH (Ed.), Ullmann's Encyclopedia of Industrial
Chemistry. Release, 7th Edition Online. Wiley-VCH, Weinheim (2002).

28
Lowenstam, H.A. Minerals formed by organisms. Science, 211(4487), 1126-1131
(1981).
Lowestam, H.A. and Weiner S. On biomineralization, Oxford University Press,
New York (1989).
Lower, S.K., Hochella, M.F., Beveridge, T.J. Bacterial recognition of mineral
surfaces: Nanoscale interactions between Shewanella and alpha-FeOOH.
Science, 292, 1360-1363 (2001).
Mann, S., Archibald,D.D., Didymus, J.M., Douglas, T., Heywood, B.R.,
Meldrum,F.C., Reeves,N.J.Crystallization at Inorganic-organic Interfaces:
Biominerals and Biomimetic Synthesis. Science, 261,
1286-1292 (1993).
Mann, S. Biomineralization: Principles and Concepts in Bioinorganic Materials
Chemistry. Vol 17. Oxford University Press, Oxford (2001).
Marttinen, S.K., Hänninen, K., Rintal,a J.A. Removal of DEHP in composting and
aeration of sewage sludge. Chemosphere, 54, 265–272 (2004).
Morse, J.W. and Mackenzie, F.T. "Geochemistry of sedimentary carbonates". Dev.
Sedimentology, 48, 1–707 (1990).
Mercy, M.A., Rock, P. A., Casey, W. H., Mokarram, M. M. Gibbs energies of
formation for hydrocerussite [Pb(OH)2·(PbCO3)2(s)] and hydrozincite
{[Zn(OH)2]3·(ZnCO3)2(s)} at 298 K and 1 bar from electrochemical cell
measurements. Am. Min., 83, 739-745 (1998).
Morales, J., D az, ., Hern ndez-Borges, J., onz lez S. Atmospheric corrosion in
subtropical areas: XRD and electrochemical study of zinc atmospheric
corrosion products in the province of Santa Cruz de Tenerife (Canary Islands,
Spain). Corrosion Sci., 48 (2), 361-371 (2006).
Morrentsen, G.K., Main, K.; Andersson, A.M., Leffers, H., Skakeback, N.E.
Determination of phthalate monoester’s in human milk and formula by tandem

29
mass spectrometery(LC/MC/MS). Annal. Bional. Chem., 382, 1084-1092
(2005).
Mount, A.S., Wheeler, A.P., Paradkar, R.P., Snider, D. Hemocyte-mediated shell
mineralization in the eastern oyster. Science, 304(5668), 297-300 (2004).
Muller, S., Totsche, K.U., Kogel-Knabner, I. Sorption of polycyclic aromatic
hydrocarbons to mineralsurfaces. Eur. J. Soil Sci. 58, 918-931 (2007).
Nass, L. Encyclopedia of PVC. New York: M. Decker (1977).
Nielsen, E. and Larsen, X. Toxicological Evaluation and Limit Values for DEHP
and Phthalates other than DEHP. Danish Environ. Protect. Agency (1996).
Orme, C.A., Noy, A., Wierzbicki, A., McBride, M.T., Grantham, M., Teng, H.H.,
Dove, P.M., DeYoreo, J.J. Formation of chiral morphologies through selective
binding of amino acids to calcite surface steps. Nature, 411, 775–778 (2001).
Parks, G.A. Surface energy and adsorption at mineral-water interfaces: An
introduction. In Mineral-water interface geochemistry (ed. MF Hochella Jr, AF
White), Rev. Mineral., 23, 133–175 (1990).
Parsons, R. Electrical double layer: Recent experimental and theoretical
developments. Chem. Rev., 90, 813–826 (1990).
Petersen, J.H. and Breindahl, T. Plasticizers in total diet samples, baby food and
infant formulae. Food Addit. Contam., 17, 133–141 (2000).
Pitsch, S., Eschenmoser, A., Gedulin, B., Hui, S., Arrhenius, G. Mineral induced
formation of sugar phosphates. Orig. Life Evol. Biosph., 25, 297–334 (1995).
Podda, F., Zuddas, P., Minacci, A., Pepi, M., Baldi, F.,. Heavy Metal
Coprecipitation with Hydrozincite [Zn5 (CO3)2(OH) 6] from Mine Waters Caused
by Photosynthetic Microorganisms. Appl. Environ. Microbiol., 66, 5092–5098
(2000).

30
Rytwo, G., Tropp, D., Serban, C. Adsorption of diquat, paraquat and methyl green
on sepiolite: experimental results and model calculations, Appl. Clay Sci., 20,
273–282 (2002).
Schäffer, T.E., Ionescu-Zanetti, C., Proksch, R., Fritz, M., Walters, D.A., Almqvist
,N., Zaremba, C.M., Belcher, A.M., Smith, B.L., Stucky, G.D., Morse, D.E.,
Hansma, P.K. Does abalone nacre form by heteroepitaxial nucleation or by
growth through mineral bridges? Chem. Mater., 9, 1731-1740 (1997).
Schindler, P.W. Co-adsorption of metal ions and organic ligands: formation of
ternary surface complexes. In Mineral-Water Interface Geochemistry (ed. MF
Hochella Jr, AF White), Rev. Mineral., 23, 281–307. (1990).
Scholz, N. Ecotoxicity and biodegradation of phthalate monoesters. Chemosphere,
53, 921–926 (2003).
Semple, K.T., Morriss, A.W.J., Paton, G.I. Bioavailability of hydrophobic organic
contaminants in soils: fundamental concepts and techniques for analysis. Eur.
J. Soil Sci., 54, 809-818 (2003).
Shah B. and Shertukde V.V., Effect of plasticizers on mechanical, electrical,
permanence and thermal properties of poly(vinyl chloride). J. Appl. Polym. Sci.,
90, 3278 (2003).
Simpson, M.J., Chefetz, B., Hatcher, P.G. Phenanthrene sorption to structurally
modified humic acids. J. Environ. Qual., 32, 1750 – 1758 (2003).
Smith, J.V. Biochemical evolution. I. Polymerization on internal, organophilic silica
surfaces of dealuminated zeolites and feldspars. Proc. Natl. Acad. Sci., 95,
3370–3375 (1998).
Somorjai, G.A. Introduction to surface chemistry, Wiley, New York (1994).
Stipp, S.L. and Hochella, M.F.Jr. Structure and bonding environments at the calcite
surface as observed with X-ray photoelectron spectroscopy (XPS) and low

31
energy electron diffraction (LEED). Geochim. Cosmochim. Acta, 55, 1723–
1736 (1991).
Stipp, S.L. Where the bulk terminates: Experimental evidence for restructuring,
chemibonded OH- and H+, adsorbed water and hydrocarbons on calcite
surfaces. Molec. Sim., 28, 497–516 (2002).
Stoffyn-Egli, P., Buckley, D. E., Clyburne, J. A. C. Corrosion of brass in a marine
environment: mineral products and their relationship to variable oxidation and
reduction conditions. Appl. Geochem., 13, 643-650 (1998).
Stumm, W. Chemistry of the solid-water interface Wiley, New York. (1992).
Sverjensky, D.A. Prediction of surface charge on oxides in salt solutions: revisions
for 1:1 (M+L
−) electrolytes. Geochim. Cosmochim. Acta, 69, 225–257 (2005).
Sverjensky, D.M., Jonsson, C.M., Jonsson, C.L., Cleaves, H.J., Hazen, R.M.
Glutamate surface speciation on amorphous titanium dioxide and hydrous ferric
oxide. Environ. Sci. Tech., 42, 6034–6039 (2008).
Sverjensky, D.A., and Fukushi, K. Anion adsorption on oxide surfaces: Inclusion of
the water dipole in modeling the electrostatics of ligand exchange. Environ. Sci.
Tech., 40, 263–271 (2006).
Staples, C.A., Peterson, D.R., Parkerton, T.F., Adams, W.J. The environmental
fate of phthalate esters: a literature review. Chemosphere, 35, 667–749 (1997).
Tanaka, F., Fukushima, M., Kikuchi, A., Yabuta, H., Ichikawa, H., Tatsumi, K.
Influence of chemical characteristics of humic substances on the partition
coefficient of a chlorinated dioxin. Chemosphere, 58, 1319 – 1326 (2005).
Tang, Z.Y., Kotov, N.A., Magonov, S.,Ozturk B. Nanostructured artificial nacre,
Nature Materials, 2 413-U8 (2003).
Teng, H.H. and Dove, P.M. Surface site-specific interactions of aspartate with
calcite during dissolution: Implications for biomineralization. Am. Mineral., 82,
878–887 (1997).

32
Teng, H.H., Dove, P.M., Orme, C., DeYoreo, J.J. The thermodynamics of calcite
growth: a baseline for understanding biomineral formation. Science, 282, 724–
727 ( 1998).
Teng, H.H., Dove, P.M., DeYoreo, J.J. Kinetics of calcite growth: analysis of
surface processes and relationships to macroscopic rate laws. Geochim.
Cosmochim. Acta, 64, 2255–2266 (2000).
Teng, H.H., Chen,Y., Pauli, E. Direction specific interactions of 1,4-dicarboxylic
acid with calcite surfaces. J. Am. Chem. Soc., 128, 14482–14484 (2006).
Thuren, A. Determination of phthalic aquatic environments. Bull. Environ.
Contamin.Toxicol., 36, 33-40 (1986).
Tickner, J., Hunt, P., Rossi, M., Haiama, N., Lappe M. The Use of Di-2-Ethylhexyl
Phthalate in PVC Medical Devices: Exposure, Toxicity, and Alternatives.
Lowell: Lowell Center for Sustainable Production, University of Massachusetts
Lowell (1999).
Uygur, V. and Rimmer, D.L. Reactions of zinc with iron-oxide coated calcite
surfaces at alkaline pH. Europ. J. of Soil Sci., 51 (3), 511-516 (2000).
Van Cappellen, P., Charlet, L., Stumm, W., Wersin, P. A surface complexation
model of the carbonate mineral-aqueous solution interface. Geochim.
Cosmochim. Acta, 57, 3505–3518 (1993).
Vaughan, D.J. Mineral surfaces: an overview. In Mineral Surfaces, (ed. DJ
Vaughan, RAD Pattrick), Chapman and Hall, New York 1–16 (1995).
Wauchope, R.D., Yeh, S., Linders, B.H.J., Kolskowski, R., Tanaka, K., Rubin, B.,
Katayama, A., Kördel, W., Gerstel, Z., Lane, M., Unsworth, J.B. Pesticide soil
sorption parameters: theory, measurement, uses, limitations and reliability.
Pest Management Science, 58, 419-445 (2002).
Weiner, S., and Addadi, L. Design strategies in mineralized biological materials. J.
Mater. Chem., 7, 689–702 (1997).
33
Weiner, S. and Dove, P. An overview of biomineralization processes and the
problem of the vital effect. Rev. Miner., eds Weiner and Dove, MSA, 54, 1-24.
(2003)
Wright, K., Cygan, R.T., Slater, B. Structure of the (10-14) surfaces of calcite,
dolomite, and magnesite under wet and dry conditions. Phys. Chem. Chem.
Phys., 3, 839–844 (2001).
Yoreo, J.J. and Vekilov, P.G. Principles of nucleation and growth. Rev. Miner., eds
Weiner and Dove, MSA. 54, 57-90 (2003)
Zabinsky, W. The problem of stacking-order in natural hydrozincite. Can. Mineral.,
8, 649-652 (1966).
Zhang, Z., Fenter, P., Cheng, L., Sturchio, N.C., Bedzyk, M.J., Machesky, M.L.,
Wesolowski, D.J. Model-independent X-ray imaging of adsorbed cations at the
crystal-water interface. Surf. Sci., 554, 95–100 (2004).
Zuddas, P. and Podda, F. Variations in physico-chemical properties of water
associated with bio-precipitation of hydrozincite [Zn5(CO3)2(OH)6] in the waters
of Rio Naracauli, Sardinia (Italy). Appl. Geochem., 20, 507-517. (2005).

34

35
Chapter II Materials and experimental
procedures
2.1 The samples object of the study
Natural hydrozincite
The sample labeled with the name Nar is a natural sample from Rio Naracauli. The
Rio Naracauli flows in a 30.2 km2 basin west of the Ingurtosu mine in the Arburese
mine district in southwestern Sardinia (Fig. 2.1). The river is about 8.2 km long and
flows into the western Mediterranean Sea. The Rio Naracauli has a very limited
flow, particularly in the upper part. Upstream it receives drainage
from mine tailings
on the left, and downstream it receives drainage from three adits: the Rio Pitzinurri
(outlet A), the Ledoux mine gallery (outlet B), and the Rio Bau (outlet C). The
hydrogeological details of this area have been reported by Pala et al. (1996).
A
series of stations (stations 1 to 11 in the creek and stations A to C in the three
tributaries) were chosen along 3.4 km of the Rio Naracauli (Fig. 2.1). Station 1 was
located at the tailings pond. In stations 2 to 4, a photosynthetic microbial
population
visibly encrusted the sediments with a green mat in spring, which developed into
white material, particularly at stations 3 and 4. This is an annual event that varies in
intensity depending on the meteorological conditions. The white precipitate is then
mechanically transported away by rainfalls. Stations 5 to 7 were located after the
Rio Pitzinurri tributary. In the sediments of these stations white precipitate residues
were still visible. Stations 8 to 10 were located after the Ledoux gallery. Station
11 was located downstream from the Rio Bau tributary, where white deposits were
not observed. The Nar sample was collected between the station 2 and 4 dried at
room temperature and cleaned by the visible impurities.

36
Figure 2.1 Schematic map of the sampling area, with tailings distribution (hatched
areas). Samples 1 to 11 ( ) are from the Rio Naracauli stream; samples A to C were collected in the tributaries before the inflows.
Geological hydrozincites
We have investigated two geological samples of hydrozincite kindly provided to us
by the Mineral Museum of the Earth Science Department of the University of
Cagliari. Both samples come from mining districts of Sardinia, Geol1 from
Malfidano mine and Geol2 from Sa Duchessa mine.
The mining district of southwest Sardinia, Italy, is one of the classic areas where
primary carbonate-hosted Zn-Pb sulfide ores are associated with a relatively thick
secondary oxidation zone containing Zn (hydroxy-)carbonates and silicates, the so-
called "calamine," exploited until the 1970s. The extent of the capping
oxidized ore
zones, reaching deep below the surface, is generally independent of the present-
day water table. The base of the oxidation profile containing nonsulfide Zn minerals
in various uplifted blocks in the Iglesiente area can be either elevated above or

37
submerged below the recent water table. The genesis of the ores is therefore
considered to be related to fossil, locally reactivated, oxidation phenomena. The
mineralogy of the nonsulfide mineralization is generally complex and consists
of
smithsonite, hydrozincite, and hemimorphite as the main economic minerals,
accompanied by iron and manganese oxy-hydroxides and residual clays. These
geological samples are more than million years old (Boni et al., 2003).
Hydrozincite synthesis
Hy1 – the sample was synthesized according to the protocol of Garcia-Clavel
(1989) for the preparation of binary carbonate. The sample has been made by fast
precipitation at 373 K mixing equal amounts of a 32 mM (NH4)2CO3 (Aldrich)
solution and a 80 mM Zn(NO3)2·6H2O (Aldrich) solution. The precipitate obtained
was filtered, washed with cold distilled water and dried at room temperature.
Hy2 – the sample was synthesized according to the protocol of Paquette and
Reeder (1995) at 298 K. One liter of a 50 mM Zn(NO3)2·6H2O (Carlo Erba
Reagents) and 280 mM NH4Cl (Carlo Erba Reagent) solution was placed into a
closed reactor. The reactor was in communication with a vial containing (NH4)2CO3
(Aldrich) as a fine powder. The slow decomposition of this salt releases NH3 and
CO2 to the solution. During the next 15 days hydrozincite began to precipitate at
the water–vapour interface. The solution pH, initially was slightly acid (4.9-5.2) and
the final pH was 7. The precipitate obtained was filtered, washed with deionizzed
water and dried at room temperature.
Hy3 – the sample has been make at 298 K by mixing of 0.2 mM of NaHCO3(Carlo
Erba Reagent 99,9%), 3 mM of Na2CO3 (Aldrich) and 3 mM of ZnSO4*7H2O

38
(Aldrich) into deionized water, subsequently acidified by using HCl to adjust the
initial pH at 6.7. The concentration of zinc was determined considering the
concentration of Zn2+
in the natural water of Naracauli Creek during the
hydrozincite bioprecipitation (Podda et al., 2000). The solution stirred throughout
the synthesis in a glass baker was continually bubbled with air through glass tubing
connect with an aquarium pump. After 15 days the solution was filtered and the
precipitate rinsed several times with deionized water and then dried at room
temperature.
Hy4 – the sample has been make at 298 K by mixing of 0.2 mM of NaHCO3(Carlo
Erba Reagent 99,9%), 3 mM of Na2CO3 (Aldrich) and 3 mM of ZnSO4*7H2O
(Aldrich) into deionized water, subsequently acidified by using HCl to adjust the
initial pH at 6.7. The concentration of zinc was determined considering the
concentration of Zn2+
in the natural water of Naracauli Creek during the
hydrozincite bioprecipitation (Podda et al., 2000). The solution stirred throughout
the synthesis in a glass baker was continually bubbled with air through plastic
tubing connect with an aquarium pump. After 15 days the solution was filtered and
the precipitate rinsed several times with deionized water and then dried at room
temperature. A portion of sample has been subsequently washed with 1 ml of
acetone (Aldrich) which was then separate from the solid; this washing procedure
was repeated three times. The name of washed sample is Hy4/1.
Hy5 – the sample has been making as described for the sample Hy3 but adding
slices of flexible tube in PVC (Tygon) at the bottom of reaction glass baker. A
portion of sample has been subsequently washed with 1 ml of acetone (Aldrich)
which was then separate from the solid; this washing procedure was repeated
three times. The name of washed sample is Hy5/1.

39
Hy3-MIXDEHP – 300mg of hydrozincite Hy3 has been mixed with various
quantities of pure Bis(2-ethylexyl)phthalate (Aldrich, 99%) as reported in the Table
2.1. A portion of each mixing samples has been subsequently washed with 1 ml of
acetone (Aldrich) which was then separate from the solid; this washing procedure
was repeated three times for each mixing samples.
Sample HY3 (mg) DEHP (µl) Sample washed
Hy3-25DEHP 300 25 Hy3-25DEHP/1
Hy3-50DEHP 300 50 Hy3-50DEHP/1
Hy3-100DEHP 300 100 Hy3-100DEHP/1
Hy3-200DEHP 300 200 Hy3-200DEHP/1
Hy3-400DEHP 300 400 Hy3-400DEHP/1
Table 2.1 Summary of conditions for preparation of mixed samples.
Calcite synthesis
Cal1 – the sample was synthesized according to the protocol of Paquette and
Reeder (1995) at 298 K. In this method the solid ammonium carbonate sublimates,
and product NH3 and CO2 gases diffuse into an aqueous solution of calcium and
ammonium chloride. 200 mM of CaCl2*6H2O (Aldrich) was adding to 300 mM of
NH4Cl (Aldrich) in 1 l of deionizzed water. The glass baker contain the aqueous
solution was placed inside a closed container in the presence of ammonium
carbonate, so that creates a rich atmosphere of NH3 and CO2 that diffuses into the
aqueous solution. The solution pH, initially slightly acid (4.9-5.2), during the next 15
days, the calcite crystals nucleated at the surface of the solution. The final pH was

40
7. The precipitate obtained was filtered, washed with demonized water and dried at
room temperature.
Cal2 – the sample has been making following the protocol for Cal1, but in this case
the sliced out flexible pipes were added at the bottom of the reaction system.
Cal1-100DEHP – 300mg of calcite Cal1 has been mixed with 100µl pure Bis(2-
ethylexyl)phthalate (Aldrich, 99%). A portion of each mixing sample has been
subsequently washed with 1 ml of acetone (Aldrich) which was then separate from
the solid; this washing procedure was repeated three times for each mixing
samples. The name of washed sample is Cal1-100DEHP/1.
2.2 Extractions
Extraction of bis(2-ethylexyl)phthalate in synthetic
hydrozincite
Powder synthetic hydrozincite was soaked in chloroform at 40°C for 12 h, after this
time, the mixture was filtered. The mixture contains extract and chloroform was
evaporated in a rotary evaporator.
Extraction insoluble organic matrix in biomineral sample
The powder sample was immersed in 5 ml of distilled water, then decalcified by
progressive addition of 50% acetic acid to maintain the pH above 4. The entire
extract was centrifuge ad 4500 xg for 15 min, which separated the supernatant
(SOM: soluble organic matrix) and precipitated (IOM: insoluble organic matrix)

41
fractions. The insoluble fraction was desalted by successive centrifugation in
distilled water, and lyophilized.
Extraction of lipidic fraction in biomineral sample
Powder sample was soaked in warm chloroform/methanol (1:1v/v) for three days,
under a mild and constant stirring, and sonicated every day.the mixture was then
centrifugated at 4500 xg for 15 min to separate the powder and insoluble parts
from the solvent –soluble part.
2.3 Techniques - structural characterization
X-Ray diffraction
XRD was performed with a θ-2θ conventional diffractometer (Siemens D-500) with
Mo Kα radiation (0.709 Å) and with θ-2θ conventional diffractometer (Seifert
X3000) with Cu Kα radiation (1.5418 Å). For XRD analysis, 200 mg of each sample
were lightly ground in agate mortar and was packed into the sample holder for X-
Ray diffraction analysis, for the Seifert diffractometer the sample was packed into
zero-background sample holder.
The particle size of sample was estimate from the full-width at half maximum
(FWHM) of most intense peak according to the Debye-Scherrer formula. The
exactly FWHM and peak position was obtained by a non linear fitting of the XRD
spectra with Log Normal function using Origin 5.0 program from Microcal Software.

42
Infrared Spectroscopy
Fourier transform Infrared (FT-IR) spectra were collected in the Mid region from
400 cm-1
to 4000 cm-1
at 4 cm-1
resolution over 64 averaged scans using a Bruker
Equinox 55 spectrophotometer. For FT-IR analysis of solids, 10 mg of solid sample
was ground in an agate mortar with 30 mg of KBr and pressed; liquid samples were
analyzed adding a drop of liquid between two KBr windows.
Nuclear Magnetic Resonance
High-resolution NMR spectra were collected using a Varian Unity Inova
spectrometer with a 9.39 T wide-bore Oxford magnet operating at a proton
frequency of 399.952 MHz. Solid state analysis was performed using solid state 4
mm probe solid state; liquid samples were analyzed in a 5 mm indirect, PFG (15N-
31P) and VT probe.
13C Magic Angle Spinning (MAS) experiments for solids were performed packing
using ~ 100 mg of sample lightly ground in agate mortar and packed into a 4 mm
Si3N4 rotors, 7 kHz spin rate, recycle time 1, 5, 100, 700 and 1200 s, 7.5 µs pulse
length (90°) and 50 kHz spectral window.
13C Cross Polarization Magic Angle Spinning (CPMAS) spectra were collected with
contact times of 0.3, 1, 2, 4, 8 and 16 ms, and a recycle time of 2 s. 13
C chemical
shifts were referenced externally to hexamethylbenzene (CH3 = 17.4 ppm).
The species distributions in 13
C CPMAS experiments were obtained by a non linear
fitting of the NMR signals to individual Gaussian by means of the Origin 5.0

43
program from Microcal Software, in the fitting procedure, the position, line width,
and intensity were varied to find the best fit curve to the experimental spectrum.
1H experiments were carried out with the sample contained in a 5 mm tube using 7
μs pulse (90°), 2 s repetition time, and spectral width of 4 kHz. The NMR
experiments used for proton resonance assignments also included magnitude
Correlation Spectroscopy (COSY) (Aue et al., 1976).
13C spectra were recorded at the frequency of 100.564 MHz using a spectral width
of 20 kHz and 90° pulse. 13
C assignments were made from Heteronuclear Multiple
Bond Coherence (HMBC) (Wilker et al., 1993) and Heteronuclear Single Quantum
Coherence (HSQC) (Kay et al., 1992) spectra. Chemical shifts in all spectra were
referenced to DSS (2,2-dimethyl-2-silapentane-5-sulfonate).
The concentration of phthalate in hydrozincite synthesis has been calculates using
the Internal Standard Method. To obtain the absolute concentration of our
compound in the NMR sample, the area of the signals have been compared to the
area of a reference (pure methanol, Aldrich 99,99%) with known concentration.
HR-Trasmission Electron Microscopy
HRTEM images were collected using JEM 2010UHR (Jeol) microscope with a
LAB6 thermoionic source operating at 200kV and equipped with a Gatan imaging
filer (GIF). Energy-filtered images were acquired using 3 mm GIF entrance
aperture and a slit width of 15 eV. All high-resolution images were acquired digitally
using 1 or 2 sec of exposure and 1x binning (1024 x 1024 pixels) of the charge-
coupled-device (CCD) camera.

44
The samples were lightly ground in an agata mortar and were disperse in octane
(or distilled water) and further submitted to an ultrasonic bath. The suspensions
were then dropped on carbon coated copper grids for high-resolution transmission
electron microscopy. A fast Fourier transform (FFT) was calculated on the images
by using the Digital Micrograph (JEOL) software. Because of the ~19x
magnification between the TEM viewing screen and the CCD camera, a preliminary
calibration using a standard gold sample was performed to obtain corrected values
of d-spacing in the samples.
Scanning Electron Microscopy
Surface morphological analyses were investigated with an environmental scanning
electron microscope (ESEM QUANTA 200, FEI, Hillsboro, Oregon) (SEM) working
at 25 kV electron accelerating voltage. The samples were prepared by mounting
onto aluminium stubs and carbon-coated with a layer about 10 nm thick by using
metal-coating plant under a vacuum of 0.01 Pa (10-4
Torr).
2.4 Analytical analysis
The major elemental concentrations were determined by inductively plasma atomic
emission spectrometry (ICP-AES; FISION-ARL3520).
Carbon and nitrogen content were obtained by using FIsion Instruments 1108
CHNS (T = 1000°C) elemental analyzer.
Other trace elemental concentrations were determined by inductively-coupled
plasma-mass spectrometry (ICP-MS; Perkin-Elmer; ELAN 5000).

45
2.5 References
Aue, W., Bartholdi, E. and Ernst, R. R. Two‐dimensional spectroscopy. Application
to nuclear magnetic resonance J. Chem. Phys., 64, 2229-2247 (1976).
Boni, M., Gilg, H.A., Aversa, ., and Balassone, . The “calamine” of southwest
Sardinia: Geology, mineralogy and stable isotope geochemistry of supergene
Zn mineralization products. Economic Geology, 98, 731-748 (2003).
Garcia-Clavel, M., Martinez-Lope, M.J.,and Casais-Alvarez, M.T. thermoanalytical
study of the system Pb2+-Zn2+ coprecipitated as binary carbonates.
Thermochim. Acta, 137, 177-187 (1989).
Kay, L.E., Keifer, P. and Saarinen, T. Pure absorption gradient enhanced
heteronuclear single quantum correlation spectroscopy with improved
sensitivity. J. Am. Chem. Soc., 114, 10663–10664 (1992).
Pala, A., Costamagna, L. G., and Muscas, A. Valutazione delle riserve idriche nei
bacini dei Rii Piscinas e Naracauli (Sardegna Meridionale). Boll. Soc. Geol. Ital.
115, 717-735 (1996).
Paquette, J., and Reeder, R.J. Relation hip between surface structure, growth
mechanism, and trace element incorporation in calcite. Geoch. et Cosmoch.
Acta, 59, 735- 749 (1995).
Podda, F., Zuddas, P., Minacci, A., Pepi, M., Baldi, F. Heavy Metal Coprecipitation
with Hydrozincite [Zn5 (CO3)2(OH) 6] from Mine Waters Caused by
Photosynthetic Microorganisms. Appl. Environ. Microbiol. , 66, 5092–5098
(2000).
Music, S., Popovic, S., Maljkovic,M., Dragcevic, D. Influence of synthesis on the
formation and properties of zinc oxide. J. Alloys and Comp., 347,324-332
(2002).

46
Willker, W., Leibfritz, D., Kerssebaum, R., Bermel, W. Gradient selection in
selection in inverse heteronuclear correlation spectroscopy. Magn. Reson.
Chem., 31, 287–292 (1993).

47
Chapter III High Resolution Solid-State 13C Nuclear Magnetic
Resonance Spectroscopy
3.1 Introduction
The utilization of Nuclear Magnetic Resonance (NMR) techniques for the structural
characterization has a very long tradition (Kogel-Knabner, 1997; Wilson et al.,
1981). The advent of modern solid-state NMR spectrometers, which are capable of
producing liquid-like spectra, ushered in a new era of organic matter
characterization. A major attraction of this technique is the fact that samples can be
analyzed often times without any prior pretreatment, thus rendering solid state
NMR a non-destructive approach to characterization without the production of
artifacts.
Although solid-state NMR spectroscopy has these added advantages, several
disadvantages do exist. Larger quantities of material are needed to perform NMR
in the solid-state (~ 70-200 mg). Already an insensitive technique, solid-state NMR
gives very low and broad signals such that much more accumulation time is
needed to obtain spectra with reasonable S/N ratios. Despite these limitations,
several techniques have been developed to overcome these shortcomings,
principally cross-polarization with magic angle spinning (CPMAS) and high power
proton decoupling (HPDEC). The theory of NMR has been widely reported and the
following discussion will be adopted from several sources (Hays, 1982; Schaefer et
al., 1975).
13C is the most common nucleus studied in geochemical materials and the focus of
this dissertation, although a variety of other nuclei such as 15
N and 31
P are
available for investigation. Since NMR is considered an insensitive technique, the

48
concentration of the particular element under study in the sample, as well as its
natural abundance, is of importance. Also, characteristics of the nuclei of interest
are critical such as the gyromagnetic ratio, γ, where nuclei with small values are
much more difficult to detect because they have small nuclear dipole moments.
3.2 Magic Angle Spinning
One of the problems encountered in solid-state NMR spectroscopy is that of
chemical shift anisotropy (CSA). It has been shown (Wilson, 1987) that the
chemical shift observed in the solid state can be expressed as:
σobs = 3/2σisosin2θ + 1/2(3cos
2θ -1) Σpσpcos
2p
where p are the angles of the nuclei axes of rotation to the principal axes and σp
are the various chemical shift tensors. Since chemical shift is a tensor, there are
three chemical shift components (x,y,z planes), which in most cases are not
identical. Upon performing NMR on static samples where all possible orientations
of these tensors exist, powder patterns are produced which are associated with
broad resonances due to this anisotropy.
In order to remove CSA, the sample is spun at the magic angle of 54.7° relative to
the external magnetic field Bo (z axis) (Schaefer and Stejskal, 1976; Schaefer and
Stejskal, 1977). The effect on the chemical shift can be understood mathematically
that if θ = 54.7°, we recognize that 3cos2(54.7)-1 is equal to zero.
Then σobs = σiso. σiso is the isotropic chemical shift characterized by sharp
resonances which are naturally obtained in solution-state NMR where molecular
tumbling allows for these orientational effects on chemical shifts to be averaged.

49
Therefore, MAS mimics this molecular motion and allows liquid-like spectra to be
obtained on solid samples.
Since the chemical shift of a particular 13
C environment is dependent on the
orientation of the parent molecule with respect to the external magnetic field, the
MAS rate must have a greater frequency than the frequency range of the chemical
shift in the static powder sample. If this is not the case, several spinning sidebands
will be observed in addition to a sharp central peak for a particular chemical shift.
These sidebands are located on both sides of the center signal at integral multiples
of the MAS rate and extend over the entire frequency rage of the chemical shift in
the static solid state spectrum.
3.3 High Power Proton Decupling
High power proton decoupling (HPDEC) (Bloch, 1958), in conjunction with magic
angle spinning, removes 13
C-1H dipolar interactions. These same interactions,
which allow for efficient cross-polarization, also cause severe broadening in solid-
state spectra due to the 99% abundance of the 1H nucleus. As the
13C nucleus is
rare, almost all of this broadening arises from interaction with neighboring protons.
Proton decoupling in solution-state NMR is a familiar technique, but the application
to solids requires much greater power (100W vs. 10W or less) because the 13
C-1H
interaction is much stronger. HPDEC is achieved by applying continuous high
power at frequencies comparable to the proton line widths, usually tens to
hundreds of kHz (Schaefer et al. 1975), for the whole duration of 13
C data
acquisition. 13
C-1H dipolar interactions result from the through space interaction
between 13
C and 1H magnetic dipoles. This interaction modifies the
13C spectrum
because 1H dipoles change the effective Bo at the
13C nucleus by adding to it (
1H
dipoles align with Bo) or by subtracting from it (1H dipoles align against Bo). The

50
magnitude of the interaction is dependent on the distance between carbons and
protons and on their orientation with respect to Bo. The dipolar interactions spread
a particular
13C NMR frequency over a wide range in the solid-state
13C NMR spectrum.
HPDEC effectively flips the 1H dipoles rapidly, aligning them with and against Bo,
thus averaging the dipolar 13
C-1H interaction. The frequency range of carbon
functional groups, which experience dipolar interactions, now spans a smaller
range, and thus narrower resonances can be observed.
3.4 Cross-Polarization
Cross-polarization allows the low natural abundance of the 13
C nucleus to be
overcome in a way far superior to DP-MAS (Direct Polarization). Unlike solution
state NMR, proton NMR in the solid-state of these materials gives broad,
featureless signals due to very strong 1H-
1H dipolar interactions (Sullivan and
Maciel, 1982). The cartesian coordinate representation for a typical CPMAS
experiment is seen in Figure 3.1. When proton nuclei are placed in a magnetic
field, the magnetic dipoles of these nuclei align themselves with (low energy) or
against (high energy) the magnetic field, Bo, according to the Boltzmann
distribution. However, as more nuclei align themselves in the low energy
configuration, a net magnetization, MoH, develops along the z axis. A 90° proton
radiofrequency (rf) pulse is then applied along x’, after which each M1H (proton
magnetization) points along y’.

51
Figure 3.1 Cross-Polarization scheme showing magnetization vectors during a
CPMAS experiment: (a) proton magnetization along +z’ axis at equilibrium (b) magnetization tipped along y’ after 90° pulse along x’ from (a) (c) spin-locking of proton magnetization along y’.
An rf proton spin lock with magnitude B1H is immediately applied along y’ such that
the magnetization M1H is now forced to rotate (locked) about y’ with a frequency
given by:
ν1ρH = γHB1H/2π
where γH is the gyromagnetic ratio of the protons. Without the presence of B1H,
each M1H would spread out in the x’y’ plane (1H NMR plane) because each M1H
corresponds to a different 1H NMR frequency and each M1H starts to move out of
the x’y’ plane because of spin-lattice (T1) relaxation. If B1H is left on indefinitely, the
magnitude of each M1H will gradually decrease because of spin-lattice relaxation in
the rotating frame (T1ρ) as well.
In the cross-polarization experiment, a 13
C spin lock with magnitude B1C is applied
simultaneously along the x’’y’’ plane (13
C NMR plane). If the magnitude of B1C is
adjusted to a matching condition known as Hartmann-Hahn (Hartmann and Hahn,
1962) given by:

52
γHB1H = γCB1C
where γH and γC are the gyromagnetic ratio of proton and carbon, respectively, and
B1H and B1C represent the spin locking rf of protons and carbons, respectively, then
a rapid transfer of magnetization between 1H and
13C can occur. Since at the start
of the 1H and
13C spin locks, M1H equals MoH (proton magnetization along z axis
before 90o
pulse) and M1C equals zero, magnetization is transferred from 1H to
13C
nuclei. 13
C dipoles that initially contributed towards MoC are forced to re-orient
themselves in a non-zero M1C component at the expense of the 1
H dipoles that
contributed towards M1H. This magnetization transfer is known as cross-
polarization (Pines et al., 1973) and is defined by a time constant TCH.
The time duration of the matched spin locks is termed the contact time. At the end
of the contact time, the spin locks are turned off and the 13
C M1 components are
detected in the presence of high power proton decoupling. For CP from 1H to
13C
with the matching condition met, the signal intensity of each 13
C spectral
component, M1C, as a function of the contact time, t, is given by:
M1C (t) = (MoCγH/γC)/(1-TCH/T1ρH)[exp(-t/ T1ρH)-exp(-t/TCH)]
where MoC is the magnitude of the equilibrium magnetization of each 13
C species in
Bo (external magnetic field) and is directly proportional to the concentration of each
13C species in the sample and T1ρH is the proton spin lattice relaxation in the
rotating frame.
The CPMAS NMR experiment has many advantages over DPMAS. With CPMAS,
a signal enhancement of up to four is possible given the gyromagnetic ratios of
proton and carbon (γH/γC = 4). Furthermore, the recycle delay necessary between

53
experiments (5~T1H) is dictated by the longest 1H T1 in the sample rather than the
longest 13
C T1 as is the case for DP-MAS. Usually, T1H <<< T1C. Thus, more
CPMAS experiments can be performed in a given time and the overall signal gain
will be enhanced over DP-MAS. However, in order for the CP process to be
successful, TCH << t (contact time) << T1ρH for all 13
C species present in the
sample. Thus, cross-polarization is a competing process of M1C growth based on
TCH and M1C decay based on T1ρH.
Given the heterogeneous nature of geochemical materials, which give rise to broad
NMR signals, a variety of TCH values are expected to exist. TCH depends on various
factors including the nature of lattice motions in the sample, the spinning rate of the
sample, which is especially true for non-protonated carbon nuclei, and the
exactness of the Hartmann-Hahn match (Alemany et al., 1983). This cross-
polarization rate is dependent not only on the number of bonded protons, but also
has a rCH (Wershaw, 1993) dependence (i.e. the distance between carbon and
protons both inter- and intra-molecularly). Hence, non-protonated carbons polarize
at a much slower rate than protonated carbons. Also, carbons which possess some
mobility cross-polarize much slower due to attenuations in 13
C-1H and
1H-
1H dipolar
interactions. For these circumstances, longer c are required to fully achieve cross-
polarization at the expense of rigid, protonated carbon signals. Consequently, TCH
values go as:
non-protonated C > mobile CH3 > protonated aromatic C, CH > CH2 > static CH3
TCH values are constant for all spectrometers since dipolar interactions are
independent of the external magnetic field provided that an exact Hartmann –
Hahn match exists and the same MAS rates are used. If MAS rates were
increased, an expected increase in TCH would likely result. Carbon nuclei of low or
remote protonation experience a much weaker 13
C-1H dipolar interaction, and thus,
TCH may be long such that these carbon nuclei may not cross-polarize as efficiently

54
as protonated carbons. This results in intensity distortions and quantitation
problems. Inefficient proton spin diffusion processes in proton-dilute samples also
create difficulties in the effectiveness and linearity of the CP process by causing a
decrease in 13
C-1H Hartmann-Hahn matches if long enough recycle delays are not
employed (Alemany et al., 1983). Also, intermolecular interactions may be
comparable or even longer than intramolecular interactions for carbons separated
from protons by three bonds or more causing poor cross-polarization which
requires long contact times.
3.5 Relaxation Phenomena
Like other spectroscopic techniques, solid-state NMR involves transitions between
energy states. In NMR, a radiofrequency 90° pulse is applied to perturb
magnetization away from an equilibrium position (along z axis with Bo), and the
decay back to this position can then be followed to give the NMR spin dynamics of
the sample.
These spin dynamics give insights into structural properties of the sample such as
its rigidity/mobility or crystalline/amorphous nature. These relaxation parameters
can also give clues into environmental processes such as sorption of organic
chemicals and metal binding to the macromolecules, minerals, soils or others. Spin
dynamics are also useful in their own right as guidelines to optimize the CPMAS
experiment.
3.5.1 Transverse relaxation (T2)
Upon excitation of 13
C or 1H nuclei, these nuclei may exchange energy with
neighboring nuclei of the same kind in order to return to equilibrium along z. In

55
effect, a mutual flipping of the spins of the interacting nuclei results which is
termed spin-spin or transverse relaxation (T2). This phenomenon occurs only
between identical nuclei such that the Mx and My (magnetization in the xy plane)
components of the total M magnetization are reduced with a time constant T2
according to:
Mtx,y
= Moe-t/T2
where Mtx,y
is the x and y components of the total magnetization, Mo is the
equilibrium magnetization and t is a time unit. The rate of spin-spin relaxation is
related to the line width at half height, ν1/2. However, due to imperfect magnetic
field homogeneity, different regions of the sample experience slightly different
frequencies, and thus shorter T2 values. Thus,
ν1/2 = 1/πT2 + γΔBo/2π
where γΔBo/2π describes this magnetic field inhomogeneity.
3.5.2 Transverse relaxation (T1)
In addition to energy exchange with neighboring nuclei, energy exchange may also
occur with the surroundings, or lattice. When a group of nuclei is placed in a
magnetic field, Bo, a small equilibrium magnetization develops along the direction
of Bo (z axis) given by the Boltzmann distribution. The rate at which Mz
(magnetization in the z axis) approaches Mo (equilibrium magnetization) can be
described as:

56
Mo-Mz = Ce-t/T1
where C represents the degree of equilibrium attained by the magnetization at
time, t, and T1 (spin–lattice relaxation), the rate at which the nuclei can transfer
energy to the lattice. T1 measurements depend on the medium in which the
measurement is made. Spin-lattice relaxation for solids is much longer (up to days)
than for liquids (10-2
to 102 s).
Conversely, T2 values are generally much shorter than T1, in any medium. A
related relaxation rate is the spin-lattice relaxation rate in the rotating frame, T1ρ.
This time constant characterizes the decay of Mo in an applied field, B1, which is
much smaller than Bo. After a 90° pulse and spin locking, as discussed in the
cross- polarization section of this text, B1 is turned off and the magnetization along
y is allowed to decay. This decay is described by:
Mt = Moe-t/T1ρ
and given as being in the rotating frame because the effective field is now B1 and
not Bo.

57
3.6 References
Alemany, L. B., Grant, D. M., Pugmire, R. J., Alger, T. D., Zilm, K. W. J. Cross
polarization and magic angle sample spinning NMR spectra of model organic
compounds. 1. Highly protonated molecules. J. Am. Chem. Soc., 105, 2133-
2141 (1983).
Alemany, L. B., Grant, D. M., Pugmire, R. J., Alger, T. D., Zilm, K. W. Cross
polarization and magic angle sample spinning NMR spectra of model organic
compounds. 2. Molecules of low or remote protonation. J. Am. Chem. Soc.,
105, 2142-2147 (1983).
Bloch, F. Theory of Line Narrowing by Double-Frequency Irradiation. Phys. Rev.,
111, 841-853 (1958).
Hays, G. R. High-resolution carbon-13 solid-state nuclear magnetic resonance
spectroscopy. Analyst, 107, 241-252 (1982).
Hartmann, S. R., and Hahn, E. L. Nuclear Double Resonance in the Rotating
Frame Phys. Rev., 128, 2042-2050 (1962).
Kogel-Knabner, I. 13
C and 15
N NMR spectroscopy as a tool in soil organic matter
studies. Geoderma, 80, 243-270 (1997).
Pines, A., Gibby, M. G., Waugh, J. S. Proton‐enhanced NMR of dilute spins in
solids. J. Chem Phys., 59, 569-590 (1973).
Schaefer, J., Stejskal, E. O., Buchdahl, R. High-Resolution Carbon-13 Nuclear
Magnetic Resonance Study of Some Solid, Glassy Polymers. Macromolecules,
8, 291-296 (1975).
Schaefer, J., and Stejskal, E. O. Susceptibility studies of laccase and
oxyhemocyanin using an ultrasensitive magnetometer. Antiferromagnetic
behavior of the type 3 copper in Rhus laccase. J. Am. Chem. So. , 98, 1031-
1032 (1976).

58
Schaefer, J., Stejskal, E. O., Buchdahl, R. Magic-Angle 13
C NMR Analysis of
Motion in Solid Glassy Polymers. Macromolecules, 1977, 10, 384-405.
Sullivan, M. J., and Maciel, G. E. Spin dynamics in the carbon-13 nuclear magnetic
resonance spectrometric analysis of coal by cross polarization and magic-angle
spinning. Anal. Chem., 54, 1615-1623 (1982).
Wershaw, R. Model for Humus in Soils and Sediments. Environ. Sci. Technol., 27,
814-816 (1993).
Wilson, M. A., Pugmire, R. J., Zilm, K. W., Goh, K. M., Heng, S., Grant, D. M.
Cross-polarization 13
C-NMR spectroscopy with 'magic angle' spinning
characterizes organic matter in whole soils. Nature, 294, 648-650 (1981).
Wilson, M. A. NMR Techniques and Applications in Geochemistry and Soil
Chemistry; Pergamon Press: New York (1987).

59
Chapter IV Structural and morphological
properties of hydrozincite minerals
4.1 X-Ray Diffraction measurement
The crystal structure of hydrozincite was first studied in a geological sample by
using single crystal X-ray diffraction (Ghose, 1964). The Figure 4.1 shows some of
collected XRD patterns.
Figure 4.1 XRD patterns of geological (Geol1 and Geol2), synthetic (Hy1, Hy2 and
Hy3), and biomineral (Nar) samples. All the patterns are in agreement with expected hydrozincite diffraction pattern.
5 10 15 20 25 30 35
2 theta
Geol1
Geol2
Hy1
Hy2
Nar
Hy3
(200
)
(31
0)
(02
0)
(02
1)
(51
0)

60
All observe Bragg reflection can be indexed as a hydrozincite single phase with a
monocline structure, according to experimental (PDF Card 19-1458) and calculated
(PDF 72-1100) references patterns. The XRD patterns confirm the presence of
only hydrozincite phase in the samples.
The I100 peak appears at 2θ~6° correspond to the (200) hydrozincite main
reflection. For the geological samples, the relative peak intensity for the (200) peak
is much higher than reported for the monocline structure in the references cards.
This can be explained as a preferred orientation, in fact the preferred orientation
can create a systematic variation in diffraction peak intensity, this information is in
aggrement with the {100} crystallographic form, as observed also by SEM (Fig. 4.3
a and b), at least for the Geol1 and Geol2 samples.
The diffraction spectra for the Geol1 and Geol2 samples present peaks diffraction
well defined, while peaks from the synthesized samples clearly show peak
broadening, and the largest peak broadening for the biomineral sample (Nar). The
broadening of the signals suggests a progressive decrease in the size of crystal-
coherent domains.
If the crystallite smaller than 120 nm the diffraction spectra present broad
diffraction peak, in this case is possible to estimate the crystallite size by the full-
width at the half maximum (FWHM) of the most intense peak, according with the
Debye-Scherrer formula:
where K is the shape factor, λ is the x-ray wavelength, for Å, β is the line
broadening at half the maximum intensity (FWHM) in radians, and θ is the Bragg
angle (Scherrer, 1918; Patterson, 1939).The fitting of XRD spectra has been made
cos2
KB

61
by Origin 5.0 program from Microcal Software, for each collected diffraction spectra
the dimension has been calculated by fitting of the main reflections.
The averages sized calculated on the main reflection were ~21 nm for Geol1, ~19
nm for Geol2, ~14 nm for Hy2, ~10 nm for Hy1, ~9 nm for Hy3 and ~7 nm for Nar.
Thus, the progressive decrease in the size of crystal coherent domains should be
dependent on the structural evolution of the minerals and/or on the crystallinzation
process. Specifically, the persistence of the nanocrystals should be explained
according to the mechanism on an imperfect oriented aggregation of nanoparticles
(Meldrum and Cölfen, 2007).
4.2 Infrared Spectroscopy investigation
Infrared spectroscopy is usually applied in the investigation of both inorganic and
organic materials (Hasse et al., 2000; Wang et al., 2003). It allows the identification
of characteristic functional groups in molecules that correspond to specific
molecular vibrations (Conley, 1966). In addition, sampling is easy and requires a
small amount of materials (about 1 mg). FT-IR has also been applied for comparing
the organic composition of different molluscan shells (Dauphin, 1999; Dauphin et
al., 2008). The main features of all FT-IR spectra in the range 400 – 1800 cm-1
are
shown in the Figure 4.2.

62
Figure 4.2 FT IR spectrum for geological samples (Geol1 and Geol2), synthetic
samples (Hy1, Hy2 and Hy3), and biomineral sample (Nar).
The carbonate vibrational stretching and bending of hydrozincite are attributed in
comparison with the literature attributions (Music’ et al., 2002), and the main peaks
are shown in Table 4.1. For comparison the IR peaks of carbonate groups taken
from (Music’ et al., 2002) are show in the Table 4.1. The four peaks in the region
1520–1390 cm−1
are ascribed to the asymmetric CO32-
stretching ν3 mode (the
correlation field splitting is well observed in the spectrum). The peak at 1047 cm-1
is
assigned to the ν1 symmetric CO32-
stretching mode. The strong and sharp peaks
at 836 cm−1
is assigned to ν2 out-of-plane OCO bending mode and that at 709
cm−1
is assigned to ν4 asymmetric OCO bending mode. All the samples show
bands in the range 2900-3600 cm-1
which can be ascribed to the water molecules
and to the OH stretching modes. Both museum samples exhibit in the 2900-3600
5001000150020002500300035004000
Geol1
Geol2
Hy1
Hy2
Nar
Hy3
wave number (cm-1
)

63
cm-1
region a broad signal with on the top three peaks observed at 3235, 3298,
3382 cm-1
in Geol1 and at 3235, 3301, 3379 cm-1
in Geol2.
Mode Z4a Geol1 Geol2 Hy1 Hy2 Hy3 Nar
v1 1047 1047 1047 1046 1046 1046 1046
v2 837 836 836 835 835 834 835
v4 710 709 709 709 709 709 709
v3 1362 1363 1351 1354 1355 1345
v3 1387 1389 1389 1386 1382 1386 1380
v3 1511 1506 1501 1505 1508 1510 1509
v3 1549 1548 1546 1547 1550 1555 1556
3234 3235 3235 3300 3300 3368 3369
vOH 3303 3298 3301 3562 3566 3569 3569
3363 3282 3379
Table 4.1 FT IR frequencies (cm-1) of Hydrozincite samples compared with sample Z4 taken from Music´ et al. (2002).
These peaks are in very good agreement with that reported in literature: 3234,
3303 and 3363 cm-1
(Music et al., 2002) and attributed to the structured OH groups
in hydrozincite. In this mineral, two oxygen atoms of the carbonate group are
bonded to an octahedral and tetrahedral zinc atom each, whereas the third oxygen
atom is hydrogen bonded to three OH groups. The hydrogen bonds present are of
different strength, in spite of the similar hydrogen bond lengths, due to the different
hydrogen bond acceptor strengths of the carbonate oxygen atoms (Schmidt and
Lutz, 1993). This means that the stretching vibrations of the structural OH groups in
hydrozincite should show three types of interactions in chemical bonding. In the IR
spectrum of all the other samples in Figure 4.2, two broad bands centred at about
3500 cm-1
and 3300 cm-1
can be observed. These indicate the presence of large

64
amount of adsorbed water on the surface of the hydrozincite. The broad absorption
bands at 1640 cm-1
, assigned to the bending of water molecules, demonstrate the
presence of molecularly adsorbed water in the crystal. The stretching vibrations
corresponding to the structural OH group, which contributes to the IR band
between 3200 – 3400 cm-1
, are not resolved in these samples.
The geological samples present a gradual separation of the IR bands
corresponding to the structural OH groups in [Zn5(CO3)2(OH)6]. Zabinski (1964)
investigated the IR spectra of several hydrozincite minerals from different localities.
Hydrozincite mineral from Dorchester showed a broad IR band centred at 3450 cm-
1, whereas the best crystallized hydrozincite mineral from Sedmocislenici showed
well-resolved IR band at 3230 and 3303 cm-1
and a weak shoulder at 3350 cm-1
.
This author concluded that the change in the microstructure of hydrozincite caused
this effect in the corresponding spectra. According to this author, hydrozincite
consist essentially of Zn5(OH)6O24-
sheets with additional Zn atoms and CO3
groups above and below these sheets. The carbonate group hold these sheets
together and, consequently, a deficiency of carbonate groups in hydrozincite
facilities a disorder in the layer sequence. This means that the disorder crystal
structure of hydrozincite influences the FT-IR spectrum as observed in the
biomineral sample, in fact the spectrum showed a poor crystallinity respect the
synthetic and in particular respect the geological samples. With an increase in the
staking disorder the hydrogen bonds become elonged for different amounts in the
various sheets and the corresponding IR bands are broadened and shifted toward
higher wave number (Music´ et al., 2002).

65
4.3 The morphologies analyzed by Scanning Electron
Microscopy
The morphological features of the samples studied are significantly dependent on
the mineral growth process. Geol1 and Geol2 show globular aggregates (Fig. 4.3
a) and crystals are characterized by a platelet shape (Fig. 4.3 b), probably caused
by the association of crystallographic forms {100} and {010}. Samples grown under
a condition of inorganic synthesis show acicular crystals (Fig. 4.3 c) having a short
side typically 100 and 200 nm in length, while the largest side is 2-10 µm and
platelet shaped (Fig. 4.3 d). Synthetic crystals show shapes and sized similar to the
geologically occurring crystals. The distinctive feature of the Naracauli samples is
that the hydrozincite form a packed network (Fig. 4.3 e) and encrust cyanobacteria
sheaths (Fig. 4.3 f). The crystals of the Nar samples show a platelet shape (Fig. 4.3
g) having the shortest side typically 50-100 nm long. These crystals are misaligned
and form mesoporous aggregate having a sponge-like surface. In addition, some
filaments of organic material are clearly visible between sheaths (Fig. 4.3 g) and
sometime protrude out from the inner sheaths.
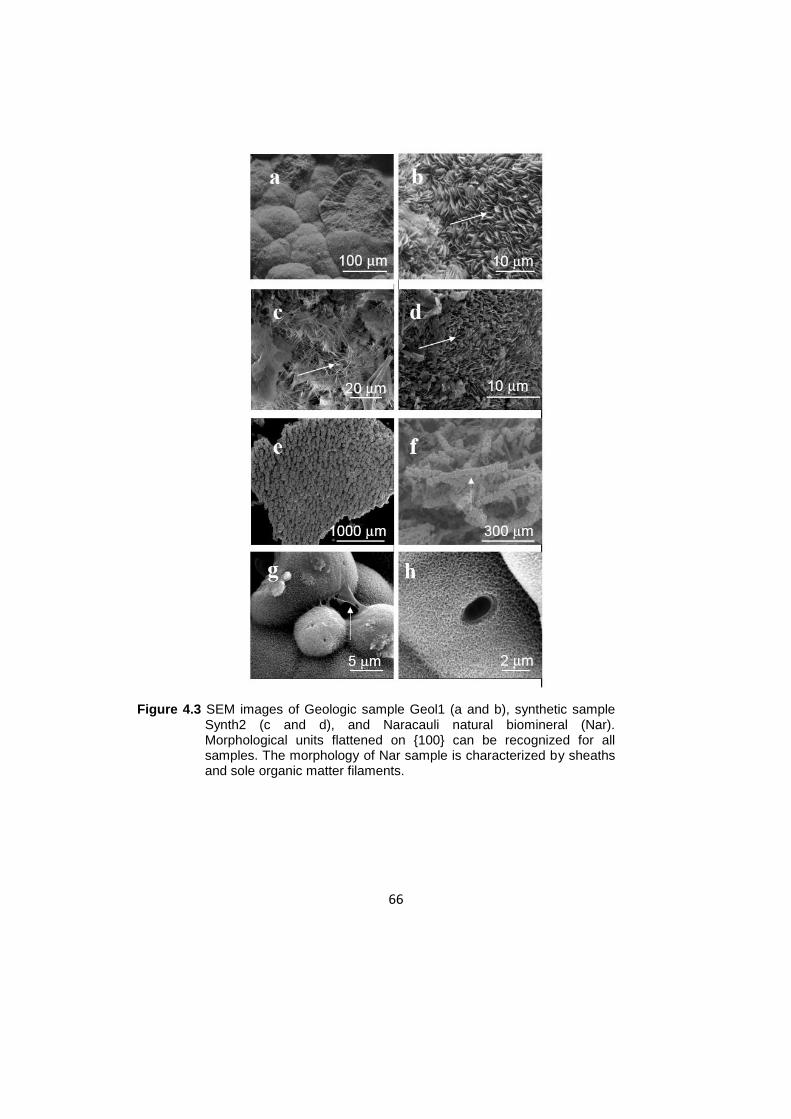
66
Figure 4.3 SEM images of Geologic sample Geol1 (a and b), synthetic sample Synth2 (c and d), and Naracauli natural biomineral (Nar). Morphological units flattened on {100} can be recognized for all samples. The morphology of Nar sample is characterized by sheaths and sole organic matter filaments.

67
4.4 HR - Transmission Electron Microscopy structural
informations
A representative HRTEM micrograph of geologic samples is provided in Figure 4.4
image a and b, where a low magnification image (Fig. 4.4 a) of the Geol1 sample
shows a euredral particle. Due to the thickness of these well crystallized particles,
only the extreme edge is transparent to electrons in high-resolution mode at high
magnification (Fig. 4.4 b). The image of figure 3.4 b shows nanocrystalline domains
larger than 5 nm with a grain boundary network. The observed nanocrystals exhibit
the lattice plane distance of 2.85 Å, which corresponds to the (220) hydrozincite
planes, as calculated by fast Fourier transform (FFT) in the inset (Fig. 4.4 b).
Representative images of the Nar sample are show in Figure 4.4 c, with the FFT in
the figure 4.4d (inset). The particle size distribution of the Nar sample, calculated
on about 2000 particles observe in dark-field images, is reported in Figure 4.4 d.
The average particle size is about 3-4 nm and the particle size distribution is
narrow. TEM results are in good agreement with FWHM from XRD; the value (3-4
nm), lower than the average crystallites size determined by XRD (7 nm), could be
the result of the presence of some attached isoriented primary nanoparticles. In the
literature were reported to spontaneously self-organized to a superstructure with a
common crystalloghraphic orientation in a process called” oriented attachment”
(Banfield et al., 2000; Meldrum and Cölfen, 2007). Figure 4.4 c (inset 1 and 3)
clearly indicates that nanocrystals can aggregate by fusion at the grain boundaries.
Sometimes misalignment between crystallites falls below 10°. More often
nanocrystals sharing some of the atomic position at their grain boundaries show
misalignment higher than 10°. The fusion process should be able to decrease the
excess of surface free energy and then stabilize the nanocrystals. According to
Meldrum and Cölfen (2007) the platelet observed by SEM can be consider as a
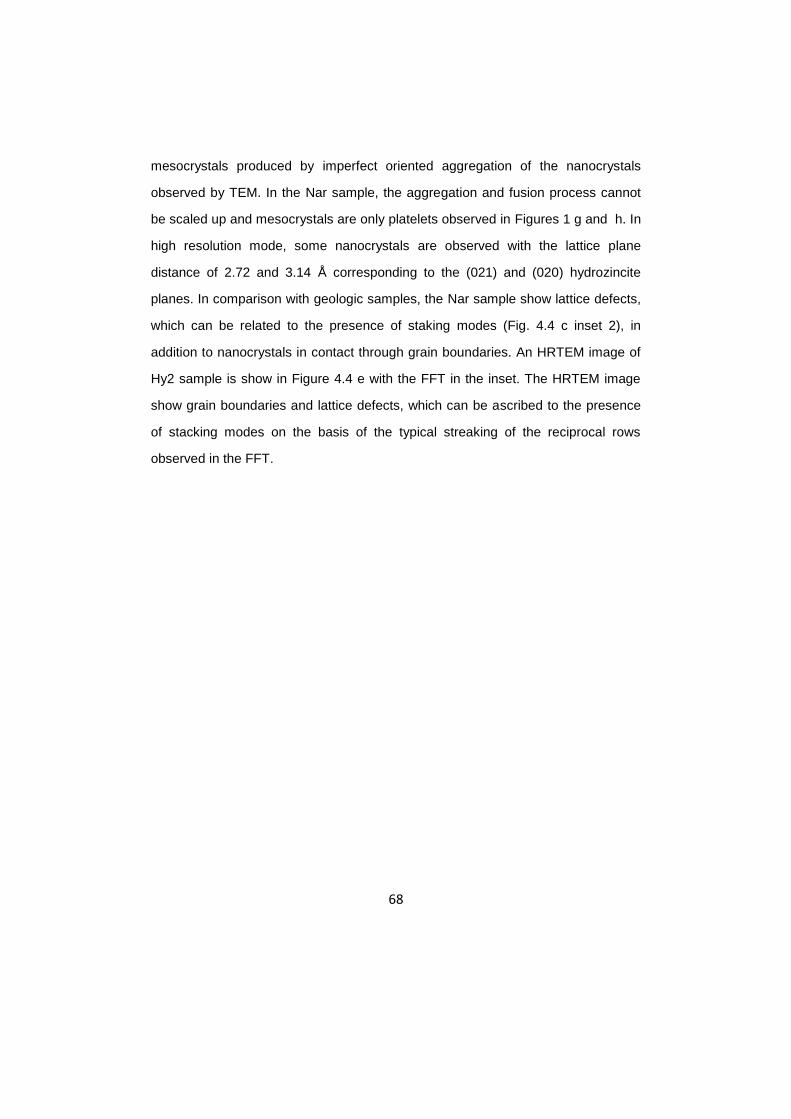
68
mesocrystals produced by imperfect oriented aggregation of the nanocrystals
observed by TEM. In the Nar sample, the aggregation and fusion process cannot
be scaled up and mesocrystals are only platelets observed in Figures 1 g and h. In
high resolution mode, some nanocrystals are observed with the lattice plane
distance of 2.72 and 3.14 Å corresponding to the (021) and (020) hydrozincite
planes. In comparison with geologic samples, the Nar sample show lattice defects,
which can be related to the presence of staking modes (Fig. 4.4 c inset 2), in
addition to nanocrystals in contact through grain boundaries. An HRTEM image of
Hy2 sample is show in Figure 4.4 e with the FFT in the inset. The HRTEM image
show grain boundaries and lattice defects, which can be ascribed to the presence
of stacking modes on the basis of the typical streaking of the reciprocal rows
observed in the FFT.

69
Figure 4.4 HRTEM images: Geol2 sample at low (a) and high magnification with FFT in the inset (b); Nar sample at high magnification (c-left) where lattice defects as grain boundaries (1,3) and stacking modes (2) are evidenced (c-right); FFT of Nar sample and particle size distributions(d); Hy1 sample at high magnification with FFT in the inset (e).

70
4.5 Solid State Nuclear Magnetic Resonance
13
C NMR spectroscopy has been a routine tool of organic chemistry for many
years, but there has been little investigation of the 13
C behavior of inorganic phase.
The first paper regarding the mineral carbonate with biogenic origin has been
published in the 1989 (Papenguth et al., 1989).
The information that we obtain from a solid-state NMR spectrum concern the
presence of polytipes, different number of lattice defects in the sample, namely
plane defects such as stacking faults (Tateyama et al., 1997; Harris, 2004). This
because NMR spectra are influenced by the local environment, extending to only
few spheres of coordination, so long–range order is not required to produce a
signal. The local environment can lower the local symmetry, thus affecting the
individual chemical shift and broadening of the observed peak, which are the result
of a superposition of the signals arising from all the carbon atoms in given sites
(Mehring, 1983; Engelhardt, 1987).

71
4.5.1 13C MAS experiments
The 13
C NMR experiments were collected with different relaxation delay, between
0.2 s and 1200 s. The Figure 4.7 and Figure 4.8 show the 13
C spectra of the
samples Geol1, Geol2, Hy1, Hy2, Hy3 and Nar collected with 5 s and 1200 s. In
the spectra of Geol1 and Geol2, shown in the Figure 4.7 and collected with 5 s of
relaxation delay, a peak with FWHM of ~1ppm is present at 163.8 ppm. Figure 4.7
shows that no signals are observed in the spectra of Hy1 and Hy3, while a large
featureless signals is observed in the spectrum of Hy2 in the range 160-168 ppm.
The spectrum of Nar sample shows overlapping signals falling in the 162-169 ppm
range, with a main signal at ~164 ppm.
Figure 4.7
13C MAS NMR spectra of geologic samples (Geol1 and Geol2),
synthetic samples (Hy1, Hy2 and Hy3), and biomineral sample (Nar). The spectra were collected at two relaxation delay of 5 s. All spectra have 50Hz line broadening.
140150160170180190
13C (ppm)
Geol1 5s
Geol2 5s
Hy1 5s
Hy2 5s
Hy3 5s
Nar 5s

72
The spectra Geol1 and Geol2 collected with 1200 s of relaxation delay are shown
in the Figure 4.8.
Figure 4.8
13C MAS NMR spectra of geologic samples (Geol1 and Geol2),
synthetic samples (Hy1, Hy2 and Hy3), and biomineral sample (Nar). The spectra were collected at 1200 s. All spectra have 50Hz line broadening.
The samples collected at 1200 s of delay show a main peak at 164 ppm, such as
that observed in the spectra collected with 5 s of relaxation delay (Fig. 4.7);
however, small shoulders at both low and high frequencies can now be identified.
In addition, a small high frequencies signal at 168 ppm can be observed in the
spectrum of Geol1. The spectrum of Hy1 collected with 1200 s of relaxation delay
(Fig. 4.8) present overlapping signals in the range between 163-169 ppm, the
spectra of Hy2 and Hy3 show similar features to those of Hy1; however the peaks
in the range 165.5-169 ppm are broader. The spectrum of the Nar sample shows
140150160170180190
Geol1 1200s
Geol2 1200s
Hy1 1200s
Hy2 1200s
Nar 1200s
Hy3 1200s
13C (ppm)

73
the same features under both delay conditions. As observed in Figure 4.8, even
the use of a very long relaxation delay (1200 s) gives 13
C MAS NMR spectra of low
quality.
4.5.2 13C CPMAS experiments
The use of 13
C Cross-Polarization Magic Angle Spinning (CPMAS) technique gives
spectra with a better signal to noise ratio (Fig. 4.9 and 4.10). The CPMAS
technique is also useful for detecting biopolymers (Ueyama et al. 1998; Takahashi
et al., 2004). The 13
C CPMAS NMR spectra should be effective for the organic
components which have many protons, in fact in the 1H-
13C Cross-Polarization
experiment the proton magnetization transfer to a carbon nucleus occurs during the
contact time period and depend on the distance between the protons and carbon
nuclei; moreover, it is governed by the characteristic proton spin-lattice relaxation
time in the rotating frame (T1ρ) and 1H-
13C cross polarization time.
Figure 4.9 shows the spectra collected whit a contact time of 4 ms for Geol1,
Geol2, Hy1, Hy2 and Hy3 and with 1 ms of contact time for Nar sample. The
geological and synthetic samples show the maximum polarization time as 10 ms,
while the natural sample present 1 ms of maximum polarization time.

74
Figure 4.9 13
C CPMAS NMR spectra of geological samples (Geol1 and Geol2), synthetic samples (Hy1, Hy2 and Hy3) and biomineral sample (Nar). Geological and synthetic spectra collected with 4 ms and Nar sample collected with 1 ms of contact time. All spectra have 50-Hz line broadening.
In the experiments reported in the Figure 4.9 and in the experiments with 10 ms of
contact time (Fig. 4.10) the sample Geol1, Geol2, Hy1, Hy2 and Hy3 present
overlapping signals in the 162-169 ppm range, whose the main signals appears at
~164 ppm. The Nar sample was not cross polarizable with a contact time of 10 ms.
this because, as described above, the presence of paragmanetic impurities in the
sample Nar induces a shortening of the T1ρ relaxation process.
150155160165170175180
13C (ppm)
Geol1 4ms
Geol2 4ms
Hy1 4ms
Hy3 4ms
Hy2 4ms
Nar 1ms
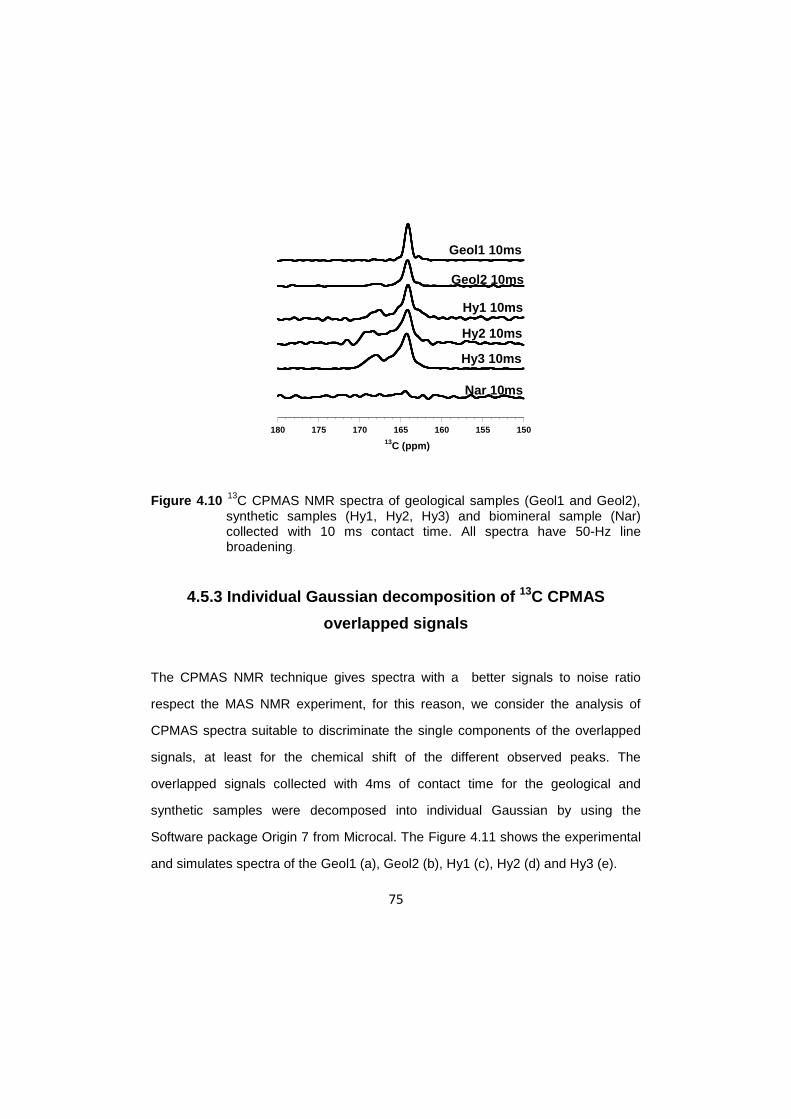
75
Figure 4.10
13C CPMAS NMR spectra of geological samples (Geol1 and Geol2),
synthetic samples (Hy1, Hy2, Hy3) and biomineral sample (Nar) collected with 10 ms contact time. All spectra have 50-Hz line broadening.
4.5.3 Individual Gaussian decomposition of 13C CPMAS
overlapped signals
The CPMAS NMR technique gives spectra with a better signals to noise ratio
respect the MAS NMR experiment, for this reason, we consider the analysis of
CPMAS spectra suitable to discriminate the single components of the overlapped
signals, at least for the chemical shift of the different observed peaks. The
overlapped signals collected with 4ms of contact time for the geological and
synthetic samples were decomposed into individual Gaussian by using the
Software package Origin 7 from Microcal. The Figure 4.11 shows the experimental
and simulates spectra of the Geol1 (a), Geol2 (b), Hy1 (c), Hy2 (d) and Hy3 (e).
150155160165170175180
Geol1 10ms
Geol2 10ms
Hy1 10ms
Hy2 10ms
Nar 10ms
Hy3 10ms
13C (ppm)

76
This approach has been used in literature either for the simulation of infrared and
Raman spectra of hydrozincite and smithsonite systems (Hales and Frost, 2007) or
NMR spectra as silicon carbide (Mykhaylyk, 2002). The information obtained (i.e.,
positions, FWHM, and chemical shift values of geological samples) were reported
in the Table 4.3 The relative areas of the signals in the Table 4.3 should be taken
with caution and only as an indication of the relative amounts of the different
structural conditions.
Figure 4.11 13
C CPMAS NMR spectra of Geol1 (a), Geol2 (b), Hy1 (c),Hy2(d) and Hy3 (e) samples. The species distributions in
13C CPMAS experiment
of the samples were obtained by a nonlinear fitting of the NMR spectrum to individual Gaussians (grey curves). In the fitting procedure, the position, line width, and intensity were varied to find the best fit curve (red curve) to the experimental spectrum. The residuals were show offset for clarity (black curve).

77
Geol1 Geol2 Hy1 Hy2 Hy3
δ 163.0±0.4 163.0±0.3 162.9±0.2 162.7±0.3 162.9±0.1
FWHM 1.21±0.06 0.92±0.08 0.93±0.07 1.62±0.08 1.33±0.01
% 13 10 9 4 11
δ 164.1±0.3 164.1±0.2 164.2±0.2 164.3±0.1 164.2±0.2
FWHM 0.82±0.04 0.85±0.04 0.91±0.03 1.45±0.06 1.01±0.08
% 74 66 40 39 37
δ 165.2±0.4 165.2±0.3 165.3±0.3 165.9±0.4 165.4±0.4
FWHM 1.23±0.06 0.91±0.07 1.34±0.07 1.72±0.09 1.61±0.04
% 13 15 24 23 26
δ 167.9±0.4 168.0±0.3 168.0±0.4 167.6±0.4
FWHM 1.54±0.05 1.65±0.06 1.82±0.07 1.53±0.01
% 9 25 20 12
δ 169.3±0.4 169.4±0.3 168.8±0.3
FWHM 1.55±0.08 1.57±0.05 1.57±0.05
% 2 14 14
Table 4.3 Chemical shift (ppm), FWHM (ppm), and percentage of carbon CPMAS signals decomposed into individual Gaussians for geologic and synthetic samples collected with 4ms contact time.
The fitting results clearly show that the signals at 164 ppm are the main signals for
all samples, as observed in the 13
C MAS (Fig. 4.7 and 4.8) spectra. In the Geol1
samples two more signals were detected at ~163 and ~165 ppm, whereas in the
Geol2 samples further signals is detected at ~168 ppm. In the spectra of both
synthetic samples, more components are present, and a good simulation can be
achieved using only five Gaussians at ~163, ~164, ~166, ~168, and ~169 ppm.

78
4.5.4 Considerations on the overlapped signals
It is worth noting that, even though the hydrozincite structure (Ghose 1964) has
only one crystallographically independent site for the carbon atom, but all MAS and
CPMAS spectra in the Figure 4.4 and 4.5 show several peaks in the range 150-180
ppm, more dominant in the biomineral and synthetic samples. Several reasons can
be taken into consideration to explain the presence of these additional signals:
1. The presence of paramagnetic metals can influences the chemical shift,
the spin lattice relaxation time (T1) and the line with the carbon signals (La
Mar et al. 1973) The amount of paramagnetic metal impurities in the Nar
sample is lower than 0.3%, is below 0.1% in the Geol1 and Geol2 samples,
and far below 0.1% in Hy1, Hy2 and Hy3 samples (Table 4.4). As
consequence, since overlapping signals are present in Nar, synthetic
samples, the presence of paramagnetic metal impurities cannot be
responsible for the appearance of additional signals. It is worth noting that
the spectra Hy1, Hy2 and Hy3 clearly show very broad signals at 5 s of
delay (Fig. 4.7), whereas small peaks are observed with 1200s delay (Fig.
4.8). Thus large T1 characterizes the NMR signals of these samples.
However, the spectrum of the Nar sample appears to be independent of
the investigated delays, showing that the NMR signals are affected by
short T1 (<5 s). Geological samples show a slight dependence on the
experimental delay. This seems to indicate that samples having low
paramagnetic metal impurity content show dependence on relaxation delay
(synthetics), samples having high concentration impurities contents show
very little dependence (Nar), and samples of intermediate content show a
slight dependence. This shows that the paragmanetic impurities do have
strong effects on the NMR spin lattice relaxation times affecting the

79
appearance of the peaks as a function of relaxation delay in the MAS
spectra (Fig. 4.7 - 4.8). Similar information is obtained from the CPMAS
spectra (Fig. 4.9 - 4.10). It may be suggest that in Nar, the presence of
higher concentration of paramagnetic impurities, when compared to the
other samples, induces a shortening of the T1ρ relaxation process, limiting
the polarization transfer to C nuclei. This can explain to loss of cross-
polarizable carbon signal in Nar sample collected at 10 ms contact time
(Fig. 4.10).
Geol1 Geol2 Hy1 Hy2 Hy3 Nar
Zn (g/Kg)
511 539 550 543 540 515
Pb (mg/Kg)
110 <0.4 0.05 81 25 1800
Cd (mg/Kg)
974 116 <0.4 <0.4 <0.4 560
Fe (mg/Kg)
300 21 <6.2 <0.4 <0.4 1970
Mn (mg/Kg)
300 2.00 0.01 0.04 0.02 220
Cu (mg/Kg)
17 12 8.08 7.02 7.56 150
Ni (mg/Kg)
23 10 0.08 0.08 0.08 330
Co (mg/Kg)
0.02 0.02 0.02 0.02 0.01 26
Ba (mg/Kg)
26 29 1.01 1.02 1.03 22
Sr (mg/Kg)
1.07 0.06 0.01 0.01 0.01 9
Table 4.4 Concentration of paramagnetic impurities in the geologic samples (Geol1 and Geol2), synthetic samples (Hy1, Hy2 and Hy3) and biomineral samples (Nar).
2. The appearances of extra peaks in the range of 150-180 ppm could be
explain by the presence of carbonyl/amide-carbons from organic

80
biopolymers, as previously observed (Takahashi et al., 2004). However
the presence of additional signals can be clearly excluded for the synthetic
samples, since they were synthesized in our laboratory in the absence of
any organic molecule, as evidenced by the absence of organic filaments in
TEM images. As to the Geol1 and Geol2 samples, they show lower
additional signals than the other samples analyzed, and, like the previous
sample, the SEM images do not show traces of organic filaments. This
evidence, and the fact that the amount of carbon estimates through CHNS-
O analysis was in agreement with the stoichiometry of the hydrozincite
formula (4.44%) for all geological and synthetic samples (Geol1 4.41%;
Geol2 4.37%; Hy1 4.29%; Hy2 4.34%; Hy3 4.32%) rule out this possibility.
Different consideration should be made regarding the Nar sample. In this
sample, the C estimate through CHNS-O analysis revealed an excess of C
(4.84%), which suggest the presence of biopolymer C. This evidence
confirms the presence of some organic material in the Nar sample, as
observed in SEM images (Fig. 4.3 g), and it is in good agreement with the
signals observed in CPMAS spectrum, as shown in the next paragraph. In
fact, the CPMAS spectrum Figure 4.12 of the Nar sample is characterized
by a broad signals that can be attributed, as revealed by CHN-O analysis,
to aliphatic chains (~22ppm) and to O-aliphatic –carbons (~73ppm and
~110 ppm), whereas these signals were not observed in the other
samples. Carbonyl-C atoms would be expected in the range 160<d<190
ppm. All this evidence would suggest the presence of signals coming from
carbonyl C from organic material in the range of 150-180 or at least, and

81
more importantly, that the organic material has some influence in the
formation of this additional signals.
3. The NMR technique is well known to be sensitive to the crystal order and to
the presence of lattice defects such as stacking faults. The relation
between stacking and/or polytype and NMR peak formation is well known
in literature for several phase such as silicon carbide (Tateyama et al.,
1997; Harris, 2004; Hartman et al., 1987), calcium silicate hydrate (Cong
and Kirkpatrick, 1996) and saponite (Vogels, 2005). Depending on mineral
synthesis, different stacking sequences or polytypes can possibly be
achieved, (Vogels et al., 2005), and these result in different energy minima
(Ryj ček et al., 2005) Despite the fact that the C has only one
crystallographic position in the ideal structure of hydrozincite, 13
C NMR
spectra of our samples show up to five peaks depending on the mineral
formation. These additional peaks can be ascribed to the presence of
lattice defects, namely grain boundaries and stacking modes, that lower
the crystal structure symmetry present in these hydrozincite crystals, in
agreement with HRTEM analysis.

82
4.5.5 Evidence of organic matrix in hydrozincite biomineral
This approach cannot be used for the Nar sample, in fact as observe in the whole
spectrum collected with 1 ms to contact time (Fig. 3.12), this shows additional
broad signal at ~22, ~73, ~103, ~173, ~181 ppm which were not present in all the
spectra of the other samples.
Figure 4.12 The whole
13C CPMAS spectrum of biomineral sample collected at 1
ms contact time. (* indicates spinning side bands of the overlapping signals in the 163-169 ppm range).
These additional signals may be attributed to the presence of organic material. The
hypothesis has been confirmed in addition to the SEM image (Fig. 4.3 g) also
050100150200
13C (ppm)
Nar 1ms
*

83
through the CHNS-O analysis, that revealed an excess of C (4.84%), for Nar
sample respect the other samples (~ 4.2%), which suggest the presence of
biopolymer C. The 13
C CPMAS signals can be attributed, as revealed by CHN-O
analysis, to aliphatic chains (~22ppm) and to O-aliphatic –carbons (~73ppm and
~110 ppm). In literature, Takahashi et al. (2004) show similar results for the
biopolymer present in biomineral CaCO3 Pinctada fucata.
4.6 FT-IR characterization of organic matrix
The mineral phase of biomineral is intimately associated with a biological material,
or matrix, that binds the crystals together from their early stages of assembly. The
literature show that the biological component represents less than 5% of the entire
biomineral volume (Marxen et al., 1998; Marin and Luquet, 2004; Dauphin, 2006);
and, it is an integral part of the mineral and is responsible for crystal nucleation,
growth and physical properties. (Lowenstam, 1981; Weiner, 1981). Therefore,
knowing how this is achieved is extremely important to understand the whole
mineralization process.
The matrix has been frequently investigated. Two fractions are present, one is the
(water)-soluble fraction, and the other is the insoluble component.
It is essentially inter-crystalline, and acts as the framework upon which crystals are
deposited. Therefore, the dissolution of the crystalline matter of the biomineral
allows not only a clear three dimensional view of the insoluble matrix, but also a
means of its biochemical characterization (Tong et al., 2002; Dauphin et al., 2003
a,b). The matrix basically contains proteins, carbohydrates, polysaccharides and
lipids (Levi-Kalisman et al., 2001).The soluble fraction is essentially associated with
the surface of the insoluble and structured matrix, and also found within the
crystals (Tong et al., 2002).

84
The mineral deposition dynamics and the biological and chemical reactions
underlying it have not been completely explained. Recent studies by Cartwright
and Checa (2007) emphasize the complexity of the phenomena involved, of
biological and physical–chemical nature. The matrix is present between each
crystalline layer and also within the crystals, comprised of crystalline subunits (Gre´
goire, 1961; Checa and Rodriguez-Navarro, 2001; Tong et al., 2002; Cartwright
and Checa, 2007).
The third component of the organic matrix of calcareous biominerals is lipids.
Although analyses dealing with this component for example in biomineral as
molluscan shells are scarce. Goulletquer and Wolowicz (1989) have estimated that
proteins represent 90% of the organic matrix of the shell, carbohydrates vary from
0.15 to 0.29%, while lipids vary from 0.8 to 2.9%. Fatty acids, cholesterol,
phytadienes and ketones have been described in modern and fossil shells
(Cobabe and Pratt, 1995). Recently, Farre and Dauphin (2009) verified through
spectrometry and thin layer chromatography the difference in lipids content
between prismatic and nacreous layers of P. nobilis (Mytiloidea) and P.
margaritifera (Pterioida, Pteriidae); both organisms contain lipids, but there are
compositional differences.
FT-IR has also been applied for comparing the organic composition of different
biominerals as molluscan shells (Dauphin, 1999; Dauphin et al., 2008). The
biogenic crystal growth is controlled by an organic matrix responsible for defining:
(a) crystal nucleation; (b) crystal size; (c) crystal orientation; (d) crystal
morphological characteristics (Wilbur and Saleuddin, 1983). The use of infrared
spectroscopy has identified the functional groups responsible for organic matrix.
The organic matrix, clearly visible in the 13
C CPMAS NMR (Fig. 4.12) and SEM
(Fig. 4.3 g) images for the Nar sample, has been extract and characterized by FT-

85
IR. In the Figure 4.18 the FT-IR spectra for the Nar biomineral sample, the
insoluble organic matrix (IOM) and lipidic fraction are reported.
5001000150020002500300035004000
wave number (cm-1
)
Nar
IOM Nar
lipidic Nar
Figure 4.18 FT-IR spectra of biomineral Nar sample, insoluble organic matrix (IOM) and lipidic extraction.
4.6.1 Characterization of insoluble extract
For the better analysis of IOM the FT-IR spectrum has been divided in three range,
the Figure 4.19 show the FT-IR between 4000-2700 cm-1, this part is characterized
by bands corresponding to the N-H stretching at 3620 cm-1
, amide A at 3300 cm-1
,
three signals at 2954, 2925 and 2854 cm-1
corresponding to CH2 and CH3
vibrations.

86
2800300032003400360038004000
wave number (cm-1
)
am
ide A
36
30
33
00
29
54
29
25
285
4
Figure 4.19 Detailed FT-IR spectrum of IOM Nar sample in the range 4000-2700
cm-1
.
140015001600170018001900
wave number (cm-1
)
amide I
amide II
173
3
171
71
69
51
68
216
66
166
1
1653
1636
15
76
15
57
154
015
19
15
06
14
65
14
55 14
37
14
18
Figure 4.20 Detailed FT-IR spectrum of IOM Nar sample in the range 1900-1400
cm-1
.

87
In the range between 1900-1400 cm-1
(Fig. 4.20) are very clearly the vibration of
amide I and amide II: amide I at 1653 cm-1
(v C=O), band of amide II at 1557 cm-1
(v C-N and δ N-H) and 1548 cm-1
(v C=O). This part of the spectrum is very similar
with other FT-IR spectrum of IOM for Pinna Nobilis and Pinctada Margaritifera
calcitric prisms bivalves (Dauphin, 2003).
Figure 4.21 Detailed FT-IR spectrum of IOM Nar sample in the range 1400- 400
cm-1
.
FT-IR between 1400-400 cm-1
is reported in the Figure 4.21. Band between 1000
and 1150 cm-1
are usually considered to characterize the presence of
polysaccharides. The FT-IR showed two important bands in this region at 1084 and
1032 cm-1
which suggest the presence of polysaccharides in the insoluble matrix
extracted from Nar sample.
400600800100012001400
wave number (cm-1
)
12
20
115
2
10
84
10
32
92
8
80
3
53
6
46
9
sugar

88
4.6.2 Characterization of lipidic extract
FT-IR data on lipidic extracted form biomineral are very rare. Nevertheless, Samata
and Ogura (1997) have shown that lipids were present in the nacreous layer of
Pinctada fucata. The FT-IR of lipid extract from Nar sample is reported in the
Figure 4.22. The spectrum shown characteristic frequencies for the lipids: a strong
broad band centered at 3422 cm-1
due to HOH stretching; IR absorption bands of
Figure 4.22 FT-IR spectrum of lipidic extract from biomineral Nar.
aliphatic CH moieties at 2960, 2928, 2877 and 2855 cm-1
, the bands around 2960
cm-1
and 2928 cm-1
are derived from asymmetric stretching of end-methyl aliphatic
CH3 and methylene-chain CH2, respectively (Bellamy, 1954), while the weaker
bands from symmetric stretching of aliphatic CH3 and CH2 are also seen around
5001000150020002500300035004000
wave number (cm-1
)
34
22
29
60
29
28
28
77
28
55
17
29
16
38 1
46
11
38
31
27
71
12
21
07
2
58
9
44
7

89
2877 cm−1
and 2855 cm−1
, respectively; intense signals at 1729 cm-1
due to
carboxylic acid (νC=O); a weaker band for amide I at 1630 cm-1
; CH2 bending and
CH3 symmetric bending at 1461 cm-1
and 1383 cm-1
, respectively; is also clearly
the presence of phosphate diester, in fact the FT-IR showed the asymmetric
stretching at 1277 cm-1
, and the symmetric stretching at 1072 cm-1
due to this
group.
4.6 Conclusions
The microscopic properties of biomineral hydrozincite from Naracauli Creek (SW
Sardinia) were investigated by using X-ray Diffraction (XRD), Fourier Transform
Infrared (FT-IR), Nuclear Magnetic Resonance (NMR), Scanning Electron
Microscopy (SEM), and High-Resolution Transmission Electron Microscopy
(HRTEM). Because the biomineral hydrozincite turned out to significantly deviate
from ideal structure of hydrozincite, synthetic and geologic samples were also
investigated for comparison. SEM imaging shows that biomineral hydrozincite is
made of small platelet-shaped crystallites having a 20-50 nm long side at the
shortest and other sides measuring hundreds of nanometers long. These are
interlaced to form sheaths several micrometers long. HRTEM analysis of the
biomineral samples shows an imperfectly oriented aggregation of the nanocrystals
that is discussed in terms of mesocrystals. TEM and XRD analysis indicate a
progressive decrease in size of the particles in the biomineral compared to the
synthetic and geologic hydrozincite samples, with coherent diffraction domains in
the biomineral hydrozincite that are smaller by 30-50% that in the other samples
investigated. 13
C magic angle spinning (MAS) and cross-polarization magic angle
spinning (CPMAS) NMR spectra show more than one peak for all the investigated
samples, despite the fact that carbon atoms have a unique crystallographic position

90
in the hydrozincite structure. The additional peaks can reflect the presence of
lattice defects, such as grain boundaries and stacking modes, can be observed
both in the biomineral and in the synthetic samples. Further additional peaks in the
NMR spectra of biomineral samples are attributed to organic molecules, relicts of
the biomineralization process, in agreement with the filaments observed in SEM
images of biomineral samples. The organic components of the biomineral sample
has been extracted and characterized by FT-IR, it is composed by proteins,
polysaccharides and lipids, and the result is very similar with other biomineral
formation reported in literature

91
4.7 References
Alam, T. M., Pless, J. D., Nenoff, T. M. Probing Water Dynamics in Octahedral
Molecular Sieves: High Speed 1H MAS NMR Investigations. Mag. Res.
Mat. Sci. (2007).
Arrondo, J.L.R., and Goñi, F.M. Infrared studies of protein-induced perturbation of
lipids in lipoproteins and membranes. Chem. Phys. Lipids 96, 53–68 (1998).
Baccile, N., Laurent, G., Bonhomme, C., Innocenzi, P.,Babonneau F. Solid-State
NMR Characterization of the Surfactant-Silica Interface in Templated Silicas:
Acidic versus Basic Conditions. Chem. Mater., 19, 1343-1354 (2007).
Banfield, J.F., Welch, S.A., Zhang, H.Z., Ebert, T.T., and Penn, R.L. Aggragation-
based crystal growth and microstructuredevelopment in natural iron
oxyhydroxide biomineralization products. Science, 289, 751-754 (2000).
Beedham, G.E., 1958. Observations on the non-calcareous component of the shell
of the Lamellibranchia. Q. J. Microsc. Sci. 99, 341–357 (1958).
Bellamy, L.J. (Ed.). The Infra-red Spectra of Complex Molecules. John Wiley &
Sons, New York, pp. 13–56 (1954).
Berman, A., Hanson, J., Leiserowitz, L., Koetzle, T.F.,Weiner, S., Addadi, L., 1993.
Crystal–protein interactions: controlled anisotropic changes in crystal
microtexture. J. Phys. Chem. 97, 5162–5170 (1993).
Brunner, E., and Sternberg, U. Solid-state NMR investigations on the nature of
hydrogen bonds. Prog. Nucl. Magn. Reson. Spectrosc. 32, 21–57 (1998).
Cartwright, J.H.E., and Checa, A.G. The dynamics of nacre self-assembly. J. R.
Soc. Interface, 4, 491–504 (2007).
Checa, A.G., and Rodriguez-Navarro, A. Geometrical and crystallographic
constraints determine the self-organization of shell microstructures in
Unionidae (Bivalvia: Mollusca). Proc. R. Soc. Lond. B 268, 771–778 (2001).

92
Cobabe, E.A., and Pratt, L.M. Molecular and isotopic compositions of lipids in
bivalve shells: a new prospect for molecular paleontology. Geochim.
Cosmochim. Acta, 59, 87–95c (1995).
Collins, M.J., Stern, B., Abbott, G.D.,Walton, D., Riley, M.S., vonWallmenich, T.,
Savage, N.M., Armstrong, H.A.,Westbroek, P. “Intracrystalline” organicmatter in
biominerals. In: Grimalt, J.O., Dorronsoro, C. (Eds.), Organic Geochemistry:
Developments and Applications to Energy, Climate, Environment and Human
History. AIGOA, Donostia- San Sebastian, Spain, 702–705 (1995).
Cuif, J.P., Dauphin, Y., Denis, A., Gaspard, D., Keller, J.P. Continuité et périodicité
du réseau organique intraprismatique dans le test de Pinna muricata Linné
(Lamellibranches). C.R. Acad. Sci. Paris, 290, sér. D 759–762 (1980).
Cong, X. and Kirkpatrick, R.J. 17
O NMR investigation of the structure of calcium
silicate hydrate gel. Jounalof American Chemical Society, 79, 1585-1592
(1996).
Dauphin, Y. Structure and composition of the septal nacreous layer of Nautilus
macromphalus L. (Mollusca, Cephalopoda). Zoology 109, 85–95 (2006).
Dauphin, Y., Cuif, J.P., Doucet, J., Salome´ , M., Susini, J., Williams, C.T. In situ
chemical speciation of sulfur in calcitic biominerals and the simple prism
concept. J. Struct. Biol., 142, 272–280 (2003).
Dauphin, Y., Ball, A.D., Cotte, M., Cuif, J.-P., Meibom, A., Salome´ , M., Susini, J.
,Williams, C.T. Structure and composition of the nacre-prisms transition in the
shell of Pinctada margaritifera (Mollusca, Bivalvia). Ann. Bioanal. Chem. 390,
1659–1669 (2008).
Dauphin, Y. Soluble organic matrices of the calcite prismatic shell layers of two
Pteriomorphid bivalves. J. Biol. Chem. 17, 15168-15177 (2003).
Gre´ goire, Ch. Structure of the conchiolin cases of the prism in the Mytilus Edulis
Linne. J. Biophys. Biochem. Cytol. 9 (2), 395–400 (1961).

93
Goulletquer, P., and Wolowicz, M. The shell of Cardium edule, Cardium glaucum
and Ruditapes philippinarium: organic content, composition and energy value,
as determined by different methods. J. Mar. Biol. Assoc. U.K. 69, 563–572
(1989).
Grégoire, C., Duchateau, G., Florkin, M., 1955. La trame protidique des nacres et
des perles. Ann. Inst. Océanogr. 31, 1–36 (1955).
Ghose, S. the crystal structure of hydrozincite, Zn5(OH)6(CO3)2. Acta
Crystallographica, 17, 1051-1057 (1964).
Gyunggoo C., Yaotang Wu., Jerome L. Detection of Hydroxyl Ions in Bone Mineral
by Solid-State NMR Spectroscopy. Science, 300, 1123 (2003).
Engelhardt, G. High Resolution Solid State NMR of Silicates and Zeolites, 485 p.
Wiley, New York, (1987).
Eckert, H., Yesinowski, J.P., Stolper, E.M., Stanton, T.R., Holloway, J. The state of
water in rhyolitic glasses a deuterium NMR study. J. Non-Cryst Solids, 93,93–
114(1987).
Jones, G.C., and Jackson, B. Infrared Transmission Spectra of Carbonate
Minerals. Chapman and Hall, London. 256 pp (1993).
Kobayashi, I., and Samata, T. Bivalve shell structure and organic matrix. Mat. Sci.
Enginee,r C26, 692–698 (2006).
Kohn, S.C. Structural Studies of OH in Nominally Anhydrous Minerals Using NMR.
Min.Soc.America, (2007).
Lowenstam H. A. Minerals formed by organisms. Science, 211, 1126-1131 (1981).
Hatchett, C. Experiments and observations on shell and bone. The Royal Soc. 89,
315–334 (1799).
Hales, M.C. and Frost, R.L. Synthesis and vibrational spectroscopy
characterization of synthetic smithsonite and hydrozincite. Polyhedron, 26,
4955-4962 (2007).

94
Harris, R.K. NMR crystallography: The use of chemical shift. Solis State. Science, 6,
1025-1037 (2004).
Hartman, J.S., Richardson, M.F., Sherriff, B.L., and Winsborrow, B.G. Magic angle
spinning NMR studies of silicon carbide: polytypes, impurities, and highly inefficient
spin-lattice relaxation. J. Am. Chem. Soc. 109, 6059-6067 (1987).
Holland, G. P., Cherry, B. R., Alam, T. M. Distribution effects on 1H double-quantum
MAS NMR spectra. J. Mag. Res., 161-167 (2004).
La Mar, G.N., Horrocks Jr., W.D., and Holm, R.H. NMR of Paramagnetic Molecules, 678
p. Academic Press, New York, (1973).
Libowitzky, E. correlation of O-H stretching frequencies amd O-H..O hydrogen bond
lengths in minerals. Monatshefte fur Chemie, 130, 1047-1059 (1999).
Mehring, M. Principles of High Resolution NMR in Solid, 2nd
edition, 342 p. Springer-
Verlag, New York, (1983).
Meldrum, F. and Cölfen, H. Controlling mineral morphologies and structures in biological
and synthetic systems. Chem. Rev. 108, 4332-4432 (2007).
Music,´ S.; Popovic´, S.; Maljkovic´, M.; Dragcˇevic, D. Influence of synthesis
procedure on the formation and properties of zinc oxide. J. Alloys Compd., 347,
324–332 (2002).
Mutvei, H. On the micro- and ultrastructure of the conchiolin in the nacreous layer of
some recent and fossil molluscs. Stockh. Contrib. Geol. 20, 1–17 (1969).
Marxen, J.C., and Becker, W. The organic shell matrix of the freshwater snail
Biomphalaria glabrata. Comp. Biochem. Physiol. 118 B, 23–33 (1997).
Marin, F., and Luquet, G. Molluscan shell proteins. Comptes Rendus Palevol, 3, 469–
492 (2004).
Mykhaylyk, O.O., Khimyak, y.Z., attfiel, J.P., Mykola, P., Gadzira, M.P. Phase
segregation in silicon carbide-carbon solid solutions from XRD and NMR studies.
Chem. Mater., 14, 1348-1353 (2002).

95
Nara, M., Okazaki, M., Kagi, H. Infrared study of human serum very-low-density and
low-density lipoproteins. Implications of esterified lipid C=O stretching bands for
characterizing lipoproteins. Chem. Phys. Lipids, 117, 1–6 (2002).
Nenoff, T. M., Ockwig, N. W., Cygan, R. T., Alam, T. M., Leung, K., Pless, J. D., Xu,
H., Hartl, M. A., Daemen, L.L. Role of Water in the Ion Selectivity of Niobate-Based
Octahedral Molecular Sieves. J. Phys. Chem. C, 111, 13212-13221 (2007).
Papenguth, H. et al. 13
C MAS NMR spectroscopy of inorganic and biogenic carbonate.
Am. Miner., 74, 1152-1158 (1989).
Patterson, A. The Scherrer Formula for X-Ray Particle Size Determination. Phys.
Rev., 56 (10), 978–982 (1939).
Pohle,W., Gauger, D.R., Fritzsche, H., Rattay, B., Selle, C., Binder, H., Böhlig, H.
FTIR—spectroscopic characterization of phosphocholine-headgroup model
compounds. J. Mol. Struct., 563/564, 463–467 (2001).
Rousseau, M., Bedouet, L., Latie, E., Gasser, P., Le Ny, K., Lopez, E. Restoration of
stratum corneum with nacre lipids. Comp. Biochem. Physiol. B, 145, 1–9 (2006).
Rothwell W. P., Waugh J. S., Yesinowski J. P. High-resolution variable-temperature
phosphorus-31 NMR of solid calcium phosphates J. Am. Chem. Soc., 102, 2637
(1980).
Ryj ček, ., Engkvist, O., Vacek, J., Kratochvil, M., and Hobza, P. Hoogsteen and
stacked structures of the 9-methyladenine 1-methylthymine pair are
populatedequally at experimental conditions: Ab initio and molecular dynamics
study. J. Phys. Chem. A, 105, 1197-1202 (2001).
Samata, T., Ogura, M. First finding of lipid component in the nacreous layer of
Pinctada fucata. J. Fossil Res. 30, 66 (1997).
Simkiss, K. The organic matrix of the oyster shell. Comp. Biochem. Physiol., 16, 427–
435 (1965).

96
Scherrer P., Nachrichten von der Gesellschaft der Wissenschaften zu Göttingen, 98-
100 (1918).
Schmidt, M., and Lutz, H.D. Hydrogen bonding in basic copper salts: a spectroscopic
study of malachite, Cu2(OH)2CO3, and brochantite, Cu4(OH)6SO4. Phys. Chem. of
Min., 20 (1), 27-32 (1993).
Takahashi, K., Yamamoto, H., Onoda, A., Doi, M., Inaba, T.,Chiba, m., Kobayashi, A.,
Taguchi, T., Okamura, T.-a., and (Ueyama, N. Highly oriented aragonite
nanocrystal-biopolymer composites in an aragonite brick of the nacreous layer of
Pinctada fucata. Chem. Comm., 8, 996-997 (2004).
Tateyama, H., Noma, H., Adachi, Y., and Komatsu, M. Prediction of stacking faults in β-
silicon carbide: X-ray and NMR studies. Chem. Mater., 9, 766-772 (1997).
Tong, H., Hu, J., Ma,W., Zhong, G., Yao, S., Cao, N. In situ analysis of the organic
framework in the prismatic layer of mollusk shell. Biomaterials, 23, 2593–2598
(2002).
Ueyama, N., Hosoi, T., Yamada, Y.,Doi, M.,Okamura, T., Nakamura, A. Calcium
complexes of carboxylate-containing polyamide with sterically disposed NH-O
hydrogen bond: Detection of the polyamide in calcim carbonate by 13
C cross
polarization/magic angle spinning spectra. Macromolecules, 31, 7119-7126 (1998).
Vogels, R.J.M.J., Kloprogge, J.T., Geus, J..W. Synthesis and characterization of boron
and gallium substituted saponite clays below 100°C at one atmosphere.
Microporous and Mesoporous Material, 77, 159-165 (2005).
Yesinowski J. P., Eckert H. Hydrogen environments in calcium phosphates: proton
MAS NMR at high spinning speeds. J. Am. Chem. Soc., 109, 6274 (1987).
Weiner S., Traub W. and Lowenstam H. A. Organic matrix in calcified exoskeletons. In
Biomineralization and Biological Metal Accumulation (Edited by Westbroek P. and
DeJong E. W.), pp. 205-224. D. Reidel, Holland (1983).

97
Wu Y., Ackerman J. L., Kim H. M., Rey C., Barroug A., and Glimcher M. J. Nuclear
Magnetic Resonance Spin-Spin Relaxation of the Crystals of Bone, Dental Enamel,
and Synthetic Hydroxyapatites. J. Bone Miner. Res., 17, 472 (2002).
Zabinski, W. The problem of stacking-order in natural hydrozincite. Can.Mineral. 8, 649
(1964).

98

99
Chapter V Characterization of the interaction
hydrozincite/DEHP
5.1 Hydrozincite in vitro synthesis
Another important aspect of the research was to understand the phenomenon, at
the molecular level, of the hydrozincite biomineralization.
But during the attempt to reproduce the hydrozincite biomineral in vitro, we have
found the presence of new molecule bounding with the mineral. The Figure 5.1
showed the FT-IR spectra of synthetics hydrozincite Hy3 and Hy4.
Both FT-IR spectra in the range of 400 – 1800 cm-1
, are the carbonate stretching
and bending modes of hydrozincite (see chapter IV), in agreement with those
reported in literature (Music et al., 2002): the four peaks in the region of 1520–1390
cm−1
ascribed to the asymmetric C-O stretching ν3 mode (the correlation field
splitting is well observed in the spectrum); the strong and sharp peak at 836 cm−1
assigned to the ν2 out-of-plane O-C-O bending mode and the one at 709 cm−1
is
assigned to ν4 asymmetric O-C-O bending modes and the peak at 1047 cm-1
assigned to the ν1 symmetric C-O stretching mode (Music et al., 2002). The
spectrum exhibits broad signals which were attributed to the contributions of
different lattice defects and grain boundaries (Hales and Frost, 2007). But in the
15% of synthesized hydrozincite samples, the FT-IR spectrum, besides the signals
ascribed to hydrozincite, shows several new peaks (Hy4): a series of signals in the
region of the C-H stretching at 2962, 2925, 2875, 2858 cm-1
; an intense signal at
1730 cm-1
, which is typical of ester C=O stretching; and two small bands at 1290
cm-1
and 1189 cm-1
. The new signals were partially removed after washing the
sample with acetone at room temperature (Fig. 5.1, sample Hy4/1).
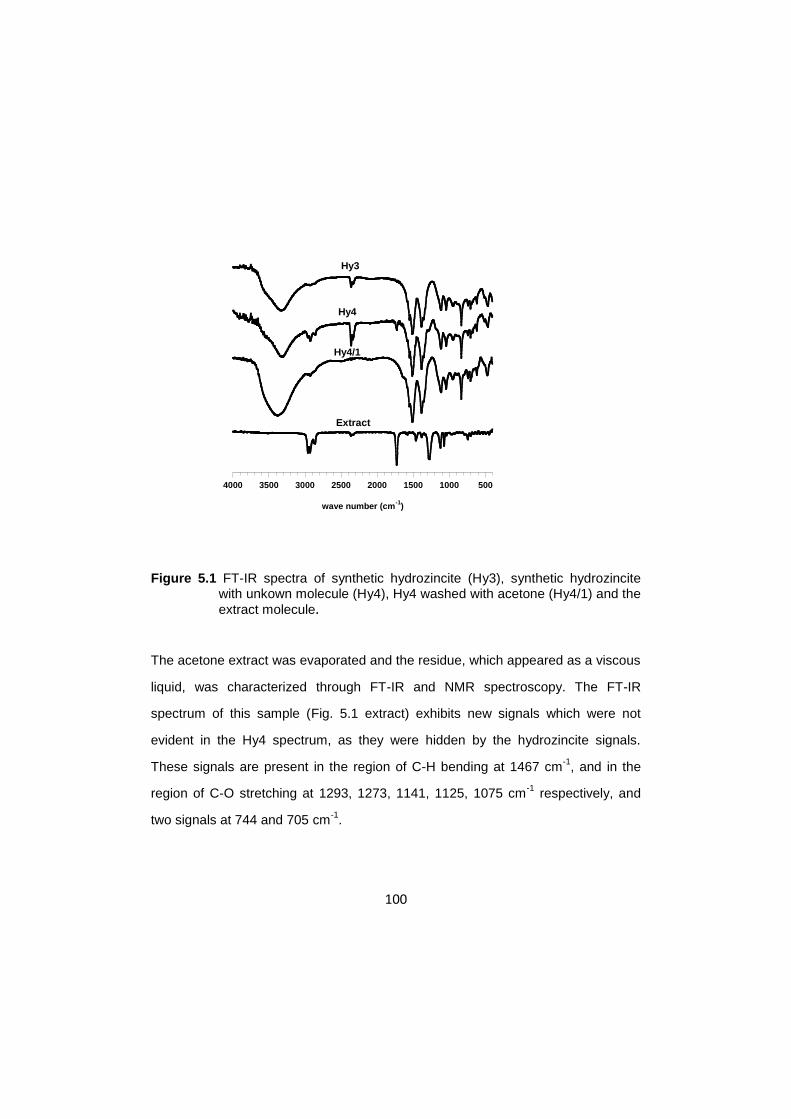
100
Figure 5.1 FT-IR spectra of synthetic hydrozincite (Hy3), synthetic hydrozincite with unkown molecule (Hy4), Hy4 washed with acetone (Hy4/1) and the
extract molecule.
The acetone extract was evaporated and the residue, which appeared as a viscous
liquid, was characterized through FT-IR and NMR spectroscopy. The FT-IR
spectrum of this sample (Fig. 5.1 extract) exhibits new signals which were not
evident in the Hy4 spectrum, as they were hidden by the hydrozincite signals.
These signals are present in the region of C-H bending at 1467 cm-1
, and in the
region of C-O stretching at 1293, 1273, 1141, 1125, 1075 cm-1
respectively, and
two signals at 744 and 705 cm-1
.
5001000150020002500300035004000
wave number (cm-1
)
Hy3
Hy4
Hy4/1
Extract

101
5.2 Identification of extract molecule
This extract molecule has been identified by means 1D 1H and
13C, and 2D COSY,
HSQC and HMBC NMR experiments. In Figure 5.2 and 5.3 the 1H NMR and
13C
NMR experiment for the extract molecules in Acetone-d6 are reported.
Figure 5.2 1H NMR spectrum for extract molecules by Hy4.

102
Figure 5.3 13
C NMR spectrum for extract molecules by Hy4 sample.
In the 1H NMR (Fig. 5.2) spectrum the signals at 7.85 ppm and 7.78 ppm
exhibiting the AA’BB’ system typical of a di-substituted ring whereas the signals at
4.33 ppm is the AB part of the ABX pattern formed by three protons in the
OCH2CH group. The 13
C NMR (Fig. 5.3) spectrum of unknown compound showed
12 carbon signals.

103
ppm (f2)
0.01.02.03.04.05.06.07.08.0
0
50
100
150ppm (f1)
Figure 5.4 COSY experiment acquired with 64 transients with a total 2 K data points along the t2 axis and 512 data points along the t1 axis.
ppm (f2)
0.01.02.03.04.05.06.07.08.0
0
50
100
150ppm (f1)
Figure 5.5 1H/
13C HSQC spectrum recorded with 64 transients with 2k points in the
t2 dimension and 512 in the t1 dimension.
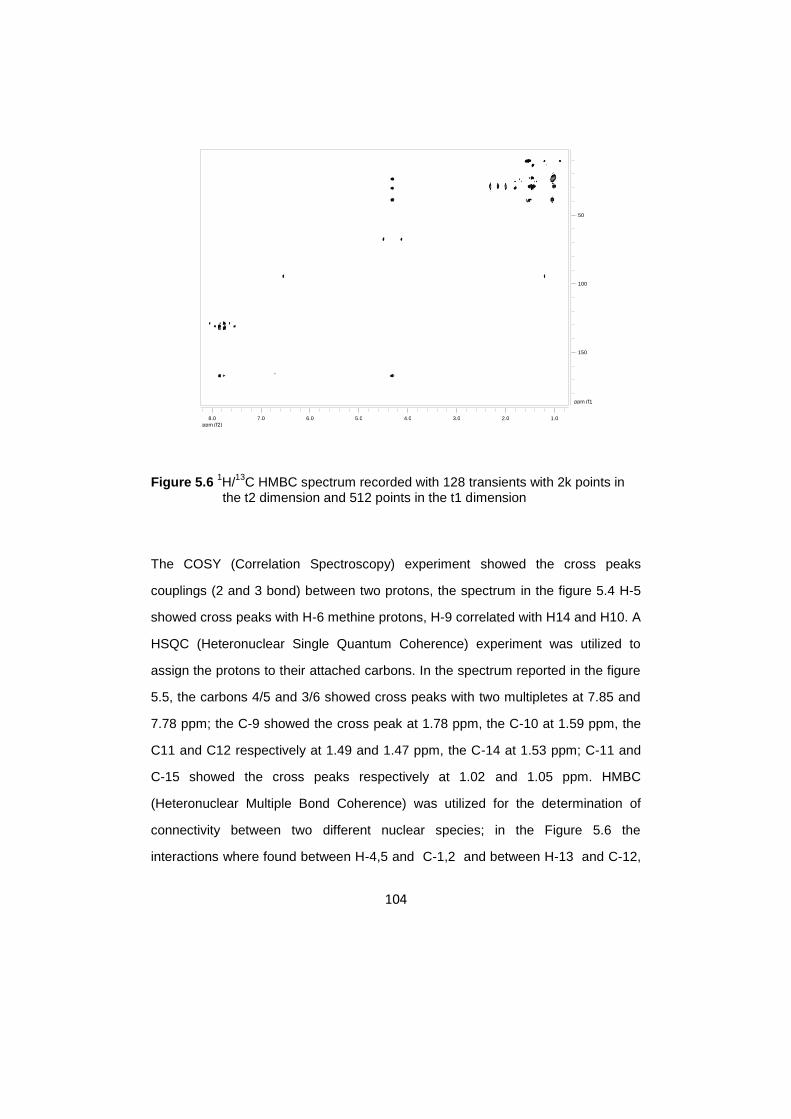
104
ppm (f2)
1.02.03.04.05.06.07.08.0
50
100
150
ppm (f1)
Figure 5.6 1H/
13C HMBC spectrum recorded with 128 transients with 2k points in
the t2 dimension and 512 points in the t1 dimension
The COSY (Correlation Spectroscopy) experiment showed the cross peaks
couplings (2 and 3 bond) between two protons, the spectrum in the figure 5.4 H-5
showed cross peaks with H-6 methine protons, H-9 correlated with H14 and H10. A
HSQC (Heteronuclear Single Quantum Coherence) experiment was utilized to
assign the protons to their attached carbons. In the spectrum reported in the figure
5.5, the carbons 4/5 and 3/6 showed cross peaks with two multipletes at 7.85 and
7.78 ppm; the C-9 showed the cross peak at 1.78 ppm, the C-10 at 1.59 ppm, the
C11 and C12 respectively at 1.49 and 1.47 ppm, the C-14 at 1.53 ppm; C-11 and
C-15 showed the cross peaks respectively at 1.02 and 1.05 ppm. HMBC
(Heteronuclear Multiple Bond Coherence) was utilized for the determination of
connectivity between two different nuclear species; in the Figure 5.6 the
interactions where found between H-4,5 and C-1,2 and between H-13 and C-12,

105
C-11 and between H-15 and between C-14 . All these correlation suggested that
the unknown molecule correspond to Bis-(2-ethylexil)Phthalate, an schematic
representation of the molecules is reported in Figure 5.7
Figure 5.7 The schematic representation of Bis-(2-ethylexyl)phthalate.
The complete assignment of the 13
C NMR and 1H signals of neat DEHP, which
result in good agreement with previous assignments (Cohen et al., 2001) is shown
in Table 5.1.

106
DEHP 13
C δ 1H δ
(ppm) (ppm)
1/2 132.8
4/5 128.98 7.85m
3/6 131.37 7.78m
7 167.37
8 67.52 4.33dd
4.30dd
9 38.78 1.78sept
10 29.68 1.59quad
11 23.38 1.49quint
12 22.64 1.47sest
13 13.66 1.02t
14 30.55 1.53sest
15 10.66 1.03t
Table 5.1 Complete assignment of 1H and
13C chemical shift for DEHP.
5.3 Origin of DEHP pollution
DEHP is commonly used as a plasticizer and is contained in the plastic materials
used in the synthesis, for this reason we have analyzed the plastic devices (flexible
tube and plastic container) used for the synthesis. In the Figure 5.8 the FT-IR
analysis of plastic devices in comparison with extract molecule and pure DEHP are
reported.

107
Figure 5.8 FT-IR spectra of extract molecule by Hy4, pure DEHP and plastic device as flexible tube and plastic containers.
The signal characteristic for DEHP at 1730 cm-1 which is attributing to the
carboxylic group is present in the FT-IR spectrum of flexible tube.
These results would suggest that DEHP migrates from the PVC tube into the
solution and is then taken up by hydrozincite during precipitation.
5.4 FT-IR study of hydrozincite synthesized in presence of
PVC
In order to test the reproducibility of DEHP uptake, hydrozincite was synthesized in
the presence of sliced flexible tubing sections (Hy5). As can be observed in the
FT-IR spectrum of the sample Hy5 signals attributed to DEHP are clearly visible
(Fig. 5.9); the spectrum of the Hy3 sample is shown for comparison. The
5001000150020002500300035004000
wave number (cm-1
)
Extract
DEHP
Flexible tube
Plastic container

108
experiment was repeated several times always giving the same result when the pH
of the solution was set at 6.8, which was found to be stable during the experiments.
Figure 5.9 FT-IR of synthetic hydrozincite Hy3, hydrozincite synthesized in presence of PVC slices (Hy5) and Hy5 after washing with acetone Hy5/1.
In order to evaluate whether the DEHP was only adsorbed by hydrozincite, the
sample Hy5 was washed with acetone at room temperature in a glass tube. The
FT-IR spectrum of the washed hydrozincite (Hy5/1) showed that the signal
intensities pertaining to DEHP were significantly reduced. However, as can be
observed from the signals attributed to C-H stretching vibration, some of the DEHP
remained. The absence of the signal attributed to the C=O stretching vibration is
evident.
5001000150020002500300035004000
wave number (cm-1
)
Hy3
Hy5
Hy5/1
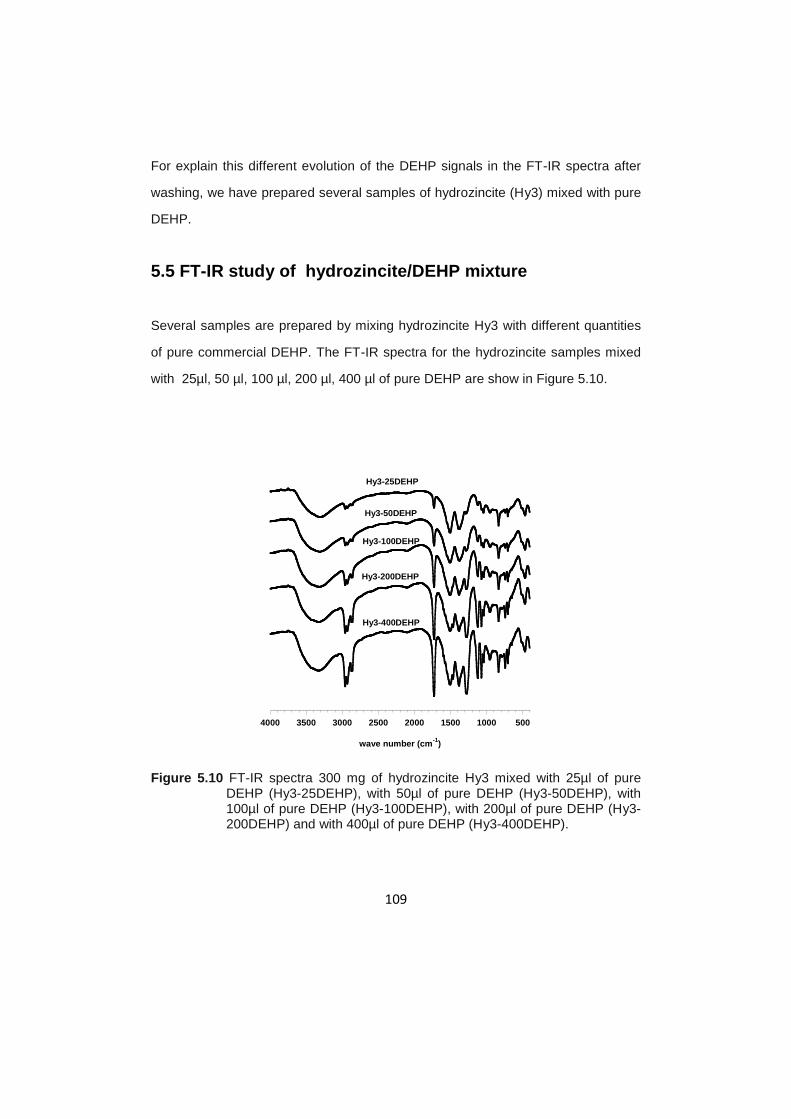
109
For explain this different evolution of the DEHP signals in the FT-IR spectra after
washing, we have prepared several samples of hydrozincite (Hy3) mixed with pure
DEHP.
5.5 FT-IR study of hydrozincite/DEHP mixture
Several samples are prepared by mixing hydrozincite Hy3 with different quantities
of pure commercial DEHP. The FT-IR spectra for the hydrozincite samples mixed
with 25µl, 50 µl, 100 µl, 200 µl, 400 µl of pure DEHP are show in Figure 5.10.
Figure 5.10 FT-IR spectra 300 mg of hydrozincite Hy3 mixed with 25µl of pure
DEHP (Hy3-25DEHP), with 50µl of pure DEHP (Hy3-50DEHP), with 100µl of pure DEHP (Hy3-100DEHP), with 200µl of pure DEHP (Hy3-200DEHP) and with 400µl of pure DEHP (Hy3-400DEHP).
5001000150020002500300035004000
wave number (cm-1
)
Hy3-25DEHP
Hy3-50DEHP
Hy3-100DEHP
Hy3-200DEHP
Hy3-400DEHP

110
The intensity of the signals in the region of C-H stretching (2800-3000 cm-1
) and
the signal of the C=O stretching at 1730 cm-1
increase with addition of DEHP. The
FT-IR spectra does not show any shift of the above mentioned signals, neither the
signals attribute to hydrozincite show broadening or shift.
5001000150020002500300035004000
wave number (cm-1
)
Hy5
Hy5/1
Hy3-25DEHP
Hy3-25DEHP/1
Hy3-400DEHP
Hy3-400DEHP/1
Figure 5.11 FT-IR spectra of Hy5, Hy5 after washing (Hy5/1), Hy3-25DEHP, Hy3-25DEHP after washing (Hy3-25DEHP/1), Hy3-400DEHP and Hy3-400DEHP after washing (Hy3-400DEHP/1).
The Figure 5.11 display the FT-IR spectra of Hy5, Hy5/1, Hy3-25DEHP,Hy3-
25DEHP/1, Hy3-400DEHP, Hy3-400DEHP/1. The samples Hy5/1, Hy3-25DEHP/1,
Hy3-400DEHP/1 were the samples washed with acetone. After washing (Hy3-
25DEHP/1 and Hy3-400DEHP/1) the FT-IR spectra showed that the intensity of the
C-H stretching signals and C=O signals decrease proportionally, but for the sample
Hy5 this proportionally is not respect, in fact after washing (Hy5/1) the FT-IR
present the signals for the C-H but is not present the C=O stretching.

111
This result indicates that the C=O stretching signal of the DEHP is broadened
beyond detection in the spectrum of Hy5/1, and this suggest that DEHP is strongly
bound to the hydrozincite, possibly through the C=O groups, when flexible tubing
is present during the hydrozincite synthesis (sample Hy5), while it shows a
weaker interaction with the surface of the hydrozincite when added to hydozincite
nanocrystals (sample Hy3-400DEHP).
For comparison the synthetic calcite has been prepared in the presence of flexible
tubing slices (Cal2). The FT-IR spectra are reported in Figure 5.12. The FT-IR
spectra are consistent with the previously reported spectra of pure calcite (White,
1974; Balmain et al., 1999; Cebeci and So¨nmez, 2004). Both spectra showed the
diagnostic and characteristic signals for the calcite at 1428, 878, and 714 cm-1
that correspond to the v2, v3 and v4 mode of vibration stretching. In the spectra
are present also the bands for the overtone of calcium carbonate at 2983, 2782,
2589, 2511 cm-1
and a broad band in the region of 3700-3100 cm
-1 attributable to
the stretching modes of structural water.
The spectrum for the calcite synthesized in the presence of flexible tubing slices
resulted indistinguishable from the calcite control spectra (Cal1). This result shows
no evidence of DEHP incorporation into calcite during growth, under the
experimental conditions used.

112
5001000150020002500300035004000
wave number (cm-1
Cal1
Cal2
Figure 5.12 FT-IR of synthetic calcite Cal1 and synthetic calcite synthesized in presence of PVC (Cal2).
5.6 13C MAS NMR investigation of hydrozincite/DEHP
NMR spectroscopy is well suited for the study of organic compound – solution or
organic compound adsorbed interaction because it is an element specific method
that is extremely sensitive to the electron density (shielding) near the nucleous of
interest. NMR techniques can be used to obtain a variety of information about an
adsorbed molecule, including mechanisms of adsorption and surface sites
involved, the dynamics (molecular diffusion, chemical exchange) of an adsorbed
molecule on a mineral surface (Fyfe, 1983). The 13
C NMR spectra of pure DEHP
(neat DEHP), hydrozincite in which 25 µl of neat DEHP was added to 300 mg of
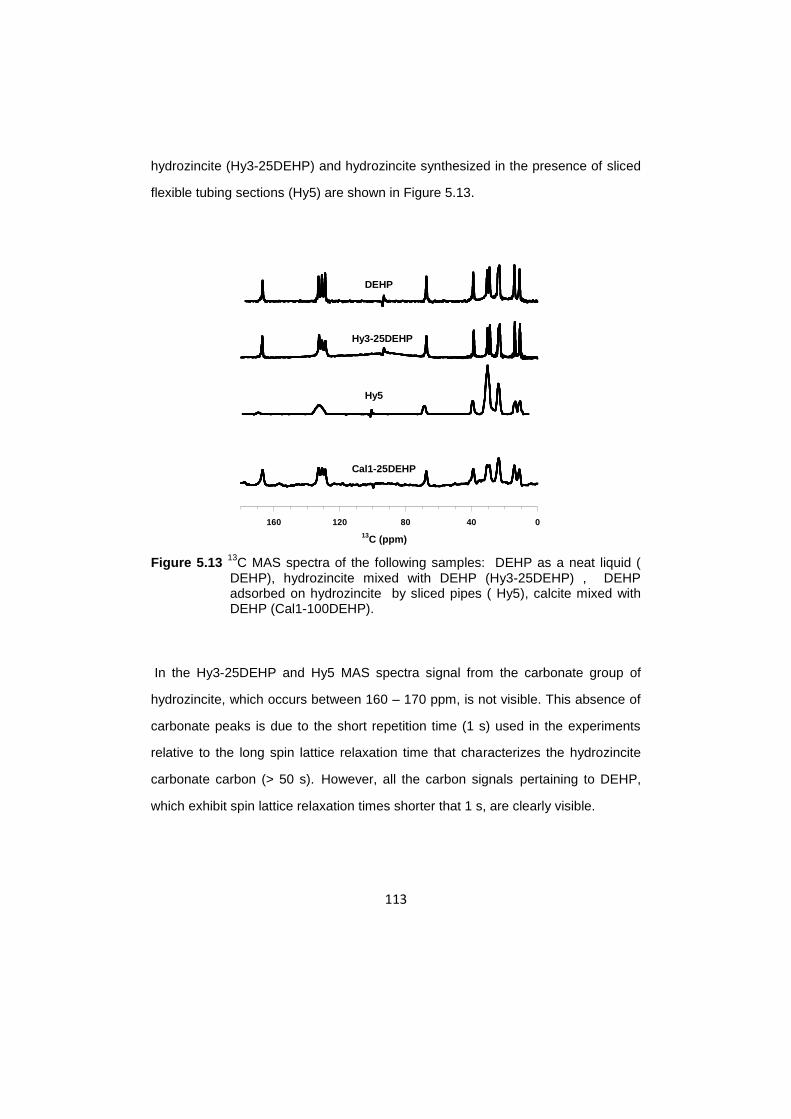
113
hydrozincite (Hy3-25DEHP) and hydrozincite synthesized in the presence of sliced
flexible tubing sections (Hy5) are shown in Figure 5.13.
Figure 5.13 13
C MAS spectra of the following samples: DEHP as a neat liquid ( DEHP), hydrozincite mixed with DEHP (Hy3-25DEHP) , DEHP adsorbed on hydrozincite by sliced pipes ( Hy5), calcite mixed with DEHP (Cal1-100DEHP).
In the Hy3-25DEHP and Hy5 MAS spectra signal from the carbonate group of
hydrozincite, which occurs between 160 – 170 ppm, is not visible. This absence of
carbonate peaks is due to the short repetition time (1 s) used in the experiments
relative to the long spin lattice relaxation time that characterizes the hydrozincite
carbonate carbon (> 50 s). However, all the carbon signals pertaining to DEHP,
which exhibit spin lattice relaxation times shorter that 1 s, are clearly visible.
04080120160
DEHP
Hy3-25DEHP
Hy5
Cal1-25DEHP
13C (ppm)

114
The most important differences concerning the 13
C NMR spectra of DEHP as a
neat liquid and DEHP in the Hy5 and Hy3-25DEHP samples are highlighted in the
following:
- 13
C spectrum of neat liquid DEHP taken without sample spinning (spinning
at 1 kHz did not change the quality of the spectrum) is shown in Figure
5.13 and the chemical shift values are listed in Table 5.1. The Full Width at
Half Maximum (FWHM) of the carbon signals of this sample range
between 0.82 ppm (C3/6) to 0.72 ppm (C7).
- 13
C MAS peaks of the aliphatic chains of DEHP mixed with hydrozincite
(Hy3-25DEHP) are very similar to those observed for neat liquid DEHP.
Slight differences were observed in the regions for C8, carboxyl and ring
carbons: the peaks for C8, carboxyl and ring carbons in the Hy3-25DEHP
MAS spectra are slightly broader (FWHM >1.0 ppm) and the carboxyl
signal is shifted 0.4 ppm downfield (Table 5.1).
- 13
C MAS spectrum of the Hy5 sample exhibits overlapping resonances and
a downfield shift of the aliphatic carbons (Fig. 5.13 and Table 5.1). The ring
carbons show only a single, unresolved broad peak (FWHM = 5.3 ppm)
shifted downfield (~3 ppm) and the carboxyl peak is also broadened
(FWHM > 3 ppm) and shifted downfield (3.5 ppm).

115
Carbon
type
13C (ppm)
DEHP Hy3-25DEHP Hy5a
1/2 Ring carbon 132.8 132.6
3/6 Ring carbon 130.7 130.9 132.6
4/5 Ring carbon 128.8 128.8
7 Carbonyl
group
166.7 167.2 169.5
8 Methylene
group
67.4 67.4 67.7
9 Methyne
group
38.8 38.8 39.4
10 Methylene
group
28.9 28.9 30.4
11 Methylene
group
23.9 23.9
23.7
12 Methyl group 23.0 23.0
13 Methyl group 10.8 10.8 11.0
14 Methylene
group
30.4 30.4 30.5
15 Methyl group 13.9 13.9 13.9
Table 5.2 13
C chemical shift (ppm) for DEHP, Hy3-25DEHP and Hy5 taken from the MAS NMR spectra. a) The
13C chemical shifts are reported as the
medium position of the overlapped signals.

116
It is important to observe that the C7 carboxyl carbon in Hy5 sample is ~3 ppm
shifted respect the pure DEHP and Hy3-DEHP. At the same time some others
carbons (3/6 and 4/5 ring carbons between 2 and 3.8 ppm; C9 ~0.6 ppm and C10
~1.4 ppm) close to the C7 show significant shifts. This would suggest that the C=O
group of DEHP is in close contact with the surface of the mineral.
The 13
C MAS spectrum of a calcite sample in which 100 µl of neat DEHP was
added to 300 mg of calcite (Cal1-100DEHP) is also shown in Figure 5.13. The
carbon signals of this sample did not show chemical shift variations compared to
those of neat DEHP, but the signals appear broader. No 13
C MAS signal was
observed from a calcite sample precipitated in the presence of sliced tubing
sections (data not show). This observation would suggest that the DEHP released
by the PVC slices is not strongly adsorbed at the surface of the calcite and
consequently it is not incorporated during crystal growth.
5.7 13C CPMAS NMR investigation on hydrozincite /DEHP
Additional information can be obtained from the analysis of the 13
C CPMAS
spectra. Cross-polarization is a method of signal enhancement, whereby energy is
transferred from abundant spins (1H) to the rare spins (
13C). For the
1H–
13C CP
experiment, the efficiency of polarization transfer depends on the strength of the
static dipolar interaction between 1H and
13C spins, which is determined by the
number of protons directly bound to the carbons or close to them and the 1H–
13C
internuclear distances (<10 Å). Effective intermolecular CP transfer also requires
molecular rigidity, being hindered by molecular motions in the kilohertz range.
(Fyfe, 1980; Demco et al., 1975; Hoffmann and Mayer, 1999).

117
04080120160
13C (ppm)
Hy3
Hy3-25DEHP
Hy5
Figure 5.14 13
C CPMAS NMR spectra of the following samples: pure hydrozincite (Hy3) hydrozincite mixed with DEHP (Hy3-25DEHP), DEHP adsorbed on hydrozincite by sliced pipes (Hy5).
The Figure 5.14 shows the 13
C CPMAS NMR spectrum of the Hy3, Hy3-25DEHP
and Hy5 samples collected with 8 ms contact time. No 13
C CPMAS NMR signal of
DEHP as a neat liquid is observed at any contact time, owing to molecular
tumbling. The CPMAS spectrum of the Hy3 sample shows overlapping signals in
the 162 – 169 ppm range, whose main peak appears at ~163.8 ppm. These signals
are attributed to the carbonate group of hydrozincite, despite the fact that the
carbonate in this mineral has only one crystallographic position in the ideal
structure (De Giudici et al., 2009; Ghose, 1964) as described in the chapter IV.
These additional peaks have been ascribed to the presence of lattice defects,
namely grain boundaries and stacking faults that lower the crystal order in these

118
hydrozincite nanocrystals (Giudici et al., 2009). This feature is not changed in the
CPMAS spectra of the Hy3-25DEHP and Hy5 samples as shown in Figure 5.14.
Carbon signals attributed to DEHP are observed in CPMAS spectra of the Hy3-
25DEHP and Hy5 samples, which show that this molecule behaves like a solid. As
shown in Figure 5.14, the aliphatic region (5-50 ppm) of the Hy3-25DEHP sample
presents the same features as observed in the Hy3-25DEHP MAS spectrum,
whereas the C8, the C4,5 and C3,6 carbons are broadened (FWHM >1.4 ppm).
The signal attributed to the ring C1,2 carbons is not observed, probably due to
extreme broadening. The signal of the carboxyl group cannot be observed because
it is buried under the hydrozincite carbonate peaks.
As observed for the Hy3-25DEHP sample, the 13
C CPMAS signals of the aliphatic
region (5-50 ppm) of the Hy5 sample are also similar to those in the corresponding
MAS spectrum. Differences are observed for the other carbon signals: the C8 peak
disappears and those for the ring carbons are broad, as observed in the MAS
spectrum. The carboxyl signal cannot be detected because it is buried below the
hydrozincite carbonate peaks as stated for the Hy3-25DEHP sample. The behavior
of the C=O, the C8 and the ring carbon resonances in the Hy5 sample is indicative
of binding of the DEHP with hydrozincite, in agreement with the FT-IR results, and
further suggests that these carbons are closest to the coordinating atoms. These
data suggest that DEHP migrates from the PVC tubing, where it is bound by
complex formation of the type >C=O::::H-CH2-Cl (Baijayantimala and
Swaminathan, 1996), to hydrozincite where it is incorporated between the
crystallites during hydrozincite crystallization. At the same time the complex
overlapping signals of aliphatic chains suggest the presence of significant structural
disorder. Different modes of binding may occur at the hydrozincite surface. This
consideration is in agreement with the observation of Phillips et al., (Phillips et al.,

119
2005) of broad peaks in 13
C CPMAS NMR spectra of citrate coprecipitated with
calcite which indicates multiple conformations of citrate with the calcite.
Signals from DEHP are absent in the 13
C CPMAS spectrum Cal1-25DEHP and in
the spectrum of the calcite sample precipitated in the presence of sliced PVC
tubing sections (data not shown). The absence of CPMAS signal from the Cal1-
25DEHP sample suggests that the DEHP is too mobile to cross-polarize and has a
low affinity for binding at surface Ca sites compared to DEHP interacting with
surface Zn sites in Hy3-25DEHP.
5.8 13C CPMAS NMR experiments with different contact
times
The CP technique is based on heteronuclear dipolar interaction, it is sensitive to
internuclear dipolar interaction, to internuclear distance and to the mobility of
molecules or functional groups involved (Kolodziejski and Klinowski, 2002). This
means that CP can be used to establish the connectivity between coupled nuclei
and to monitor molecular dynamics in solids, a very useful feature in the structural
determination. To gain such information it is indispensable to measure the spin
lattice relaxation time in the rotating frame, T1ρ, and the cross-polarization time
(TCH). Variable contact time CP experiments allow simultaneous monitoring of TCH
and T1ρ. However these experiments require spectra with a good signal/noise ratio,
which is not our case. In fact, as it is observed in the Figure 5.14 using the 13
C
natural abundance the ratio signal/noise is poor. To perform such experiments we
should have to use 13
C labeled DEHP. Moreover important information, although
qualitative, can be obtained by collecting the spectra with few contact times.
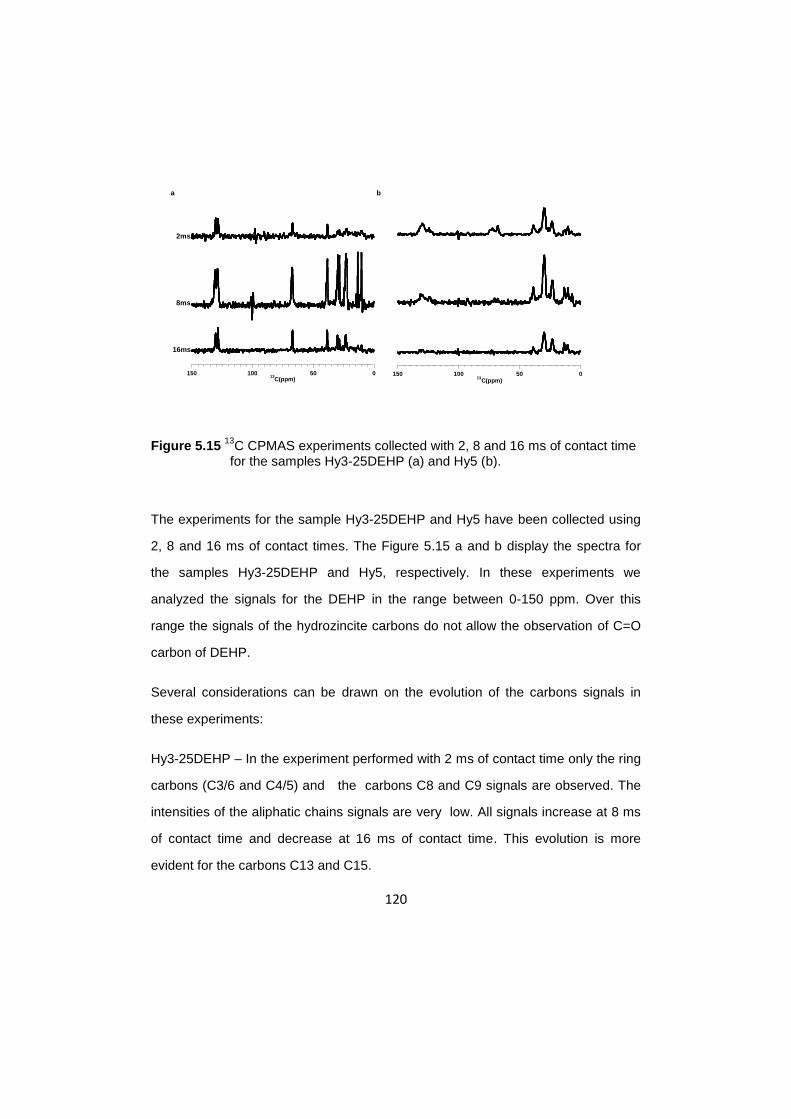
120
Figure 5.15 13
C CPMAS experiments collected with 2, 8 and 16 ms of contact time for the samples Hy3-25DEHP (a) and Hy5 (b).
The experiments for the sample Hy3-25DEHP and Hy5 have been collected using
2, 8 and 16 ms of contact times. The Figure 5.15 a and b display the spectra for
the samples Hy3-25DEHP and Hy5, respectively. In these experiments we
analyzed the signals for the DEHP in the range between 0-150 ppm. Over this
range the signals of the hydrozincite carbons do not allow the observation of C=O
carbon of DEHP.
Several considerations can be drawn on the evolution of the carbons signals in
these experiments:
Hy3-25DEHP – In the experiment performed with 2 ms of contact time only the ring
carbons (C3/6 and C4/5) and the carbons C8 and C9 signals are observed. The
intensities of the aliphatic chains signals are very low. All signals increase at 8 ms
of contact time and decrease at 16 ms of contact time. This evolution is more
evident for the carbons C13 and C15.
05010015013
C(ppm)
2ms
8ms
16ms
a
05010015013
C(ppm)
b

121
Hy5 – the CPMAS spectra collected with 2, 8, 16 ms of the Hy5 sample show
broad signal as reported before. The intensity of the ring carbons and C8 and C9
decrease at 8 ms and disappear at 16 ms, while the aliphatic carbons show similar
evolution as observed in the Hy3-25DEHP.
The behavior of the C8 and the ring carbon resonances in the Hy5 sample, when
compared to the behavior of the same signals in the Hy3-25DEHP, is indicative of
reduced mobility and/or of a stronger 1H-
13C hetero nuclear dipolar coupled
network, thus suggesting that those atoms are the most involved in the interaction
with the mineral. The aliphatic chains display slower CP kinetics in both samples
denoting a lower rigidity of this portion of the molecules of DEHP. The non-rigid
environment and inefficient cross-polarization have been observed previously for
organic molecules intercalated in smectite (Corrado et al., 1990; O’Brein et al.,
1991) and for the adsorbed pyridine on clay minerals (Ukrainczyk and Smith,
1996). These results, which are in good agreement with the FT-IR, 13
C MAS and
CPMAS results, confirm that the portion of the molecule including the carboxyl
group of DEHP, in the sample Hy5, is strictly bound to the surface of hyrozincite.
5.9 1H MAS information
Further experiments were carried out on Hy3-25DEHP and Hy5 samples in order to
investigate the surface of the hydrozincite mineral, through the 1H resonance of
water and DEHP molecules. The mobility of a pollutant molecule at the surface of
solid matrix can be assessed, as reported in the literature, also with 1H MAS
experiments that are very promising in differentiating molecular species according
to their degree of mobility in solids (Chamignon et al., 2004).
In the Figure 5.18 the 1H MAS spectra of Hy3-25DEHP and Hy5 are reported.
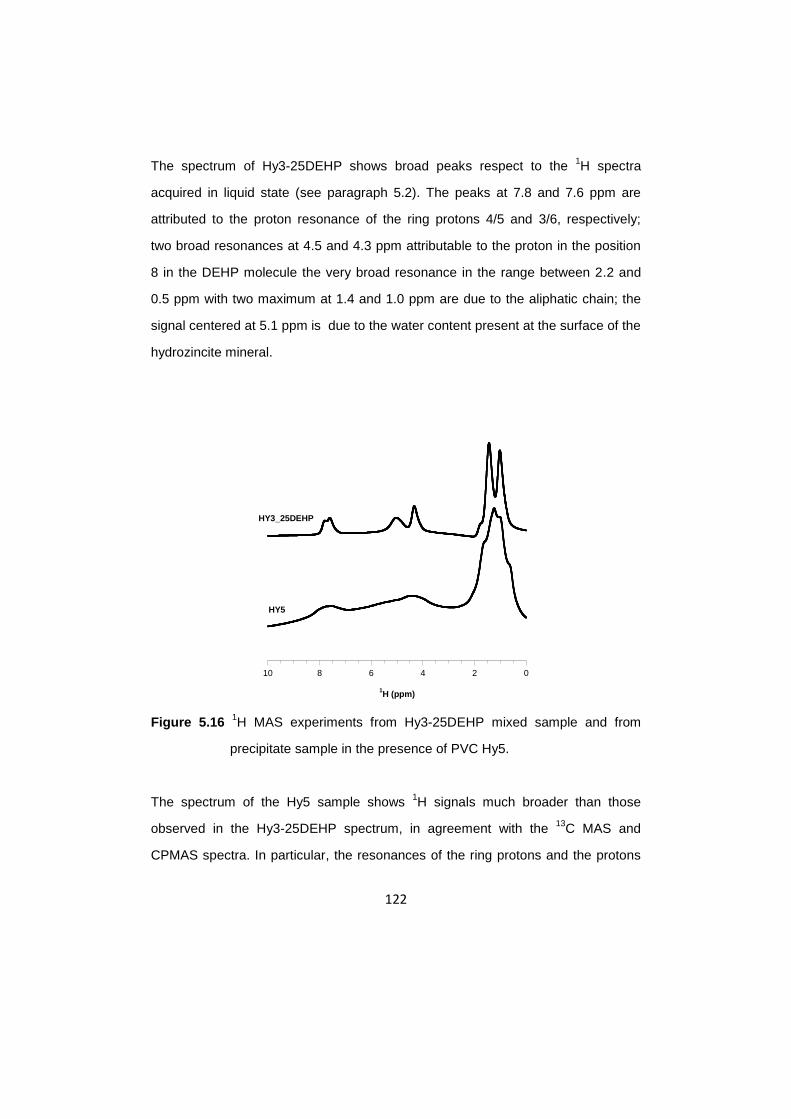
122
The spectrum of Hy3-25DEHP shows broad peaks respect to the 1H spectra
acquired in liquid state (see paragraph 5.2). The peaks at 7.8 and 7.6 ppm are
attributed to the proton resonance of the ring protons 4/5 and 3/6, respectively;
two broad resonances at 4.5 and 4.3 ppm attributable to the proton in the position
8 in the DEHP molecule the very broad resonance in the range between 2.2 and
0.5 ppm with two maximum at 1.4 and 1.0 ppm are due to the aliphatic chain; the
signal centered at 5.1 ppm is due to the water content present at the surface of the
hydrozincite mineral.
Figure 5.16 1H MAS experiments from Hy3-25DEHP mixed sample and from
precipitate sample in the presence of PVC Hy5.
The spectrum of the Hy5 sample shows 1H signals much broader than those
observed in the Hy3-25DEHP spectrum, in agreement with the 13
C MAS and
CPMAS spectra. In particular, the resonances of the ring protons and the protons
0246810
1H (ppm)
HY3_25DEHP
HY5

123
in the position 8 in the DEHP molecule are particularly broad. It is remarkable the
broadening of the proton resonance (~5 ppm) attributed to the water molecules at
the hydrozincite surface.
MAS NMR signals basically reflect the degree of mobility of the species loaded
onto the surface of a solid matrix: very mobile molecules give narrow signals, close
to those of liquid-state NMR spectra. In contrast, when the strength of the
interaction increases, the signals are broader. In this way, it is possible to
differentiate adsorbed versus incorporated DEHP. Similar examples are reported
in literature for the study of 4-chloro-2-methylphenoxyacetic acid in clays
(Combourieu et al., 2001).
Thus, it appears that the 1H MAS NMR is suitable to discriminate different species
(mobile and immobile) of a DEHP loaded onto the surface of hydrozincite. From
these considerations it is evident that DEHP molecules in the Hy3-25DEHP are
weakly-bound to the surface of the hydrozincite. On the contrary, the results clearly
show that, in the Hy5 sample, the DEHP molecules are strongly bound or
incorporated between the hydozincite nanoparticles.
5.10 X-Ray Diffraction complementary information
The structural differences between synthetic hydrozincite Hy3 and synthetic
hydrozincite synthesized in the presence of PVC slices Hy5 have been investigated
by XRD diffraction. The XRD patterns of the two samples are reported in Figure
5.17. Both XRD patterns exhibit Bragg reflections that can be indexed as
hydrozincite single phase with a monocline structure, according to experimental
(PDF Card 19-1458) and calculated (PDF 72-1100) references patterns.

124
Figure 5.17 XRD patterns of Hy3 and Hy5.
The XRD patterns do not reveal important modification of mineral structures for
Hy5 compared with the Hy3, and this result is in agreement with the NMr and FTIR
evidences. Slight differences might be observed in the peak positions. In the
pattern of Hy5 sample, compared with Hy3, a small shift to a lower value is
observable for the peak (200) [2theta=12.97° for Hy3 and 12.87° for Hy5]. This
results in a low increase of the d-spacing for this reflection. However, the (020) and
(021) reflections show a small shift to higher values that are correlated with a
decrease of the d-spacing for these reflections. This might be an evidence for the
intercalation of DEHP in hydrozincite structure, although these changes are not
very evident, this can be due at the low concentration of DEHP in Hy5 sample. In
fact, in the literature, significant variations in XRD patterns for intercalated
molecules are reported for high concentration of intercalated molecules
(Chamignon et al., 2004).
10 20 30 40 50 60 70 80
2 theta
Hy3
Hy5
(20
0)
(03
1)
(02
1)
(02
0)
(51
0)

125
All diffraction peaks are slightly broad in the HY5 sample; the broadening can be
ascribed to the presence of DEHP with consequent increase of disorder in the
structure, and this is in agreement with the previous 13
C MAS measurements.
5.11 Conclusions
The interaction of Bis-(2-ethylhexil)phthalate (DEHP) with hydrozincite
[Zn5(CO3)2(OH)6], under controlled laboratory experiments, was investigated by
using Fourier Transform Infrared (FT-IR), Nuclear Magnetic Resonance
Spectroscopy (NMR) and X-ray Diffraction (XRD).
Our results from FT-IR and solid state 13
C NMR indicate that DEHP released from
flexible PVC tubing is bound to the hydrozincite structure during crystallization.
Under our experimental conditions the hydrozincite contains about ~10% (w/w)
DEHP taken up from the tubing. 13
C MAS and CPMAS NMR spectra reveal that
the chemical shift, the intensity and the line width of DEHP carboxylic group and
the ring carbons are greatly affected. These data suggest that the carboxyl head
group is directly involved in the binding to hydrozincite. At the same time, the
observed broad and overlapping aliphatic carbon signals of DEHP, is indicative of
structural disorder. Overall these results would suggest that DEHP is sequestered
from the tubes and incorporated at the hydrozincite nanoparticles surface during
the crystallization. In contrast, 13
C MAS and CPMAS NMR data show that DEHP is
not incorporated in calcite precipitated in the presence of flexible tubing. XRD
results are also consistent with an increase of structural disorder in hydrozincite
structure caused by the presence of DEHP, in agreement with the 13
C MAS
measurements.
This result suggests a specific interaction between DEHP and surface Zn-centers
is responsible for the strong uptake of DEHP by hydrozincite.

126
5.12 References

127
Baijayantimala, G., and Swaminathan, S. Study of Polymer−Plasticizer Interaction
by 13
C CP/MAS NMR Spectroscopy: Poly(vinyl chloride)−Bis(2-ethylhexyl)
Phthalate System. Macromolecules, 29, 185-190 (1996).
Balmain, J., Hannoyer, B., Lopez, E. Fourier transform infrared spectroscopy
(FTIR) and X-ray diffraction analyses of mineral and organic matrix during
heating of mother of pearl (nacre) from the shell of the mollusc Pinctada
maxima. J. Biom. Mat. Res. B, 48, 749–54 (1999).
Cebeci, Y., and Sonmez, I. A study on the relationship between critical surface
tension of wetting and oil agglomeration recovery of calcite. J. Coll. Int. Sci.,
273, 300-305 (2004).
Chamignon, C., Haroune, N., Forano, C., Delort, A.-M., Besse-Hoggan, P.
Combourieu, B. Mobility of organic pollutants in soil components.What role can
magic angle spinning NMR play? Eur. J. Soil Sci., 59, 572–583 (2008).
Cohen, H., Charrier, C., Sarfaty, J. Extraction and Identification of a Plasticizer, Di-
(2- ethylhexyl)phthalate, from a Plastic Bag Containing Contaminated Corn.
Arch. Environ.Contain. Toxicol., 20, 437-440 (1991).
Combourie, B., Inacio, J., Delort, A.M., Forano, C. Differentiation of mobile and
immobile pesticides on anionic clays by 1H HR MAS NMR spectroscopy.
Chem. Comm., 21, 2214–2215 (2001).
Corrado, K.A., Hayatsu, R., Botto, R.E., Winans, R.E. Reactivity of anisoles on clay
and pillared clay surfaces. Clay and clay miner., 38, 250 (1990).
De Giudici, G., Podda, F., Sanna, R., Musu, E., Tombolini, R., Cannas,
C., Musinu,
A., Casu, M. Structural properties of biologically controlled hydrozincite: a
HRTEM and NMR spectroscopic study. Amer. Mineral., 94, 1698-1706 (2009).
Demco, D. E., Tegenfeldt, J., Waugh, J. S. Dynamics of cross relaxation in nuclear
magnetic double resonance. Phys. Rev., 11, 4133 (1975).

128
Fyfe, C.A., Solid State NMR for Chemists. C.F.C. Press: Guelph, Ontario, Chapter
1 (1983).
Fyfe, C.A., Solid State NMR for Chemists. Guelph University Press. Guelph,
Canada (1980).
Ghose, S. The crystal structure of hydrozincite, Zn5(OH)6(CO3)2. Acta Crystallog.,
17, 1051-1057 (1964).
Hales M., and Frost R. Synthesis and vibrational spectroscopic characterisation of
synthetic hydrozincite and smithsonite. Polyhedron, 4955-4962 (2007).
Hoffmann, D., and Mayer, C. Cross polarization induced by temporary adsorption:
NMR investigations on nanocapsule dispersions. J. Chem. Phys., 112, 4242-
4250 (1999).
Kolodziejski, W., Klinowski, J. Kinectics of Cross Polarization in Solid State NMR: a
guide for chemist. Chem. Rev., 2002, 102, 613-628.
Music, S., Popovic, S., Maljkovic, M., Dragcevic, D. Influence of synthesis
procedure on the formation and properties of zinc oxide. J. Alloys Compd.,
347, 324–332 (2002).
O’Brein, P., Williamson, C.J., roombridge, C. J. Multinuclear solid-state MAS and
CP-MAS NMR study of the binding of triethyl phosphate to a montmorillonite
Chem. Mater. 3, 276 (1991).
Ukrainczyk, L. and Sm,ith, K. A. Solid State 15
N NMR study of pyridine adsorption
on clay minerals. Environ.Sci.Technol. ,30, 3167-3176 (1996).
White, W.B. The carbonate minerals. In V.C. Farmer, Ed., The infrared spectra of
minerals, p.227-279. Mineralogical Society Monograph, London (1974).
General considerations

129
Materials have played an important role in our civilization, embedding our political
history and culture. Historian have used the state of materials technology as
nomenclature for various periods mankind’s history (e.g., stone, bronze and iron)
but the field of Material Science and Engineering began to be considered its own
discipline around the mid 1960’s. The advancement in human history can be traced
by the progress in materials processing techniques, from the development of the
Damascus steel used to produce unrivaled weaponry, to the refinement of silicon
for computer chips in modern computer systems. Yet, towards the end of the 20th
century, it was discovered that while mankind had indeed advanced in the
development of technology, there were still lessons that could be learned from
Nature. Scientist and engineers have long envied Nature’s ability to design
crystalline structures whose properties are often superior to those of similar
synthetic materials. The work contained whiting this dissertation can be considered
a piece of knowledge which can contribute in understanding the complex world of
biomineralization and the reactivity of minerals. Finally, the mechanism governing
the hydrozincite biomineral formation at the molecular level is not yet understood.
The role of organic matter in the biomineralization requires further investigation.
Despite this, the information acquired in this PhD period about the morphology,
structure and organic matter present in the hydrozincite biogenic formation will be
used for modeling the mechanism formation of biominerals and for the prediction of
their reactivity and stability under specific environmental conditions.
Further studies are required to examine the stability, strength and geometry of the
interaction between DEHP molecule and hydrozincite surfaces and to assess
whether nanocrystalline hydrozincite can be regarded as an effective sorbent that
incorporates DEHP for the use in remediation strategies under different
environmental conditions.

130
Appendix

131
PDF Card 19-1458 Wavelength = 1.54056Å

132
PDF Card 72-1100 Wavelength = 1.54056Å

133
PDF Card 19-1458 Wavelength = 0.70930 Å

134
PDF Card 72-1100 Wavelength = 1.54056 Å

135
Scientific Pubblications
1) Giovanni De Giudici, Francesca Podda, Roberta Sanna, Elodia Musu, Riccardo
Tombolini, Carla Cannas, Anna Musinu and Mariano Casu; Structural properties of
biologically controlled hydrozincite: a HRTEM and NMR spectroscopic study.
Am.Miner. , 94 (11), pp 1698-1707 (2009).
2) Carla Cannas, Anna Musinu, Andrea Ardu, Federica Orru’, Davide Peddis,
Mariano Casu, Roberta Sanna, Fabrizio Angius, Giacomo Diaz and Giorgio
Piccaluga. CoFe2O4 and CoFe2O4/SiO2 Core/Shell Nanoparticles: Magnetic and
Spectroscopic Study. Chem. Mater., 22 (11), pp 3353–3361 (2010).
3) Giuseppina Marras, Anna Musinu, Roberta Sanna. L’uso di “malta” in età
nuragica. In press In Atti XLIV Riunione Scientifica in Sardegna-II (2011).
4) Carla Mura, Donatella Valenti, Costantino Floris, Roberta Sanna, Maria
Antonietta De Luca, Anna Maria Fadda, and Giuseppe Loy. Metronidazole
prodrugs: synthesis, physicochemical properties, stability, and ex vivo release
studies. Submitted to European Journal of Pharmaceutical Chemistry.
5) Roberta Sanna, Mariano Casu, Costantino Floris, Francesca Podda, and
Giovanni De Giudici. A FTIR and solid state 13
C NMR study of the adsorption of
bis-(2-ethylhexil)Phthalate on hydrozincite. In preparation.
6) Martina Pilloni, Guido Ennas, Mariano Casu, Anna Maria Fadda, Francesca
Frongia, Francesca Marongiu, Roberta Sanna, Alessandra Scano, Donatella

136
Valenti, Chiara Sinico. Caffeine Silica Nanocomposites: effect of inclusion
in silica matrix. In preparation.