Dortmund Data Bank (DDB) · DDB SP - Dortmund Data Bank Software Package 2014 This document tries...
135
Dortmund Data Bank (DDB) Retrieval, Display, Plot, and Calculation Tutorial and Documentation DDBSP – Dortmund Data Bank Software Package DDBST Software & Separation Technology GmbH Marie-Curie-Straße 10 D-26129 Oldenburg Tel.: +49 441 361819 0 Fax: +49 441 361819 10 E-Mail: [email protected] Web: www.ddbst.com
Transcript of Dortmund Data Bank (DDB) · DDB SP - Dortmund Data Bank Software Package 2014 This document tries...

Dortmund Data Bank (DDB)Retrieval, Display, Plot, and Calculation
Tutorial and Documentation
DDBSP – Dortmund Data Bank Software Package
DDBST Software & Separation Technology GmbH
Marie-Curie-Straße 10
D-26129 Oldenburg
Tel.: +49 441 361819 0
Fax: +49 441 361819 10
E-Mail: [email protected]
Web: www.ddbst.com

DDBSP - Dortmund Data Bank Software Package 2014
Content1 Introduction...................................................................................................................................................................5
2 Starting the Dortmund Data Bank Retrieval Program...................................................................................................7
3 Searching.......................................................................................................................................................................9
3.1 Building a Simple Systems Query.........................................................................................................................9
3.2 Building a Query with Component Lists.............................................................................................................11
3.3 Examining Further Query List Functionality......................................................................................................12
3.4 Import Aspen Components.................................................................................................................................15
3.5 Searching for the Data Sets of a Reference.........................................................................................................17
3.6 Search Data Sets by Data Set or Reference Numbers.........................................................................................18
3.7 Searching Data Sets With Specified Pure Component Properties......................................................................19
3.8 Searching Vapor-Liquid and Solid-Liquid Equilibria with Specified Temperatures and Pressures...................22
3.9 Selectivity Search................................................................................................................................................23
3.10 Search Options..................................................................................................................................................25
3.10.1 Data Banks Preselection...........................................................................................................................25
3.10.2 Pure Component Properties Preselection..................................................................................................26
3.10.3 Extended Database Properties..................................................................................................................27
3.10.4 Configurations..........................................................................................................................................27
3.10.5 Other Search Options................................................................................................................................28
3.10.5.1 Salt Solubilities – Handling of Precipitated Components................................................................28
3.10.5.2 Demo Data Sets................................................................................................................................28
3.10.5.3 Expand PCP Data Sets Containing Multiple Properties...................................................................28
4 Exploring the Data Bank – Statistics...........................................................................................................................29
4.1 DDB Statistics.....................................................................................................................................................29
4.2 Journals and Data Sets per Year.........................................................................................................................31
4.2.1 Data Sets per Year......................................................................................................................................31
4.2.2 Journals.......................................................................................................................................................32
4.2.3 References per Year....................................................................................................................................33
5 A First Look at Predictions..........................................................................................................................................34
6 Using and Understanding the Query Result Window..................................................................................................37
6.1 File Menu............................................................................................................................................................38
6.2 Edit Menu...........................................................................................................................................................40
7 Saving and Loading Data Files....................................................................................................................................42
7.1 Open Files...........................................................................................................................................................42
7.2 Save File..............................................................................................................................................................43
7.3 Drag and Drop Files............................................................................................................................................44
8 Exploring the Data Set List Grid.................................................................................................................................45
9 Displaying Sub Lists....................................................................................................................................................48
10 Single Data Set Display.............................................................................................................................................49
11 Data Set Display Options..........................................................................................................................................52
11.1 Display Additional Information........................................................................................................................52
11.2 Query Result Options........................................................................................................................................56
12 Compact Data Display...............................................................................................................................................58
13 Units..........................................................................................................................................................................59
13.1 Mixture Data Banks – Compositions................................................................................................................59
13.2 Mixture Data Banks – Properties......................................................................................................................59
13.3 Pure Component Properties..............................................................................................................................60
14 Consistency Tests......................................................................................................................................................61
14.1 Point-to-Point Test............................................................................................................................................61
Dortmund Data Bank Page 2 of 135

DDBSP - Dortmund Data Bank Software Package 2014
14.2 Area Test...........................................................................................................................................................62
14.2.1 Isothermal data..........................................................................................................................................62
14.2.2 Isobaric data..............................................................................................................................................63
14.3 Automatic Tests................................................................................................................................................63
14.4 Othmer-Tobias and Hand Correlations.............................................................................................................64
14.4.1 Othmer-Tobias Tie Line Correlation........................................................................................................64
14.4.1.1 Equation...........................................................................................................................................64
14.4.2 Hand Tie Line Correlation........................................................................................................................65
14.4.2.1 Equation...........................................................................................................................................65
14.4.2.2 Example Data...................................................................................................................................66
15 Modifying and Editing Datasets................................................................................................................................68
15.1 Editing Experimental Data................................................................................................................................68
15.2 Specifying Quality and Data Source.................................................................................................................68
15.3 Evaluate Azeotropy...........................................................................................................................................69
15.4 Change LEAR Number.....................................................................................................................................71
15.5 Edit Comment...................................................................................................................................................71
15.6 Append Comment.............................................................................................................................................72
15.7 Change Component Order................................................................................................................................72
15.8 Add/Modify Extended References....................................................................................................................72
15.9 Convert GLE Data Sets to HPV Data Sets........................................................................................................72
15.10 Convert HPV Data Sets to VLE Data Sets......................................................................................................73
15.11 Convert VLE/HPV TPxy to Pxy(T) Datasets and Txy(P) Datasets................................................................73
15.12 Split VIS Datasets (Isoplethic Ranges, Marked Sets).....................................................................................73
15.13 Create gE Model Interaction Parameters........................................................................................................73
15.14 Apelblat Correlation........................................................................................................................................74
16 Converting Data Sets to ELE Data Sets....................................................................................................................76
17 Query Result Statistics..............................................................................................................................................77
17.1 Summary...........................................................................................................................................................77
17.2 Systems List......................................................................................................................................................79
17.3 Triangle for Binary Systems.............................................................................................................................79
18 Predict.......................................................................................................................................................................80
18.1 ACM.................................................................................................................................................................80
18.2 ACT..................................................................................................................................................................81
18.2.1 Selectivity Calculation..............................................................................................................................82
18.3 AZD..................................................................................................................................................................83
18.4 ELE...................................................................................................................................................................85
18.5 GLE...................................................................................................................................................................86
18.6 HE.....................................................................................................................................................................86
18.7 VLE/HPV..........................................................................................................................................................87
18.7.1 Predict with EOS......................................................................................................................................89
18.7.2 Prediction by Aspen or PRO/II Projects or by “Extension”.....................................................................89
18.7.3 Calculation of the Solubility of Solids in Supercritical Fluids..................................................................90
18.7.4 Deviation Plot...........................................................................................................................................91
18.7.5 Phase Envelope Calculation.....................................................................................................................92
18.7.5.1 Options.............................................................................................................................................92
18.8 LLE...................................................................................................................................................................94
18.9 PCP...................................................................................................................................................................95
18.10 POW...............................................................................................................................................................96
18.11 SLE.................................................................................................................................................................97
18.12 VE...................................................................................................................................................................98
18.13 VIS..................................................................................................................................................................99
Dortmund Data Bank Page 3 of 135

DDBSP - Dortmund Data Bank Software Package 2014
18.14 Entering gE Model Parameters.......................................................................................................................99
18.15 Checking Availability of Model Parameters.................................................................................................102
18.16 Using Aspen Projects....................................................................................................................................103
18.17 PRO/II Calculations......................................................................................................................................105
18.17.1 Introduction..........................................................................................................................................105
18.17.2 Step 1: Read Components from a PRO/II Database File......................................................................105
18.17.3 Step 2: Search for Experimental Data in the DDB...............................................................................107
18.17.4 Step 3: Calculate VLE Using the PRO/II Thermodynamics.................................................................108
19 Fit Equation Parameters..........................................................................................................................................111
19.1 AAE................................................................................................................................................................111
19.2 CPE, VE, HE, VIS..........................................................................................................................................111
19.2.1 Redlich-Kister.........................................................................................................................................111
19.2.2 Sum of Symmetrical Functions...............................................................................................................112
19.3 GLE.................................................................................................................................................................114
19.4 LLE.................................................................................................................................................................114
19.5 PCP.................................................................................................................................................................116
19.6 SLE.................................................................................................................................................................117
19.7 VLE/HPV........................................................................................................................................................118
20 Simultaneous Fit – RecVal/3...................................................................................................................................121
21 Simultaneous Fit – RecPar......................................................................................................................................123
22 Plot..........................................................................................................................................................................124
23 Data Export.............................................................................................................................................................125
23.1 PPDX format...................................................................................................................................................125
23.2 Aspen INP Format..........................................................................................................................................128
23.3 Data Points Export..........................................................................................................................................132
23.3.1 Export Mixture Data...............................................................................................................................132
23.3.2 Export Pure Component Properties........................................................................................................132
24 Appendix.................................................................................................................................................................133
24.1 Example for “Display Component or List Related Statistics”.........................................................................133
Dortmund Data Bank Page 4 of 135

DDBSP - Dortmund Data Bank Software Package 2014
1 IntroductionThis document describes the main program for searching and using experimental data from the Dortmund Data Bank (DDB).
The Dortmund Data Bank is actually not a single database but contains over a dozen different data banks for different data types. The data banks are
Short Term Data Bank Description
VLE Vapor-liquid equilibria for systems containing components with boiling points above 0 °C
VIS Mixture viscosities
VE Excess volumes, volumes, densities
SLE Solid-liquid equilibria for systems without salt
POW Octanol-Water partition coefficients
POLYMER Thermodynamic data of polymer containing systems
PCP Pure component properties – P-v-T, caloric, transport
MSFT Surface tension of mixtures
MSOS Speeds of sound of mixtures
MTCN Thermal conductivities of mixtures
MPVT Mixture P-v-T data
LLE Liquid-liquid equilibria
HPV Vapor-liquid equilibria for systems containing components with boiling points below 0 °C
HE Heats of mixing
GLE Gas solubilities
GHD Gas hydrate data
ESLE Salt solubilities
ELE Vapor-liquid equilibria for systems containing solved salts
EGLE Gas solubilities of electrolyte-containing systems
ECND Electric conductivity
CRI Critical Data of Mixtures
CPE Excess heat capacities
AZD Azeotropic/zeotropic information
ACT Activity coefficients at infinite dilution - binary systems
ACM Activity coefficients at infinite dilution - ternary systems
AAE Adsorbent/adsorptive equilibria
The short terms (VLE etc.) are used extensively in this tutorial.
Dortmund Data Bank Page 5 of 135

DDBSP - Dortmund Data Bank Software Package 2014
This document tries to be a tutorial but also tries to cover every function at least cursorily. It is organized in chapters – every chapter describing a typical approach for using the DDB in a productive and efficient way.
This document does not cover all features if they are part of other standalone programs – like the component management and the editors.
Dortmund Data Bank Page 6 of 135

DDBSP - Dortmund Data Bank Software Package 2014
2 Starting the Dortmund Data Bank Retrieval Program
Figure 1 shows a typical program group for the DDB software package. This has become obsolete in Windows 8. The DDB software currently does not yet support the new graphical user interface well. We recommend to use tools like Classic Shell to return to Windows 7 behavior.
The program itself starts with a query definition dialog. Possible queries can be
Dortmund Data Bank Page 7 of 135
Figure 1

DDBSP - Dortmund Data Bank Software Package 2014
• Systems (build of componentsand of component lists)
• References (literatureinformation)
• Single sets (data set numbers)
• Pure component properties
• A special query for selectivitysearches (in the ACT database).
Dortmund Data Bank Page 8 of 135
Figure 2 Dortmund Data Bank
DDBSP - Dortmund Data Bank Software Package 2014
3 Searching
3.1 Building a Simple Systems Query
In this step we will build a systems query for a three components system and take a look at the different search options for such a system.
A system in our terms means a list of DDB specific components. DDB components are stored in a component definition file which can be searched with the ComponentSelection program.
Press and the ComponentSelection search dialog is displayed:
This programs has a lot of different search modes which we will not cover here in depth. For the purposes of this tutorial it is sufficient to take a rather quick look at the program.
Component Selection displays the list of components with their
• DDB internal number,
Dortmund Data Bank Page 9 of 135
Figure 3 Component Selection

DDBSP - Dortmund Data Bank Software Package 2014
• their type (normal → 'C', salt → 'S', adsorbent → 'A', polymer →'P'),
• their location ( for the public – DDBST – component list, and
for private, customer defined components),
• the empirical formula,
• the CAS registry number,
• and the molecular weight.
A component can be selected by a double-click
or by checking its line and pressing the
button.
Nonane has to be searched since it isn't displayed under the firsttwelve components which are initially shown. The search string “nonane” (cases are ignored) has to be typed in
the search field.
After pressing the search button or bypressing the return/enter key the search isperformed. ComponentSelection displaysall components which names contain“nonane”. The single exact matching nameis the first of the list.
Note: Dibutyl sulfide has been found be-cause of the also stored synonymThianonane.
After double-clicking the Nonane line thecomponent is added to the query list. The third component shall be CH4O – Methanol. The query result window now contains three components and the search buttons are all enabled now.
Dortmund Data Bank Page 10 of 135
Figure 4 Component Selection Search
Modes

DDBSP - Dortmund Data Bank Software Package 2014
The single buttons perform different type of searches:
Button Function
An 'Exact Search' finds only data sets build of the three collected components.
An 'As Subsystem' search find all data sets build of the three collected components plus all data sets with these components and any other (quaternary and higher systems).
A 'System and Subsystem' search finds all data sets build of the three components plus all data sets build by the binary (Acetone/Nonane, Acetone/Methanol, Nonane/Methanol) subsystems and data sets for the pure components.
This button is only enabled if a single line in the query result window is selected. This search only find sets for the components in that marked line. If this line only contains a single components, only pure component data sets will be found.
An exact match search of this three-component-system yields the following data sets for LLE.
3.2 Building a Query with Component Lists
Besides single components like Acetone it is alsopossible to introduce component lists in the query
list. Component lists can be build inComponentSelection by selecting multiplecomponents
and press the
button. The resulting query window is
Dortmund Data Bank Page 11 of 135

DDBSP - Dortmund Data Bank Software Package 2014
If a component list is available on disk (“.STL” or “.STX” files, can be stored within ComponentSelection) it is
also possible to load these files by the button.
The component is treated like a single component. This means that an 'Exact Match Search' now finds ternary systems with Nonane/Methanol and any the three components of the list Acetone/Ethanol/Diethyl Ether.
The search mode now has the effect that data sets are found (pure, binary, and
ternary) which are only containing one, two, or three of the list's components.
3.3 Examining Further Query List Functionality
The component list contains three active areas.
1. The 'Number' column contains hyper links which allow to display the content of the line inComponentSelection. This allows to display and modify list members and to replace components. Ifthe mouse hovers over the “[List]” hyper link the DortmundData Bank displays the content of the list in a hint window – if
the list contains less than 10 components.
2. The button removes the component or list.
3. The 'Name' column contains hyper links which allow to display
component details in the component editor.
Dortmund Data Bank Page 12 of 135

DDBSP - Dortmund Data Bank Software Package 2014
The component list also has a context menu with some repeated and few new functions.
• “Main” resp. “Alternative” Names allows to switch between the two main synonyms stored in the componentbasic file.
Dortmund Data Bank Page 13 of 135
Figure 5 Component Editor

DDBSP - Dortmund Data Bank Software Package 2014
• 'Add Component' and 'Add Compound List' are calling the
same functions as the and
buttons.
• 'Display/Edit Compound List Entries' displays the currentline in ComponentSelection (same function as the hyperlink in the 'Number' column.
• 'Combine Entries to Single List' builds a single list from allcomponents (disregarding lists or single components)currently in the query list (in the current example the result
is a single list with five components).
• 'Expand List to Single Entries' breaks a list into pieces.
• 'Display Structure' allowsto take a look at thestructure of the selectedcomponent.
• 'Remove Component/List'removes the selectedcomponent or list (same aspressing the 'Remove'button).
• 'Clear' remove all components and lists and does the same as pressing the button.
• “Search Data for Component List” or “Search Data for Component” allow the“Exact Match” or “As Subsystem “ search for components or lists from a singleselected line in the Query table without having to remove all other entries first.
• 'Display Component/List Related Statistics' starts a sub list search for the selected component or list and display a detailed list of available data sets. An example is given in the appendix: Example for “Display
Component or List Related Statistics” on page 134.
The edit field below the list allows to enter DDB component numbers directly and add the components either separately or as a list. This field is onlyuseful for experienced users knowing DDBcodes for at least some components.
If non-normal components (such as salts,
polymers and adsorbents, which are storedin separate definition files) have to betyped the data type can be switched to salts,adsorbents or polymers by pressing the 's', 'p', or 'a' key. In this special case the salt numbers will be displayed assalt number plus one million, the adsorbent numbers as adsorbent number plus two millions and the polymer number plus three millions:
After adding the line the query list looks like
Dortmund Data Bank Page 14 of 135
Figure 6: Context Menu - Query Window
Figure 7: Display Structure
Figure 8: Entering DDB Component Codes
DDBSP - Dortmund Data Bank Software Package 2014
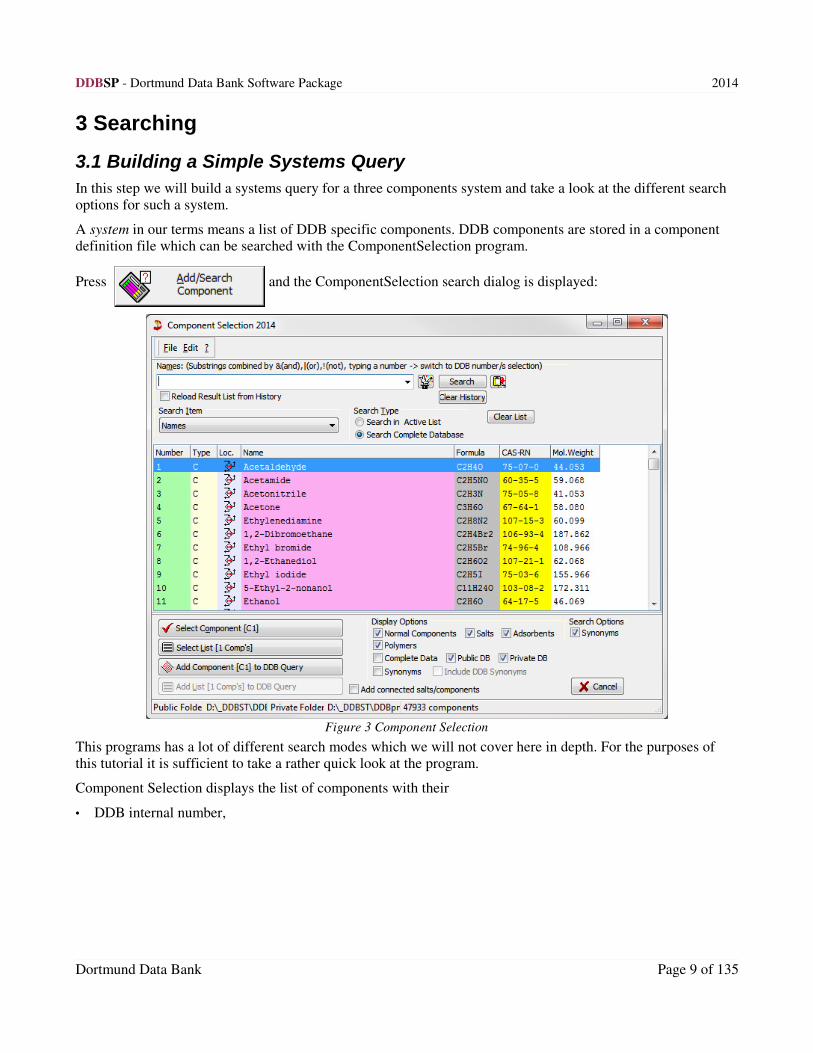
The “Add connected salts/components” check box is useful for addingcomponents which are stored as normal components as well as salts. The DDBmaintains currently four component lists (normal components, salts, adsorbents, polymers) and almost all salts are having entries also in the normal component list. To find all occurrences of a salt (as a salt in the ESLE and
the ELE data banks and as a normal component in all other data banks) it is necessary to create a list of both manifestations. If this check box is checked the program automatically creates this list.
This feature is not available for adsorbents and polymers because these type of components don't have duplicate entries in two lists.
The program recognizes valid CAS registry numbers and allows starting a direct search.
The text field has a history function where the last sixteen entries are stored.
3.4 Import Aspen Components
The Dortmund Data Bank program can read component information from Aspen projects and files.
Dortmund Data Bank Page 15 of 135

DDBSP - Dortmund Data Bank Software Package 2014
The import can be done by
• using native internal routines inside the Dortmund Data Bank program. This is the quick and recommended way and supports the Aspen file types “.inp”, “.bkp”, and “.apt”.
• using Aspen directly via an OLE access. This is only working if Aspen is installed on the same workstation where the Dortmund Data Bank program is running. This procedure is rather slow because Aspen has to be started in the background including a license request. The only advantage is that beside the three file types “.inp”, “.bkp” and “.apt” also “.apw” files can be opened.
The most important column is the “DDB Number” column. If a component has been identified the DDB numberis displayed. If the component is not known a “0” is displayed. In this case there are two possibilities:
• “Change the DDB Number”: This allows to search an already existing DDB component and use its number.
• “Add as New Component”: This open a “New Component” dialog where the component can be added to the DDB component list (a private component number is preferred).
Dortmund Data Bank Page 16 of 135
Figure 9: Importing Aspen Components

DDBSP - Dortmund Data Bank Software Package 2014
The component identification is done by a list of Aspen aliases, IDs, and names stored in the synonyms data base of the Dortmund Data Bank. This list has been created from Aspen's version 11.
3.5 Searching for the Data Sets of a Reference
All data sets in the DDB are referenced. Sources are articles, theses, private communications, company data, deposited documents like VINITI, proceedings and so on. These papers have been retrieved, evaluated and the
experimental data are now building the DDB.
The literature management program (LEAR) is a separate program but the dialogs are incorporated seamlessly. The literature search is started by pressing the
button. LEAR provides two search modes, one for experienced users with many possible search items and possible combinations and one easier quick search mode which we'll use here. The dialog has six fields where authors, publication year, first page, journal number, volume, title words, and LEAR record numbers can be entered. Any non-empty field must be found for a successful match – e. g. if authors and a year are specified
only articles from these authors published in the specified year will be found. The “Libraries to be Searched” field contains one or two literature data banks – one public (DDBST) database and one private (customer) database if available.
Dortmund Data Bank Page 17 of 135
Figure 10: Adding a New Component

DDBSP - Dortmund Data Bank Software Package 2014
The search result is a list with the found articles. The details of the article can be displayed by a double-click
and the reference is selected by pressing the button. The search is started now automatically and all data
sets from the specified reference or references are displayed.
“Figure 13: Data Sets from Specified Literature” show a query result for reference 48664 (Wittig et al.).:
3.6 Search Data Sets by Data Set or Reference Numbers
Data set and reference numbers are the most basic identifiers of a DDB data set.
Dortmund Data Bank Page 18 of 135
Figure 11 Search for References
Figure 13: Data Sets from Specified Literature
Figure 12 Literature Search Result
DDBSP - Dortmund Data Bank Software Package 2014
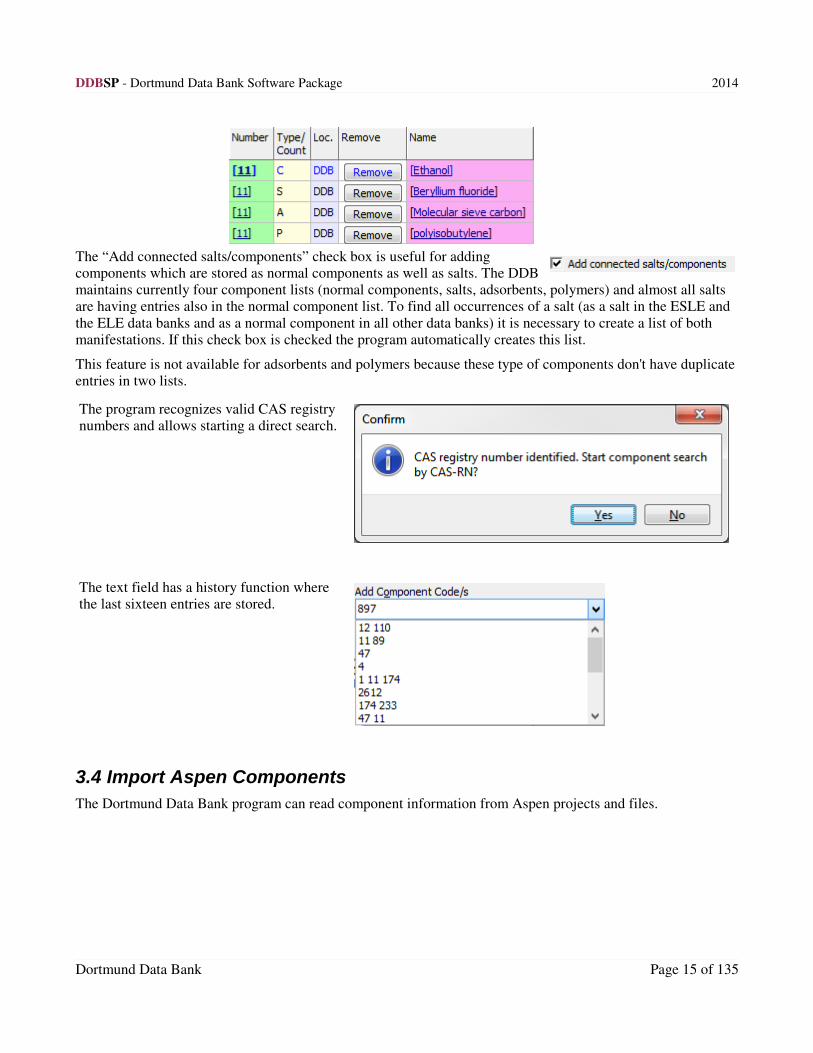
The reference numbers are actually coming in two flavors. The literature database contains special sub list numbers valid only for single data banks. There are references numbers 1,2,3,4 etc. for the VLE database, and reference numbers 1,2,3,4 etc. for the SLE database and for almost any other database. These sub numbers are called “REF Numbers” or “Link Numbers” whereas the numbers from the complete list are denoted LEAR numbers (the program's name).
“Data set Numbers” and “REF numbers”/”Link Numbers” are database specific and if either a data set number or a Link number shall be searched the database has to selected from the drop-down menu. In case of a search for LEAR number this data bank menu is deactivated.
The input edit fields allow to enter multiple numbers separated by spaces or semicolons and it is possible to define ranges of numbers by writing “lower number slash upper number” (“1/99”). If ranges are used blanks are not allowed as separators.
3.7 Searching Data Sets With Specified Pure Component Properties
The property search dialog can be displayed by pressing the button.
Dortmund Data Bank Page 19 of 135
Figure 14 Search by Data Set Numbers

DDBSP - Dortmund Data Bank Software Package 2014
The property search dialog allows to specify the property, to restrict the search to a list of components and states, and allows to specify if a wanted value only needs to be present in a data set or if all data points of a set must meet the given criteria.
The questions (criteria) are simply upper and lower limits for a specific table item
and are entered through a simple dialog.
Dortmund Data Bank Page 20 of 135
Figure 15: Pure Component Properties Search

DDBSP - Dortmund Data Bank Software Package 2014
The results of a search are two lists, one component list and a data set list.
Dortmund Data Bank Page 21 of 135
Figure 16: Property Search - Component List
Figure 17: Property Search - Data Set List

DDBSP - Dortmund Data Bank Software Package 2014
The component list can be saved (as a “.STL” file) or directly used in subsequent searches and the data set list can be displayed as a Query Result window in the Dortmund Data Bank program.
3.8 Searching Vapor-Liquid and Solid-Liquid Equilibria with Specified Temperatures and Pressures
This function is accessible through the “File” menu ofthe main window of the Dortmund Data Bank program.
Both the VLE and the HPV data bank contain saturatedvapor-liquid equilibrium temperature/pressure datavalues for specific compositions of binary or highermixtures. The AZD (azeotropic data) contains also
many data points where pressures and temperatures aregiven.
The SLE (solubilities) data bank contains mainly onlymelting temperatures of mixtures without a givenpressure. For this reason it is possible to exclude thepressure limits from the search criterion.
The search result are two different kind of windows.
1. A standard query result window showing all the found data sets
2. A table output with all matching data points
Dortmund Data Bank Page 22 of 135
Figure 18: VLE/AZD/SLE Temperature/Pressure Search
Menu Entry
Figure 19: VLE/AZD/SLE Temperature/Pressure
Search Criteria

DDBSP - Dortmund Data Bank Software Package 2014
3.9 Selectivity Search
This selectivity search is specific search for ACT data bank (activity coefficients at infinite dilution of a single solute in a single solvent).
Dortmund Data Bank Page 23 of 135
Figure 20: Search Result in Standard Query Window
Figure 21: Search Result as Data Point Table

DDBSP - Dortmund Data Bank Software Package 2014
This dialog allows to perform three different tasks:
1. Specification of two solutes and a single solvent. The resulting query result and plot displays the
usability of the solvent as entrainer in separation process mainly used to break azeotropes. This is usefulif a specific solvent is known.
Dortmund Data Bank Page 24 of 135
Figure 22: Selectivity Search
Figure 23: Selectivity Diagram

DDBSP - Dortmund Data Bank Software Package 2014
2. Search for all data sets for two solutes. This leads to a list of all solvents stored in the ACT data bank which can be further examined.
3. Predicting selectivity. The prediction calculates activity coefficients at infinite dilution for both solventsin a single solvent and displays the result either as a table or as a query result in the Dortmund Data Bank program. The resulting plot is the same as for the data set search with the exception that only predicted data are displayed.
3.10 Search Options
3.10.1 Data Banks Preselection
The search can be restricted to specified data banks.
The list shows always all possible parts of the Dortmund Data Bank. If a data bank is not available it is marked as “n. a.” and cannot be selected.
Single data banks can be selected with a right-click with the mouse.
Dortmund Data Bank Page 25 of 135
Figure 25: Data Bank Preselection
Figure 24: Data Banks and Pure Component Property Preselection

DDBSP - Dortmund Data Bank Software Package 2014
3.10.2 Pure Component Properties Preselection
The search for pure component properties can be restricted to specified properties. Single properties can be selected with a right-click with the mouse.
Dortmund Data Bank Page 26 of 135
Figure 26: Pure Component Properties - Property Preselection

DDBSP - Dortmund Data Bank Software Package 2014
3.10.3 Extended Database Properties
The extended database contains multiple properties. The preselection allows limiting the search to single or some properties. Single properties can be selected with a right-click with the mouse.
3.10.4 Configurations
Search options can be stored and restored through configuration files. If such a configuration hasn't been stored yet a “New Configuration” can be saved.
Stored configurations are shown in the configuration combobox and are activatedsimply by selecting the appropriate line.
“Remove Selection” would remove a selection from the list of configurations.
Dortmund Data Bank Page 27 of 135
Figure 27: Extended Database - Property Preselection

DDBSP - Dortmund Data Bank Software Package 2014
3.10.5 Other Search Options
3.10.5.1 Salt Solubilities – Handling of Precipitated Components
Salt solubility data contain solved and precipitated components and salts. The number of precipitated
components and salts can be very large because mainly of many different hydrates and other associates. The search for an exact match of such a system containing seven or even more components is very difficult. The option “Ignore Precipitated Components” allows to neglect the precipitated components.
3.10.5.2 Demo Data Sets
The DDB is delivered with empty sets if a specific data base is not licensed. These data sets only contain only a list of components but no experimental data. These data sets are normally searched and displayed together with licensed data sets. It is then possible to hide the demo data sets in the search query result form. This option now allows to avoid the retrieval of demo data sets during initial search.
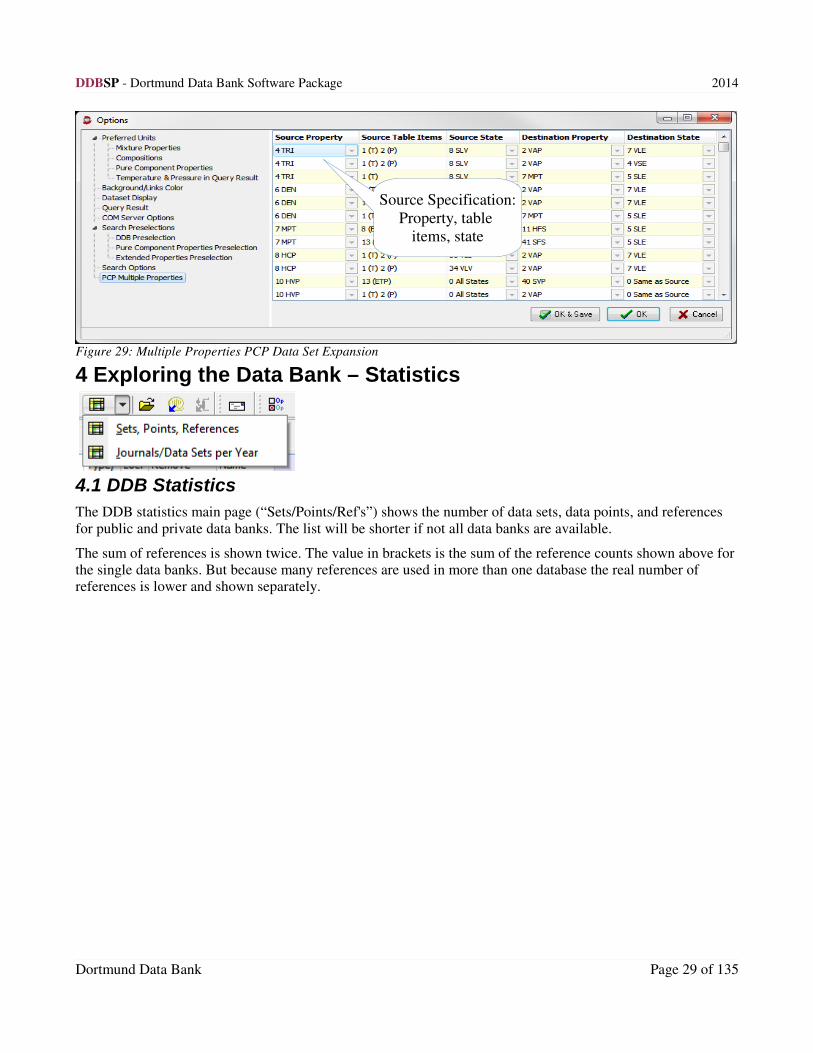
3.10.5.3 Expand PCP Data Sets Containing Multiple Properties
A pure component property data set can contain several properties like densities and heat capacities in the data
table. These data sets are normally displayed either as a density or as a heat capacity data set. Switching on this
option allows to duplicate the display of these data sets and the single data set will be displayed as a density data set and as a heat capacity data set as well.
Dortmund Data Bank Page 28 of 135
Figure 28: Other Search Options
DDBSP - Dortmund Data Bank Software Package 2014
4 Exploring the Data Bank – Statistics
4.1 DDB Statistics
The DDB statistics main page (“Sets/Points/Ref's”) shows the number of data sets, data points, and references
for public and private data banks. The list will be shorter if not all data banks are available.
The sum of references is shown twice. The value in brackets is the sum of the reference counts shown above for the single data banks. But because many references are used in more than one database the real number of references is lower and shown separately.
Dortmund Data Bank Page 29 of 135
Figure 29: Multiple Properties PCP Data Set Expansion
Source Specification:
Property, table
items, state

DDBSP - Dortmund Data Bank Software Package 2014
The second and third pages are more detailed statistics. They display the number of different systems in the databanks separated in a summary, binary and higher systems. The row with the title “=All=” is shown on the top of all other data base specific lines and show the entire list of systems. The values are not the sum of the single linebecause many systems are present in two or more data banks.
The “Pure Component Properties” statistics shows the data sets and points for all the single properties.
Dortmund Data Bank Page 30 of 135
Figure 30 Data Bank Statistics

DDBSP - Dortmund Data Bank Software Package 2014
The compounds columns shows the number of components for which the DDB contains data.
The pure component properties grid has a context menu
that contains commands to save list of components, references, and data sets for single properties. “Save List of Deleted Sets” is a special feature of the pure component data base. Sets aren't deleted but only marked as deleted by removing the reference information. These sets can still be shown through their data set numbers.
The “Polymer Data” page shows detailed information about the properties stored for polymers and their mixture in the Dortmund Data Bank.
4.2 Journals and Data Sets per Year
4.2.1 Data Sets per Year
This statistics show the distribution of data sets publication years. It is possible to either select a single data bank or a statistics for all data banks together. Besides a diagram the data are also available as data table and, additionally, a list for single year can be displayed.
Dortmund Data Bank Page 31 of 135
Figure 31 Statistics on Systems
Figure 32 Statistics on Pure Component Properties

DDBSP - Dortmund Data Bank Software Package 2014
4.2.2 Journals
The journals statistics show the top journals a pie diagram and a data table with all journals. Additionally, a diagram for single journals can be displayed.
The number of journals displayed in the diagram can be set by “Show top ?? journal”. Other than the top journals are show together as “Other Journals” in the diagram.
Dortmund Data Bank Page 32 of 135
Figure 33: Additional Statistics

DDBSP - Dortmund Data Bank Software Package 2014
4.2.3 References per Year
This statistics shows a similar diagram than the “Data Sets per Year” diagram. The difference between these both diagrams give an insight how many publications have been evaluated and an estimation about the amount of data per published paper.
Dortmund Data Bank Page 33 of 135
Figure 34: Journals

DDBSP - Dortmund Data Bank Software Package 2014
5 A First Look at Predictions
This part of the DDB software package contains lot of dialogs for the different data banks and is explained in other chapters in more details. In this step we'll focus on some common features.
Predicting from the main window has been introduced for obtaining thermophysical data where no experimentaldata sets are available. This 'direct' prediction creates artificial – predicted – data sets which will be added to a query result just like experimental data.
After pressing the 'Predict' button a dialog is displayed where a system of components has to be specified.
Dortmund Data Bank Page 34 of 135
Figure 35: References per Year

DDBSP - Dortmund Data Bank Software Package 2014
If components already have been specified in the query definition dialog they will be inserted here automatically. Direct predictions are currently possible for the data banks VLE, LLE, ACT, HPV, AZD, SLE,
HE, GLE, ACM, ELE, and POW. A special calculation for selectivities completes the list.
New components can be added ( ) by the standard ComponentSelection dialog or, if the DDB
component numbers are known, typed in directly ( ). clears the entire
list, shows the prediction dialog for the current data bank.
Some databases are requiring special component orders.
• GLE (gas solubilities) predictions need one gas and one solvent with the gas on top position.
• ACM (activity coefficients at infinite dilution of pure solutes in binary solvents) need three components withtwo solvents on the top and the solute below.
• ELE (vapor-liquid equilibria for electrolyte containing systems) needs one or two solvents at the top and one
salt following.
• Selectivity needs three components, two solutes first and a single solvent.
The programs displays a short help text above the component list showing these requirements.
The component grid can be sorted either by clicking in the first (fixed) row of the grid or by manual drag and drop of the components.
A repeated click in the sort row reverses the sort order. Sorting is possible by DDB number, name, Tc, and Pc.
Dortmund Data Bank Page 35 of 135

DDBSP - Dortmund Data Bank Software Package 2014
The single dialogs for the single data banks are described in chapters below.
Dortmund Data Bank Page 36 of 135

DDBSP - Dortmund Data Bank Software Package 2014
6 Using and Understanding the Query Result WindowThe menu contains typical function like loading from disk and saving to disk.
Dortmund Data Bank Page 37 of 135

DDBSP - Dortmund Data Bank Software Package 2014
6.1 File Menu
'Append Data' resp. the 'Save Data' menu entries allows to load and save data in different formats – but all only in DDB specific formats. The single formats are described in the next steps (see chapter “Saving and Loading Data Files“).
'Save Grid' saves only “Data SetList” grid content.
'Show' allows to display the single data sets in different ways.
Dortmund Data Bank Page 38 of 135
Systems/References
Overview
List of Databanks
Overview
Dataset List
Details
MenuTool Bars
DDBSP - Dortmund Data Bank Software Package 2014
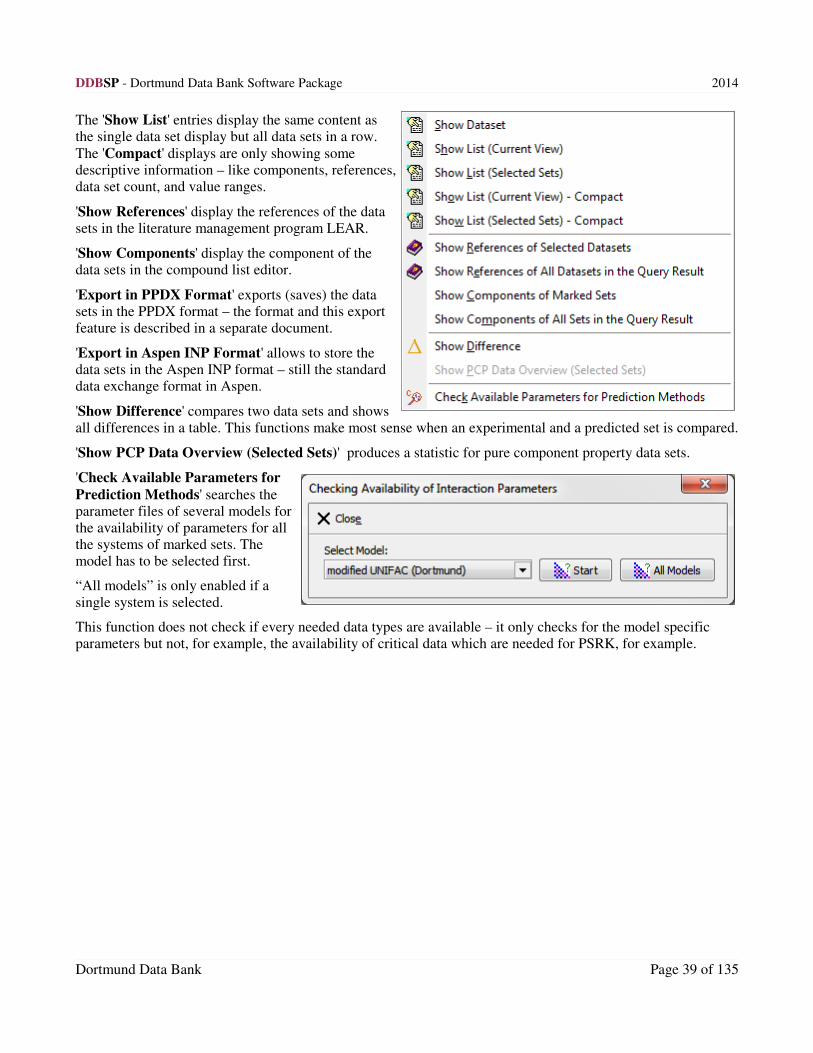
The 'Show List' entries display the same content asthe single data set display but all data sets in a row.
The 'Compact' displays are only showing somedescriptive information – like components, references,data set count, and value ranges.
'Show References' display the references of the datasets in the literature management program LEAR.
'Show Components' display the component of thedata sets in the compound list editor.
'Export in PPDX Format' exports (saves) the datasets in the PPDX format – the format and this exportfeature is described in a separate document.
'Export in Aspen INP Format' allows to store thedata sets in the Aspen INP format – still the standarddata exchange format in Aspen.
'Show Difference' compares two data sets and showsall differences in a table. This functions make most sense when an experimental and a predicted set is compared.
'Show PCP Data Overview (Selected Sets)' produces a statistic for pure component property data sets.
'Check Available Parameters for
Prediction Methods' searches theparameter files of several models forthe availability of parameters for allthe systems of marked sets. Themodel has to be selected first.
“All models” is only enabled if a
single system is selected.
This function does not check if every needed data types are available – it only checks for the model specific parameters but not, for example, the availability of critical data which are needed for PSRK, for example.
Dortmund Data Bank Page 39 of 135

DDBSP - Dortmund Data Bank Software Package 2014
'Export Plot Interface File Format' writes a file for the plot program (MixPlot) which when can be loaded in the plot program.
'Export Datapoints' allows to write a table containing all data points
'Close All' closes not only the current query result window but all.
6.2 Edit Menu
The 'Edit' Menu contains typical functions like copying and editing.
'Select' containsfunctions to select alldata sets in thecurrent result grid orto select data sets for
the current system or current system plus sub system.
'Copy to Clipboard' copies the selected part of the data grid to the Windows clipboard. This function only copies the data grid not any additional data.
'Export to Excel' allows to write pure component data directly to
Microsoft Excel (via OLE). This function is only available for pure component properties and if a single property is displayed.
Dortmund Data Bank Page 40 of 135

DDBSP - Dortmund Data Bank Software Package 2014
'Modify' allows to change data sets. This isexplained in another chapter.
'Show Query Windows' brings the main querydefinition window to front.
'Options' are explained in an extra step like thethree 'Statistics' entries.
'Rename this Query Result' allows to change thecaption of the query result window.
Consistency Tests starts consistency tests. Details
are explained in another chapter.
Dortmund Data Bank Page 41 of 135
Figure 36: Modification Sub Menu

DDBSP - Dortmund Data Bank Software Package 2014
7 Saving and Loading Data Files
7.1 Open Files
Data sets can be loaded in the query result window and in the query definition window. Loading multiple files in the main window will open multiple query result files, loading multiple files in a query result windows allow collecting all the data in that window.
'Append Datafiles' resp. the 'Load Data Files' menu entries allows loading data in different formats – but all only in DDB specific formats.
'Save Grid' only stores the 'Data set List' grid content, not the data themselves.
Dortmund Data Bank Page 42 of 135

DDBSP - Dortmund Data Bank Software Package 2014
7.2 Save File
'Save Data' allows storing the data sets in different formats – but all only in DDB specific formats. The formats are
• “Save Marked Sets”: This format is the free formatted but extended by database names. It's extension is “.qr”. It stores all data sets from all databases in the current query result (and allows to restore it). We now
use it as standard exchange format.
• “Save Single Set”: This function stores a single data sets in the “.qr” format
• “Save All Sets – All Databanks”: The format is also the “.qr” format but allows storing the entire query result in one file.
• “Binary Data/Interface File”. This format contains a list of data sets in a FORTRAN binary format. The files can contain only data sets from a single database and have database specific extensions.
• VLS → VLE and HPV database
• SLS → SLE database
• GLS → GLE database
• HES → HE database
• ALS → ACT database
• AMS → ACM database
• CPS → CRI database
• ELS → ELE database
• VES → VE database
• LLS → LLE database
• AAS → AAE database
• GLX → EGLE database
• For the data banks ESLE, POW, MSFT, MSOS, MTCN, ECND, GHD, and CRI a binary format is not
supported
• “Free Formatted Data/Interface File”. This format contains a list of data sets in text format. The extension
of the files is '.TXT'. This file only contains data sets from a single database. This format is defined for all data banks.
Dortmund Data Bank Page 43 of 135

DDBSP - Dortmund Data Bank Software Package 2014
• “Dataset Identifiers”. This format only stores the database name and data set identifiers (data set numbers, data bank location).
• “Raw Dataset Numbers”. This format (extension .STX) only stores the data set numbers Data bank information and location ids are lost.
• “Literature Numbers”. This file (also .STX) stores the literature numbers of the data sets. This file can be loaded in the literature management program (LEAR).
• “Component Numbers”. This file (also .STX) stores the DDB numbers of the components. This file can be loaded in different programs (Component Management, Dortmund Data Bank, etc.)
There are two types of saved data file.
1. Files containing the complete experimental data (binary, free and F77 formatted, Query Result data sets).
2. File containing only data descriptors (Data set identifiers, literature numbers, raw data set numbers, component numbers).
The files containing only descriptors are damageable by data bank changes because the descriptor might point to
a replaced data sets. Please consider these files only for temporary storage.
7.3 Drag and Drop Files
All files that can be opened through the menu commands can also be loaded by dragging and dropping the files from the Windows explorer to the main dialog of the Dortmund Data Bank program.
Dortmund Data Bank Page 44 of 135

DDBSP - Dortmund Data Bank Software Package 2014
8 Exploring the Data Set List GridThe grid contains the list of data sets found in a specific database.
The grid contains the following columns:
• “Set No.”: A set number is a combination of data set number, database location, and an additional number if both previous numbers are the same – for duplicate entries. The location is '0' for the public (DDBST) database and '1' for the private (customer) data bank. Other numbers are used for predicted data – the
numbers are model specific in that case. The set numbers are hyper links. A single-click opens the single-dataset display window (see next steps).The 'Links Details' window below the grid displays the dataset id details when the mouse cursor hovers above a link.
• “Pts.”: Number of points in the dataset.
• “#DDB”: DDB component numbers. The prefix 'C' determines normal components, an 'S' salts and electrolytes, an 'A' an adsorbent, a 'P' a polymer. The 'Details' window below the grid displays the componentnames when the mouse cursor hovers above a component number.
• “Tmin [K]” and “Tmax [K]”: Temperature range of the data set. For the PolymerDDB the temperature and pressure columns are used to display mean molecular weights and the polydispersity index (PDI).
• “Pmin [kPa]” and “Pmax [kPa]”: Pressure range of the data set.
• “Comment”: Further database-dependent details for the data set.
• “Ref.No.”: Reference number. This is a number specific for the current database.
• “Reference”: Author, Journal, and some
other details of the reference. The number inbrackets is the main literature number –database independent. The literaturenumbers are hyper links and allowdisplaying a special literature detail dialogthat has functions to
• search for all data sets for the currentreference. The result will be displayed ina new query result window.
• display a dialog in LEAR with allavailable details for the current reference(“Further Details”).
• display linked files (“Linked Info”button, see “Literature Management”manual for more details)
Dortmund Data Bank Page 45 of 135
DDBSP - Dortmund Data Bank Software Package 2014
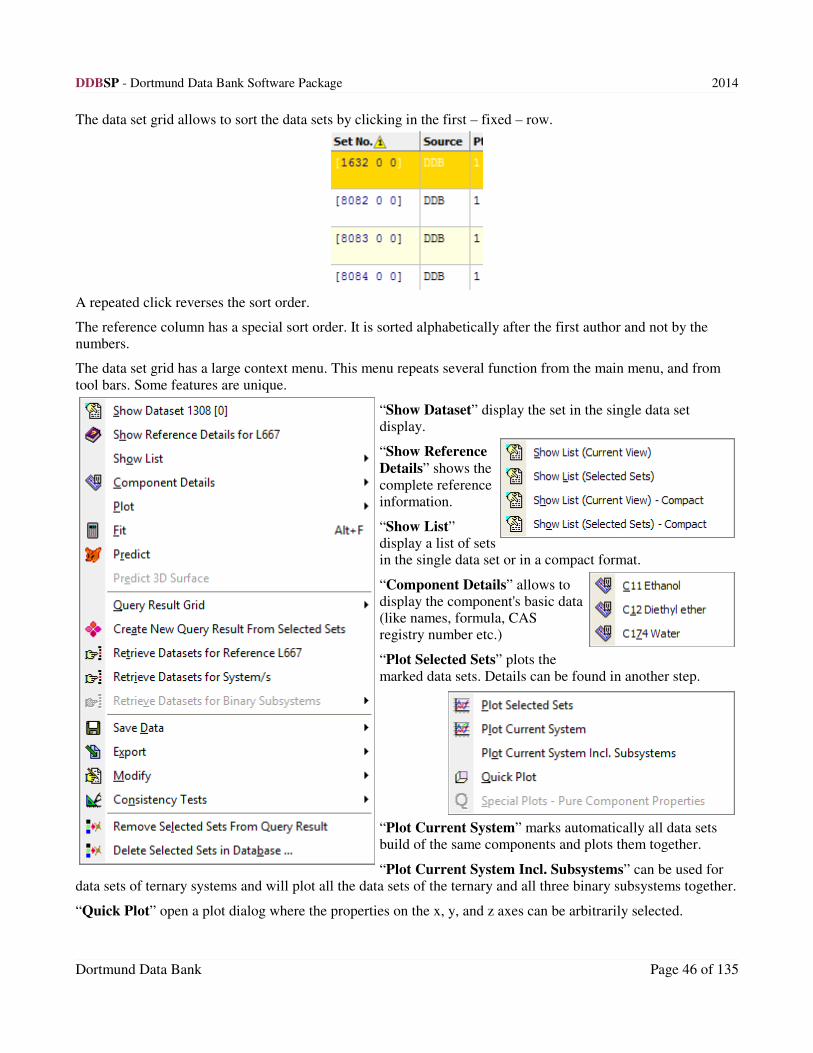
The data set grid allows to sort the data sets by clicking in the first – fixed – row.
A repeated click reverses the sort order.
The reference column has a special sort order. It is sorted alphabetically after the first author and not by the numbers.
The data set grid has a large context menu. This menu repeats several function from the main menu, and from
tool bars. Some features are unique.
“Show Dataset” display the set in the single data set display.
“Show Reference
Details” shows the
complete referenceinformation.
“Show List”display a list of setsin the single data set or in a compact format.
“Component Details” allows todisplay the component's basic data(like names, formula, CASregistry number etc.)
“Plot Selected Sets” plots the
marked data sets. Details can be found in another step.
“Plot Current System” marks automatically all data sets build of the same components and plots them together.
“Plot Current System Incl. Subsystems” can be used for data sets of ternary systems and will plot all the data sets of the ternary and all three binary subsystems together.
“Quick Plot” open a plot dialog where the properties on the x, y, and z axes can be arbitrarily selected.
Dortmund Data Bank Page 46 of 135

DDBSP - Dortmund Data Bank Software Package 2014
“Fit“ calls the fit routines, “Predict” the prediction routines. Both function are described in another step.
The “Query Result Grid” sub menu allows the
• selection of all data sets in the grid,
• selection of all data sets build of the same components,
• selection of all data sets build of the same components including subsystems
• adjusting the columns widths to the content's width,
• selecting which columns are visible,
• copying the grid content to the Windows clipboard,
• saving the grid content to a CSV (comma separated
values) file,
• saving the grid to a HTML formatted file
• switching between different display modes for namesand DDB numbers. These switches are also available in the 'options' dialog.
“Create New Query Result From Selected Sets” builds a new query result windows only from the marked
sets.
“Retrieve Datasets for Reference” performs a new search for the current reference. This allows to collect all data sets for a specific article.
“Retrieve Datasets for System” performs a new search on the current system.
The “Save Data”, “Export”, and “Modify” entries areclones of the main menu function for saving, exportingand modifying data sets.
“Consistency Tests” starts the two consistency tests forVLE data.
“Remove Selected Sets From Query Result” deletesthe data sets from the search result but leaves thedatabases unchanged.
“Delete Selected Sets in Database” opens a dialoginside EditMixtureData (Editor) with the marked sets and
allows to remove these data sets from the database(Figure 37). In this single case EditMixtureData is alsoused for pure component property data sets.
Dortmund Data Bank Page 47 of 135
Figure 37 Remove Data sets Dialog

DDBSP - Dortmund Data Bank Software Package 2014
9 Displaying Sub Lists
The complete list of data sets can be reduced by certain criteria.
• Display data set of single references.
• Display data sets for a single system.
• Display only binary, ternary, quaternary, quinary, or higher systems.
• Display data sets of single components.
• Display data sets for single solvents or solute (ACT and ACM databanks)
• Display data sets from single sources. Sources are private or public DDB
or data sets predicted by different models.
• Display data sets with special counters. The counter is normally zero, only if multiple data sets with the samedata set number and source are available the counter will be 1 or higher.
The query result window displays separate statistics on the entire list currently loaded and the currently active
sub list in its overview grid.
The check boxes can be used to select single or multiple references (for example). A left-mouse-button-click in column two checks single lines.
Dortmund Data Bank Page 48 of 135
Figure 42 ComponentsFigure 40 References
Figure 41 Systems
Figure 39 Overview for ACT,
ACM
Figure 38 Sub List Overview

DDBSP - Dortmund Data Bank Software Package 2014
10 Single Data Set Display
The tool bar functions are
• “Close”: Closes the display window (the window can be closed also by pressing the Esc key).
• “Save”: Saves the window content as normal text.
• “Print”: Prints the window content (shows the standard printer dialog).
• “Copy”: Copies the window content to the Windows clipboard.
• “Mail”: Saves the current window content to a temporary file, calls the standard mail program with an emptynew mail window with the temporary file appended.
• “Plot”: Plot the current dataset (details in another chapter).
• “Fit”: Fits the current dataset (details in another chapter).
• “Predict”: Predicts the current dataset (details in another chapter).
• “Edit”: Allows to modify the current dataset (but will not alter the database).
• “Options”: Calls the options dialog (details in another chapter).
• “Export”: Creates a data point table
Dortmund Data Bank Page 49 of 135
Figure 43: Single Data Set

DDBSP - Dortmund Data Bank Software Package 2014
• “Reference”: Display reference details
• “Edit in EditMixtureData” uses the standard editor, the text editorsentries allow to edit the data sets in a normal editor – displaying therather cryptic free formatted format.
• “Specify Quality” allows to specify the quality and the source of the data, and
• “Evaluate Azeotropy” allows testing a VLE or HPV data set for an azeotrope.
The “Font size” control allows to change the size of the font, and the “Datasets” drop down-menu contains the entire list of data sets in the query results.
The data set display is slightly different for the different data banks. A typical output for VLE is
Data set number: 579 (Public DDB) VLEDDB x y T P = constant
number of components: 2
number of points: 11
quality check: 1 (Default check passed)
data source: 0 (Experimental Data)
reference number: 4
ref.:
[308] Amer H.H., Paxton R.R., van Winkle M., Ind.Eng.Chem., 48(1), p142-146, 1956
code no. formula molw't name
-------- -------------------- -------- ----------------------------------------
4 C3H6O 58.080 Acetone
11 C2H6O 46.069 Ethanol
Constant value/s:
P 101.325 [kPa]
T x1 y1
[K] [mol/mol] [mol/mol]
---------- ---------- ----------
351.45 0.000000 0.000000
Dortmund Data Bank Page 50 of 135
Figure 44 Quality and Source Settings

DDBSP - Dortmund Data Bank Software Package 2014
349.55 0.033000 0.111000
347.15 0.078000 0.216000
343.95 0.149000 0.345000
342.25 0.195000 0.410000
338.75 0.316000 0.534000
336.55 0.414000 0.614000
334.45 0.532000 0.697000
332.15 0.691000 0.796000
330.45 0.852000 0.896000
329.25 1.000000 1.000000
The data set can be be divided in four major parts.
1. Header information showing data point and component count, quality and data source.
2. Reference information
3. Component details
4. Data table
The four parts are always present for every database although the type of data will differ.
Dortmund Data Bank Page 51 of 135

DDBSP - Dortmund Data Bank Software Package 2014
11 Data Set Display Options
11.1 Display Additional Information
The DDB retrieval program allow to add some calculated values to the data tables with experimental data sets.
These options are
1. Display excess cP data sets. If pure component heat capacities are available it is possible to display the excess heat capacities as well.
cp cpIdeal cpE x1
[J/mol*K] [J/mol*K] [J/mol*K] [mol/mol]
---------- ---------- ---------- ----------
75.2000 75.2000 0.0000 0.000000
79.5000 75.9300 3.5700 0.020166
83.0000 76.7074 6.2926 0.041640
86.6000 77.5368 9.0632 0.064553
90.8000 78.4238 12.3762 0.089055
93.7000 79.3745 14.3255 0.115317
95.8000 80.3960 15.4040 0.143535
97.8000 81.4965 16.3035 0.173937
99.3000 82.6857 16.6143 0.206787
102.1000 85.3764 16.7236 0.281115
104.5000 88.5834 15.9166 0.369708
107.1000 92.4713 14.6287 0.477107
111.4000 111.4000 0.0000 1.000000
2. Always try to convert ESLE data sets for plots The ESLE data bank contains data in the originally published unit. For being able to combine data sets with
Dortmund Data Bank Page 52 of 135
Figure 45: Data Set Display Options

DDBSP - Dortmund Data Bank Software Package 2014
different units, many ESLE data sets can be converted to a standard form. If this option is not set, all data sets are shown in the original units and in different windows.
3. GLE Data Bank OptionsThe GLE database contains data sets in many different forms and units. These options allow to convert these multiple formats into two standard forms.
1. “Display converted GLE to T-Henry data.”
2. “Display converted GLE to TPxy data.”
Ptot X gas *10^4
[mm Hg] [-]
------------ ---------------------
248.300 50.8900
427.500 100.3000
579.800 143.4000
755.300 194.1000
Henry Recalculated Table
========================
T Henry Calculated Uncertain
[K] [bar] [-] [-]
---------- ---------- ---------- ----------
298.15 49.70088 Yes No
298.15 49.07572 Yes No
298.15 48.50892 Yes No
298.15 47.91328 Yes No
TPxy Recalculated Table
=======================
T P xgas
[K] [kPa] [mol/mol]
---------- ---------- ----------
298.15 33.104 0.005089
298.15 56.995 0.010030
298.15 77.300 0.014340
298.15 100.698 0.019410
3. “Ostwald Conversion: Use given or calculated gas partial pressure”This option switches the conversion mode for data sets containing Ostwald coefficients. If this option is not set the conversion will take the given pressures disregarding the difference between total or partial
pressure. If this option is set only partial pressures will be used. If only a total pressure is given the conversion tries to calculate the partial pressure and fails if this is not possible.
4. vE-Data Bank Options
1. “Display converted density from excess volume data sets”Densities will be calculated from excess volume data sets. Pure component densities are needed.
2. “Display vE from densities”
If a density dataset contains pure component densities the programs calculates the excess density/volume.
5. VLE/HPV Data Bank Options
Dortmund Data Bank Page 53 of 135
DDBSP - Dortmund Data Bank Software Package 2014
1. “Display relative volatility in VLE/HPV data sets.”
Rel . Vol .=( y1
x1)
( y2
x2)
As the equation shows relative volatilities can only be calculated for binary systems.
2. “Display K factors”
K=y
xK factors displayed for every component if vapor and liquid composition are given. T x1 y1 Rel.Vol. K-factor1 K-factor2 [K] [mol/mol] [mol/mol] [-] [-] [-]---------- ---------- ---------- ---------- ---------- ---------- 349.75 0.006300 0.048000 7.9528 7.6190 0.9580 348.25 0.012500 0.098800 8.6609 7.9040 0.9126 346.85 0.018900 0.153000 9.3769 8.0952 0.8633
3. “Display Activity Coefficients”Additional columns with activity coefficients are displayed. This is only possible for complete data sets containing pressure, temperature, vapor and liquid compositions.
The program uses the simplified equation x i i Pi
s= y i P . For some systems with associating
carboxylic acids chemical theory is applied.
6. VLE/HPV/SLE Databank Options
1. Display Complete Mole Fractions
The data banks normally only contains mole fractions for n-1 components. For a binary systems only a single mole fraction is stored and displayed. This options allows to display the mole fraction of all components.
7. PCP Databank Options
1. Display Molar DensitiesThis option allows to display the molar density
together with the specific density (which is thestandard in the pure component properties databank).
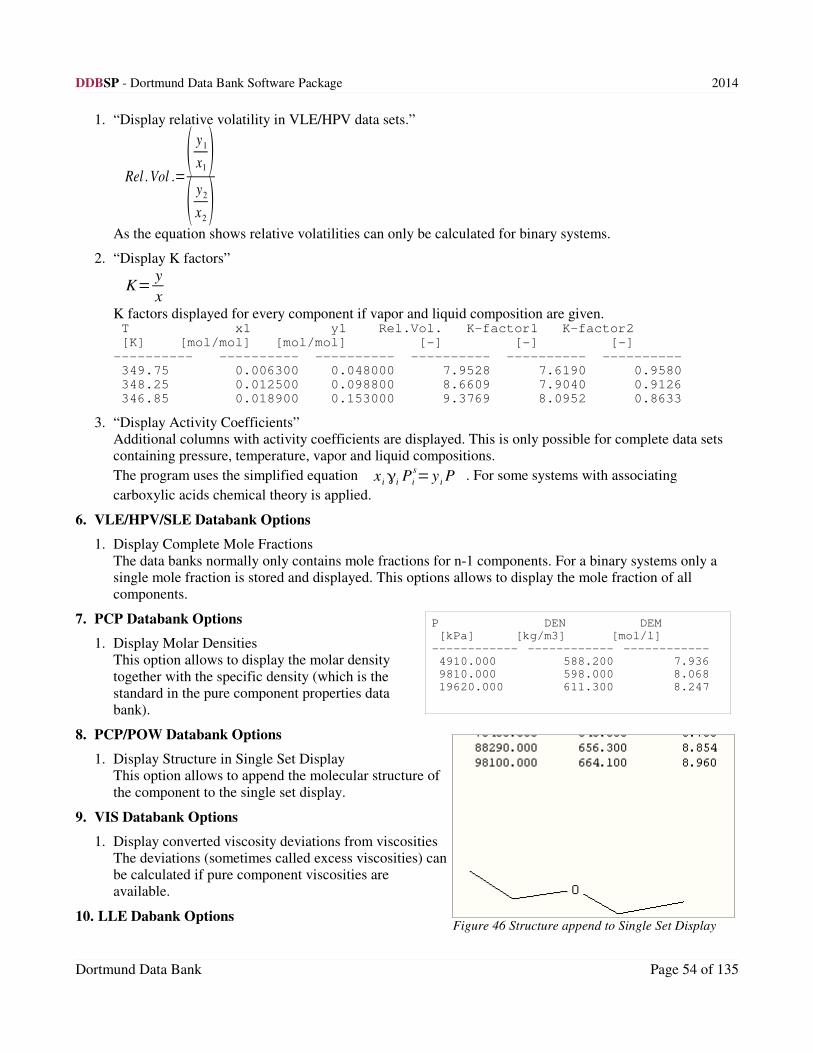
8. PCP/POW Databank Options
1. Display Structure in Single Set DisplayThis option allows to append the molecular structure of
the component to the single set display.
9. VIS Databank Options
1. Display converted viscosity deviations from viscositiesThe deviations (sometimes called excess viscosities) canbe calculated if pure component viscosities areavailable.
10. LLE Dabank Options
Dortmund Data Bank Page 54 of 135
Figure 46 Structure append to Single Set Display
P DEN DEM
[kPa] [kg/m3] [mol/l]
------------ ------------ ------------
4910.000 588.200 7.936
9810.000 598.000 8.068
19620.000 611.300 8.247

DDBSP - Dortmund Data Bank Software Package 2014
1. Display K Factors
K=xr
xl
The K factors show the distribution of single components in the two liquid phases. Values can only be
calculated for tie lines.
2. Sort Point by TThis option improves the readability of some sets.
Dortmund Data Bank Page 55 of 135
DDBSP - Dortmund Data Bank Software Package 2014
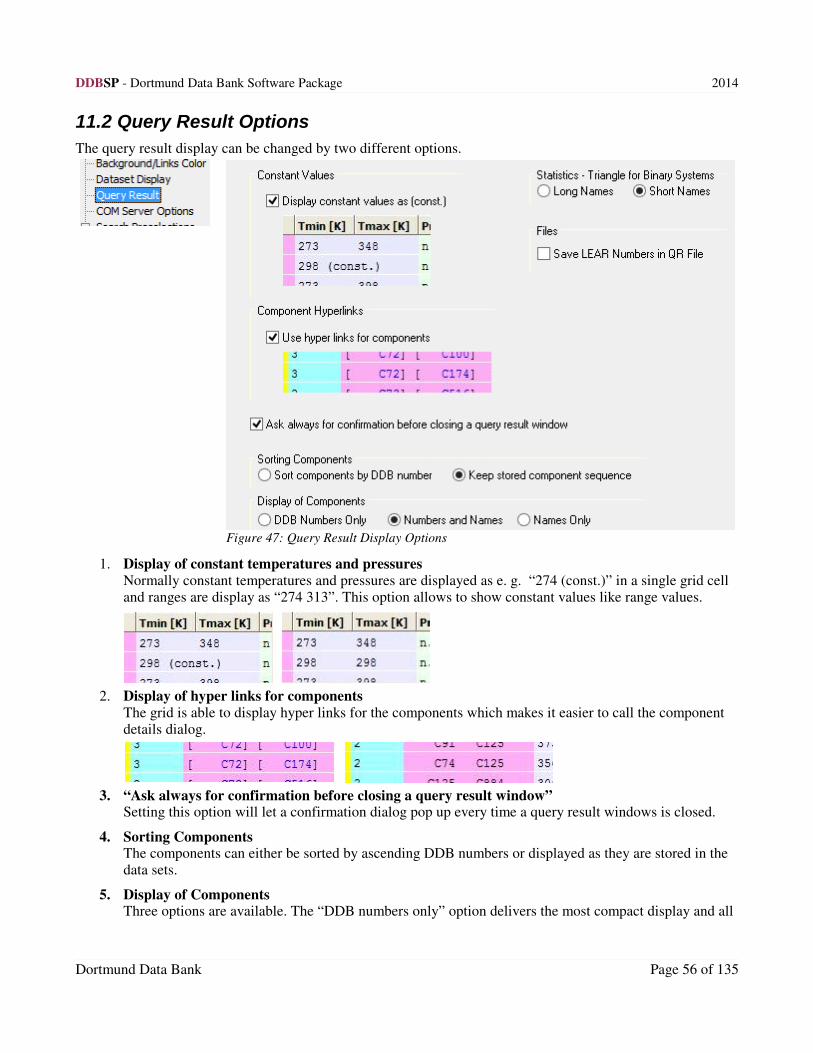
11.2 Query Result Options
The query result display can be changed by two different options.
1. Display of constant temperatures and pressuresNormally constant temperatures and pressures are displayed as e. g. “274 (const.)” in a single grid cell and ranges are display as “274 313”. This option allows to show constant values like range values.
2. Display of hyper links for componentsThe grid is able to display hyper links for the components which makes it easier to call the component details dialog.
3. “Ask always for confirmation before closing a query result window”Setting this option will let a confirmation dialog pop up every time a query result windows is closed.
4. Sorting ComponentsThe components can either be sorted by ascending DDB numbers or displayed as they are stored in the data sets.
5. Display of ComponentsThree options are available. The “DDB numbers only” option delivers the most compact display and all
Dortmund Data Bank Page 56 of 135
Figure 47: Query Result Display Options

DDBSP - Dortmund Data Bank Software Package 2014
component numbers are shown in a single row. Both other options will display the components in their own lines.
6. Statistics – Triangle for Binary SystemThis switches between the output of full component names and the usage of short names which are of the type “C” + DDB number like “C234”.
7. Save LEAR numbers in QR FileThis options adds the standard literature number to all data sets written to a query result file (qr files) . This is useful for the older data banks still storing some separate reference numbers only. The written
files are compatible with the qr files without the LEAR numbers.
Dortmund Data Bank Page 57 of 135
Figure 49: DDB Number
Only
Figure 50: Names Only Figure 48: Numbers and Names

DDBSP - Dortmund Data Bank Software Package 2014
12 Compact Data DisplayThe compact displays can be used to get a compact overview on a list of data sets. The displays are only showing some descriptive information – like components, references, dataset count, and value ranges. A typical output for VLE is
VLEDDB - Vapor-Liquid Equilibrium Data
(1) 11 C2H6O Ethanol (2) 12 C4H10O Diethyl ether
References: 1 [475] Gordon A.R., Hornibrook E.J., Can.J.Res., 24, p263-267, 1946 2 [476] Kireev V.A., Khachadurova E.M., Zh.Prikl.Khim. (Leningrad), 7(4), p495-496, 1934 3 [477] Nagai J., Ishii N., J.Soc.Chem.Ind.Jap. = Kogyo Kagakkai, 38(3), p86-95, 1935 4 [866] Moeller W.P., Englund S.W., Tsui T.K., Othmer D.F., Ind.Eng.Chem., 43(3), p711-717, 1951 5 [3229] Borisova I.A., Erlykina M.E., Sokolov N.M., Mikhailov V.A., Zakharov D.L., Gorbunov A.I., Deposited Doc., Code SPSTL 308 KHP-D 82, p1-13, 1982 6 [4581] Wuellner A., Poggendorff's Ann.Phys.Chem., 79(11), p353-366, 1866
no. type values t[degC] P[mmHg] ref data set
1 xyT(P) 10 2156.30 4 175 VLEDDB 2 xyT(P) 10 5414.30 4 176 VLEDDB 3 xyT(P) 10 3862.90 4 177 VLEDDB 4 xyT(P) 8 7224.40 4 178 VLEDDB 5 xyP(T) 19 25.00 1 636 VLEDDB 6 xyT(P) 27 760.00 2 637 VLEDDB 7 xyP(T) 19 0.00 3 638 VLEDDB 8 xyP(T) 19 10.00 3 639 VLEDDB 9 xyP(T) 19 20.00 3 640 VLEDDB 10 xyP(T) 19 30.00 3 641 VLEDDB 11 xyP(T) 19 40.00 3 642 VLEDDB 12 xyP(T) 19 50.00 3 643 VLEDDB 13 xyT(P) 20 760.00 5 11357 VLEDDB 14 xyPT(-) 8 6 20637 VLEDDB 15 xyPT(-) 10 6 20638 VLEDDB 16 xyPT(-) 10 6 20639 VLEDDB
The compact output is composed of three main parts.
1. System or component
2. List of references where data of this system or component has been entered
3. List of data sets with some descriptive entries.
The compact data set display is, of course, quite different for the different data banks but these three parts can be always found.
Dortmund Data Bank Page 58 of 135

DDBSP - Dortmund Data Bank Software Package 2014
13 Units
13.1 Mixture Data Banks – Compositions
Compositions can be displayed in mol/mol (mole fraction) or in g/g (mass fraction). LLE data sets are always displayed in percent (mass or molar).
It it also possible to display both.This options doesn't add columns – it shows a second table.
13.2 Mixture Data Banks – Properties
Only for the properties temperature, pressure, enthalpy (heats of mixing), heat capacity, density, volume, excess volumes, and viscosity it is possible to change the display and plot unit. The “Disable Conversion” check box allows to show the DDB data sets in original database specific units.
Dortmund Data Bank Page 59 of 135

DDBSP - Dortmund Data Bank Software Package 2014
13.3 Pure Component Properties
Every property in the pure component properties database has a list of units. The “Precision” column allows to specify the number of digits behind the decimal separator.
The button “ “ resets all setting to DDB standard settings.
Dortmund Data Bank Page 60 of 135
Figure 51 Pure Component Properties: Units
Figure 52 Unit Drop-
Down Menu

DDBSP - Dortmund Data Bank Software Package 2014
14 Consistency Tests
Consistency tests are checking VLE data sets for thermodynamic correctness. For vapor-liquid equilibria data
sets two consistency tests are available.
14.1 Point-to-Point Test
The consistency test 1 offered is the so-called point-to-point test of van Ness et al.1 in the version of Fredenslund et al.2
The method applied in this program uses a flexible expression for the excess Gibbs energy for fitting experimental x, P, T-data. With the aid of the fitted parameters the vapor composition y for each experimental point (x, P, T) in a data set is calculated and compared with the experimental value. If the mean deviation between experimental and calculated y values is smaller than 0.01, the data set is considered to be consistent.
1 van Ness H.C., Byer S.M., Gibbs R.E., AIChE J. 19, 238 (1973)2 Fredenslund A., Gmehling J., Rasmussen P., Vapor-Liquid Equilibria Using UNIFAC, A Group Contribution
Method, Elsevier, Amsterdam 1977
Dortmund Data Bank Page 61 of 135
Figure 53: Consistency Test Menu

DDBSP - Dortmund Data Bank Software Package 2014
14.2 Area Test
The consistency test 2 is the so-called integral or area test using the method of Redlich-Kister3 and Herington45. In this test for each experimental point the logarithm of the ratio of the activity coefficients is calculated. These values are then fitted by a third degree polynomial and the areas above and below the abscissa are determined by integration of the polynomial. The resulting area deviation is evaluated in various ways:
14.2.1 Isothermal data
If A and B denote the areas above and below the abscissa, then the deviation D is given by:
D = | ( A - B ) / ( A + B ) * 100 | [%]
If D is smaller than 10%, the data are considered to be consistent.
3 Redlich O., Kister A.T., Ind. Eng. Chem. 40, 345 (1948)4 Herington E.F.G., Nature 160, 610 (1947)5 Herington E.F.G., J. Inst. Petrol. 37, 457 (1951)
Dortmund Data Bank Page 62 of 135
Figure 54: Point-to-Point Consistency Test

DDBSP - Dortmund Data Bank Software Package 2014
14.2.2 Isobaric data
For this type of data the influence of the excess enthalpy on the Gibbs-Duhem equation must be taken into
account. In this program, this is done by an empirical parameter, which was introduced by Herington.
For nearly ideal systems this test is not applied, as areas above and below the abscissa become very small and their relative deviation can become very large due to small experimental errors.
14.3 Automatic Tests
“Automatic Tests” starts the consistency tests for all marked sets in the background and display their results in the “Comment” column of the data set grid.
“-” denotes an inconsistent data sets
“+” denotes an consistent set.
“?” denotes consistency test failure.
“*” shows that the consistency tests hasn't been performed.
Dortmund Data Bank Page 63 of 135
Figure 55: Area Test

DDBSP - Dortmund Data Bank Software Package 2014
14.4 Othmer-Tobias and Hand Correlations
These correlations are used to check the consistency of the tie lines in ternary LLE data.
Both correlations yield a straight line if the data are consistent.
14.4.1 Othmer-Tobias Tie Line Correlation
Othmer and Tobias6 published a correlation which can be used to check tie lines in ternary mixture with two immiscible component and a single co-solvent for their consistency.
14.4.1.1 Equation
The equation is
log1�a1
a1
=n log1�b2
b2
+S
with
Index 1: Aqueous phase (typically)
Index 2: Organic phase (typically)
a1: Weight fraction of solvent a in the solvent a rich phase (typically Water)
b2: Weight fraction of solvent b in the solvent b rich phase (typically an organic compound)
n: Slope
S: Constant
6 Othmer D.F., Tobias P.E., "Tie Line Correlation ", Indian Chem.Eng., 34, 693-696, 1942
Dortmund Data Bank Page 64 of 135

DDBSP - Dortmund Data Bank Software Package 2014
14.4.2 Hand Tie Line Correlation
Hand7 published a correlation which can be used to check tie lines in ternary mixture with two immiscible component and a single co-solvent for their consistency.
14.4.2.1 Equation
The equation is
logc2
b2
=n logc1
a1
+S
with
Index 1: Aqueous phase (typically)
Index 2: Organic phase (typically)
c2: Weight fraction of third component in solvent b rich phase
b2: Weight fraction of solvent b in the solvent b rich phase (typically an organic compound)
c1: Weight fraction of third component in solvent a rich phase
a1: Weight fraction of solvent a in the solvent a rich phase (typically Water)
n: Slope
S: Constant
7 Hand D.B., "Dineric Distribution. I. The Distribution of a Consolute Liquid Between Two Immiscible Liquids", J.Phys.Chem., 34, 1961-2000, 1930
Dortmund Data Bank Page 65 of 135
Figure 56: Othmer-Tobias Correlation

DDBSP - Dortmund Data Bank Software Package 2014
14.4.2.2 Example Data
LLE data set no. 1367 has an aqueous phase with small amounts of Benzene and an organic phase rich of Benzene and small amount of Water. The third component (cosolvent) is Acetic acid.
W't Fract.(Aq.) Water
W't Fract.(Aq.) Acetic
Acid
W't Fract.(Aq.) Benzene
W't Fract.(Org.) Water
W't Fract.(Org.) Acetic
Acid
W't Fract.(Org.) Benzene
EquationTerms
a1 c1 b1 a2 c2 b2
0.95401 0.04562 0.00038 0.00001 0.00150 0.99849
0.82101 0.17702 0.00197 0.00040 0.01400 0.98560
0.70600 0.29000 0.00399 0.00110 0.03270 0.96620
0.39799 0.56900 0.03301 0.00400 0.13302 0.86298
0.36799 0.59200 0.04001 0.00500 0.15002 0.84498
0.29599 0.63901 0.06500 0.00700 0.19902 0.79398
0.27500 0.64801 0.07699 0.00850 0.22802 0.76348
0.16100 0.65802 0.18098 0.01900 0.31003 0.67097
0.14400 0.64502 0.21099 0.02500 0.35303 0.62197
0.13200 0.63401 0.23399 0.03000 0.37803 0.59197
0.10700 0.59303 0.29997 0.04600 0.44703 0.50697
Dortmund Data Bank Page 66 of 135
Figure 57: Hand Correlation
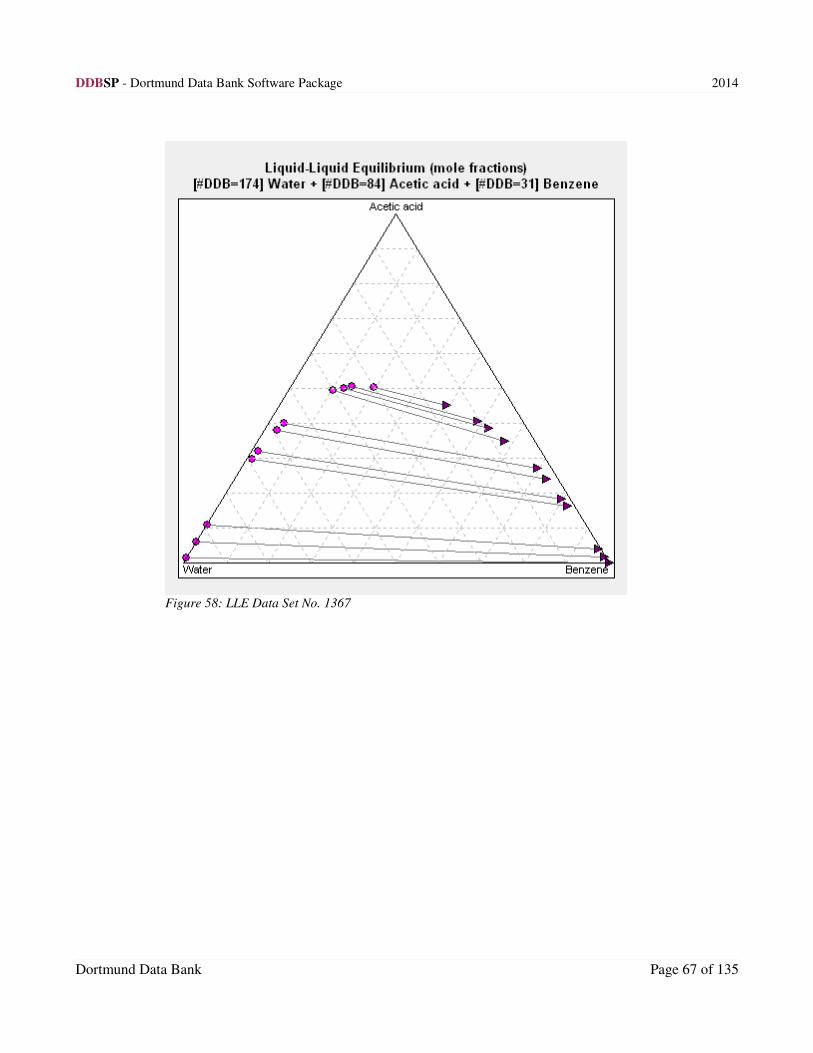
DDBSP - Dortmund Data Bank Software Package 2014
Dortmund Data Bank Page 67 of 135
Figure 58: LLE Data Set No. 1367

DDBSP - Dortmund Data Bank Software Package 2014
15 Modifying and Editing Datasets
15.1 Editing Experimental Data
A detailed description of the pure component properties and the mixture properties editors can be found in otherpapers.
Modifications of data sets from the main retrieval program are not changing database content. It only allows to
edit the currently loaded data set. The changes are lost if a query result window is closed because all data sets are removed from memory.
It is possible to edit data sets via an OLE call to the standard editors “Edit Pure Data” resp. “Edit Mixture Data”.These programs work in a special mode allowing temporary changes.
For people knowing the free formatted file format is is also possible to use an internal or external text editor. The external editor has to be configured in the DDB Configuration program.
Dortmund Data Bank Page 68 of 135
Figure 59 Menu for Editing Functions

DDBSP - Dortmund Data Bank Software Package 2014
15.2 Specifying Quality and Data Source
The quality settings are used to
comment on special weaknesses.Almost 99 % of the data sets carrythe comment “Default checkpassed” which means after thedefault check during the data inputno further problem has been
detected. The type of comment israther widespread since further testsare mentioned, changes, problemswith the references and so on.
These should not be changed bycustomers. They are additional information provided by DDBST on problematic data sets. Customers can use
the comments but normally they don't fit well on a new problem.
The “Source” settings comment on the original data source. 99 % of the data sets in the DDB are original experimental data published in tables. Other comments are given if these data are smoothed or have been evaluated from diagrams.
15.3 Evaluate Azeotropy
For binary VLE and HPV data sets it is possible to determine the azeotropic point or if the mixture is zeotropic.
Dortmund Data Bank Page 69 of 135
Figure 60: Quality/Source Settings
Figure 61 Evaluation of Azeotropy

DDBSP - Dortmund Data Bank Software Package 2014
The VLE data sets is displayed together with predicted data from activity coefficient models. In case of the gE models UNIQUAC, NRTL, Margules, van Laar, and Wilson parameters are directly fitted with temperature-independent parameters. The program uses the predicted curves which contain 101 points from x1=0. to x1=1. in xd=0.01 steps to determine the x=y position by interpolating between the closest values.
The following diagrams are displayed:
Boiling Point (DDB)
P = 101.325 kPa
PSRK
Vapor-Liquid Equilibrium
Acetone + Methanol
x,y(Acetone) [mol/mol]
10.90.80.70.60.50.40.30.20.10
T [
K]
337
336
335
334
333
332
331
330
329
P = 101.325 kPa
PSRK
Vapor-Liquid Equilibrium
Acetone + Methanol
x(Acetone) [mol/mol]
10.90.80.70.60.50.40.30.20.10
y(A
ce
ton
e)
[mo
l/m
ol]
1
0.9
0.8
0.7
0.6
0.5
0.4
0.3
0.2
0.1
0
P = 101.325 kPa
PSRK
Vapor-Liquid Equilibrium
Acetone + Methanol
x(Acetone) [mol/mol]
10.90.80.70.60.50.40.30.20.10
alp
ha
12
2.4
2.3
2.2
2.1
2
1.9
1.8
1.7
1.6
1.5
1.4
1.3
1.2
1.1
1
0.9
0.8
P = 101.325 kPa
PSRK
Vapor-Liquid Equilibrium
Acetone + Methanol
x(Acetone) [mol/mol]
10.90.80.70.60.50.40.30.20.10
K(A
ce
ton
e),
K(M
eth
an
ol)
2.3
2.2
2.1
2
1.9
1.8
1.7
1.6
1.5
1.4
1.3
1.2
1.1
1
0.9
The found azeotropic point is displayed as an uncolored hollow symbol.
The additional text output gives the exact numerical value.
Azeotropic Point Prediction
Dortmund Data Bank Page 70 of 135
Azeotropic
Point
Azeotropic
Point
Azeotropic
Point
Azeotropic
Point

DDBSP - Dortmund Data Bank Software Package 2014
4: Acetone C3H6O 67-64-1
110: Methanol CH4O 67-56-1
Temperature Pressure y (Comp.1) y (Comp.2) Type
[K] [kPa]
----------------------------------------------------------------
328.35 101.33 0.7986 0.2014 homPmax PSRK
If a azeotropic point has been found it is possible to save this point in the Dortmund Data Bank (via EditMixtureData) or in a data file (“.qr” format).
15.4 Change LEAR Number
This function allows to change the reference to the reference for all marked sets.
The dialog list all marked data sets together with the references which will be exchanged. The “Rebuild index file” option allows to update the data bank index. Otherwise the index has to be updated separately later in the IndexManager program.
Dortmund Data Bank Page 71 of 135
Figure 62 Changing Literature Number
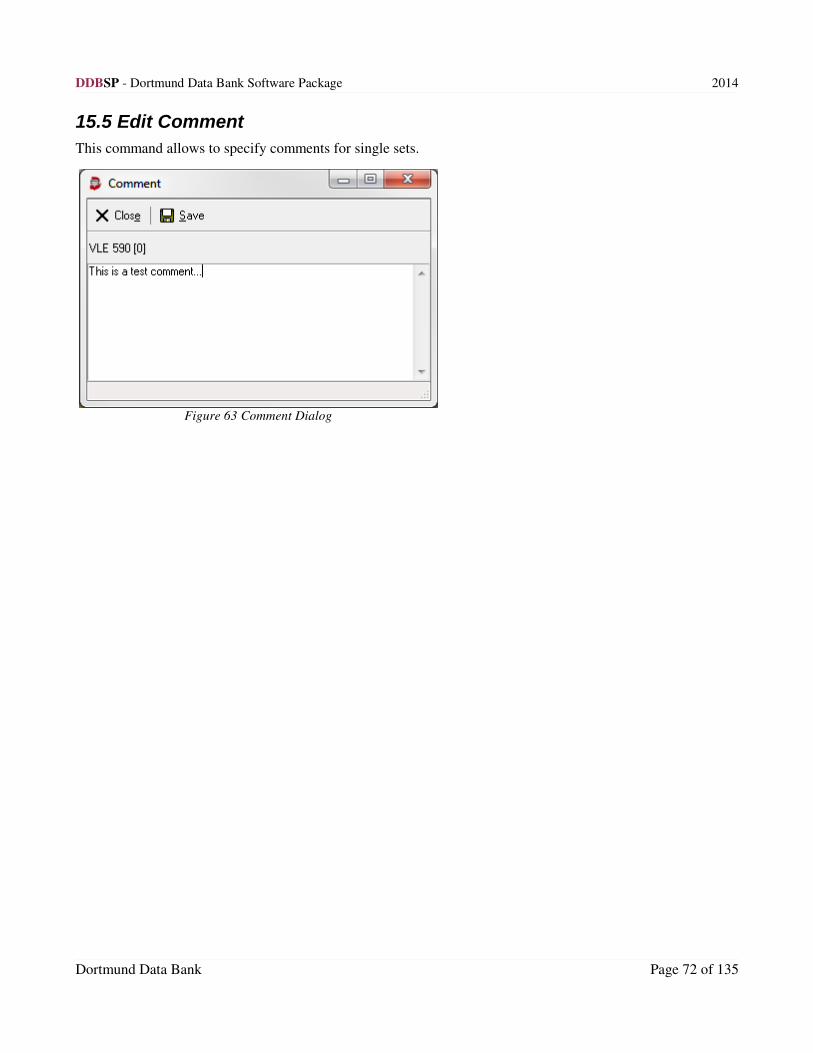
DDBSP - Dortmund Data Bank Software Package 2014
15.5 Edit Comment
This command allows to specify comments for single sets.
Dortmund Data Bank Page 72 of 135
Figure 63 Comment Dialog

DDBSP - Dortmund Data Bank Software Package 2014
15.6 Append Comment
This command allows to enter a single comment
for all selected data sets. Existing comments arenot overwritten – the new comment is appended.These comment are displayed in the single-setdisplay and, sometimes, in diagrams.
15.7 Change Component Order
Changing the component order is useful if datasets for the same systems are stored (published) indifferent orders making it difficult to compare the
tables. The same is true for comparing diagramswith different component sequences.
15.8 Add/Modify Extended References
This is a function mainly intended for internal use at DDBST. It allows to specify multiple references to a single
data set. This is normal only useful for sets published in different publication like, e.g., scientific papers and GPA reports.
15.9 Convert GLE Data Sets to HPV Data Sets
Many gas-solubility data sets are containing TPxy data or can be converted to this form. This function allows to add convertible GLE data sets to the HPV data bank page. This does not change any data banks, neither GLE nor HPV. It only copies data sets inside the query result list. The sense of this function to be able to use GLE data sets for plotting and fitting as vapor-liquid equilibrium data.
15.10 Convert HPV Data Sets to VLE Data Sets
HPV and VLE are both containing vapor-liquid equilibrium data sets. The only difference is that pressure and temperature are in different units. This function allows to alter temperature and pressure and use HPV data sets
as VLE data sets. This conversion is useful or necessary if VLE and HPV data sets need to be plotted, printed, or exported together.
Dortmund Data Bank Page 73 of 135
Figure 65: Change Component Order
Figure 64: Comment Dialog (Multiple Sets)

DDBSP - Dortmund Data Bank Software Package 2014
15.11 Convert VLE/HPV TPxy to Pxy(T) Datasets and Txy(P) Datasets
VLE/HPV “TPxy” data sets are data sets without any constant value. Since most DDBSP program need at least
a constant pressure or a constant temperature this function allows to convert these data sets to single point data sets. This makes the data sets accessible and usable mainly for the DDBSP fitting programs.
15.12 Split VIS Datasets (Isoplethic Ranges, Marked Sets)
The mixture viscosities data bank contain several very large data sets with multiple isothermal or isobaric regions or regions with constant compositions. This function allows to split these sets where one of these properties is constant. This make it much more readable and also improves some diagrams.
15.13 Create gE Model Interaction Parameters
This function allows the calculation of Wilson and UNIQUAC parameters directly from activity coefficients at infinite dilution.
The dialog shows all available limiting activity coefficients. If one data point for component 1 solved in component 2 and one data point for component 2 in component 1 is selected the parameters Λ12/ Λ21 for Wilson and τ12/ τ21 for UNIQUAC are calculated immediately. The selected coefficients should be measured at similar
temperatures.
The parameters can be saved in the parameter databank (ParameterDDB) or directly used to calculate activity coefficients and to show the result in a diagram.
Dortmund Data Bank Page 74 of 135
Figure 66: gE Model Parameters from Activity Coefficients at Infinite Dilution

DDBSP - Dortmund Data Bank Software Package 2014
15.14 Apelblat Correlation
The modified Apelblat equation
ln x=A+B
T+C lnT
is used to correlate solubilities expressed as change of mole fractions x with temperature. Enthalpies and entropies of dissolution can be calculated from its parameters.
∆ H Sol=R T(C�B
T )∆ S Sol=R(C�
B
T )The Apelblat equation can only be used for small solubilities. An example is the solubility of Norfloxacine in some alcohols, Water and Acetone. The program shows a table and a diagram with the regression results.
Dortmund Data Bank Page 75 of 135
Figure 67: Apelblat Regression - Table Output

DDBSP - Dortmund Data Bank Software Package 2014
Dortmund Data Bank Page 76 of 135
Figure 68: Apelblat Regression - Plot Output

DDBSP - Dortmund Data Bank Software Package 2014
16 Converting Data Sets to ELE Data Sets
This function can convert VLE, HPV, GLE, and EGLE data sets to ELE data sets. The different options in the menu allow collecting data sets from the source data types (vapor-liquid equilibria and gas solubilities) in a dialog and convert the collected sets in a batch.
The result is a list of ELE data sets (VLE data sets for electrolyte-containing mixtures) which can be plotted together or used in the prediction mainly by PSRK LIFAC.
Dortmund Data Bank Page 77 of 135
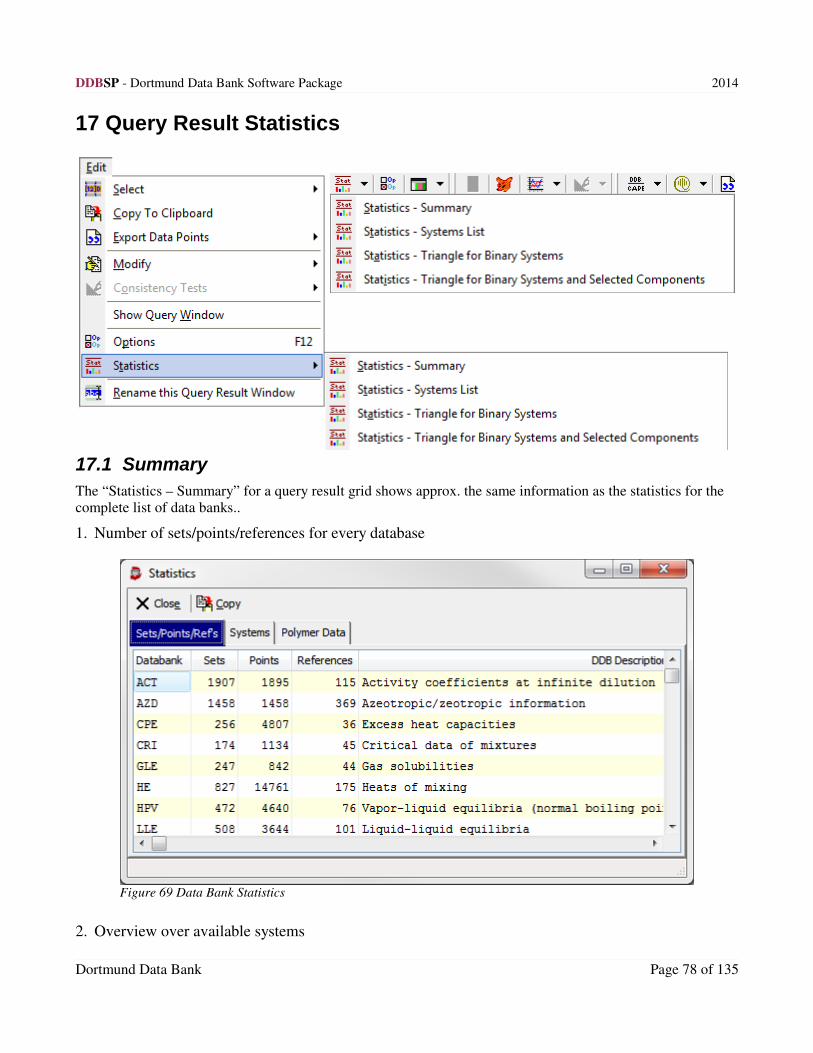
DDBSP - Dortmund Data Bank Software Package 2014
17 Query Result Statistics
17.1 Summary
The “Statistics – Summary” for a query result grid shows approx. the same information as the statistics for the complete list of data banks..
1. Number of sets/points/references for every database
2. Overview over available systems
Dortmund Data Bank Page 78 of 135
Figure 69 Data Bank Statistics

DDBSP - Dortmund Data Bank Software Package 2014
3. Number of sets/points/references for every property in the pure component properties database.
4. Details of the PolymerDDB properties
Dortmund Data Bank Page 79 of 135
Figure 71 Pure Component Properties Statistics
Figure 70 Systems Statistics

DDBSP - Dortmund Data Bank Software Package 2014
17.2 Systems List
The “Statistics – Systems List” is a list of all systems found in the data sets including the number of data sets and points and the temperature range.
17.3 Triangle for Binary Systems
This kind of display has been added to allow a quick view on how many binary systems are available for a givenlist of components.
The names in the binary triangle can short (in the form “C” plus DDB number, “C77” as an example) or the full component names can be used.
Dortmund Data Bank Page 80 of 135

DDBSP - Dortmund Data Bank Software Package 2014
18 Predict Prediction routines are available for many data banks and data types. If started from the query result window (
) component are some data ranges are already set. Almost every prediction creates artificial data sets
that are returned to the retrieval programs and displayed in a new data set grid together with the used data set.
18.1 ACM
Prediction of activity coefficients at infinite dilution of a single solute in a mixture of two solvents.
Dortmund Data Bank Page 81 of 135
Figure 73: Triangle Diagram for Binary Systems

DDBSP - Dortmund Data Bank Software Package 2014
The ACM prediction allows selecting between some gE model, some group contribution models, the COSMO-SAC
model, and with the thermodynamics engine of the Aspen simulator. The data sets can be calculated either at a constant
composition over a specified temperature range or at a constant temperature over a composition range.
The buttons allow to
produce a table and a plot output and to return the estimated data sets to the retrieval program.
Figure 74 Prediction of Activity Coefficients at Infinite Dilution - Binary Solvents
18.2 ACT
Prediction of activity coefficients at infinite dilution of a single solute in one solvent.
Dortmund Data Bank Page 82 of 135

DDBSP - Dortmund Data Bank Software Package 2014
The activity coefficients models are the same as for the ACM database plus the two group-contribution equation of state models PSRK and VTPR and the
two MOSCED models.
Two calculation types are possible:
1. Calculation of activity coefficients over a temperature range with
given start and end temperature and a step width
2. Re-calculating the temperatures in the givenexperimental data sets.
Figure 75 Prediction of Activity Coefficient at Infinite Dilution
18.2.1 Selectivity Calculation
Figure 76: Selectivity Diagram
This dialog contains an additional part “Selectivity Calculation” if
two solutes in a single solvent has been specified. This dialog is used to calculate activity coefficients at infinite dilution of two solutes in asingle solvent. If the resulting data are shown in a query result and plotted together the different gradients give information about the selectivity of the solvent for the separation of the binary mixture of the both solutes.
Dortmund Data Bank Page 83 of 135
Cyclohexane
in
AcetamideBenzene
in
Acetamide

DDBSP - Dortmund Data Bank Software Package 2014
18.3 AZD
Prediction of azeotropic points for binary mixtures.
The azeotropic prediction uses VLE calculations to determine the points where the vapor and liquid composition are equal (x=y).
Either a temperature or a pressure range can be specified.
Dortmund Data Bank Page 84 of 135
Figure 77: Selectivity Prediction Dialog

DDBSP - Dortmund Data Bank Software Package 2014
The selection of the vapor pressure equation allows two main choices:
1. The “Antoine-Low” equation has by far the most parameters available but it not able to reproduce the entire vapor pressure curve from the triple to the critical point
2. The DIPPR 101 equation is able to reproduce the entire curve but there are parameter sets for much less components available.
The DIPPR 101 parameters can be obtained from two different sources. The ParameterDDB contains
parameters made by DDBST. The other source is DIPPR but these parameters are not up-to-date anymore.
Figure 78 Prediction of Azeotropic Data
Dortmund Data Bank Page 85 of 135

DDBSP - Dortmund Data Bank Software Package 2014
18.4 ELE
Prediction of vapor-liquid equilibria for electrolyte-containing systems.
The available ELE models
are Sander, Electrolyte-NRTL, Macedo, UNIFAC (Kikič), LiQUAC, LiFAC (by Hans-Martin Polka), andmodified LiQUAC, LiFAC (by Jörn Kiepe), and PSRK
LIFAC These models can also handle binary solvents.
The models Pitzer, Chen, and Bromley can only handle pure solvents.
Figure 79 Prediction of Vapor-Liquid Equilibria of Electrolyte-Containing Systems
Dortmund Data Bank Page 86 of 135

DDBSP - Dortmund Data Bank Software Package 2014
18.5 GLE
Prediction of gas solubilities.
Gas solubilities cannot be predicted by
standard gE models because these models can't handle supercritical components. The only possible models are based on equation of states.
If the gas solubility data sets contain pressure, temperature, and liquid
compositions, or if they are convertible to such data it is possible to transfer the data to the vapor-liquid equilibrium prediction dialog (see page 88).
Figure 80 Prediction of Gas Solubilities
18.6 HE
Prediction of heats of mixing.
Dortmund Data Bank Page 87 of 135
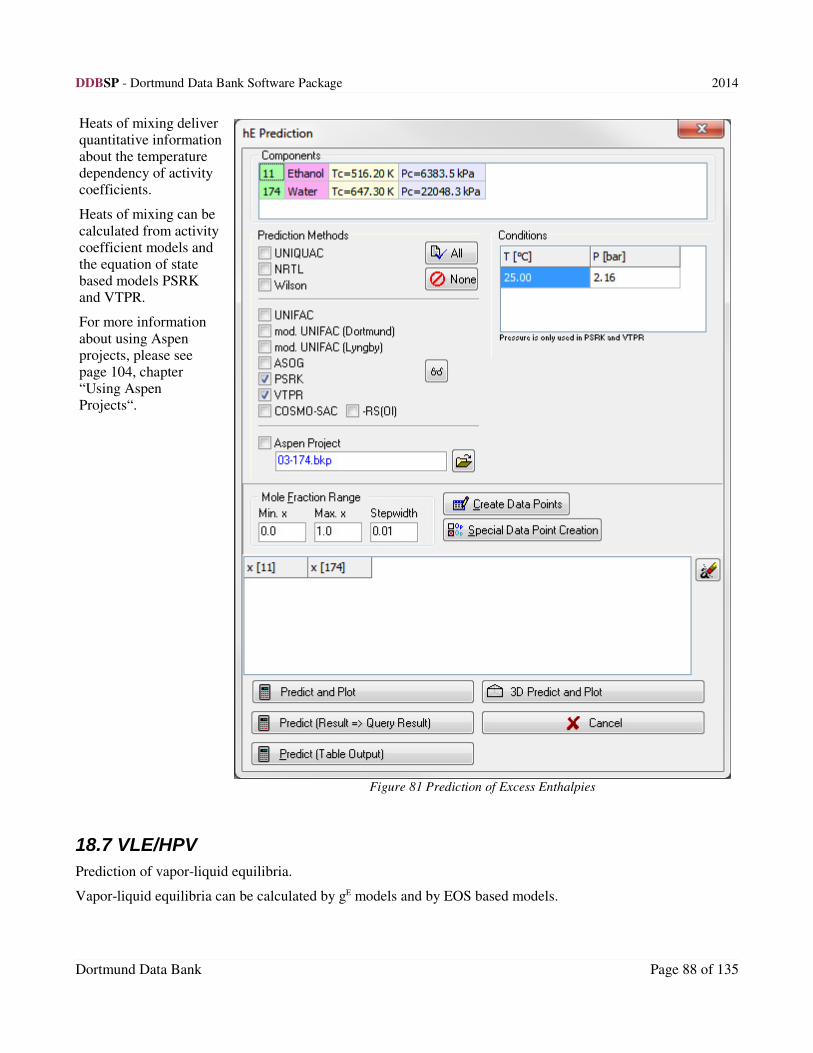
DDBSP - Dortmund Data Bank Software Package 2014
Heats of mixing deliver quantitative informationabout the temperature dependency of activity coefficients.
Heats of mixing can be
calculated from activity coefficient models and the equation of state based models PSRK and VTPR.
For more information
about using Aspen projects, please see page 104, chapter “Using Aspen Projects“.
Figure 81 Prediction of Excess Enthalpies
18.7 VLE/HPV
Prediction of vapor-liquid equilibria.
Vapor-liquid equilibria can be calculated by gE models and by EOS based models.
Dortmund Data Bank Page 88 of 135

DDBSP - Dortmund Data Bank Software Package 2014
Simple gE equation based models are Wilson, UNIQUAC, NRTL, Margules, and van Laar. These equation need binary interaction parameters for all binary subsystems. These parameters can be fitted by RecPar.
These gE models have been the basis for group contribution models which are replacing the component specific parameters by group specific parameters. These group contribution methods are original UNIFAC, modified
UNIFAC (Lyngby), modified UNIFAC (Dortmund), and ASOG. The UNIFAC models are based on UNIQUAC,and ASOG is based on Wilson.
These activity coefficient models are calculating the difference to the ideal vapor pressure curve. Therefore these models need pure component vapor pressure data for the VLE equation – these vapor pressure data are provided by Antoine equation parameters.
The PSRK and the VTPR models are based both on equations of state and a group contribution method and
allow to predict VLE data sets even if components are super-critical. VTPR is a rather new prediction method. Itcurrently has a limited number of parameters.
PSRK is under development for more than a decade now and has a much wider range of applicability.
Dortmund Data Bank Page 89 of 135
Figure 82 Prediction of Vapor-Liquid Equilibria

DDBSP - Dortmund Data Bank Software Package 2014
COSMO-SAC is a method based on molecular structure and the charge distribution of the molecular surface. This model needs component specific “profile” files.
“Recalculate Data Points” allows the user to calculate the data points of given experimental data sets.
For the selection of the vapor pressure equation please refer to the description for the explanation above in the azeotropy prediction chapter.
The vapor phase description can be done by Raoult's Law (“Ideal”), or by equation of states, or by the
Hayden-'O'Connell method.
18.7.1 Predict with EOS
The prediction of VLE with EOS is based on EOS project files. The project files can be generated by the Generate EOS Mixing Rule Parameters program (short GenPar). A project file can contain interaction parameters for several binary component pairs.
First of all a suitable EOS project file has to be selected using the EOS open button. An error message will appear if any of the components in the VLE prediction dialog is missing in the project.
After the project was loaded the name of the project file is displayed in the text field next to the EOS check box.
If the mouse is over the EOS check box and a project is loaded some details about the project are displayed as
hint.
Now the EOS can be used like any other model.
If the option “Recalculate Data Points” is activated the text out will contain the deviations for temperature,
pressure and/or vapor composition (depending on the type of data set).
18.7.2 Prediction by Aspen or PRO/II Projects or by “Extension”
These predictions use the the thermodynamic engines of the Aspen or Pro/II simulators. “Extension” is a customer-specific extension.
In all three cases a simulator-specific project file has to be loaded before starting the calculation. Details to these prediction types is available in the chapters “Using Aspen Projects“ and “PRO/II Calculations“ below.
Dortmund Data Bank Page 90 of 135
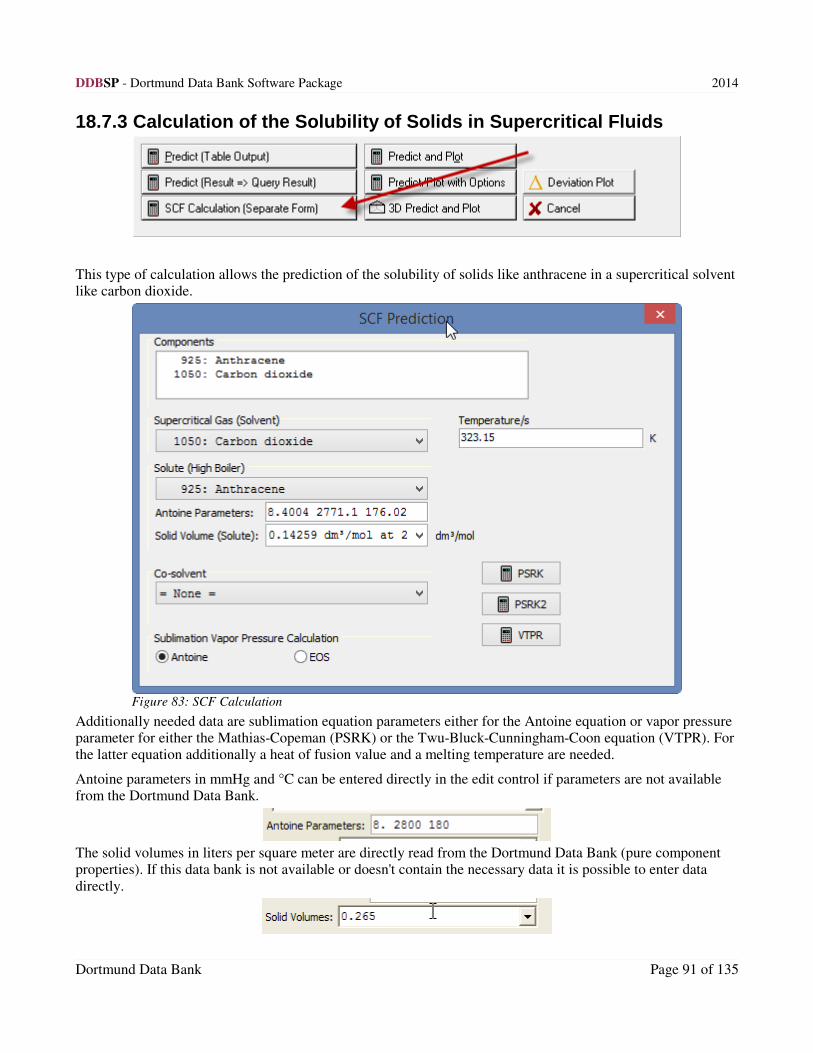
DDBSP - Dortmund Data Bank Software Package 2014
18.7.3 Calculation of the Solubility of Solids in Supercritical Fluids
This type of calculation allows the prediction of the solubility of solids like anthracene in a supercritical solventlike carbon dioxide.
Additionally needed data are sublimation equation parameters either for the Antoine equation or vapor pressure parameter for either the Mathias-Copeman (PSRK) or the Twu-Bluck-Cunningham-Coon equation (VTPR). For the latter equation additionally a heat of fusion value and a melting temperature are needed.
Antoine parameters in mmHg and °C can be entered directly in the edit control if parameters are not available from the Dortmund Data Bank.
The solid volumes in liters per square meter are directly read from the Dortmund Data Bank (pure component properties). If this data bank is not available or doesn't contain the necessary data it is possible to enter data
directly.
Dortmund Data Bank Page 91 of 135
Figure 83: SCF Calculation
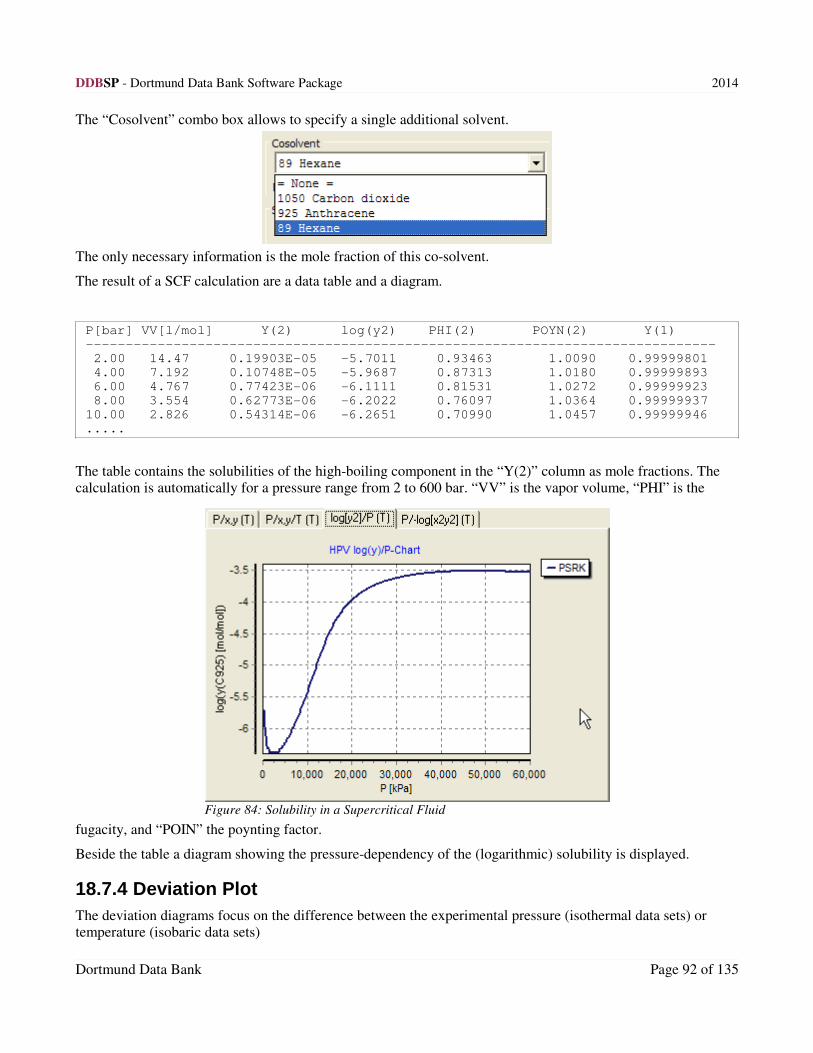
DDBSP - Dortmund Data Bank Software Package 2014
The “Cosolvent” combo box allows to specify a single additional solvent.
The only necessary information is the mole fraction of this co-solvent.
The result of a SCF calculation are a data table and a diagram.
P[bar] VV[l/mol] Y(2) log(y2) PHI(2) POYN(2) Y(1) ------------------------------------------------------------------------------- 2.00 14.47 0.19903E-05 -5.7011 0.93463 1.0090 0.99999801 4.00 7.192 0.10748E-05 -5.9687 0.87313 1.0180 0.99999893 6.00 4.767 0.77423E-06 -6.1111 0.81531 1.0272 0.99999923 8.00 3.554 0.62773E-06 -6.2022 0.76097 1.0364 0.99999937 10.00 2.826 0.54314E-06 -6.2651 0.70990 1.0457 0.99999946 .....
The table contains the solubilities of the high-boiling component in the “Y(2)” column as mole fractions. The calculation is automatically for a pressure range from 2 to 600 bar. “VV” is the vapor volume, “PHI” is the
fugacity, and “POIN” the poynting factor.
Beside the table a diagram showing the pressure-dependency of the (logarithmic) solubility is displayed.
18.7.4 Deviation Plot
The deviation diagrams focus on the difference between the experimental pressure (isothermal data sets) or temperature (isobaric data sets)
Dortmund Data Bank Page 92 of 135
Figure 84: Solubility in a Supercritical Fluid
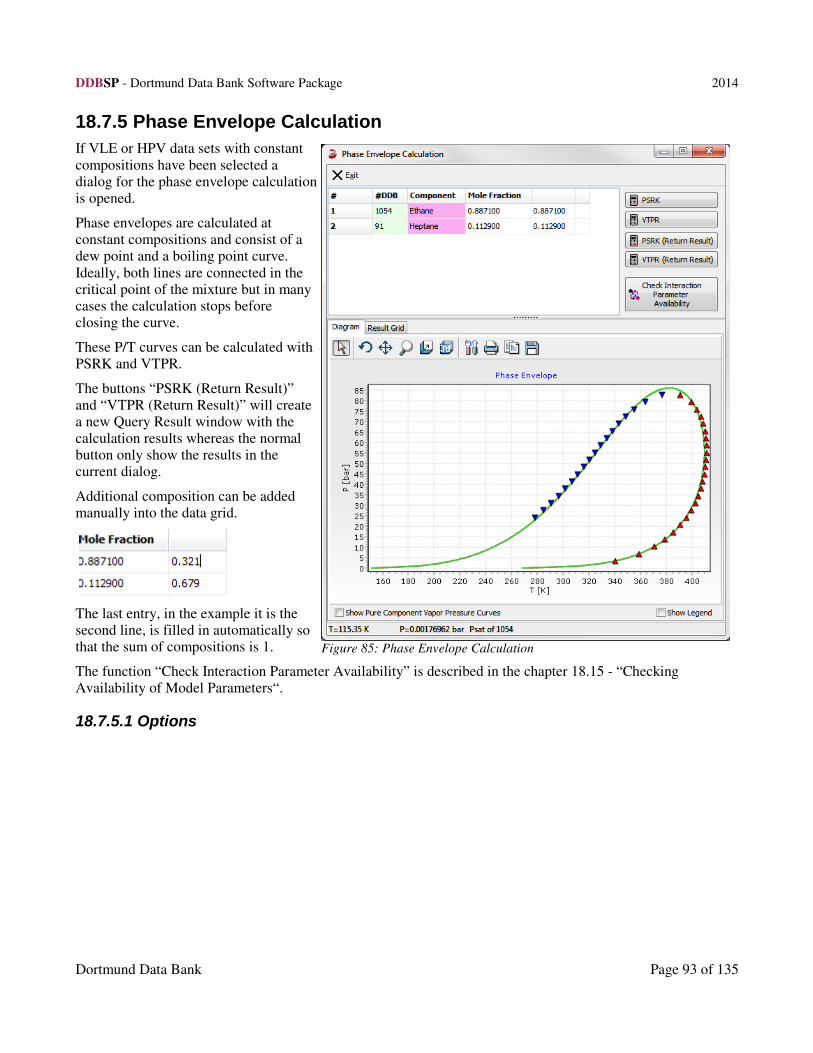
DDBSP - Dortmund Data Bank Software Package 2014
18.7.5 Phase Envelope Calculation
If VLE or HPV data sets with constant
compositions have been selected adialog for the phase envelope calculationis opened.
Phase envelopes are calculated atconstant compositions and consist of adew point and a boiling point curve.
Ideally, both lines are connected in thecritical point of the mixture but in manycases the calculation stops beforeclosing the curve.
These P/T curves can be calculated withPSRK and VTPR.
The buttons “PSRK (Return Result)”and “VTPR (Return Result)” will createa new Query Result window with thecalculation results whereas the normalbutton only show the results in thecurrent dialog.
Additional composition can be addedmanually into the data grid.
The last entry, in the example it is thesecond line, is filled in automatically sothat the sum of compositions is 1.
The function “Check Interaction Parameter Availability” is described in the chapter 18.15 - “Checking Availability of Model Parameters“.
18.7.5.1 Options
Dortmund Data Bank Page 93 of 135
Figure 85: Phase Envelope Calculation

DDBSP - Dortmund Data Bank Software Package 2014
“Show Pure Component Vapor Pressure Curve” switches the display of the pure component's vapor pressure and the critical points (circles).
Figure 86: Phase Envelopes: Pure Component Vapor Pressures
“Show Legend” shows descriptions of thecurves in the diagram
The plot options are “Zoom”, “Rotate” (3D), “Move”, “Depth” (3D), “Chart
Editor”, “Print”, “Copy”, “Save”.
Dortmund Data Bank Page 94 of 135
Figure 87: Phase Envelopes: Show Legend

DDBSP - Dortmund Data Bank Software Package 2014
18.8 LLE
Prediction of miscibility
gaps.
Liquid-liquid equilibria are predicted with the gE models UNIQUAC and NRTL – where component-specific interaction parameters are
needed. These parameters can be obtained by RecPar. The other models (original UNIFAC, modified UNIFAC (Dortmund and Lyngby), and ASOG) are group
contribution methods where the component specific parameters are replaced by group specific interaction parameters.
Newer additions to the LLE
prediction are the EOS group-contribution methods PSRK and VTPR and the support for using the thermodynamic engines of the Aspen and Pro/II
simulators.
In 2013 the COSMO based models have been introduced.
Dortmund Data Bank Page 95 of 135
Figure 88 Prediction of Miscibility
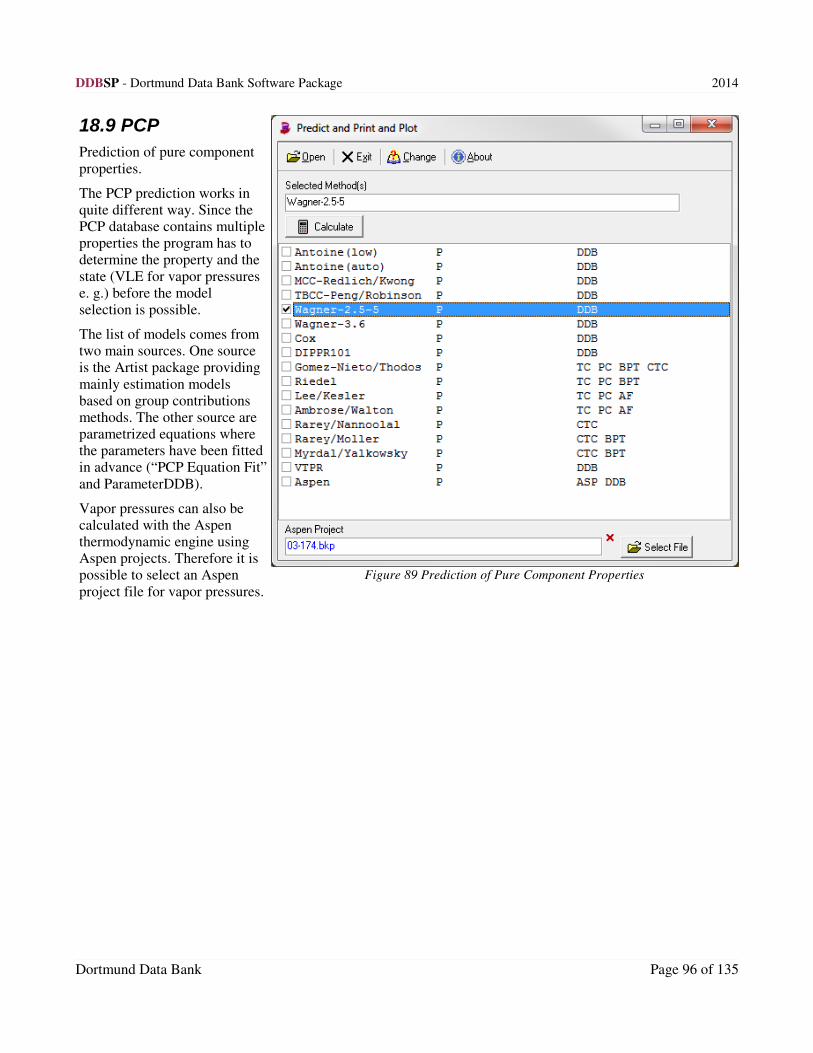
DDBSP - Dortmund Data Bank Software Package 2014
18.9 PCP
Prediction of pure component
properties.
The PCP prediction works in quite different way. Since the PCP database contains multipleproperties the program has to determine the property and the
state (VLE for vapor pressures e. g.) before the model selection is possible.
The list of models comes from two main sources. One source is the Artist package providing
mainly estimation models based on group contributions methods. The other source are parametrized equations where the parameters have been fitted in advance (“PCP Equation Fit”
and ParameterDDB).
Vapor pressures can also be calculated with the Aspen thermodynamic engine using Aspen projects. Therefore it is possible to select an Aspen
project file for vapor pressures.
Dortmund Data Bank Page 96 of 135
Figure 89 Prediction of Pure Component Properties

DDBSP - Dortmund Data Bank Software Package 2014
18.10 POW
Prediction of Octanol/Water
partition coefficients.
For Octanol/Water partition coefficient the UNIFAC model developed by Wienke and Gmehling (1998)8 is implementedand additional the “normal”
activity coefficient models original and modified UNIFAC as well as COSMO-RS(Ol), PSRK, and VTPR.
8 Wienke G., Gmehling J., "Prediction of Octanol-Water Partition Coefficients, Henry Coefficients and Water Solubilities Using Unifac",
Toxicol.Environ.Chem., 65, 57-86, 1998
Dortmund Data Bank Page 97 of 135
Figure 90 Prediction of Octanol/Water Partition Coefficients

DDBSP - Dortmund Data Bank Software Package 2014
18.11 SLE
Prediction of solubilities.
SLE calculations can be performed via standard
activity coefficient models but need heats of fusion for the pure components. Other supported models are the equation of state group contribution models PSRK and VTPR. The prediction methods always assume that the system show eutectic behavior.
A special prediction for the solubility of a high-
boiling and high-melting component in a binary mixture at constant pressure can be called by the
button.
Figure 92 Prediction of Solid-Liquid Equilibria
Dortmund Data Bank Page 98 of 135
Figure 91: Solubility in a Binary Solvent

DDBSP - Dortmund Data Bank Software Package 2014
This calculation leads to a diagram where the solubility of the high-melting component is plotted against the solute-free composition of the binary solvent mixture.
Figure 93: Solubility of a high-melting component
in a binary solvent mixture (Example: Anthracene
in Octane/Toluene)
18.12 VE
Prediction of excess volumes and densities.
The excess volume can be calculated by the equation of state group contribution methods Predictive Soave-Redlich-Kwong (PSRK)
and Volume-translated Peng-Robinson (VTPR).
“Redlich-Kister” and “Sum of Symmetrical Functions” are both equations where parameters can be fitted and stored inside theDDB system (see page 112, chapter “CPE,
VE, HE, VIS ”).
The “Deviation plot” displays the difference between estimated and experimental excess volumes or densities.
Figure 94: Prediction of Excess Volumes and Densities
Dortmund Data Bank Page 99 of 135

DDBSP - Dortmund Data Bank Software Package 2014
18.13 VIS
Prediction of Mixture Viscosities
Mixture viscosities can be predicted by the two methods Grunberg/Nissan/Isdale9 and UNIFAC-VISCO10 and the threesimple mixing rules fromArrhenius and Kendall, and
the linear mixing rule.
All these methods only estimate the excess viscosity (the reality)and need pure component viscosities at the given temperatures. These can be
calculated by the pure component equations Andrade, Vogel, DIPPR101, PPDS9, and extended Andrade. Parameters for these equations can be made with the PCPEquationFit
program. The equation forms are described in the manual of that program.
Important note: The two predictive methods Grunberg/Nissan/Isdale and
UNIFAC-VISCO both have a very limited applicibality because of few supported functional groups.
18.14 Entering gE Model Parameters
If a gE model (NTRL, UNIQUAC, etc.) has been selected for theprediction parameters for the binary component pairs have to beentered
The starting dialog displays the system or systems for which theparameters are needed.
9 Isdale J.D., MacGillivray J.C., Cartwright G., "Prediction of Viscosity of Organic Liquid Mixtures by a Group Contribution Method", Report, 1-21,
1981
10 Gaston-Bonhomme Y., Petrino P., Chevalier J.L., "UNIFAC-VISCO Group Contribution Method for Predicting Kinematic Viscosity: Extension and
Temperature Dependence", Chem.Eng.Sci., 49(11), 1799-1806, 1994
Dortmund Data Bank Page 100 of 135

DDBSP - Dortmund Data Bank Software Package 2014
The “Edit Parameters” buttons opens a dialog where the single binary parameters can be edited.
The dialog supports different temperature dependencies for the parameters
This list can be different for different phase equilibria. The “Stored Values” buttons allows to load parameters from the ParameterDDB if data are available.
The dialog has a “Load?” column where the wanted parameter set has to be checked.
Dortmund Data Bank Page 101 of 135
Binary
System(s)
Temperature
Dependency
Units
Interaction
Parameters
Paste/Copy
Aspen
Parameters

DDBSP - Dortmund Data Bank Software Package 2014
The button with the AspenTech icon allows to export the entered parameters
to a Aspen INP (“.inp”) file. This file can be loaded in the Aspen simulator. IfAspen compatible data are available in the Windows clipboard (copied from insideAspen) it is also possible to insert these parameters.
Parameters can be entered either
in [cal/mol], [J/mol] or in [K].
Being back in the main dialog itis now possible to return theparameters to the calculationprogram:
It is also possible to save entered parameters to a parameter file (“.gpf”) or to the ParameterDDB.
The “.gpf” files can also be loaded (“Open Parameters File(s)”). Additionally it is possible to import data from “.rvo” files generated from RecPar, the simultaneous fit tool.
Dortmund Data Bank Page 102 of 135

DDBSP - Dortmund Data Bank Software Package 2014
18.15 Checking Availability of Model Parameters
The glasses button opens a dialog with a short and a detailed display of available model specific parameters for the group contribution methods and for the COSMO models.
The “Overview” page gives a quick overview if model specific parameters are available. Green lines indicate that all data are available, red lines indicate missing parameters.
The “Details” page shows the available and missing required data.
UNIFACComponent 17: Aniline
Subgroups: 9 (ACH ) 36 (ACNH2 )
Component 49: 3-Methylphenol
Subgroups: 9 (ACH ) 11 (ACCH3 ) 17 (ACOH )
List of Main Groups
Maingroups: 3 (ACH ) 4 (ACCH2 ) 8 (ACOH ) 17 (ACNH2 )
Interaction parameters
3 - 4: 1 parameter/s
3 - 8: 1 parameter/s
3 - 17: 1 parameter/s
Dortmund Data Bank Page 103 of 135
Figure 95: Checking Availability of Parameters of Group
Contribution Methods

DDBSP - Dortmund Data Bank Software Package 2014
4 - 8: 1 parameter/s
4 - 17: 1 parameter/s
8 - 17: 1 parameter/s
System has all parameters available.
mod. UNIFAC (Lyngby)Component 17: Aniline
Subgroups: 10 (ACH ) 11 (AC ) 30 ((A)NH2 )
Component 49: 3-Methylphenol
Subgroups: none given
18.16 Using Aspen Projects
In some prediction dialogs it is possible to select an Aspen simulator project.
If no Aspen simulator software is installed an error message is shown with the supported Aspen software versions:
If Aspen is installed and an Aspen project is selected the prediction will use the Aspen internal
thermodynamic calculation functions to calculate the respective property and create DDB standard
diagrams and table outputs.
Aspen Projects (“inp”, “bkp” and “apt” files) can be loaded and the information about the components can be extracted.
The first step after loading such a file is the identification of the components.
The Dortmund Data Bank knows already many of the Aspen internal component codes and is able to identify several hundred of the components directly. If a component has not been identified it is either necessary to find the component in the DDB or add the component to the DDB component list.
Dortmund Data Bank Page 104 of 135

DDBSP - Dortmund Data Bank Software Package 2014
If multiple Aspen simulator versions are installed it is possible to select one of them through a drop-down menu.
Figure 96: Change Component Number
Figure 97: Add as New Component
The components in the loaded Aspen file must match the currently selected component list.
If the component lists don't match an error message is displayed and a prediction will fail.
Dortmund Data Bank Page 105 of 135
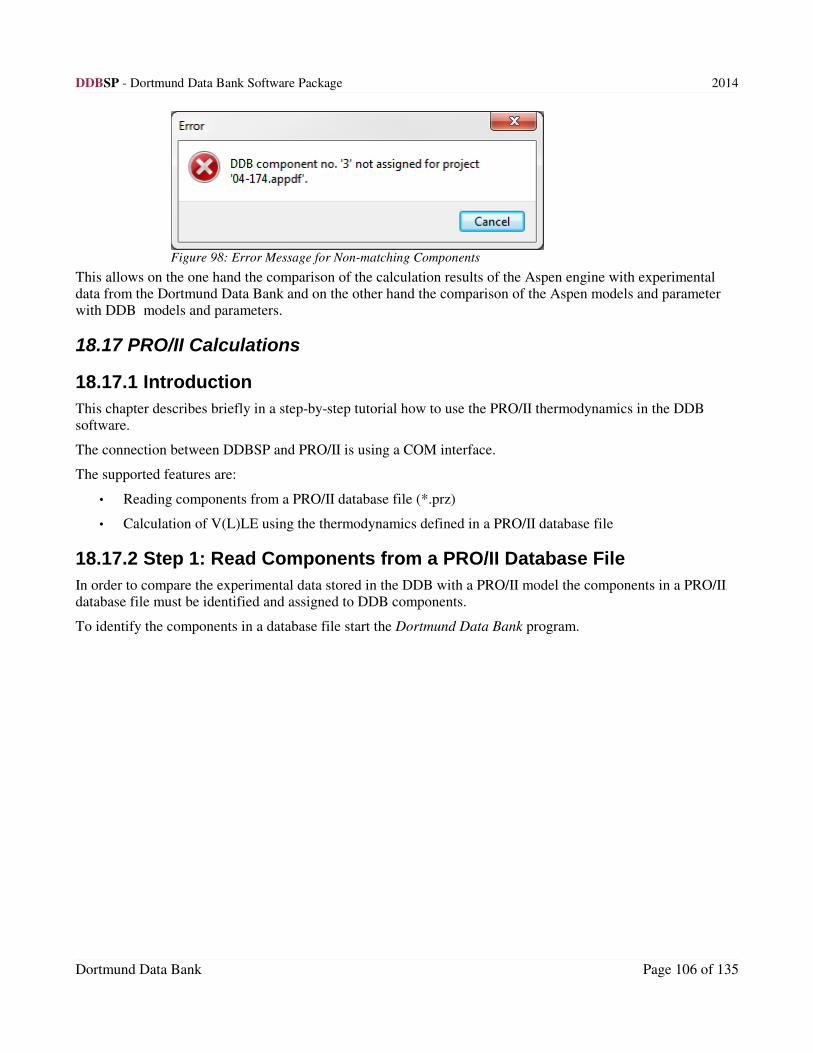
DDBSP - Dortmund Data Bank Software Package 2014
This allows on the one hand the comparison of the calculation results of the Aspen engine with experimental data from the Dortmund Data Bank and on the other hand the comparison of the Aspen models and parameter with DDB models and parameters.
18.17 PRO/II Calculations
18.17.1 Introduction
This chapter describes briefly in a step-by-step tutorial how to use the PRO/II thermodynamics in the DDB software.
The connection between DDBSP and PRO/II is using a COM interface.
The supported features are:
• Reading components from a PRO/II database file (*.prz)
• Calculation of V(L)LE using the thermodynamics defined in a PRO/II database file
18.17.2 Step 1: Read Components from a PRO/II Database File
In order to compare the experimental data stored in the DDB with a PRO/II model the components in a PRO/II database file must be identified and assigned to DDB components.
To identify the components in a database file start the Dortmund Data Bank program.
Dortmund Data Bank Page 106 of 135
Figure 98: Error Message for Non-matching Components

DDBSP - Dortmund Data Bank Software Package 2014
Figure 99: The Dortmund Data Bank Program
Click on the Import PRO/II Components button to open a PRO/II database file. After opening the file a component assignment dialog is displayed.
The system tries to assign the components automatically. This is done by the ChemAbsNum stored in the PRO/IIdatabase.
Dortmund Data Bank Page 107 of 135

DDBSP - Dortmund Data Bank Software Package 2014
If a component could not be identified or the identification is wrong the user can select a component from the DDB component list using the Change DDB Number button. If the component is not found in the DDB a new component can be defined using the Add as New Component button.
After all assignments have been done the components can be added to the query using the Add Components to
Query button.
Figure 101: Query Component List
Unwanted components can be removed from the list using the Remove button.
18.17.3 Step 2: Search for Experimental Data in the DDB
After the components of interest have been defined within the Dortmund Data Bank program the DDB can be
searched to find experimental data. In order to search for data for the system Cyclohexane + 2-Propanol the components with the DDB number 50 and 95 have to be added to the query. Click on the button System (Exact
Match) in the Search area to find data for the binary system.
The result is grouped by data types. To see the result for vapor-liquid-equilibrium data click on the VLE tab.
Dortmund Data Bank Page 108 of 135
Figure 100: Open PRO/II Database File Dialog

DDBSP - Dortmund Data Bank Software Package 2014
18.17.4 Step 3: Calculate VLE Using the PRO/II Thermodynamics
The experimental data in a query result can be used as basis for a calculation.
Select the data of interest and press the Predict selected datasets button. The VLE/HPV Prediction dialog will be displayed. The components of the first selected dataset will be used as system for the prediction.
Figure 104: VLE Prediction Components
The PRO/II database file which has been opened most recently within the DDB software is selected as default file to be used for a calculation with PRO/II.
Figure 105
Use the Select PRO/II Project button next to the displayed file name to select a different file for the calculation. Then a dialog similar to Figure 100 on page 108 will be displayed. In addition to the dialog in step 1 the thermo set can be selected.
Dortmund Data Bank Page 109 of 135
Figure 102: Query Result for Binary System
Figure 103: Query Result with VLE Predict Button

DDBSP - Dortmund Data Bank Software Package 2014
If the mouse is over the PRO/II Project checkbox some additional information is displayed.
Figure 106: PRO/II File Additional Information
To calculate with PRO/II only all models in the Prediction Method area have to be deselected, just the PRO/II model must be active. All selected models will be used in a calculation.
If several data sets have been selected it is possible to calculate all temperatures (for isothermal calculation) or all pressures (for isobaric calculation).
Figure 107: Calculate All Pressures
For a quick comparison between the experimental data and the model(s) the Predict and Plot button can be
used.
Figure 108: Predict Buttons
The experimental data together with the calculated results will be displayed in a plot with several diagrams.
For a text output the Predict (Table Output) button can be used. The button Predict (Result => Query Result)
will send the predicted data to the Dortmund Data Bank program.
Dortmund Data Bank Page 110 of 135

DDBSP - Dortmund Data Bank Software Package 2014
Dortmund Data Bank Page 111 of 135
Figure 109: VLE T/x,y DiagramFigure 110: VLE x/y Diagram

DDBSP - Dortmund Data Bank Software Package 2014
19 Fit Equation Parameters
Fit programs are available for some data banks. The fit routine ( ) always uses the list of marked sets, if
the fit routine can handle multiple sets or the currently sets, if only single sets can be used.
19.1 AAE
Adsorbent-adsorptive equilibria data sets with isothermal and single adsorptive data sets can be
fitted.
Figure 111 Fit of Adsorbent-Adsorptive Equilibria
19.2 CPE, VE, HE, VIS
The four data banks contain excess data or data thatbe converted to an excess property (excess heatcapacities, excess volumes, excess enthalpies,viscosity deviations). All these excess values have
a similar curvature and therefore the type of fit isthe same.
Two equations are implemented, “Redlich-Kister”and “Sum of Symmetrical Functions” with differentnumber of parameters.
19.2.1 Redlich-Kister
vE
x1 x2
=∑i=1
n
Ai2 x1�1i�1
n=1..6
Dortmund Data Bank Page 112 of 135
Figure 112 Fit of Excess Properties

DDBSP - Dortmund Data Bank Software Package 2014
19.2.2 Sum of Symmetrical Functions
vE=∑
i=1
m Ai x1 x2
x1
a i
x2 ai2
m=1..3
A table with the numerical results are displayed in a second window. The button “Fit/Table/Plot Best Model” automatically fit the data with both equation and all possible parameter count and displays the result with the lowest deviation.
Dortmund Data Bank Page 113 of 135
Figure 113 Plot Result for Excess Properties' Fit

DDBSP - Dortmund Data Bank Software Package 2014
If the check box “Prepare Storing Results in Parameter Database” is checked a dialog with the fitted parameters is shown which allows storing the values in either the public or private parameter data base.
Figure 114: Excess Properties Fit: Store Parameters
The stored parameters can then be used to predict the property they describe.
A typical fit result table shows the components, the parameters, and the data table with experimental data from the DDB and recalculated values by the selected equation.
Dortmund Data Bank Page 114 of 135

DDBSP - Dortmund Data Bank Software Package 2014
19.3 GLE
Only binary gas-solubility data – which are also convertible to
T/Henry data – can be fitted.
Figure 116: Gas Solubilities: Fit of Henry
Coefficients
The obtained parameters ca be saved in the ParameterDDB
If the GLE data set can be converted to TPxy data it is possible to transfer the set to the VLE/HPV fit. This VLEfit then allows the regression of gE model parameters.
19.4 LLE
Liquid-liquid equilibrium data can be fitted by NRTL and UNIQUAC. If binary sets are selected it is possible toselect temperature-dependent equation for the interaction parameters.
In case of ternary data sets only temperature independent parameters can be fitted.
Binary LLE data sets must contain at least two tie-lines, ternary data sets must have three.
Dortmund Data Bank Page 115 of 135
Figure 115: Result of Henry Coefficients Fit

DDBSP - Dortmund Data Bank Software Package 2014
If the option
is checked it is possible to save the fitted parameters in the private ParameterDB.
Only the first three temperature dependencies (constant, linear, quadratic) are supported.
Dortmund Data Bank Page 116 of 135
Figure 117 Fitting Binary LLE Datasets Figure 118 Fitting Ternary LLE Datasets
Figure 119 Storing Fitted LLE Parameters

DDBSP - Dortmund Data Bank Software Package 2014
19.5 PCP
For pure component data the external program “PCPEquationFit” is started.
This program is described in a separate manual.
Dortmund Data Bank Page 117 of 135
Figure 120: LLE Fit Result
xl1
xl2
NRTL (alpha(i,j)=0.2)
Liquid-Liquid Equilibrium
Benzene + Water
xl1,xl2(Benzene) [g/g]
10.90.80.70.60.50.40.30.20.10
T [
°C]
200
180
160
140
120
100
80
60
40

DDBSP - Dortmund Data Bank Software Package 2014
19.6 SLE
Solid-liquid equilibrium data can be fitted by gE models.
Dortmund Data Bank Page 118 of 135
Figure 122 Fitting SLE Datasets
Figure 121 Fitting Pure Component Properties

DDBSP - Dortmund Data Bank Software Package 2014
If “Prepare Storing Results...” is checked the program allows to store the fitted parameters to the ParameterDDB.
Only binary eutectic systems can be fitted.
19.7 VLE/HPV
Dortmund Data Bank Page 119 of 135
Figure 123 Storing Parameters

DDBSP - Dortmund Data Bank Software Package 2014
Vapor-liquid equilibrium data sets can be fitted either by gE models (Margules, van Laar, Wilson, NRTL, UNIQUAC) or by equation of states with mixing rules. The EOS fit routines uses the following models and
equations:
1. The supported equation of state are Soave-Redlich-Kwong (SRK) or Peng-Robinson (PR)
2. α-function: original SRK or PR with α = f(ω); ω: acentric factor
3. The gE mixing rule is the Vidal mixing rule
4. The b mixing rule is the linear mixing rule
5. The supported gE models for the mixing rule are NRTL, UNIQUAC, Wilson, and a modified NRTL version. The latter is displayed as “gE(Vidal)”, it has been published in the paper of Huron and Vidal,
Fluid Phase Equilibria, volume 3, 1979, 255-271. Its gE expression includes a volume parameter b(i).
Dortmund Data Bank Page 120 of 135
Figure 124 Fitting VLE Datasets

DDBSP - Dortmund Data Bank Software Package 2014
The buttons allow to enter starting
values for the fit.
Figure 125 Manual Exchange of Start Values
The option should be used if the VLE data sets seem to use a different pure
component pressure than the normal Antoine constants are calculating. Since the gE models only fit the difference between the real and the ideal vapor pressure curve (activity) a larger gap would result in wrong fits.
“Fit/Table” and “Fit/Plot” do what they are expected to do. “Fit DCDS” creates a data page for the DECHEMA
Chemistry Data Series.
Dortmund Data Bank Page 121 of 135
Figure 126 DCDS Compatible Output

DDBSP - Dortmund Data Bank Software Package 2014
20 Simultaneous Fit – RecVal/3The previous chapter listed fit routines for the different data types. The “RecVal” program allows to fit gE modelparameters (Wilson, Margules, UNIQUAC, NRTL, van Laar) for several data banks simultaneously. These data types are
• vapor-liquid equilibria (VLE and HPV)
• liquid-liquid equilibria (LLE)
• solid-liquid equilibria (SLE)
• activity coefficients at infinite dilution (ACT)
• heats of mixing (HE)
• azeotropic information (AZD)
Before RecVal is started the data sets have to collected in the RecVal dialog.
The data sets can be copied to the RecVal collection either individually by drag and drop or by choosing the options
• Add all possible data setsEvery fittable data sets in the query result list from all usable data banks are copied in the RecVal collection and the RecVal collection window is opened.
• Add marked data sets
The currently selected sets are copied to the RecVal collection and the RecVal collection window is opened.
RecVal then can be started by the button.
Dortmund Data Bank Page 122 of 135
Figure 127: Data Set List for Simultaneous Regression

DDBSP - Dortmund Data Bank Software Package 2014
The quickest possibility to start RecVal but with no possibility to influence the data set list is to “Start RecVal directly with all possible data sets”.
RecVal itself is described in a separate document.
Dortmund Data Bank Page 123 of 135

DDBSP - Dortmund Data Bank Software Package 2014
21 Simultaneous Fit – RecParRecPar is currently an additional feature when RecVal is ordered and is a replacement for RecVal/3.
RecPar also performs the fit of parameters to different properties simultaneously. Invoking RecPar is slightly different from invoking RecVal because it is an internal dialog within Dortmund Data Bank software – so no data have to be transferred.
The RecPar menu entries are in the RecVal/3 menu.
A full description is available in a separate PDF.
Dortmund Data Bank Page 124 of 135

DDBSP - Dortmund Data Bank Software Package 2014
22 PlotThe plot functions are explained in a separate document.
Dortmund Data Bank Page 125 of 135

DDBSP - Dortmund Data Bank Software Package 2014
23 Data Export
23.1 PPDX format
The Physical Properties Data eXchange file format is a result of a joined committee of several people from mainly German chemical industry and is intended as a standard file format for the exchange of experimental data and parameters between programs from independent vendors. It is part of the efforts to provide some kind of standard for
information exchange in the computer-aided process engineering (CAPE) area.
The PPDX format is purely text based and uses tags for identifying data types. It is easy to read by humans but unfortunately quite difficult to write and read correctly by computer programs since it lacks some necessary definitions and information. A more detailed description of the format and its problem is available in a separate document.
The current definition document can be obtained from DECHEMA.
PPDX data files always carry the extension “.IKC”. All marked sets are exported together in a single file.
The option “Use Aspen Alias” can be used to export the Aspen alias for components in the FORMULA block instead of the normal empirical formula. Aspen aliases are available for approx. 1500 components. Using this alias allows the Aspen simulator software to match the imported components easily to its own component system.
The option “Write Basic Component Data” adds some data from the DDB's component definition file like critical data and more.
A typical output is
! PHYSICAL-PROPERTY-DATA-EXCHANGE
! DDBST-PPDX-INTERFACE, Rel. 1.1.0.2
! ------------------------------------------------
! 29.04.2004 10:22:47
! Copyright: DDBST GmbH (2000-2002)
! ------------------------------------------------
VERSION IKC-PPDX 1.6
INITIALIZE
END INITIALIZE
PRIVATE
END PRIVATE
IGNORE
END IGNORE
SOURCE
KEY Lit-477
AUTHOR "Nagai J.,Ishii N."
TITLE "Studies on Volatility of Fuels Containing Ethyl Alcohol. II-IV.
& Calculation of Starting Temperatures of an Engine when using Ethyl
& Alcohol-Ethyl Ether Mixtures as its Fuel"
JOURNAL "J.Soc.Chem.Ind.Jap. = Kogyo Kagakkai"
YEAR 1935
PAGE 86-95
Dortmund Data Bank Page 126 of 135

DDBSP - Dortmund Data Bank Software Package 2014
VOLUME 38
ISSUE 3
END KEY Lit-477
KEY Lit-0
AUTHOR "Gmehling et al."
TITLE "Dortmund Databank - Pure Component Basic File"
JOURNAL "Electronic Databank"
YEAR 1973-2004
END KEY Lit-0
END SOURCE
COMP-DEF
CID DDB11
NAME Ethanol
CAS-NO 64-17-5
FORMULA C2H6O-2
END CID DDB11
CID DDB12
NAME Diethyl ether
CAS-NO 60-29-7
FORMULA C4H10O-5
END CID DDB12
END COMP-DEF
PURE-COMP-DATA
PROPERTIES
MW $ DDB11 46.069 kg/kmol $ $ $ Lit-0
TC $ DDB11 516.20 K $ $ $ Lit-0
PC $ DDB11 63.0 atm $ $ $ Lit-0
VC $ DDB11 167.00 cm^3/mol $ $ $ Lit-0
OMEGA $ DDB11 0.63 - $ $ $ Lit-0
TMP $ DDB11 -114.50 C $ $ $ Lit-0
HLSM $ DDB11 1199.2 J/mol $ $ $ Lit-0
MW $ DDB12 74.122 kg/kmol $ $ $ Lit-0
TC $ DDB12 466.70 K $ $ $ Lit-0
PC $ DDB12 35.9 atm $ $ $ Lit-0
VC $ DDB12 280.00 cm^3/mol $ $ $ Lit-0
OMEGA $ DDB12 0.28 - $ $ $ Lit-0
TMP $ DDB12 -116.30 C $ $ $ Lit-0
HLSM $ DDB12 1736.9 J/mol $ $ $ Lit-0
END PROPERTIES
PARAMETERS
UNIQUAC r $ DDB11 2.1055
UNIQUAC q $ DDB11 1.9720
UNIQUAC r $ DDB12 3.3949
UNIQUAC q $ DDB12 3.0160
END PARAMETERS
FUNCTION vapor-pressure
NAME ANTOINE
COMPONENT DDB11
PROPERTY PVL T
UNIT mmHg C
LOWER-BOUND -57
UPPER-BOUND 80
COEFFICIENTS 8.2042 1642.9 230.30
END FUNCTION vapor-pressure
FUNCTION vapor-pressure
NAME EXANTOINE
COMPONENT DDB11
Dortmund Data Bank Page 127 of 135

DDBSP - Dortmund Data Bank Software Package 2014
PROPERTY PVL T
UNIT mmHg C
LOWER-BOUND -57
UPPER-BOUND 80
COEFFICIENTS 21.0157 3782.9 -42.85
END FUNCTION vapor-pressure
FUNCTION vapor-pressure
NAME ANTOINE
COMPONENT DDB12
PROPERTY PVL T
UNIT mmHg C
LOWER-BOUND -101
UPPER-BOUND 35
COEFFICIENTS 7.1263 1151.8 236.99
END FUNCTION vapor-pressure
FUNCTION vapor-pressure
NAME EXANTOINE
COMPONENT DDB12
PROPERTY PVL T
UNIT mmHg C
LOWER-BOUND -101
UPPER-BOUND 35
COEFFICIENTS 18.5337 2652.0 -36.16
END FUNCTION vapor-pressure
END PURE-COMP-DATA
MIXTURE-DATA
TABLE VLE641
SOURCE-KEY Lit-477
COMPONENTS DDB12 DDB11
PROPERTY P x y T
STATE VLE
UNIT "kPa" "mol/mol" "mol/mol" "K"
DATA 20.526 0.05 0.5092 303.150
DATA 29.731 0.1 0.6771 303.150
DATA 37.197 0.15 0.7538 303.150
DATA 43.323 0.2 0.7977 303.150
DATA 48.657 0.25 0.8278 303.150
DATA 51.926 0.3 0.8455 303.150
DATA 57.201 0.35 0.8656 303.150
DATA 60.595 0.4 0.8785 303.150
DATA 63.731 0.45 0.8897 303.150
DATA 66.493 0.5 0.8993 303.150
DATA 68.96 0.55 0.9077 303.150
DATA 71.141 0.6 0.9153 303.150
DATA 73.101 0.65 0.9223 303.150
DATA 76.26 0.7 0.9305 303.150
DATA 76.996 0.75 0.9371 303.150
DATA 78.794 0.8 0.9451 303.150
DATA 80.633 0.85 0.954 303.150
DATA 82.473 0.9 0.9651 303.150
DATA 84.333 0.95 0.9789 303.150
END TABLE VLE641
END MIXTURE-DATA
In addition to the experimental data some basic pure component information is exported.
Supported data banks are
• VLE and HPV – vapor-liquid equilibria
• LLE – liquid-liquid equilibria
Dortmund Data Bank Page 128 of 135

DDBSP - Dortmund Data Bank Software Package 2014
• HE – mixing enthalpies
• GLE – gas solubilities
• VE – (excess) volumes and densities
• PCP – pure component properties
• ACT – activity coefficients at infinite dilution
• AZD – azeotropic information
• SLE – solid-liquid equilibria
• CPE – (excess) heat capacities
23.2 Aspen INP Format
The Aspen INP format is the format for the AspenTech simulator and other related software. A detailed description can be found in the AspenTech documentation.
Supported databanks are
• VLE and HPV – vapor-liquid equilibria
• LLE – liquid-liquid equilibria
• HE – enthalpies of mixing
• GLE – gas solubilities
• AZD – azeotropic information
• ACM and ACT – activity coefficients at infinite dilution
• PCP – selected pure component properties.
Pure component and mixture properties can't be exported in the same file.
Data sets have to be collected before they can be exported. This “collection” is done by drag'n'drop from the data set list in the query result window to the Aspen window.
The drop-down-dialog provides two other modes.
Dortmund Data Bank Page 129 of 135

DDBSP - Dortmund Data Bank Software Package 2014
• “Add selected sets”The collection dialog is opened and all marked sets are inserted.
• “Add all possible data sets”The collection dialog is opened and all exportable data sets from all supported data banks are inserted. If the pure component properties (PCP) data bank has been active this collector dialog only contains PCP data and won't accept mixture property data sets. If any supported mixture properties data bank is active only mixture properties will be added to the collector dialog and PCP data won't be accepted.
The export function can write additional property table for some data types (VLE, GLE, LLE). Adding these
flash-curve blocks forces the Aspen simulator to perform some calculations after loading the file.
Aspen INP normally have the extension “.INP” but can also have the extension “.APRINP”.
A typical output is
;
; INP file generated by DDBSP 2014/Mixture Properties
; 07.03.2014 10:22:27
; Copyright: DDBST GmbH, Marie-Curie Str. 10, D-26129 Oldenburg
;
; Filename: C:\Scratch\test.inp
;
; NOTE (GLE Conversion)
;
; The GLE conversion makes the following assumptions and usage of equations:
;
; The gas partial pressure calculation from total pressure or vice versa
; assumes that Raoult's Law and Dalton's Law are valid. Furthermore the
; vapor pressure of the solvent is calculated using the Antoine equation.
;
; If necessary for the calculation of the amount of substance a liquid density
; equation, a fixed Normdensity table (Bunsen, Kuenen) or the Ideal Gas Law
; is used. It is furthermore assumed that mixing effects are irrelevant for the
; liquid density.
Dortmund Data Bank Page 130 of 135
Figure 128: Aspen INP Export - Data Set List – Mixture Data Banks

DDBSP - Dortmund Data Bank Software Package 2014
;
DRS
TITLE 'Export of DDB Datasets'
IN-UNITS SI TEMP=C PRES=MMHG
DATABANKS 'APV84 PURE28' / 'APV84 INORGANIC' / 'APV84 AQUEOUS' / NOASPENPCD
PROP-SOURCES 'APV84 PURE28' / 'APV84 INORGANIC' / 'APV84 AQUEOUS'
; cid cname outid
; cid is always DDB?????? with ?????? as DDB component number
; cname is Aspen component id, if available or * if not
; outid is empty.
COMPONENTS
DDB11 C2H6O-2 /
DDB12 C4H10O-5
PROPERTIES IDEAL
CASE R-1
DATA-GROUPS VLE175 / VLE176 / VLE177
REPORT KVL GAMMA PBUB ALPHA
CASE-OPTION REGRESSION=NO
DATA-GROUP VLE175
DESCRIPTION "[866] Moeller 1951, VLE175"
IN-UNITS PRESSURE=KPA TEMPERATURE=K
SYSTEM-DEF TPXY DDB12 DDB11 COMPOSITION=MOLE-FRAC
PHASE-EQ VL DDB12 DDB11
DATA 1 377.65 287.483 0.007 0.16 /
2 376.75 287.483 0.009 0.129 /
3 373.15 287.483 0.025 0.248 /
4 365.45 287.483 0.08 0.426 /
5 359.65 287.483 0.132 0.527 /
6 355.45 287.483 0.205 0.641 /
7 348.15 287.483 0.405 0.779 /
8 346.95 287.483 0.454 0.786 /
9 343.65 287.483 0.64 0.877 /
10 342.15 287.483 0.863 0.96
STD-DEV 1 0.1 -0.1 -1 -1
DATA-GROUP VLE176
DESCRIPTION "[866] Moeller 1951, VLE176"
IN-UNITS PRESSURE=KPA TEMPERATURE=K
SYSTEM-DEF TPXY DDB12 DDB11 COMPOSITION=MOLE-FRAC
PHASE-EQ VL DDB12 DDB11
DATA 1 400.15 721.847 0.065 0.251 /
2 396.35 721.847 0.119 0.36 /
3 395.65 721.847 0.127 0.359 /
4 386.15 721.847 0.303 0.555 /
5 384.65 721.847 0.323 0.575 /
6 383.15 721.847 0.363 0.602 /
7 381.05 721.847 0.447 0.664 /
8 380.15 721.847 0.565 0.759 /
9 379.15 721.847 0.723 0.842 /
10 378.15 721.847 0.933 0.967
STD-DEV 1 0.1 -0.1 -1 -1
DATA-GROUP VLE177
DESCRIPTION "[866] Moeller 1951, VLE177"
IN-UNITS PRESSURE=KPA TEMPERATURE=K
Dortmund Data Bank Page 131 of 135

DDBSP - Dortmund Data Bank Software Package 2014
SYSTEM-DEF TPXY DDB12 DDB11 COMPOSITION=MOLE-FRAC
PHASE-EQ VL DDB12 DDB11
DATA 1 382.55 515.011 0.039 0.217 /
2 379.15 515.011 0.105 0.382 /
3 377.65 515.011 0.192 0.523 /
4 376.65 515.011 0.207 0.528 /
5 374.15 515.011 0.259 0.573 /
6 371.05 515.011 0.314 0.635 /
7 367.05 515.011 0.44 0.721 /
8 366.85 515.011 0.513 0.761 /
9 364.15 515.011 0.812 0.913 /
10 363.15 515.011 0.943 0.984
STD-DEV 1 0.1 -0.1 -1 -1
The following pure component properties are supported:
• Normal boiling point (normal boiling points are extracted from saturated vapor pressure (VAP) data sets– temperature at atmospheric pressure).
• Critical pressure, temperature, and volume.
• Heat for formation
• Melting temperature
Another limitation is that a single export can contain only data for a single component and only a single value ofa specific property. A file might contain a normal boiling point and a critical temperature but not two normal boiling points. The collector dialog therefore has been extended by a selection column allowing to specify data sets.
Dortmund Data Bank Page 132 of 135
Figure 129: Aspen INP Export - Data Set List – Pure Component Properties Data Bank

DDBSP - Dortmund Data Bank Software Package 2014
23.3 Data Points Export
23.3.1 Export Mixture Data
This export creates a large data table where all data from all databanks are collected.
It is possible to export marked sets directly but it also possible tocollect data before exporting.
This export uses a very similar collector dialog like used for the
Aspen export.
The creates a table (see Figure 131) where all columns of all data sets are presented. This
table can become rather bulky if many different data have been added. The table can be copied to the Windows clipboard in a spread sheet (like Microsoft Excel) compatible format. Supported file formats are the “.csv” format (comma separated values) and the “.xls” format of Microsoft Excel.
23.3.2 Export Pure Component Properties
The pure component exports the data sets immediately without a possibility to collect them in a separate form. This export creates separate export dialogs for all properties found in the marked data sets. For example, if data sets with surface tensions, thermal conductivities, and vapor pressures have been selected three result windows
will be created, for each property one window.
The result window and its functions are the same as for the mixture data (see Figure 131).
Dortmund Data Bank Page 133 of 135
Figure 130: Data Points Export - Data Set List
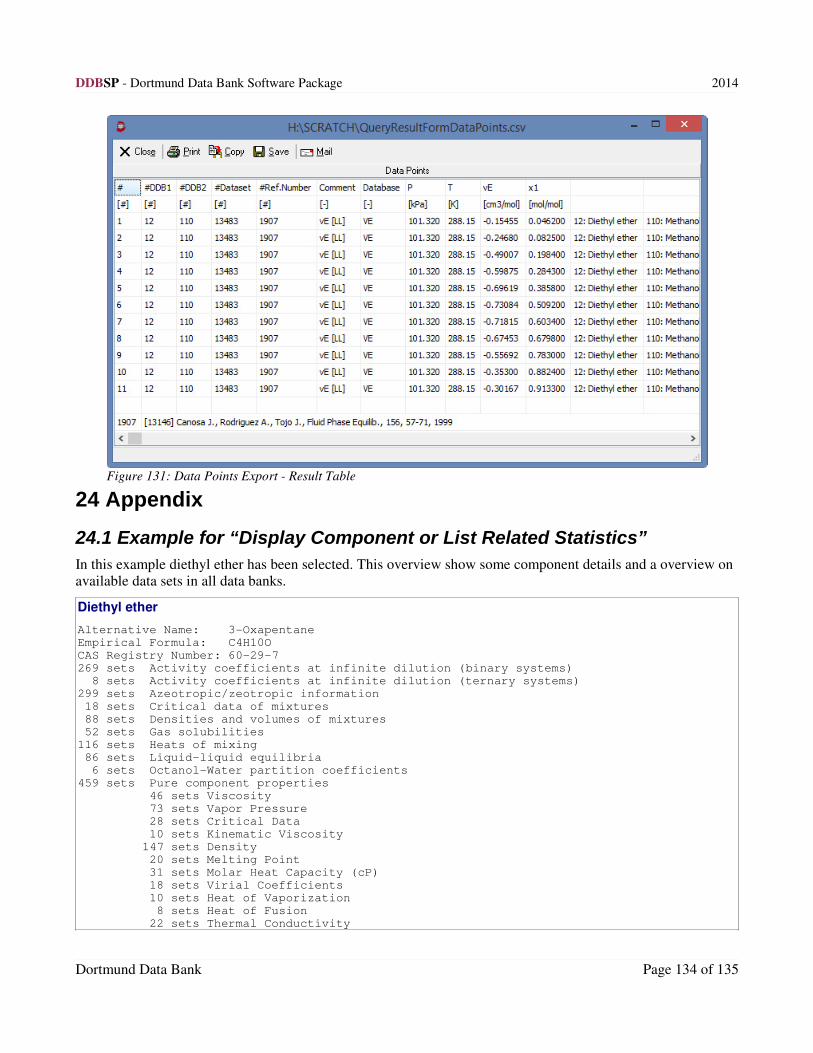
DDBSP - Dortmund Data Bank Software Package 2014
24 Appendix
24.1 Example for “Display Component or List Related Statistics”
In this example diethyl ether has been selected. This overview show some component details and a overview on available data sets in all data banks.
Diethyl ether
Alternative Name: 3-Oxapentane
Empirical Formula: C4H10O
CAS Registry Number: 60-29-7
269 sets Activity coefficients at infinite dilution (binary systems)
8 sets Activity coefficients at infinite dilution (ternary systems)
299 sets Azeotropic/zeotropic information
18 sets Critical data of mixtures
88 sets Densities and volumes of mixtures
52 sets Gas solubilities
116 sets Heats of mixing
86 sets Liquid-liquid equilibria
6 sets Octanol-Water partition coefficients
459 sets Pure component properties
46 sets Viscosity
73 sets Vapor Pressure
28 sets Critical Data
10 sets Kinematic Viscosity
147 sets Density
20 sets Melting Point
31 sets Molar Heat Capacity (cP)
18 sets Virial Coefficients
10 sets Heat of Vaporization
8 sets Heat of Fusion
22 sets Thermal Conductivity
Dortmund Data Bank Page 134 of 135
Figure 131: Data Points Export - Result Table

DDBSP - Dortmund Data Bank Software Package 2014
18 sets Surface Tension
2 sets Entropy
2 sets Std. Heat of Formation
1 set G-function (G-G0)/T
1 set Transition Temperature
4 sets Ideal Gas Heat Capacity
8 sets Dielectric Constant
9 sets Speed of Sound
1 set Virial Coefficients (Berlinform)
44 sets Salt solubilities
173 sets Solid-liquid equilibria for systems without salts
17 sets Thermodynamic data for polymer containing systems
283 sets Vapor-liquid equilibria
4 sets Vapor-liquid equilibria for systems containing solved salts
Dortmund Data Bank Page 135 of 135