Doppler radar applications in major winter snowstorms
22
ELSEVIER Atmospheric Research 41 (1996) 109-130 ±~FMOSPHERIC RESEARCH Doppler radar applications in major winter snowstorms D.R. Hudak a,*, R. Nissen b,l a Cloud Physics Research Ditrision, Atmospheric Environment Service. 4905 Dufferin Street, Downsl,iew, Ont.. Canada M3H 5T4 Department of Physics, Unit ersiO' of Toronto, Toronto, Ont., Canada M5S IA7 Received 26 May 1995; accepted 30 November 1995 Abstract Two winter snowstorms in the Toronto area are investigated with an X-band Doppler radar. The scan strategy involved alternating volume scans and a vertically pointing mode. The Extended Velocity Azimuth Display (EVAD) technique was applied to the volume scan data to document mesoscale wind patterns. Moments of the Doppler power spectrum, namely the fall velocity (Vt) and the spectral width (~w), were derived from the vertically pointing data. The variation of these moments in height and with time was used to deduce precipitation formation processes. In both cases low level convergence in the easterly flow across Lake Ontario ahead of the main disturbance was found. Here, accretion was very active. In the first case, strong convergence near the centre of the low as it passed overhead the radar was discerned. In this part of the storm, aggregation was the dominant precipitation mechanism. To the rear of the low, with neither an off-lake component to the flow nor consequential convergence aloft, diffusion increased in significance. In the second case, warm air overrunning an approaching warm front produced strong mid-level convergence. This resulted in significant accretion in the mid-levels such that a period of ice pellets was observed without the benefit of an above 0°C layer aloft. Where convergence was weaker, aggregation became the dominant process. The approach used in this study enabled variations in the microphysics on the mesoscale to be deduced. The EVAD technique in the circumstances of almost complete radar coverage and slowly evolving fields was able to distinguish between low level local effects and synoptic scale aspects of the storms. Furthermore, the moments of the Doppler power were able to identify the occurrence of diffusion, aggregation, and accretion. Regions of the storm in which V~ > 1.75 In s i or ~r w > 0.60 m s-I were associated with the accretion process. V~ > 1.25 m s ~ was * Corresponding author. Fax: 905-833-0398, E-mail: [email protected]. i Fax: 416-978-8905; e-mail: [email protected]. 0169-8095/96/$15.00 © 1996 Elsevier Science B.V. All rights reserved SSDI 0169-8095(95)00072-0
Transcript of Doppler radar applications in major winter snowstorms
E L S E V I E R Atmospheric Research 41 (1996) 109-130
±~FMOSPHERIC RESEARCH
Doppler radar applications in major winter snowstorms
D.R. Hudak a,*, R. Nissen b,l a Cloud Physics Research Ditrision, Atmospheric Environment Service. 4905 Dufferin Street, Downsl,iew, Ont..
Canada M3H 5T4 Department of Physics, Unit ersiO' of Toronto, Toronto, Ont., Canada M5S IA7
Received 26 May 1995; accepted 30 November 1995
Abstract
Two winter snowstorms in the Toronto area are investigated with an X-band Doppler radar. The scan strategy involved alternating volume scans and a vertically pointing mode. The Extended Velocity Azimuth Display (EVAD) technique was applied to the volume scan data to document mesoscale wind patterns. Moments of the Doppler power spectrum, namely the fall velocity (V t) and the spectral width (~w), were derived from the vertically pointing data. The variation of these moments in height and with time was used to deduce precipitation formation processes.
In both cases low level convergence in the easterly flow across Lake Ontario ahead of the main disturbance was found. Here, accretion was very active. In the first case, strong convergence near the centre of the low as it passed overhead the radar was discerned. In this part of the storm, aggregation was the dominant precipitation mechanism. To the rear of the low, with neither an off-lake component to the flow nor consequential convergence aloft, diffusion increased in significance. In the second case, warm air overrunning an approaching warm front produced strong mid-level convergence. This resulted in significant accretion in the mid-levels such that a period of ice pellets was observed without the benefit of an above 0°C layer aloft. Where convergence was weaker, aggregation became the dominant process.
The approach used in this study enabled variations in the microphysics on the mesoscale to be deduced. The EVAD technique in the circumstances of almost complete radar coverage and slowly evolving fields was able to distinguish between low level local effects and synoptic scale aspects of the storms. Furthermore, the moments of the Doppler power were able to identify the occurrence of diffusion, aggregation, and accretion. Regions of the storm in which V~ > 1.75 In s i or ~r w > 0.60 m s - I were associated with the accretion process. V~ > 1.25 m s ~ was
* Corresponding author. Fax: 905-833-0398, E-mail: [email protected]. i Fax: 416-978-8905; e-mail: [email protected].
0169-8095/96/$15.00 © 1996 Elsevier Science B.V. All rights reserved SSDI 0 1 6 9 - 8 0 9 5 ( 9 5 ) 0 0 0 7 2 - 0
I l0 D.R. Hudak, R. Nissen/Atmospheric Research 41 (1996) 109-130
associated with aggregation; V t < 1.00 m s ~ was associated with diffusion. Spectral width was not generally a good discriminator between diffusion and aggregation. When 1.00 < V t < 1.25 m s l, however, values of ~,~ above 0.40 m s t were more commonly associated with aggregation than diffusion. The profiles of V t and ~r,+ within the different growth regimes give a more complete description of the precipitation process and can provide the basis of an improved understanding of the hydrometeor size spectrum.
1. Introduction
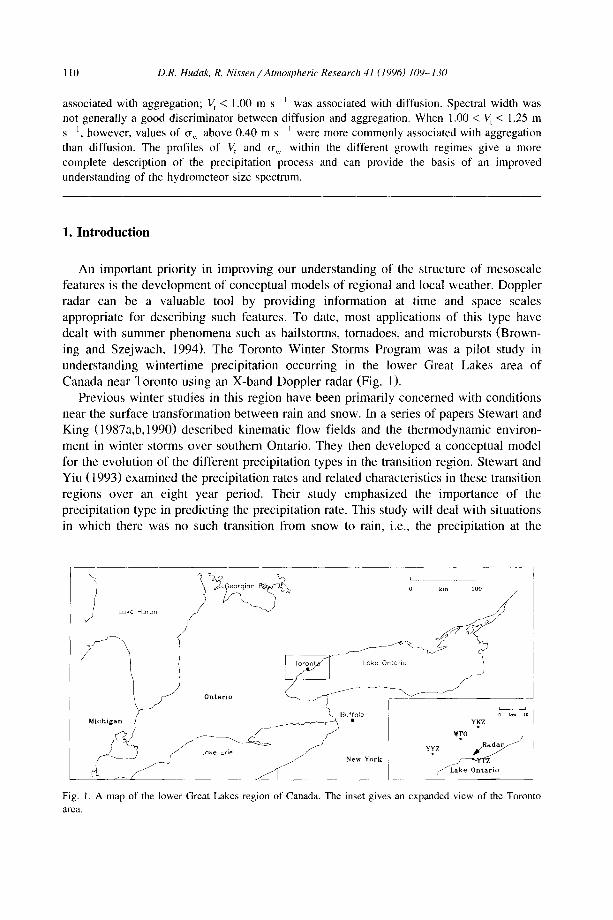
An important priority in improving our understanding of the structure of mesoscale features is the development of conceptual models of regional and local weather. Doppler radar can be a valuable tool by providing information at time and space scales appropriate for describing such features. To date, most applications of this type have dealt with summer phenomena such as hailstorms, tornadoes, and microbursts (Brown- ing and Szejwach, 1994). The Toronto Winter Storms Program was a pilot study in understanding wintertime precipitation occurring in the lower Great Lakes area of Canada near Toronto using an X-band Doppler radar (Fig. 1).
Previous winter studies in this region have been primari ly concerned with conditions near the surface transformation between rain and snow. In a series of papers Stewart and King (1987a,b,1990) described kinematic flow fields and the thermodynamic environ- ment in winter storms over southern Ontario. They then developed a conceptual model for the evolution of the different precipitation types in the transition region. Stewart and Yiu (1993) examined the precipitation rates and related characteristics in these transition regions over an eight year period. Their study emphasized the importance of the precipitation type in predicting the precipitation rate. This study will deal with situations in which there was no such transition from snow to rain, i.e., the precipitation at the
"; :
Fig. I. A map of the lower Great Lakes region of Canada. The inset gives an expanded view of the Toronto area.
D.R. Hudak, R. Nissen / Atmospheric Research 41 (1996) 109-130 111
surface was either snow or ice pellets. Considerable winter storm research has been carried out during the past decade in
North America. Major East Coast storms were the subject of projects such as the Canadian Atlantic Storms Program (CASP) phase I in 1986 and CASP phase II in 1992 (Stewart, 1991b), the Genesis of Atlantic Lows Experiment (GALE) in 1986 (Dirks et al., 1988), and the Experiment on Rapidly Intensifying Cyclones over the Atlantic (ERICA) in 1989 (Hadlock and Kreitzberg, 1988). All three carried out extensive field experiments to advance the understanding of these storms. Recent interest has turned to winter storms in the continental interior. The University of Illinois Winter Precipitation Program (UNIWIPP) examined the mesoscale dynamics of winter storms over a period of three winters between 1988 and 1990 (Ramamurthy et al., 1991). The Winter Icing and Storms Project has carried out field studies in the Colorado Front Range since 1990. The goals there are to study the processes leading to the formation and depletion of supercooled liquid water in winter storms (Rasmussen et al., 1992). In 1992, the STORM-Fronts Experiment Systems Test (STORM-FEST) took place during February and March over a region extending from central Oklahoma northeastward to central Illinois. The structure and evolution of mesoscale precipitation systems were the focal point (Cunning, 1991 ; Kreitzberg, 1991).
Studies that considered the regional aspects of winter snowstorms include Dunn (1987) and Byrd (1989). The former paper used a dense network of surface observations and wind profilers in the Denver area to develop a conceptual model of cold air damming by the Front Range of the Colorado Rockies. The latter examined winter season storms in the southern plains of the United States in which significant overrun- ning precipitation occurred.
There have been a number of recent studies of winter storms in which a single Doppler radar was the primary measurement platform. Ishihara et al. (1989) used a C-band Doppler radar to analyze the structure of mesoscale snow bands that developed over the Sea of Japan during the winter monsoon. Fujiyoshi et al. (1992) examined a snow band formed on the lee side of a mountain in Sapporo with an X-band Doppler radar. In a series of papers (Long et al., 1990; Sassen et al., 1990; and Campistron et al., 1991) a winter mountain storm in Utah was analyzed comprehensively. A C-band Doppler radar was a key observing tool in this case. Marwitz and Toth (1993) reported on a case study of heavy snowfall in Oklahoma. Volume scans from the National Severe Storms Laboratory Doppler radar at Norman, Oklahoma provided the necessary informa- tion to determine the kinematic structure of the snowband.
Two recent papers discuss the Doppler radar observations in freezing rain episodes. The first (Prater and Borho, 1992) describes Doppler radar signatures in two freezing rain cases near Kansas City, Missouri and suggest a freezing rain detection algorithm based on parameterized Doppler radar signatures. The second (Martner et al., 1993) combines X-band Doppler radar observations with measurements from a wind profiler~ a microwave radiometer and mobile rawinsondes to describe the kinematic and thermody- namic structure of a freezing rain storm near Lake Ontario.
In the present study, two snowstorms during January and February of 1991 will be examined. The primary objective is to document scale-interactive processes such as mesoscale influences on synoptic scale weather patterns. It also seeks to provide
112 D.R. Hudak, R. Nissen / Atmospheric Research 41 (1996) 109-130
descriptions of the precipitation formation processes in the clouds of these systems. In so doing, variations in the underlying microphysics on the mesoscale will be deduced.
The secondary objective is to assess the degree to which microphysical processes such as accretion, aggregation and diffusion can be identified as typical Doppler radar footprints. These radar signatures could be useful in many applications. For example, aircraft de-icing is dependent on the morphology of the snow crystals (Rasmussen et al., 1992). Aerosol scavenging and precipitation chemistry are affected by the physical processes of snow formation. Mosimann et al. (1993a) reported higher ion concentra- tions in precipitation samples that were heavily accreted versus non-accreted samples. Radar estimates of precipitation are also a function of the nature of the hydrometeors. Waldvogel et al. (1993) found a close relationship between the degree of accretion above the bright band and raindrop size spectra below, opening up new possibilities in quantitative precipitation determination.
2. Storm characteristics
The Great Lakes region of southern Ontario is directly affected by many major storms that move across North America in the winter (Hare and Thomas, 1979). As a result the Toronto area experiences a great variety of weather and a diversity of precipitation types. Lake Ontario, on whose shores Toronto is situated, remains ice-free all year (Fig. 1). The open water has a significant influence on the winter storms that pass through the area.
The storms are relatively shallow but intense. For a major winter storm to give only solid precipitation near Toronto the surface low must generally go south of the lower Great Lakes, but with considerable overrunning of warm air aloft. This results in a low level easterly flow across Lake Ontario in advance of the approaching disturbance. A situation then evolves in which there is a trajectory of cold air across an ice-free lake in the lowest levels with warmer air above. The location of the radar, three km north of the lakeshore (Fig. 1, inset), was well suited for assessing the effect of the lake in these circumstances.
3. Observing systems
The main means of investigating the storms was with an X-band Doppler radar operating at the University of Toronto. It has the following features: peak transmitted power 25 kW, beamwidth 2.5 °, pulse width 0.4 Ixs and the pulse repetition frequency 2000 s l The Nyquist velocity was 16.0 m s - l but double pulse transmission techniques were employed when appropriate to increase the unambiguous velocity up to 48.0 m s-J (Campbell and Strauch, 1976). Normal operating procedure, repeated every 10 rain, involved volume scans of seven elevation angles collecting intensity and Doppler velocity to document the storm morphology, precipitation intensity and wind field information. The range resolution was 250 m out to a maximum range of 18.25 kin.
D.R. Hudak, R. Nissen /Atmospheric Research 41 (1996) 109-130 113
This scanning strategy was interrupted about every hour to operate the radar in a vertically pointing mode in order to collect the full Doppler spectral power density information. In this mode the vertical resolution was increased to 125 m. Processor limitations prevented the acquisition of spectra from all range bins simultaneously. Consequently, the processed range bins were stepped through sequentially to echo top. The lowest valid range is 0.50 km. This corresponds to the minimum time at which the receiver is free of the effects of the transmitted pulse. This cycle was repeated usually from three to five times before returning to the regular scanning mode.
Locales that provided additional sources of data for the study are shown in Fig. I. These include a radiosonde release performed most mornings at 1200 UTC at the Atmospheric Environment Service in Toronto (WTO). Also, hourly surface observations were taken from 1200 UTC to 0300 UTC at the Toronto Island airport (YTZ), located about 2 km south of the radar on the lakeshore. Other regularly reporting weather stations that provided useful surface observations included Pearson International Airport (YYZ) and Buttonville Airport (YKZ), 16 km to the northwest and northeast of the radar respectively. Buffalo, New York, 110 km to the southeast was the closest regular upper air station.
4. Data analysis procedures
In order to determine the wind field with high temporal resolution, the Extended Velocity Azimuth Display technique (EVAD) was applied to the volume scan Doppler velocity data (Srivastava et al., 1986; Matejka and Srivastava, 1991). The technique is applicable when the wind field is sufficiently smooth and steady and the radar is surrounded by echoes at nearly all azimuths. Such was clearly the case in the major storms being considered here. As was discussed in Boccippio (1995), another source of error in the wind retrieval process is changes in the vertical gradient of particle fall speed. An example of such would be the abrupt change in terminal velocity through a radar bright band. The cases being examined in this study had no discernible bright band. The net result is vertical profiles of the mean horizontal wind and divergence at 10 rain intervals during the precipitation events - - except for those times when the radar was in a vertically pointing mode. From the profiles of divergence, an estimate of the air vertical velocity can be made. The application of this technique led to the identification of mesoscale features within the storm system. Pulse pair processing with 128 samples per resolution volume was used in this mode of operation.
The information necessary to describe the precipitation formation processes was obtained when the radar was pointing vertically. In this case, 256 samples were collected for every range bin. With the antenna stationary, the additional samples would not affect the speed of rotation, but the additional samples permitted higher resolution spectra to be calculated. The discrete Fourier transform of the complex returned signal was carried out to obtain the Doppler power spectrum. The returned signal was weighted using a von Hann window in order to reduce sidelobes and increase the dynamic range of the spectrum (Doviak and Zrnic, 1984). The objective method of Hildebrand and Sekhon (1974) was then applied to determine the noise threshold for each power spectrum. A
114 D.R. Hudak, R. Nissen / Atmospheric Research 41 (1996) 109-130
7D ~ J
O ££
/% 1 S, '.} () V e l o c i t y (,,m s 1)
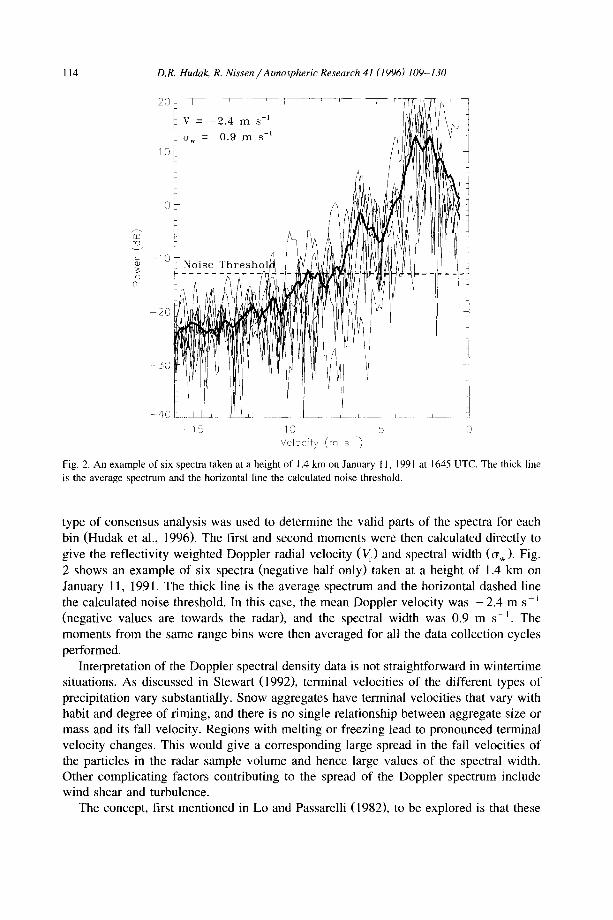
Fig. 2. An example of six spectra taken at a height of 1.4 km on January 11, 1991 at 1645 UTC. The thick line is the average spectrum and the horizontal line the calculated noise threshold.
type of consensus analysis was used to determine the valid parts of the spectra for each bin (Hudak et al., 1996). The first and second moments were then calculated directly to give the reflectivity weighted Doppler radial velocity (V r) and spectral width (or W). Fig. 2 shows an example of six spectra (negative half only) taken at a height of 1.4 km on January 11, 1991. The thick line is the average spectrum and the horizontal dashed line
J the calculated noise threshold. In this case, the mean Doppler velocity was - 2 . 4 m s (negative values are towards the radar), and the spectral width was 0.9 m s -~. The moments from the same range bins were then averaged for all the data collection cycles performed.
Interpretation of the Doppler spectral density data is not straightforward in wintertime situations. As discussed in Stewart (1992), terminal velocities of the different types of precipitation vary substantially. Snow aggregates have terminal velocities that vary with habit and degree of riming, and there is no single relationship between aggregate size or mass and its fall velocity. Regions with melting or freezing lead to pronounced terminal velocity changes. This would give a corresponding large spread in the fall velocities of the particles in the radar sample volume and hence large values of the spectral width. Other complicating factors contributing to the spread of the Doppler spectrum include wind shear and turbulence.
The concept, first mentioned in Lo and Passarelli (1982), to be explored is that these
116 D.R. Hudak, R. Nissen / Atmospheric Research 41 (1996) 109-130
5.1. February 14, 1991
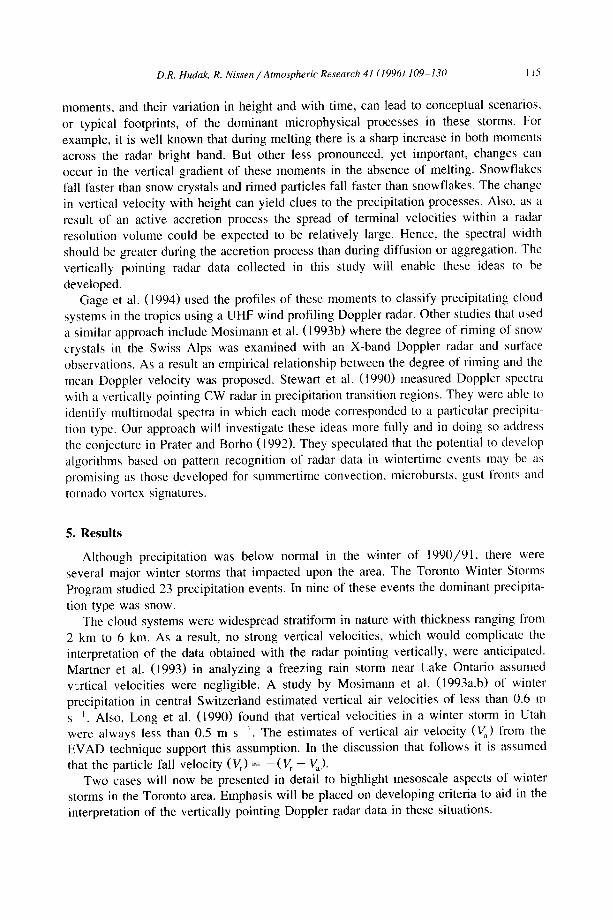
In the first case study a major storm system approached southern Ontario from the American midwest. Fig. 3 gives the synoptic analyses at 0000 UTC on February 15 as taken from the Canadian Meteorological Centre analyses. The six hourly track of the low is also shown. The centre of the low approached the area from the southwest during the early morning hours and passed across the eastern end of Lake Ontario early in the afternoon. The lowest central MSL pressure was 97.8 kPa at 1800 UTC on February 14. The lowest MSL pressure at YTZ was 98.1 kPa at 2000 UTC. The surface position of the low passed to the southeast of the Toronto area. However, the 85 kPa position passed directly overhead. The warmest air in this system stayed to the southeast of the area as the parent low pressure system was occluding. Surface temperatures as measured at YTZ were steady in the - I ° C to - 2 ° C range until 2100 UTC when they began falling. The precipitation at YTZ was all in the form of snow. YYZ reported 37 consecutive hours of snow from this system.
The upper air sounding at WTO taken at 1200 UTC on February 14 showed that below 3.5 km the humidity was 100%. Temperatures increased steadily from - 10°C at 3.5 km to - 7°C at 2.5 km, then to - 2°C by 1.5 km. Below 1.5 km temperatures ranged from - 2°C to - 5°C.
Fig. 3. The synoptic analyses at 0000 UTC on February 15, 1991, as taken from the Canadian Meteorological Centre analyses. Solid lines are surface isobars and dotted lines the 85 kPa isotherms. The six hourly track of the low is also shown.
D.R. Hudak, R. Nissen / Atmospheric Research 41 (1996) 109-130 117
P
3
2 X :
Hor izon ta l Winds ( m s -l)
1 ,, l t~
II t ,~t 1
U I~ I ,'l l
f t l , . , I I I I
I, ~ I I / / tl I
l ! ~ i / II It,¢
I
o
5 IO T i m e (UTt;)
I - - ' I i
/ / / I ,; A.%'/l/? .-/. /I//AA (.4.4~'.--".I
: A ~ / , / / / Y ' / / ' / J
,, t M / I / A ' / / I / "/'3~.-~
r,i/~ -
W i / , . . . . . . . " " " " ,
15 ~0 Ol
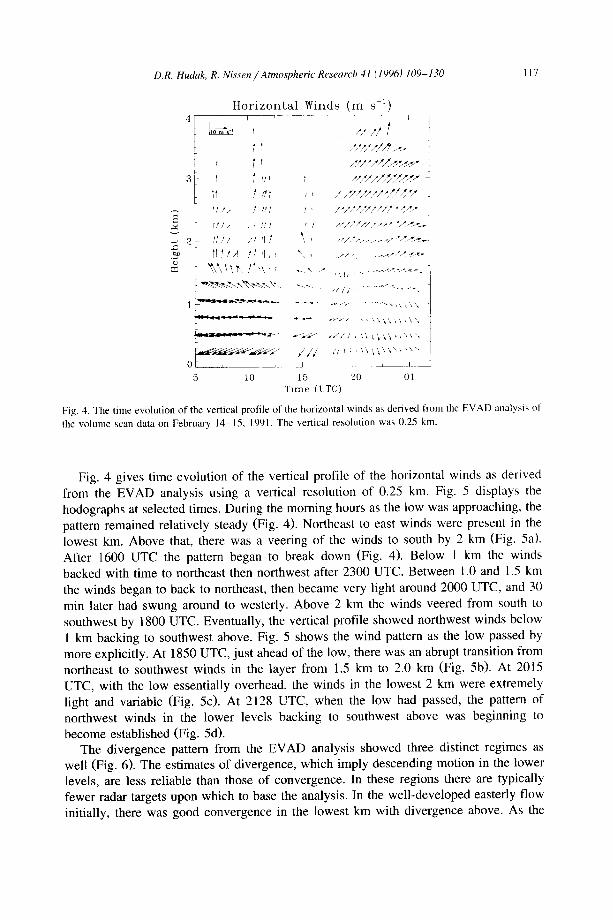
Fig. 4. The time evolution of the vertical profile of the horizontal winds as derived from the EVAD analysis of
the volume scan data on February 14-15, 1991. The vertical resolution was 0.25 kin.
Fig. 4 gives time evolution of the vertical profile of the horizontal winds as derived from the EVAD analysis using a vertical resolution of 0.25 km. Fig. 5 displays the hodographs at selected times. During the morning hours as the low was approaching, the pattern remained relatively steady (Fig. 4). Northeast to east winds were present in the lowest km. Above that, there was a veering of the winds to south by 2 km (Fig. 5a). After 1600 UTC the pattern began to break down (Fig. 4). Below 1 km the winds backed with time to northeast then northwest after 2300 UTC. Between 1.0 and 1.5 km the winds began to back to northeast, then became very light around 2000 UTC, and 30 min later had swung around to westerly. Above 2 km the winds veered from south to southwest by 1800 UTC. Eventually, the vertical profile showed northwest winds below 1 km backing to southwest above. Fig. 5 shows the wind pattern as the low passed by more explicitly. At 1850 UTC, just ahead of the low, there was an abrupt transition from northeast to southwest winds in the layer from 1.5 km to 2.0 km (Fig. 5b). At 2015 UTC, with the low essentially overhead, the winds in the lowest 2 km were extremely light and variable (Fig. 5c). At 2128 UTC, when the low had passed, the pattern of northwest winds in the lower levels backing to southwest above was beginning to become established (Fig. 5d).
The divergence pattern from the EVAD analysis showed three distinct regimes as well (Fig. 6). The estimates of divergence, which imply descending motion in the lower levels, are less reliable than those of convergence. In these regions there are typically fewer radar targets upon which to base the analysis. In the well-developed easterly flow initially, there was good convergence in the lowest km with divergence above. As the

l l8 D.R. Hudak, R. Nissen/Atmospheric Research 41 (1996) 109-130
(o) (b)
(c) (d)
' ~ 0 @
Fig. 5. The hodographs derived from the EVAD analysis on February 14, 1991, at (a) 1200 UTC; (b) |850 UTC; (c) 2015 UTC and (d) 2128 UTC. Numbers along the curve indicate the height in kin.
easterly flow weakened, so did the low level convergence. Around 1700 UTC, as the flow was undergoing major alterations, there was a brief period in which divergence was present in the lowest levels. The EVAD analysis at this time was only able to derive winds in the lowest km, but did show a clear divergence maximum at 500 m. At this time, despite the observations of snow, YTZ reported sun dimly visible. After 1800 UTC, as the low was moving into the Toronto area, the low level convergence returned. The convergence area increased in strength and thickened in depth to a maximum around 2000 UTC, the time when the low was directly overhead.
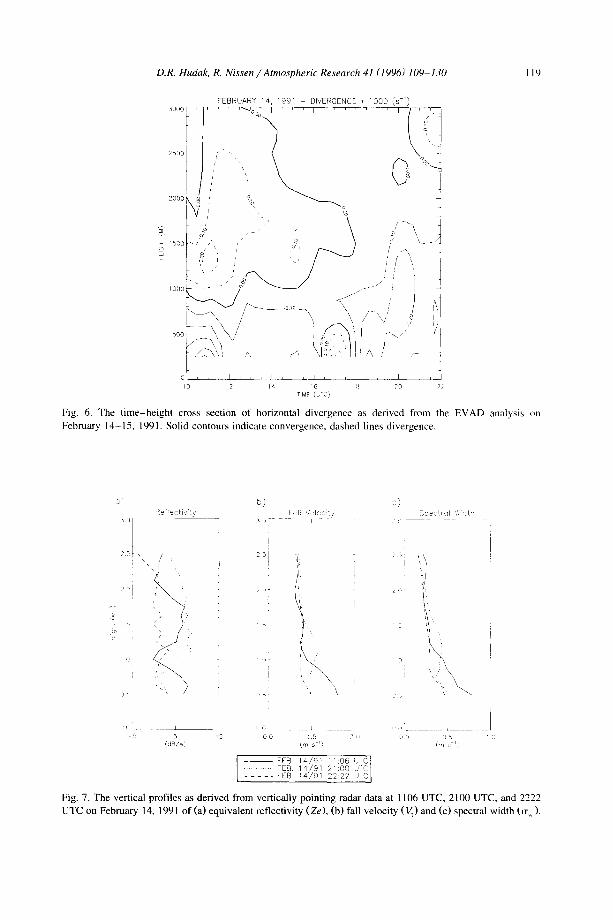
Fig. 7 gives the vertical profiles of equivalent reflectivity (Ze) , V t and ~r w at three selected times as derived from vertically pointing radar data. The highest values of Ze
(Fig. 7a) occurred in the lowest km at 1106 UTC and in the layer from 1 to 2 km at 2100 UTC. Ze was smallest for the profile at 2222 UTC. The three velocity profiles (Fig. 7b) showed the following. At 1106 UTC, the fall velocities (V t) remained around 1.0 m s-1 above 1 kin. Below 1.0 kin, in the layer characterized by the well developed easterly flow off the lake, the values increased to 2.2 m s-~ by 0.5 km. At 2100 UTC, the V t profile was relatively constant above 1.5 km at 0.8 m s - j , increased to 1.5 m s J by 1.2 km, and then remained constant at about 1.3 m s - ~ below 1.0 kin. At 2222 UTC, V t remained relatively constant around 0.9 m s-~ above 0.7 km, then increased slightly to 1.3 m s - ~ by 0.5 kin. The profiles of spectral widths, given in Fig. 7c, show a similar pattern to fall velocity. In the first two cases the increase in o- w with decreasing altitude
D.R. Hudak, R. Nissen /Atmospheric Research 41 (1996) 109-130 119
FEBRUARY 14, 1991 - DIVERGENCE * " i 000 (s ~)
10 12 14 ",6 ig 20 22 TiMF ( L, TC)
Fig. 6. The t ime-height cross section o f horizontal divergence as derived from the EVAD analysis on February 14-15, 1991. Solid contours indicate convergence, dashed lines divergence.
Ref ec t i , J : y
/
1 I
F Eft! ge loc f> I 5 :)
i i f i
~:,r
I I
s •) %sec t rq l V,, ::t ~
L
i
i j
f i
: :< ~ LC . . . . ~ _ _ { : : , , ! E 5 I ~< co 15 ~ 0 0 } :)~; "
(dBZe) (~ s ~: (m ':
I - - FEB 14 " 1 : 0 6 iJTCL . . . . . . . . . . . FEB. 14 2 1 : 0 0 J f C . . . . . FEB. 14 2 2 : 2 2 JTC
Fig. 7. The vertical profiles as derived from vertically pointing radar data at 1106 UTC, 2100 UTC. and 2222 UTC on February 14, 1991 of (a) equivalent reflectivity (Ze), (b) fall velocity (V t) and (c) spectral width ( o r ) .
120 D.R. Hudak, R. Nissen /Atmospheric Research 41 (1996) 109-130
began higher than for V t by approximately 200 m. Maximum values of ~r w were 0.8 m s - ~ in the low level off-lake flow at 1106 UTC. Near the centre of the low values were around 0.4 m s - 1. To the rear of the low (2222 UTC), ~r~ had values of about 0.25 m S - 1 above 0.8 km.
The evidence presented leads to the following interpretation. As the low was approaching the Toronto area in the morning the EVAD analysis shows that there was a well-developed convergent off-lake flow present in the lowest km. It was during this period that Ze, V¢ and ~w values showed a discontinuity in their vertical profiles and a marked increase in their values below 1 km. An explanation for these profiles is that accretion was taking place in the low level off-lake flow. During the afternoon the wind profiles showed very vividly the passage of the low centre, e.g., at 1 km the flow went from northeast to west near the low centre. At this time V t and ~r w showed an increase in values from 1.5 km to 1.2 km, then decreased slightly below that level. These observations were consistent with the aggregation process being active at these heights. This characterization is in keeping with the Stewart-MacPherson hypothesis (Stewart, 1991a) that described conditions near a low centre. It states that near the low centre the temperatures in the mid-levels are the highest, close to 0°C, and here is the region of large snowflakes due to aggregation. At this time, the Ze profile had a maximum at 1.1 km and then deceased 5 dB to a minimum at 0.7 km. An examination of the time history of Ze during the vertical scan at 2100 UTC indicated that the heights of the local maximum and minimum were constant. Also, a profile of Ze determined by averaging the reflectivity values from the volume scans just before and after the vertical scan at 2100 UTC was produced. It indicated local maximum and minimum at 1.1 km and 0.8 kin, respectively. Thus, it appears unlikely that the decrease in Ze, and to a lesser extent, V t and cr W, was caused by a slanting band of precipitation. A more plausible explanation is the breakup of some of the aggregated particles. This is consistent with the findings of Lo and Passarelli (1982) who reported that in the lower levels the large particles produced by aggregation were depleted. In this case, the decreasing temperature below 1.2 km could have made the environmental conditions less suitable for aggregation than in the layer above where the temperature was approximately - 2 ° C . Late in the afternoon, as the low moved away, the low level flow was off the land from the northwest. During this time the profiles of Ze, V t and ¢~w at 2222 UTC were smaller and showed only a slight increase with decreasing altitude. The passage of the low centre meant there was less aggregation and as the off-land flow developed there was also less accretion.
5.2. January 11, 1991
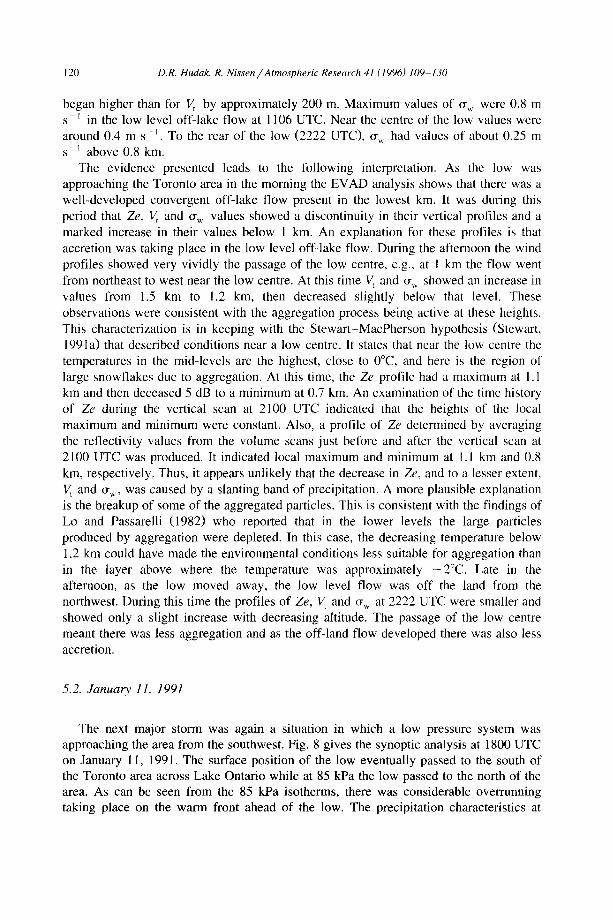
The next major storm was again a situation in which a low pressure system was approaching the area from the southwest. Fig. 8 gives the synoptic analysis at 1800 UTC on January I I, 1991. The surface position of the low eventually passed to the south of the Toronto area across Lake Ontario while at 85 kPa the low passed to the north of the area. As can be seen from the 85 kPa isotherms, there was considerable overrunning taking place on the warm front ahead of the low. The precipitation characteristics at
D.R. Hudak, R. Nissen /Atmospheric Research 41 (1996) 109-130 121
Fig. 8. The synoptic analyses at 800 UTC on January 1 I, 1991. as taken from the Canadian Meteorological Centre analyses.
YTZ can be divided into three distinct phases. In the first, light snow that began in the early morning hours (0900 UTC) became mixed with ice pellets around mid-morning and lasted until noon (1700 UTC). From noon until early evening (0000 UTC) snow, moderate at times, persisted. This was followed by three hours of snow and ice pellets again. During the entire time period the surface winds remained very steady in the 090 ° to 100 ° range at 12 to 18 m s -~ . The pattern was similar at YYZ except that the morning ice pellets persisted a couple of hours longer and the evening ice pellets began a couple of hours later. Meanwhile, YKZ received only moderate snow except lbr one hour of snow pellets around 2000 UTC.
There were no soundings on this day at WTO. But the sounding at Buffalo taken January 11, 1991, at 1200 UTC was revealing. There was a very strong inversion in the lowest km, an indication of the overrunning warm air aloft. Above that, there was a moist stable layer to 55 kPa. There was no above freezing layer in the profile, the warmest temperature reported was - 2 ° C at 1 km. The surface temperature at YTZ was -4°C to - 5 ° C during this first phase.
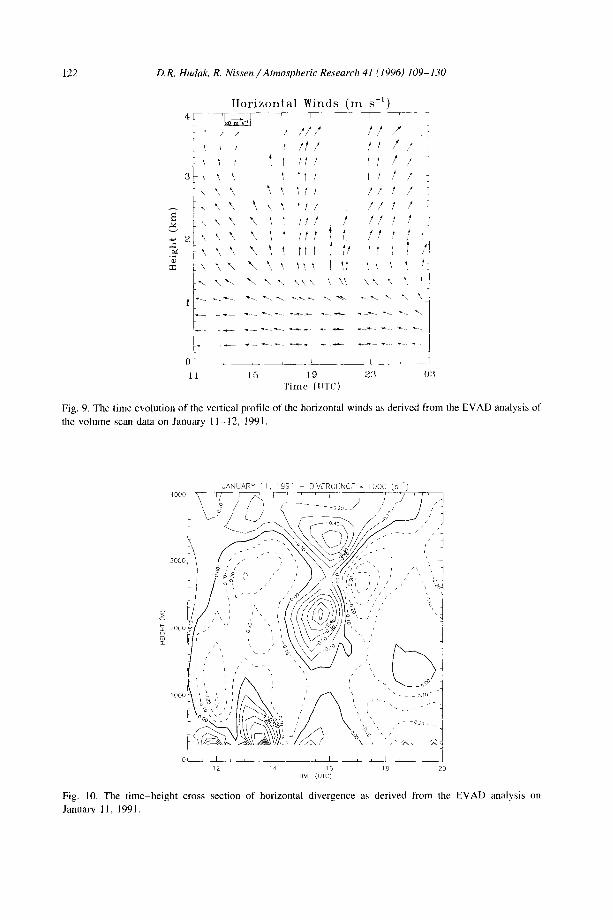
Fig. 9 displays the wind profiles for this event. During the first phase, until 1700 UTC, the winds evolved in the following manner. Initially, there were strong easterly winds in the lowest km followed by a smooth veering of the winds to southwesterly by 4.0 km. This pattern gave way to one in which the winds above 1 km veered to
122 D.R. Hudak, R. Nissen / Atmospheric Research 41 (1996) 109-130
H o r i z o n t a l W i n d s ( m s - ' ) 4U~ ~
, I ,' I t I t ,"
1 ~ I t t t t ! ," i
3 -,, \ \ ~, t l t I' i '
,, k k \ t I t . I ! I
,, \ \ \ \ \ 11 I ! / S ,,, ,, \ \ X '~ t t / I I I t l
2L ' , x \ \ ~ t ~'t t t , , " ' ~' ' i , / ,!
\ \ Y X t t t t t t / ~T~ t 8 = Z X X X ~ ~ t . . . . . ~ t t ~ t t t ~ ~i , t
:',.. \"-.. ~ \ \ \\\ \ \\ \\ X ~, I-
OL ~ I L
11 t5 19 2,1 03 Time (UTC)
Fig. 9. The time evolution of the vertical profile of the horizontal winds as derived from the EVAD analysis of the volume scan data on January 11-12, 1991.
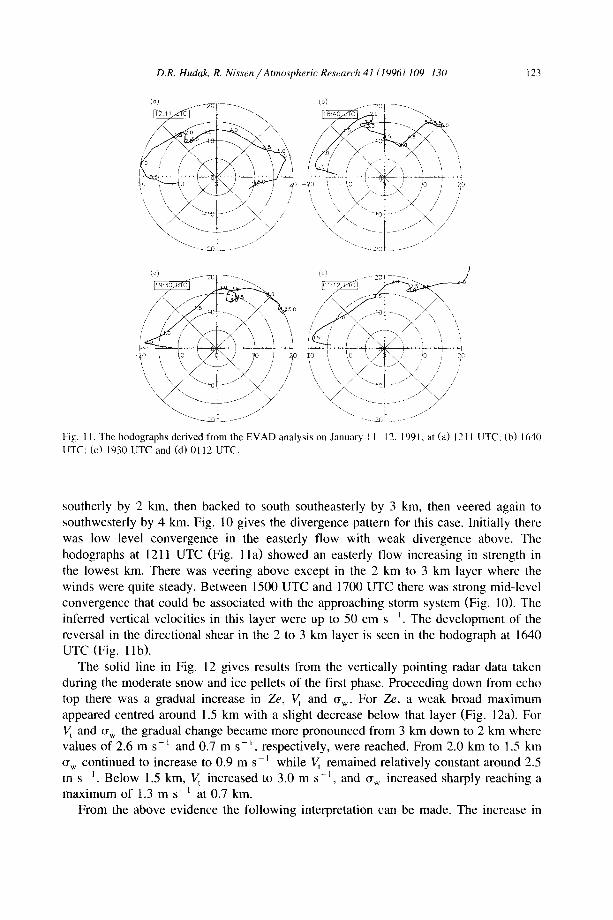
JANUARY 11, 1991 DVERCENCE ~ 1 0 0 0 (s *)
12 14 16 18 20 TIME (UTC)
Fig. 10. The time-height cross section of horizontal divergence as derived from the EVAD analysis on January 11, 1991.
D.R. Hudak, R. Nissen / Atmospheric Research 41 (1996) 109 130
(~) J ~ 2 ~ \ ~ i Cb', .~ ~__ 1 6 : 4 0 O "
t, ~ f
./ \ ,, ./.. .x. /,
123
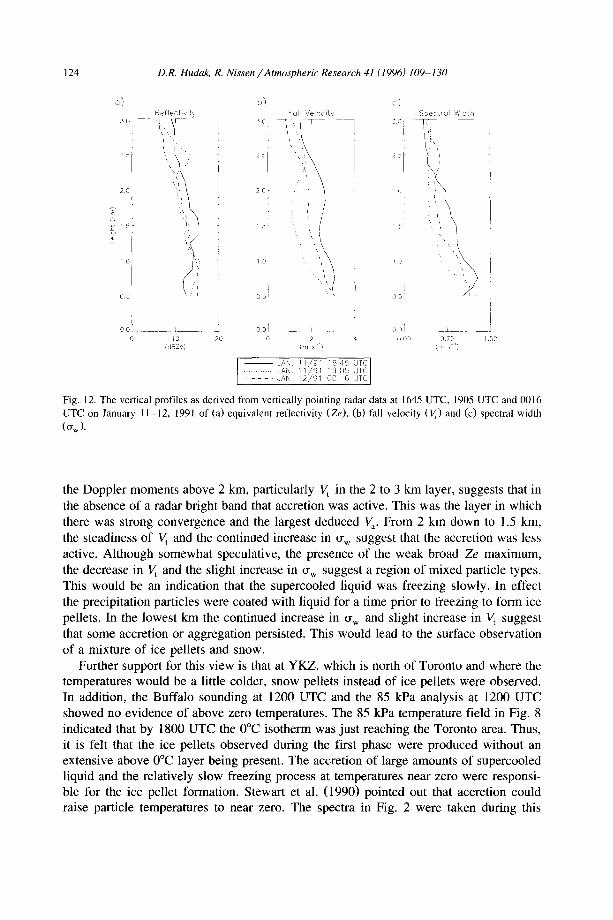
Fig. 11. The hodographs derived from the EVAD analysis on January I I 12. 1991, at (a) 1211 UTC: (b) 1640 UTC" (c) 1930 UTC and (d) 0112 UTC.
southerly by 2 km, then backed to south southeasterly by 3 km, then veered again to southwesterly by 4 km. Fig. 10 gives the divergence pattern for this case. Initially there was low level convergence in the easterly flow with weak divergence above. The hodographs at 1211 UTC (Fig. 1 la) showed an easterly flow increasing in strength in the lowest km. There was veering above except in the 2 km to 3 km layer where the winds were quite steady. Between 1500 UTC and 1700 UTC there was strong mid-level convergence that could be associated with the approaching storm system (Fig. 10). The inferred vertical velocities in this layer were up to 50 cm s ~. The development of the reversal in the directional shear in the 2 to 3 km layer is seen in the hodograph at 1640 UTC (Fig. 1 lb).
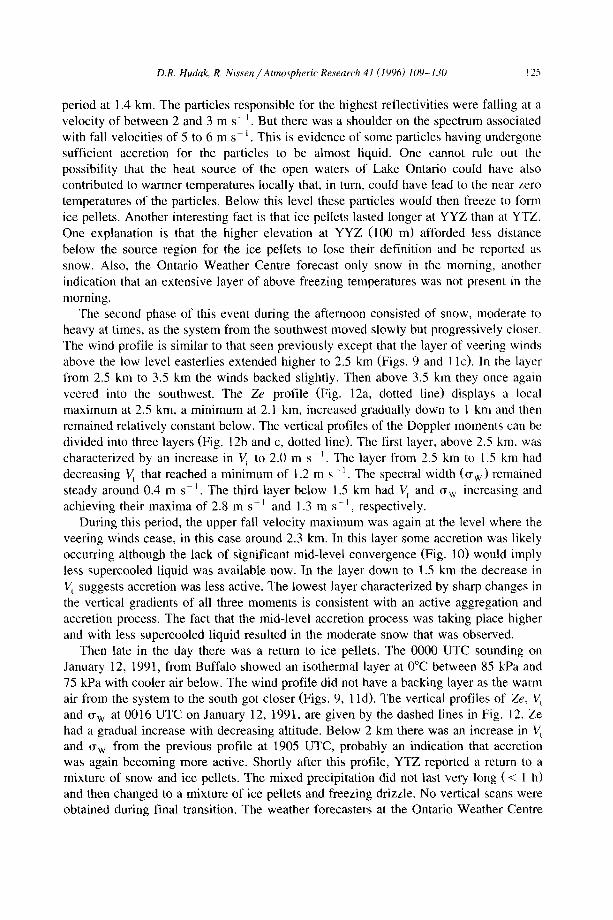
The solid line in Fig. 12 gives results from the vertically pointing radar data taken during the moderate snow and ice pellets of the first phase. Proceeding down from echo top there was a gradual increase in Ze, V t and ~w. For Ze, a weak broad maximum appeared centred around 1.5 km with a slight decrease below that layer (Fig. 12a). For V t and u w the gradual change became more pronounced from 3 km down to 2 km where values of 2.6 m s - 1 and 0.7 m s - ~, respectively, were reached. From 2.0 km to 1.5 km ~w continued to increase to 0.9 m s-~ while V t remained relatively constant around 2.5 m s ~. Below 1.5 km, V t increased to 3.0 m s -~, and ~,, increased sharply reaching a maximum of 1.3 m s - i at 0.7 km.
From the above evidence the following interpretation can be made. The increase in
124 D.R. Hudak, R. Nissen ~Atmospheric Research 41 (1996) 109-130
o~ Reflectivit
2 0 [
"r
1.@
C 5
0 0 ~ /
(dBZe)
b} kali Velocity
r
19:
O5
c i:' Spectral '~id t n
5 ,3 1
.~ i { }
x
[ ? 0 5 )
L O01 _ i 2 4 000 0 75 I 58
JAN. 11~9s "6:45 UTC] ............ IAN 11/91 "9:8~ UTC
JAN 12~91 00:16 LITC
Fig. 12. The vertical profiles as derived from vertically pointing radar data at 1645 UTC, 1905 UTC and 0016 UTC on January 11-12, 1991 of (a) equivalent reflectivity (Ze), (b) fall velocity (V t) and (c) spectral width (%).
the Doppler moments above 2 km, particularly V t in the 2 to 3 km layer, suggests that in the absence of a radar bright band that accretion was active. This was the layer in which there was strong convergence and the largest deduced V a. From 2 km down to 1.5 km, the steadiness of V t and the continued increase in ~r w suggest that the accretion was less active. Although somewhat speculative, the presence of the weak broad Ze maximum, the decrease in V t and the slight increase in ~r w suggest a region of mixed particle types. This would be an indication that the supercooled liquid was freezing slowly. In effect the precipitation particles were coated with liquid for a time prior to freezing to form ice pellets. In the lowest km the continued increase in ~r w and slight increase in V t suggest that some accretion or aggregation persisted. This would lead to the surface observation of a mixture of ice pellets and snow.
Further support for this view is that at YKZ, which is north of Toronto and where the temperatures would be a little colder, snow pellets instead of ice pellets were observed. In addition, the Buffalo sounding at 1200 UTC and the 85 kPa analysis at 1200 UTC showed no evidence of above zero temperatures. The 85 kPa temperature field in Fig. 8 indicated that by 1800 UTC the 0°C isotherm was just reaching the Toronto area. Thus, it is felt that the ice pellets observed during the first phase were produced without an extensive above 0°C layer being present. The accretion of large amounts of supercooled liquid and the relatively slow freezing process at temperatures near zero were responsi- ble for the ice pellet formation. Stewart et al. (1990) pointed out that accretion could raise particle temperatures to near zero. The spectra in Fig. 2 were taken during this
D.R. Hudak, R. Nissen / Atmospheric Research 41 (1996) 109-130 125
period at 1.4 km. The particles responsible for the highest reflectivities were falling at a velocity of between 2 and 3 m s - ~. But there was a shoulder on the spectrum associated with fall velocities of 5 to 6 m s- ~. This is evidence of some particles having undergone sufficient accretion for the particles to be almost liquid. One cannot rule out the possibility that the heat source of the open waters of Lake Ontario could have also contributed to warmer temperatures locally that, in turn, could have lead to the near zero temperatures of the particles. Below this level these particles would then freeze to form ice pellets. Another interesting fact is that ice pellets lasted longer at YYZ than at YTZ. One explanation is that the higher elevation at YYZ (100 m) afforded less distance below the source region for the ice pellets to lose their definition and be reported as snow. Also, the Ontario Weather Centre forecast only snow in the morning, another indication that an extensive layer of above freezing temperatures was not present in the morning.
The second phase of this event during the afternoon consisted of snow, moderate to heavy at times, as the system from the southwest moved slowly but progressively closer. The wind profile is similar to that seen previously except that the layer of veering winds above the low level easterlies extended higher to 2.5 km (Figs. 9 and 1 lc). In the layer from 2.5 km to 3.5 km the winds backed slightly. Then above 3.5 km they once again veered into the southwest. The Ze profile (Fig. 12a, dotted line) displays a local maximum at 2.5 km, a minimum at 2.1 kin, increased gradually down to I km and then remained relatively constant below. The vertical profiles of the Doppler moments can be divided into three layers (Fig. 12b and c, dotted line). The first layer, above 2.5 km. was characterized by an increase in V t to 2.0 m s -1. The layer from 2.5 km to 1.5 km had decreasing V t that reached a minimum of 1.2 m s -1 . The spectral width (~r w) remained steady around 0.4 m s - l . The third layer below 1.5 km had V~ and ~r w increasing and achieving their maxima of 2.8 m s- ~ and 1.3 m s- ~, respectively.
During this period, the upper fall velocity maximum was again at the level where the veering winds cease, in this case around 2.3 kin. In this layer some accretion was likely occurring although the lack of significant mid-level convergence (Fig. 10) would imply less supercooled liquid was available now. In the layer down to 1.5 km the decrease in V t suggests accretion was less active. The lowest layer characterized by sharp changes in the vertical gradients of all three moments is consistent with an active aggregation and accretion process. The fact that the mid-level accretion process was taking place higher and with less supercooled liquid resulted in the moderate snow that was observed.
Then late in the day there was a return to ice pellets. The 0000 UTC sounding on January 12, 1991, from Buffalo showed an isothermal layer at 0°C between 85 kPa and 75 kPa with cooler air below. The wind profile did not have a backing layer as the warm air from the system to the south got closer (Figs. 9, l ld). The vertical profiles of Ze , V t
and ~r w at 0016 UTC on January 12, 1991, are given by the dashed lines in Fig. 12. Ze had a gradual increase with decreasing altitude. Below 2 km there was an increase in V t and cr w from the previous profile at 1905 UTC, probably an indication that accretion was again becoming more active. Shortly after this profile, YTZ reported a return to a mixture of snow and ice pellets. The mixed precipitation did not last very long ( < 1 h) and then changed to a mixture of ice pellets and freezing drizzle. No vertical scans were obtained during final transition, The weather forecasters at the Ontario Weather Centre
126 D.R. Hudak, R. Nissen / Atmospheric Research 41 (1996) 109-130
had recognized the possibility of ice pellets late in the day in association with the warm air aloft.
6. Discussion
The radar scanning strategy in which a volume scan mode and a vertically pointing mode were alternated proved very successful. It provided the necessary information to gain valuable insight into the structure of major winter snowstorms. The EVAD analysis of the volume scan Doppler velocity data provided the high time resolution necessary to identify key mesoscale features in these storms. Characteristics such as the area of divergence just ahead of the low centre in the first case and the shallow layer in which there was a reversal in the directional shear and strong mid-level convergence in the second case were details not recognized by the synoptic analysis. The Doppler moments as deduced from the vertically pointing spectrum data revealed the precipitation variabil- ity among these features.
In both cases low level convergence in the easterly flow across the lake ahead of the approaching disturbance was seen. In these circumstances V t and cr w were high in the lowest levels. This suggests that accretion was taking place as a result of the off-lake flow. In the second case (January 11, 1991), the low level easterly flow remained steady and V t and ~Yw high. In the first case (February 14, 1991), changes in the low level flow away from the lake brought corresponding decreases in V~ and cr,~,. Initially, as the off-lake flow slackened, an area of divergence appeared. Then a deep area of conver- gence was seen in association with the passage of the low centre over the radar. At this point, V t and cr w in the mid-levels were higher than before, but not as large as in the off-lake low level flow. These values can be associated with aggregation near the low centre.
The wind analysis in the second case was able to differentiate between the low level convergence when the flow was across the lake and the mid-level convergence in the main system due to the overrunning warm air. High values of V t and ~w in the mid-levels associated with this overrunning suggest a very active accretion was taking place. In addition, the synoptic analyses indicated that there was no above 0°C layer. This implies that the ice pellets that were observed at this time were produced without the benefit of the melting process. Where the convergence was weaker, V t and ~r w values were less and moderate to heavy snow characteristic of the aggregation process was observed.
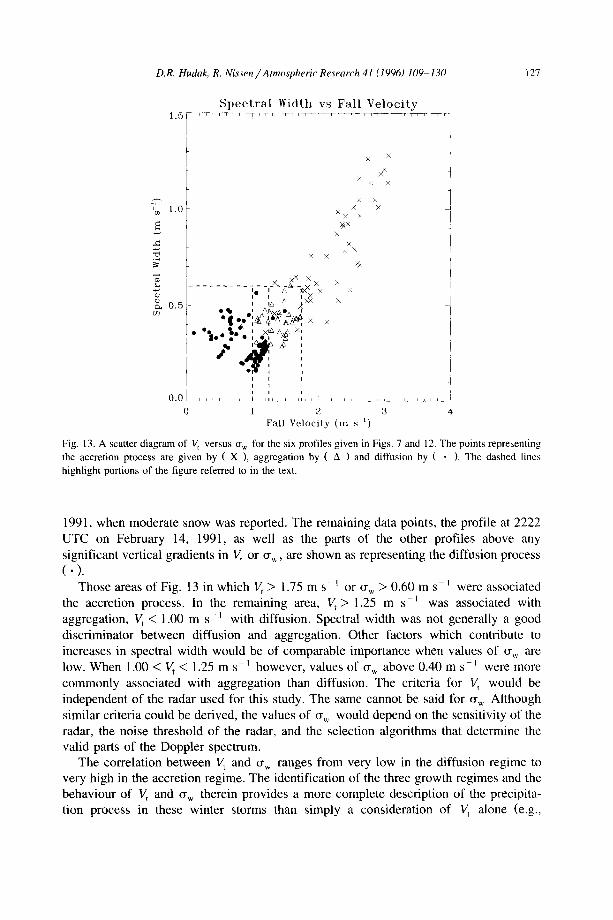
The interpretation of the Doppler moments relied on the detailed knowledge of the synoptic situation, the wind field, and the temperature profile. The question of the interpretation of the vertical profiles of the Doppler moments gains further insights when all the data are considered together. Fig. 13 is a scatter diagram of V t versus ~,~ for the six profiles given in Figs. 7 and 12. The points representing the accretion process (X) were taken from those parts of the profiles in which there was mid-level overrunning warm air or a well-developed off-lake low level flow. The points showing aggregation (zx) included the lower portion of the profile with the low centre near the radar on February 14, 1991, as well as the middle portion of the 1905 UTC profile on January 11,
D.R. Hudak, R. Nissen / Atmospheric Research 41 (1996) 109-130 127
1.5
'~ 1.0
S p e c t r a l Width vs F a l l V e l o c i t y
x x
x ~ × x
z. 0.5
| o - • • i^•.1 ,.," ~ ~
• u m i i i
0 . 0 ~ ~ ~ J J a _ x ~ J ~ L ~ L~
0 1 2
X X
X
X X t
x × XX X
~x x
XXX !
× I X '
× ]
i
i !
3 4 Fall Ve loc i ty ( m s -~)
Fig. 13. A scatter diagram of Vf versus cr W for the six profiles given in Figs. 7 and 12. The points representing the accretion process are given by ( X ), aggregation by ( A ) and diffusion by ( • ). The dashed lines highlight portions of the figure referred to in the text.
1991, when moderate snow was reported. The remaining data points, the profile at 2222 UTC on February 14, 1991, as well as the parts of the other profiles above any significant vertical gradients in V t or ~ , are shown as representing the diffusion process (.).
Those areas of Fig. 13 in which V t > 1.75 m s - ~ or cr w > 0.60 m s - ~ were associated the accretion process. In the remaining area, V t > 1.25 m s-1 was associated with aggregation, V t < 1.00 m s - ' with diffusion. Spectral width was not generally a good discriminator between diffusion and aggregation. Other factors which contribute to increases in spectral width would be of comparable importance when values of (~w are low. When 1.00 < V t < 1.25 m s - ~ however, values of (r w above 0.40 m s - i were more commonly associated with aggregation than diffusion. The criteria for V t would be independent of the radar used for this study. The same cannot be said for c% Although similar criteria could be derived, the values of ( ~ would depend on the sensitivity of the radar, the noise threshold of the radar, and the selection algorithms that determine the valid parts of the Doppler spectrum.
The correlation between V t and (~w ranges from very low in the diffusion regime to very high in the accretion regime. The identification of the three growth regimes and the behaviour of V t and (~w therein provides a more complete description of the precipita- tion process in these winter storms than simply a consideration of V, alone (e.g.,
128 D.R. Hudak, R. Nissen / Atmospheric Research 41 (1996) 109-130
Mosimann et al., 1993a,b). The classification of the data among these regimes would permit assumptions to be made into the nature of the precipitation particles, for example their shape and density. This information can provide the basis of an improved understanding of the hydrometeor size spectrum. Studies into topics that depend on the microphysics of solid precipitation formation such as snowfall measurements, aircraft icing and precipitation chemistry can benefit greatly from the Doppler radar scanning and analysis techniques described in this paper.
Some general comments can be made about the snowstorms in the Toronto area. In the convergent low level flow across the lake ahead of the approaching disturbance the accretion process was found to be very active. This in effect results in an enhanced period of snowfall in this area as a result of this disturbance. Closer to the disturbance, mid-level convergence gives the mechanism for precipitation production. The degree of overrunning determines whether accretion or aggregation is dominant. To the rear of these disturbances aggregation and accretion reduce in importance while diffusional growth increases. The dual scanning strategy of the Doppler radar enabled these facets of the storm to be identified.
7. Conclusions
The Toronto Winter Storms Program has gathered a great deal of information on the microphysical characteristics of winter storms in the Great Lakes area. The widespread, extensive nature of these slowly evolving systems enables a single Doppler radar to provide valuable insight into their internal structure. Examples have been presented which have shown that through a careful use of an X-band Doppler radar, local radiosonde ascents, and surface weather observations the predominant microphysical footprints of the precipitating systems can be established. Variations of these microphys- ical scenarios on the mesoscale have been deduced. The impact on the microphysics of the presence of the ice-free lake to the south was to enhance the precipitation through an active accretion process in the lowest levels. The major snowstorms in the Toronto area have convergence regions associated both with the low level easterly flow across the lake and the synoptic scale disturbance. The wind field can be measured sufficiently well with a Doppler radar to distinguish between them. It has also been shown that the vertical profiles of the moments of the Doppler spectrum give insights into the microphysical processes that are taking place. By considering the terminal velocity and spectral width together, their changes with height and in time, subtle yet significant aspects of the precipitation process can be determined.
More comprehensive studies of this type will result in better conceptual models of the details of the precipitation processes on scales which current numerical models are unable to resolve. This in turn would improve our ability to predict their evolution. Future work must concentrate on acquiring a more extensive set of vertically pointing spectrum data from the radar under a wide variety of precipitation circumstances. With the addition of concurrent in-situ aircraft data and detailed surface observations more quantitative representations of the vertically pointing Doppler radar signatures can be made. Such information has been obtained on CASP-II (Hudak et al., 1996) and the
D.R. Hudak, R. Nissen /Atmospheric Research 41 11996) 109-130 129
recently completed Beaufort and Arctic Storms experiment (Hudak et al., 1995). It is currently the subject of intensive investigation,
Acknowledgements
The authors gratefully acknowledge the advice and encouragement of Professor Roland List of the University of Toronto in the preparation of this manuscript and in the use of the radar and computing facilities under his direction. The financial assistance of the Atmospheric Environment Service in supporting one of the authors (RN) is also greatly appreciated.
References
Boccippio, D.J., 1995. A diagnostic analysis of the VVP single-Doppler retrieval technique. J. Atmos. Oceanic Technol., 12: 230-248.
Browning, K.A. and Szejwach, G., 1994. Developments in observational systems for weather forecasting. Meteorol. Appl., 1: 3-21.
Byrd, G., 1989. A composite analysis of winter season overrunning precipitation bands over the southern plains of the United States. J. Atmos. Sci., 46: I 119-1132.
Campbell, W.C. and Strauch, R.G., 1976. Meteorological Doppler radar with double pulse transmission. Preprints, 17th Conf. Radar Meteorol., Seattle, AMS, pp. 42-44.
Campistron, B., Huggins, A.W. and Long, A.B., 1991. Investigations of a winter mountain storm in Utah. Part Ill: Single-Doppler radar measurements of turbulence. J. Atmos. Sci.. 48:1306-1318.
Cunning, J.B., 1991. The STORM-Fronts Experiment Systems Test. In: Ist Int. Syrup. Winter Storms, New Orleans, USA. Am. Meteorol. Soc., Boston, pp. 366-368.
Dirks, R.A., Kuetmer, J.P. and Moore, J.A., 1988. Genesis of Atlantic Lows Experiment (GALE): an overview. Bull. Am. Meteorol. Soc., 69: 148-160.
Doviak, R,J. and Zrnic, D.S., 1984. Doppler Radar and Weather Observations. Academic Press, Toronto, Canada, 458 pp.
Dunn, L., 1987. Cold air damming by the Front Range of the Colorado Rockies and its relationship to locally heavy snows. Weather Forecasting, 2 :177-189.
Fujiyoshi, Y., Tsuboki, K., Satoh, S. and Wakahama, G., 1992. Three-dimensional radar echo structure of a snow band formed on the lee side of a mountain. J. Meteorol. Soc. Jpn., 70: I 1-23.
Gage, K.S., Williams, C.R. and Ecklund, W.L.. 1994. UHF wind profilers: a new tool for diagnosing tropical convective cloud systems. Bull. Am. Meteorol. Soc., 75: 2289-2294.
Hare, F.K. and Thomas, M.K., 1979. Climate Canada. Wiley, Toronto, Canada, 230 pp. Hadlock, R. and Kreitzberg, C.W., 1988. The experiment on rapidly intensifying cyclones over the Atlantic
(ERICA) field study: objectives and plans. Bull. Am. Meteorol. Soc., 69: 1309-132/). Hildebrand, P.H. and Sekhon, R.S., 1974. Objective determination of the noise level in Doppler spectra. J.
Appl. Meteorol., 13: 808-811. Hudak, D.R., Stewart, R.E., Moore, G.W.K. and Hudson, E.T., 1995. Synoptic considerations of storms in the
southern Beaufort Sea - - expectations for BASE. In: Proc. 4th Conf. Polar Meteorol. Oceanogr., Dallas, Texas, 15-20 Jan., 1995.
Hudak, D.R., Stewart, R.E., Thomson, A.D. and List, R., 1996. Warm frontal structure in association with a rapidly deepening extratropical cyclone. Atmos.-Ocean, 34.
lshihara, M., Sakakibara, H. and Yanagisawa, Z., 1989. Doppler radar analysis of the structure of mesoscale snow bands developed between the winter monsoon and the land breeze. J. Meteorol. Soc. Jpn., 67: 503-520.
130 D.R. Hudak, R. Nissen /Atmospheric Research 41 (1996) 109-130
Kreitzberg, C.W., 1991. Multiscale STORM I winter/spring field study, 1994. In: 1st Int. Syrup. Winter Storms, New Orleans, USA. Am. Meteorol. Soc., Boston, pp. 369-371.
Lo, K.K. and Passarelli, R,E., 1982. The growth of snow in winter storms: an airborne observational study. J. Atmos. Sci., 39: 697-706.
Long, A.B., Campistron, B.A. and Huggins, A.W., 1990, Investigations of a winter mountain storm in Utah. Part I: Synoptic analyses, mesoscale kinematics and water release rates. J. Atmos. Sci., 47: 1302-1322.
Martner, B.E., Snider, J.B., Zamora, R.J., Byrd, G.P., Niziol, T.A. and Joe, P.I., 1993. A remote sensing view of a freezing rain storm. Mon. Weather Rev., 121: 2562-2577.
Marwitz, J.D. and Toth, J., 1993. A case study of heavy snowfall in Oklahoma. Mon. Weather Rev., 121: 648-660.
Matejka, T.J. and Srivastava, R.C., 1991. An improved version of the extended velocity-azimuth display analysis of single-Doppler radar data. J. Atmos. Oceanic Technol., 8: 453-466.
Mosimann, L., Steiner, M., Collett, J.L., Henrich, W., Schmid, W. and Waldvogel, A., 1993a. Ice crystal observations and the degree of riming in winter precipitation. J. Water Air Soil Pollut., 68: 29-42.
Mosimann, L., Steiner, M. and Henrich, W., 1993b. Prediction of snow crystal shape and riming by vertical Doppler radar. Atmos. Res., 29: 85-98.
Prater, E.T. and Borho, A.A., 1992. Doppler radar wind and reflectivity signatures with overrunning and freezing-rain episodes: preliminary results. J. Appl. Meteorol., 31:1350 1358.
Ramamurthy, M.K., Rauber, R.M., Collins, B.P., Shields, M.T., Kennedy, P.C. and Clark, W.L., 1991. UNIWIPP: A University of Illinois field experiment to investigate the structure of mesoscale precipitation in winter storms. Bull. Am. Meteorol. Soc., 72: 764-776.
Rasmussen, R., Politovich, M., Marwitz, J., Sand, W., McGinley, J., Smart, J., Pielke, R., Rutledge, S., Westley, D., Stossmeister, G,, Bernstein, B., Elmore, K., Powell, N.. Westwater, E., Stankov, B. and Burrows, D., 1992. Winter icing and storms project. Bull. Am. Meteornl. Soc., 73: 951-974.
Sassen, K., Huggins, A.W., Long, A.B., Snider, J,B. and Meitin, R.L, 1990. Investigations of a winter mountain storm in Utah. Part I1: Mesoscale structure, supercooled liquid water development and precipita- tion processes. J. Atmos. Sci., 47: 1323-1350.
Srivastava, R.C., Matejka, T.J. and Lorello, T.J., 1986. Doppler radar study of the trailing anvil region associated with a squall line. J. Atmos. Sci., 43: 356-377.
Stewart, R.E., 1991a. On the temperatures near and the motions of low-pressure centres in winter storms. Atmos. Res., 26: 33-54.
Stewart, R.E., 1991b. Canadian Atlantic Storms Program: Progress and plans of the meteorological compo- nent. Bull. Am. Meteorol. Soc,, 72: 364-371.
Stewart, R.E., 1992. Precipitation types in the transition region of winter storms. Bull. Am. Meteorol. Soc., 73: 287-296.
Stewart, R.E. and King, P., 1987a. Freezing precipitation in winter storms. Mon. Weather Rev., 115: 1270-1279.
Stewart, R.E. and King, P., 1987b. Rain-snow boundaries over southern Ontario. Mon. Weather Rev., 115: 1894-1907.
Stewart, R.E. and King, P., 19911. Precipitation type transition regions in winter storms over southern Ontario. J. Geophys. Res., 95: 22,355-22,368.
Stewart, R.E. and Yiu, D.T., 1993. Distributions of precipitation and associated parameters across precipitation type transitions over southern Ontario. Atmos. Res., 29: 153-178.
Stewart, R.E., Crawford, R.W., Donaldson, N.R., Low, T.B. and Sheppard, B.E., 1990. Precipitation and environmental conditions during accretion in Canadian east coast winter storms. J. Appl. Meteorol., 29: 525-538.
Waldvogel, A., Henrich, W. and Mosimann, L., 1993. New insights into the coupling between snow spectra and raindrop size distributions. In: Preprints, 26th Conf. Radar Meteorol., Norman, AMS, pp. 602-604.