Doppler Radar
145
Analysis & Diagnosis 1 Radar Palette Home Doppler Doppler Radar • The Doppler Effect • The Doppler Dilemma • Etc – other topics • Doppler Analysis and Diagnosis (Important New and Original Material linked to slide 80)
-
Upload
mason-weber -
Category
Documents
-
view
80 -
download
1
description
Doppler Radar. The Doppler Effect The Doppler Dilemma Etc – other topics Doppler Analysis and Diagnosis (Important New and Original Material linked to slide 80). The Doppler effect. Classically, the Doppler effect is a frequency shift - PowerPoint PPT Presentation
Transcript of Doppler Radar
Analysis & Diagnosis 1Radar Palette Home Doppler
Doppler Radar
• The Doppler Effect• The Doppler Dilemma• Etc – other topics• Doppler Analysis and Diagnosis (Important New
and Original Material linked to slide 80)
Analysis & Diagnosis 2Radar Palette Home Doppler
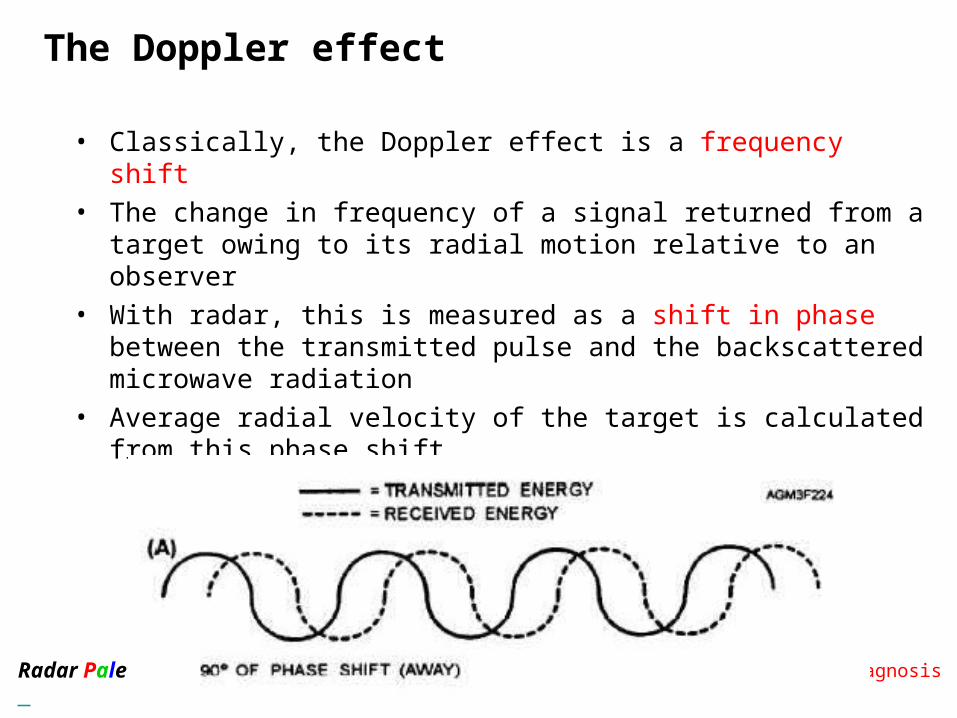
The Doppler effect
• Classically, the Doppler effect is a frequency shift • The change in frequency of a signal returned from a target owing to
its radial motion relative to an observer• With radar, this is measured as a shift in phase between the
transmitted pulse and the backscattered microwave radiation• Average radial velocity of the target is calculated from this phase
shift

Analysis & Diagnosis 3Radar Palette Home Doppler
The Radar Waveform
Analysis & Diagnosis 4Radar Palette Home Doppler
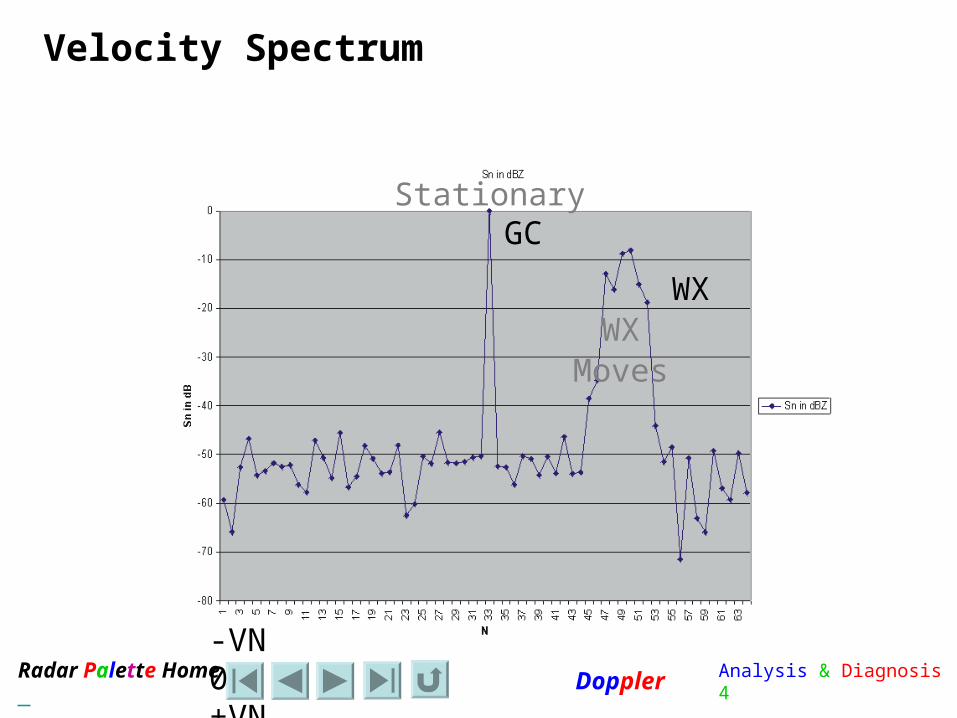
Velocity Spectrum
-VN 0 +VN
GC
WX
Stationary
WXMoves

Analysis & Diagnosis 5Radar Palette Home Doppler
Phase Shift Ambiguity
A shift of ¼ wavelength is ambiguous.
You don’t know if your are coming or going?

Analysis & Diagnosis 6Radar Palette Home Doppler
Velocity folding – Phase Shift Ambiguity
• Target radial velocities producing phase shifts greater than one-half wavelength (or p radians) results in velocity folding
• Maximum unambiguous radial velocity Vmax (Nyquist velocity) =
• (PRF X Wavelength) / 4• This range is not adequate to describe all
horizontal velocities
Nyquist velocity=1200 X 5cm/4 = 1500cm/sec=15m/s=30knotsIs a Nyquist velocity of 30knots enough?
Analysis & Diagnosis 7Radar Palette Home Doppler
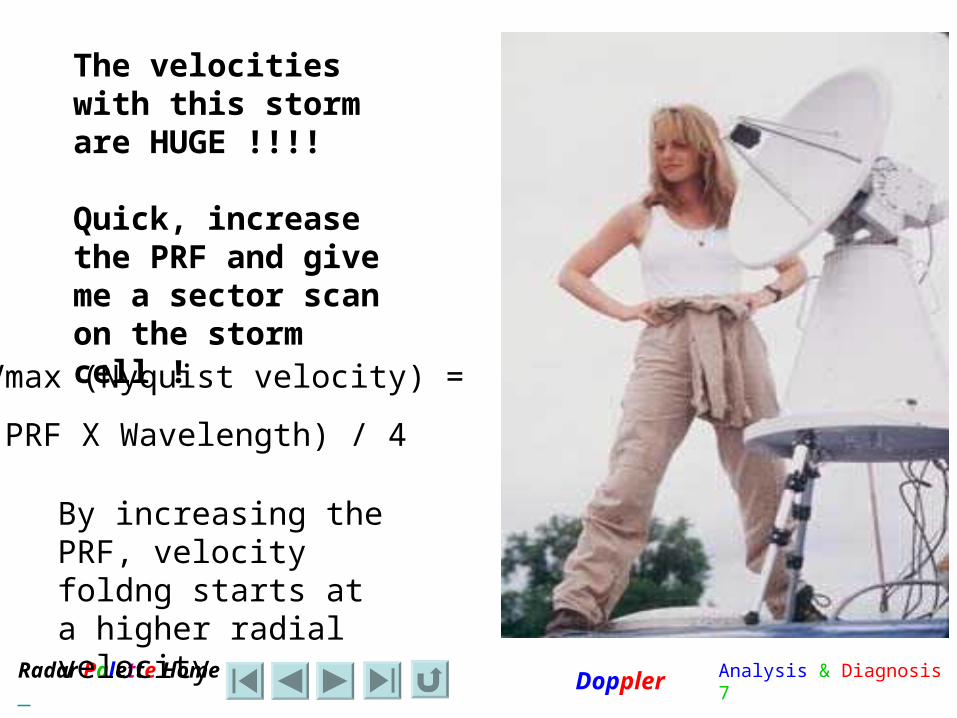
The velocities with this storm are HUGE !!!!
Quick, increase the PRF and give me a sector scan on the storm cell !
Vmax (Nyquist velocity) =
(PRF X Wavelength) / 4
By increasing the PRF, velocity foldng starts at a higher radial velocity
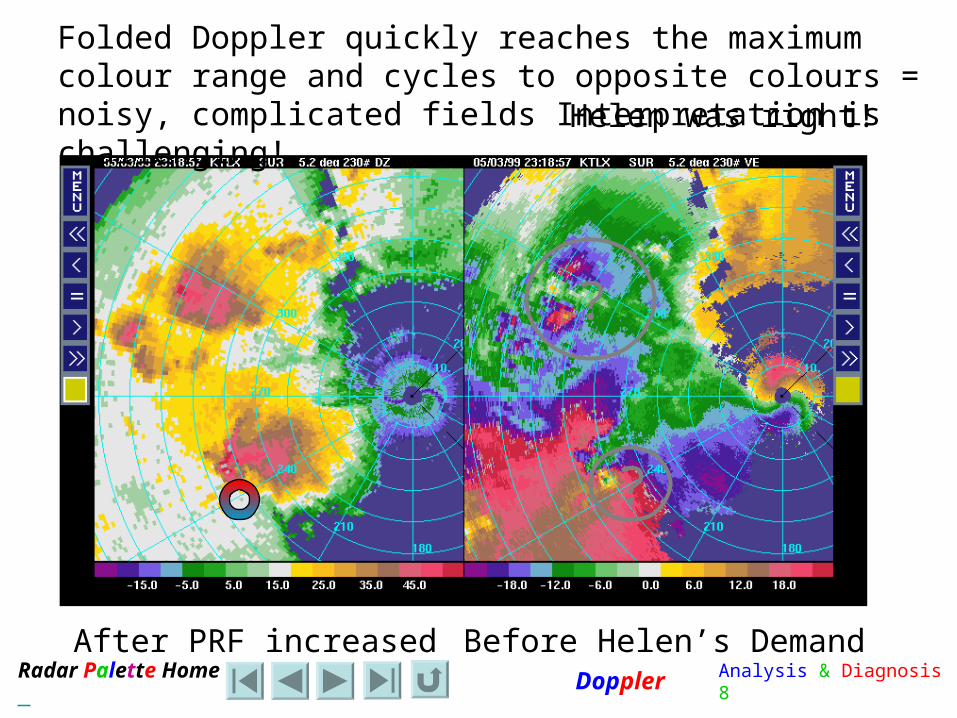
Analysis & Diagnosis 8Radar Palette Home Doppler
Before Helen’s DemandAfter PRF increased
Folded Doppler quickly reaches the maximum colour range and cycles to opposite colours = noisy, complicated fields Interpretation is challenging!
?
?
Helen was right!
Analysis & Diagnosis 10Radar Palette Home Doppler
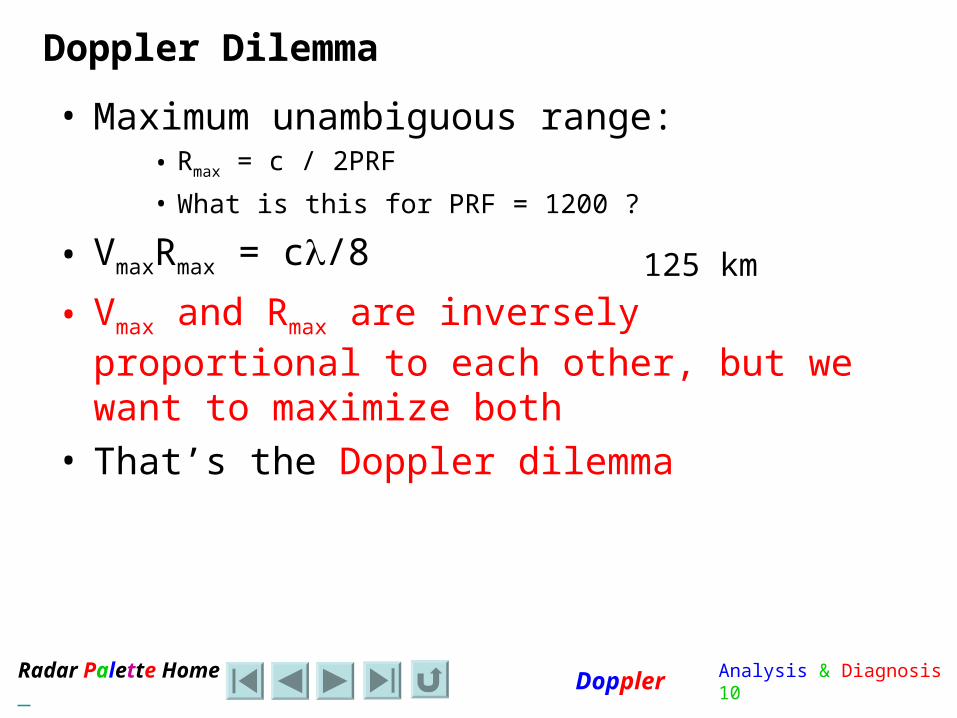
Doppler Dilemma
• Maximum unambiguous range: • Rmax = c / 2PRF
• What is this for PRF = 1200 ?
• VmaxRmax = c/8
• Vmax and Rmax are inversely proportional to each other, but we want to maximize both
• That’s the Doppler dilemma
125 km
Analysis & Diagnosis 11Radar Palette Home Doppler
How can we increase Vmax ?
Analysis & Diagnosis 12Radar Palette Home Doppler
Velocity Unfolding
• Use two PRF’s and take the difference in the Doppler velocities !
• The difference turns out to be a unique function of the actual velocity out to much higher velocities!!
• So V and one of the velocity measurements can be used to unambiguously calculate the actual radial velocity, perhaps up to 48 m/s (almost 100 knots).

Analysis & Diagnosis 13Radar Palette Home Doppler
Whoa. Now that’s fast!!

Analysis & Diagnosis 14Radar Palette Home Doppler
Dual PRF Unfolding
Analysis & Diagnosis 15Radar Palette Home Doppler
Now we can see the whole storm, Bill !
That’s great, Jo. Now if only Dorothy and pigs would fly !

Analysis & Diagnosis 16Radar Palette Home Doppler
Example: Radial Velocity Product with Vr to 48 m/s
SELY low level winds
WLY upper level windsKatabatic
ColdFront?
N-S WarmFront?

Analysis & Diagnosis 17Radar Palette Home Doppler
Doppler Patterns
Analysis & Diagnosis 18Radar Palette Home Doppler
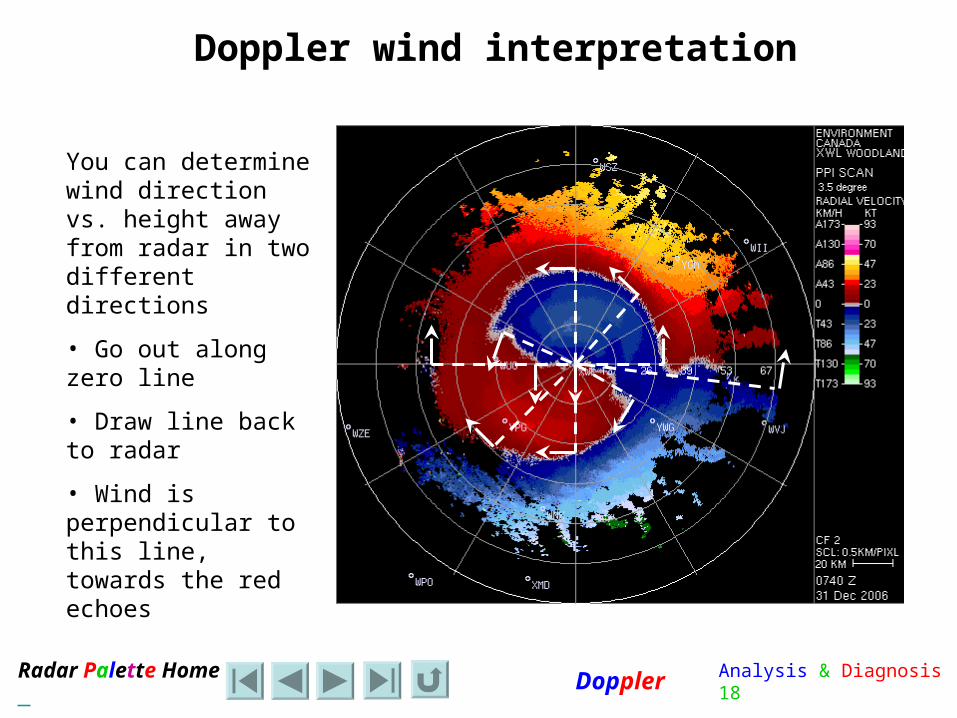
Doppler wind interpretation
You can determine wind direction vs. height away from radar in two different directions
• Go out along zero line
• Draw line back to radar
• Wind is perpendicular to this line, towards the red echoes

Analysis & Diagnosis 19Radar Palette Home Doppler
Doppler wind interpretation
For any height you can attempt to determine the wind in 4 locations
• Determine the two zero line winds
• Look roughly 90° away for the max wind, which should be all directed along a radial
In this way you can see areas of non-uniform flow
• confluence, diffluence

Analysis & Diagnosis 20Radar Palette Home Doppler
Doppler Uniform30 m/s wind everywhere
Analysis & Diagnosis 21Radar Palette Home Doppler
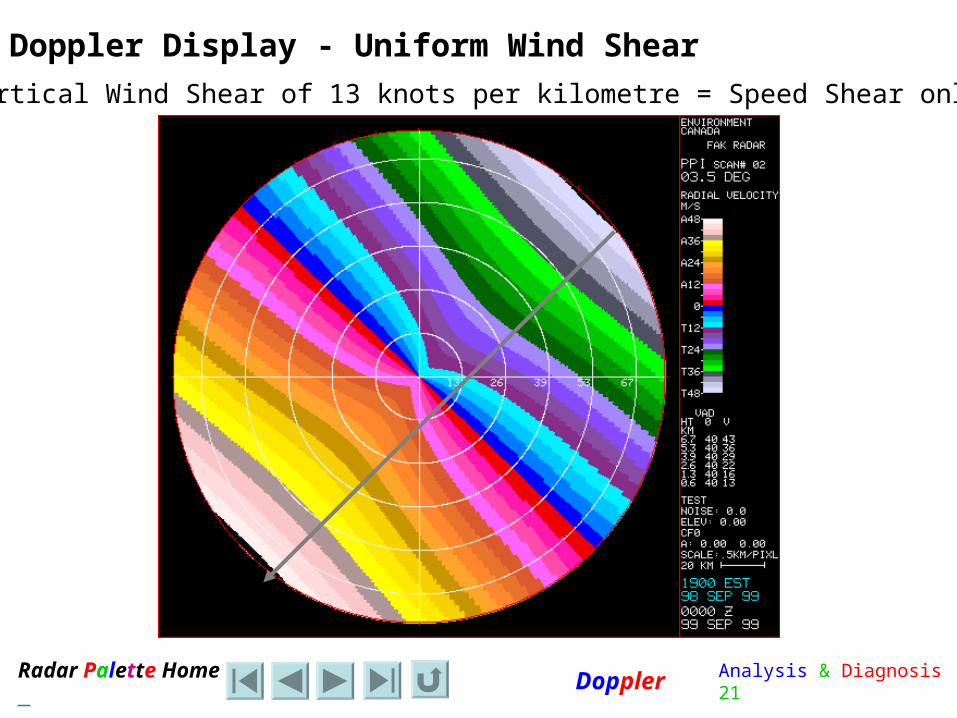
Doppler Display - Uniform Wind Shear
Vertical Wind Shear of 13 knots per kilometre = Speed Shear only
Analysis & Diagnosis 22Radar Palette Home Doppler
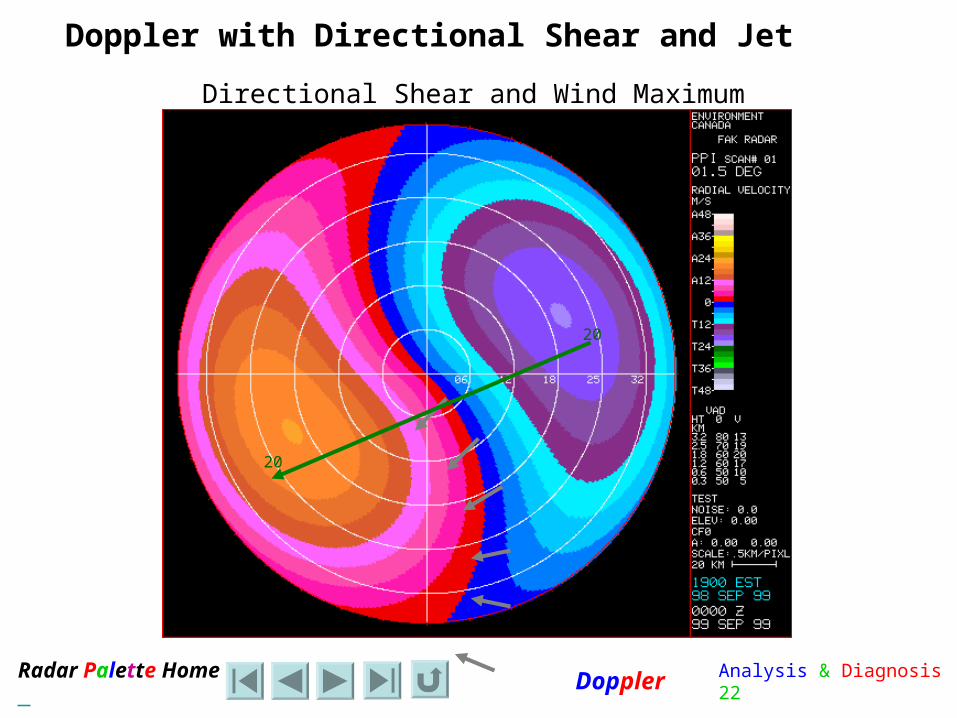
Doppler with Directional Shear and Jet
20
20
Directional Shear and Wind Maximum

Analysis & Diagnosis 23Radar Palette Home Doppler
Doppler with Wind Shear - Speed and Directional
Direction veering with heightDirection veering with height
Speed increasing with heightSpeed increasing with height

Analysis & Diagnosis 24Radar Palette Home Doppler
The Doppler Vortex

Analysis & Diagnosis 25Radar Palette Home Doppler
Doppler Practice
Westerly Winds with only Speed shear
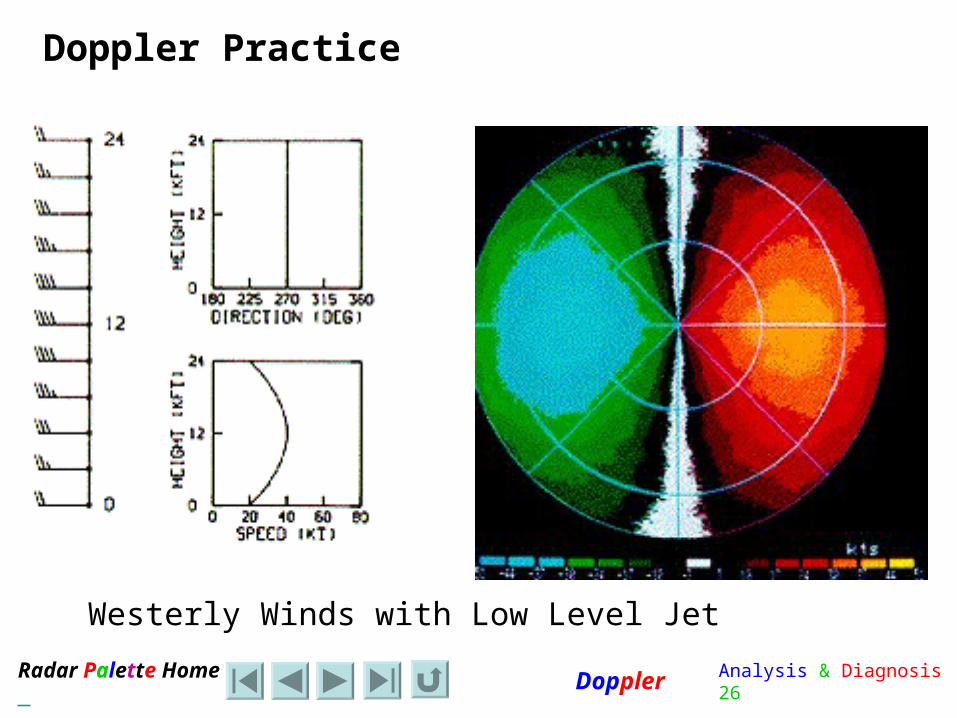
Analysis & Diagnosis 26Radar Palette Home Doppler
Doppler Practice
Westerly Winds with Low Level Jet

Analysis & Diagnosis 27Radar Palette Home Doppler
Doppler Practice
Veering Winds with no Speed shear

Analysis & Diagnosis 28Radar Palette Home Doppler
Doppler Practice
Backing Winds with no Speed shear

Analysis & Diagnosis 29Radar Palette Home Doppler
Doppler Practice
Low Level Veering under High Level Backing Winds - no Speed shear
Changes in Stability?

Analysis & Diagnosis 30Radar Palette Home Doppler
Doppler Practice
Wind shift line
Analysis & Diagnosis 31Radar Palette Home Doppler
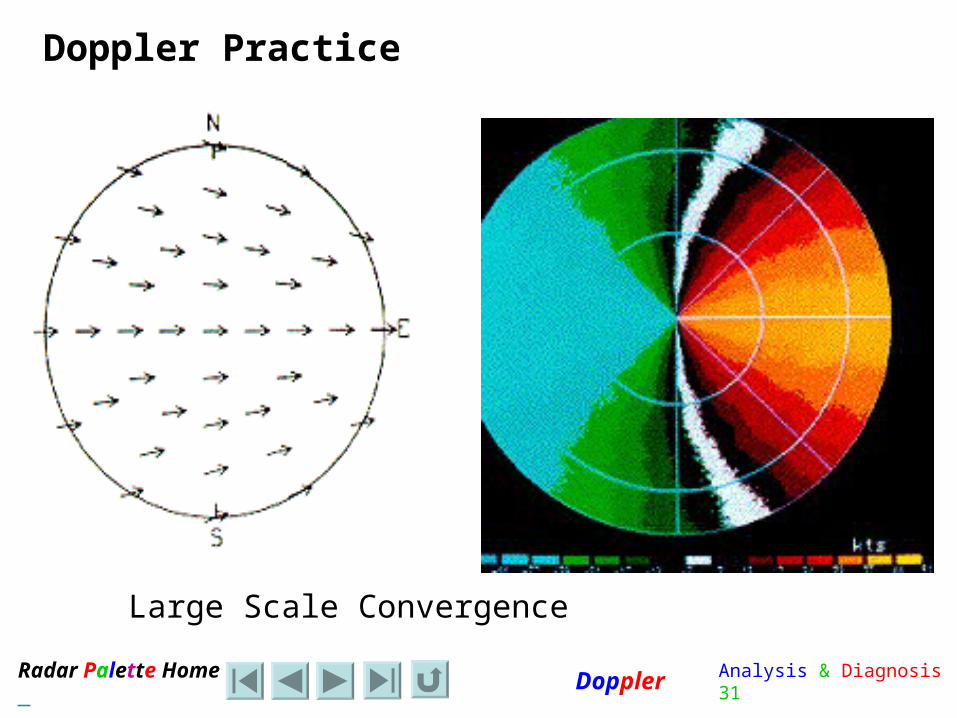
Doppler Practice
Large Scale Convergence
Analysis & Diagnosis 32Radar Palette Home Doppler
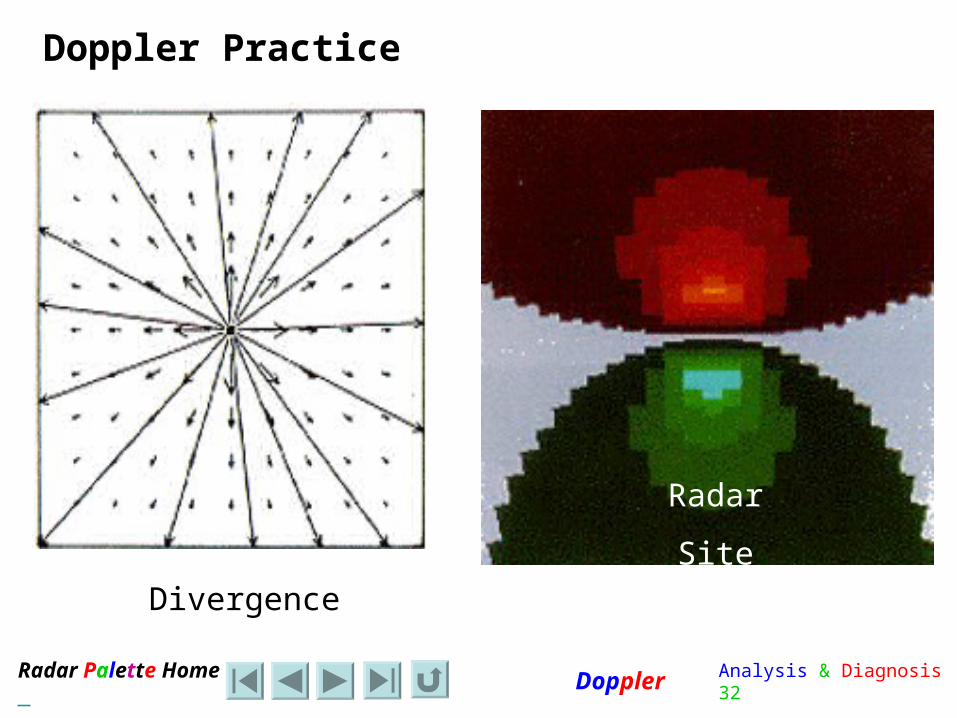
Doppler Practice
Divergence
Radar
Site

Analysis & Diagnosis 33Radar Palette Home Doppler
Doppler Practice
Cyclonic Vortex
Radar
Site

Analysis & Diagnosis 34Radar Palette Home Doppler
Doppler Practice
NNELY
SWLY
LLJ
QS Horizontal LLJ
Marginal winds Backing with Height - Cold Air AdvectionMaybe a Cold Conveyor Belt ahead of a synoptic system…
Analysis & Diagnosis 35Radar Palette Home Doppler
Doppler Displays

Analysis & Diagnosis 36Radar Palette Home Doppler
Velocity Azimuth Display - VAD
• Doppler radial velocity data used to construct a wind profile in the vertical
• Direction, speed (m/s) and reflectivity (dBZ) displayed as a function of height (km)
• Note: Velocity scale is fixed in range 0-20 m/s ( i.e. most of the unfolded velocities are not used )

Analysis & Diagnosis 37Radar Palette Home Doppler
Velocity Azimuth Display - VAD• At a given height (h), then the radial velocity is: • For a uniform flow field and assume Vw (Vertical Velocity) approximately = 0
then• Best fit of a sine curve to the observations around the circle.

Analysis & Diagnosis 38Radar Palette Home Doppler
Velocity Azimuth Display - VAD• Accuracy of VAD decreases
with elevation angle and height. The desired horizontal wind component becomes a smaller part of the radial wind component actually measure.
• Errors in the radial component has a bigger impact on the accuracy of the horizontal wind
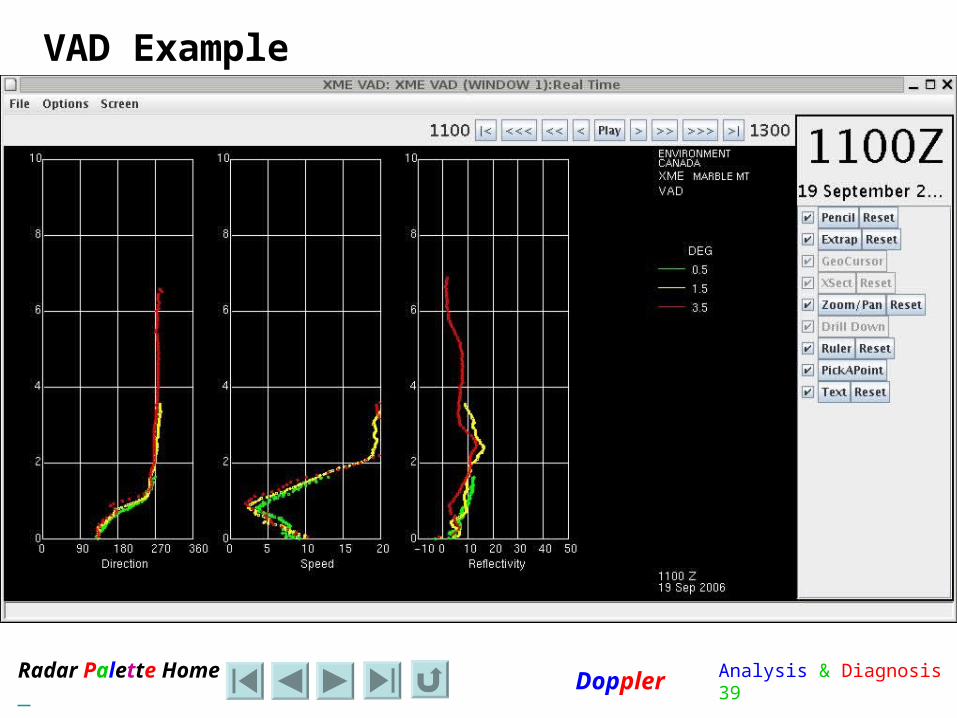
Analysis & Diagnosis 39Radar Palette Home Doppler
VAD Example
Analysis & Diagnosis 40Radar Palette Home Doppler
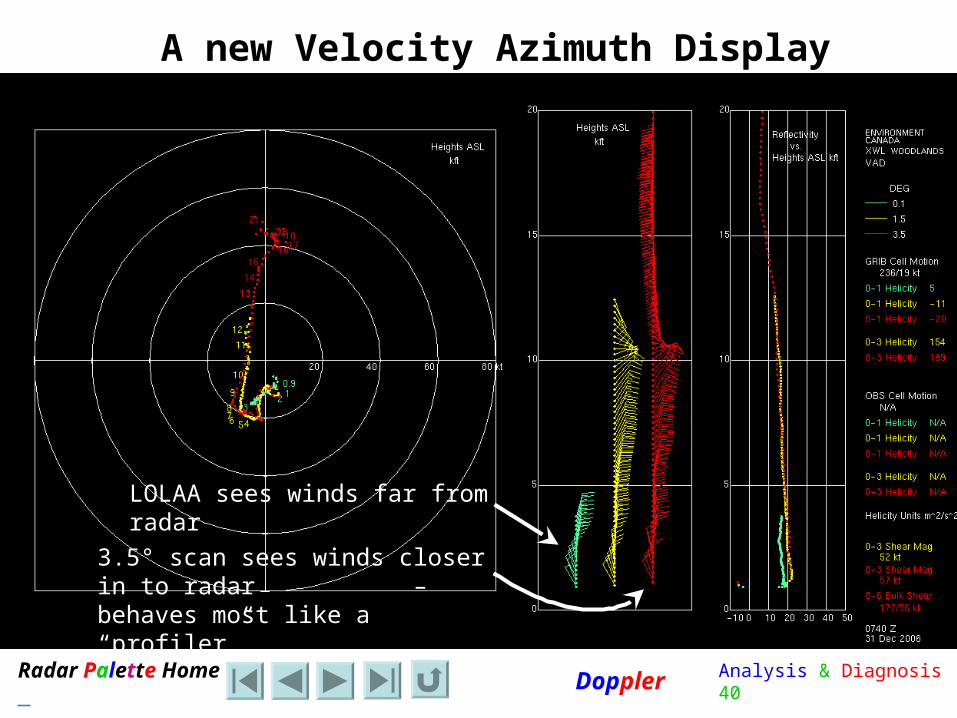
A new Velocity Azimuth Display
LOLAA sees winds far from radar
3.5° scan sees winds closer in to radar – behaves most like a “profiler”

Analysis & Diagnosis 41Radar Palette Home Doppler
Doppler Spectra Width
• Spread of the Doppler Power Spectrum
• the spread, range of terminal fall speeds of the scatterers (more pronounced for rain than for snow) spectra for rain spectra for snow
• turbulence of the air (upper levels in severe convection)
• vertical wind shear (e.g., along a gust front)
• antenna motion
Rain
Snow

Analysis & Diagnosis 42Radar Palette Home Doppler
Doppler Image Characteristics
Small Spectral Width
Large Spectral Width

Analysis & Diagnosis 43Radar Palette Home Doppler
Spectral Width and “Doppler Display Texture”
RainTexture
SnowTexture

Analysis & Diagnosis 44Radar Palette Home Doppler
The Doppler Precipitation Spectral Width
Doppler Precipitation Texture
Example

Analysis & Diagnosis 45Radar Palette Home Doppler
The Doppler Twist Signature - Example
•The white dashed line separates different wind regimes in the vertical.
•It also separates regimes of differing Doppler texture.
•Above the dashed line the Doppler texture is uniform and characteristic of snow.
•Below the dashed line the texture is lumpy like oatmeal and characteristic of rain.
•This is also an example of the Virga Hole Signature
The dashed line is likely the warm front. The layer immediately below is where the snow is melting into rain.

Analysis & Diagnosis 46Radar Palette Home Doppler
Filtering using Doppler and Processing
Analysis & Diagnosis 47Radar Palette Home Doppler
Second Trip Echo – Extending the Range of the Doppler Scan
Random Phase Processing extends the Doppler Range
Dual PRF’s extends the Nyquist Velocity
Analysis & Diagnosis 48Radar Palette Home Doppler
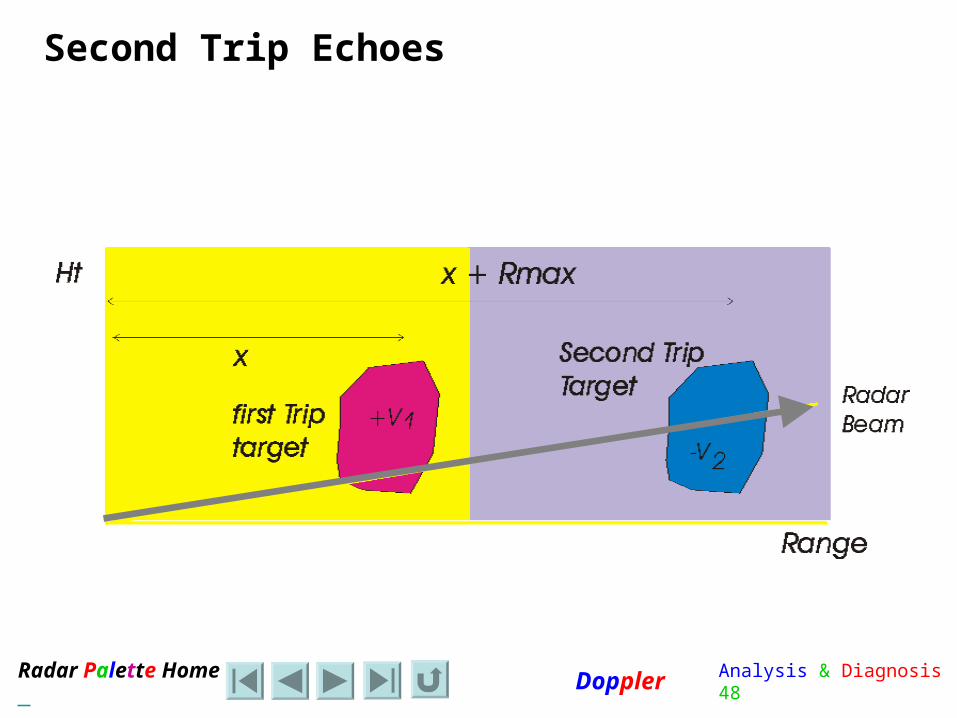
Second Trip Echoes
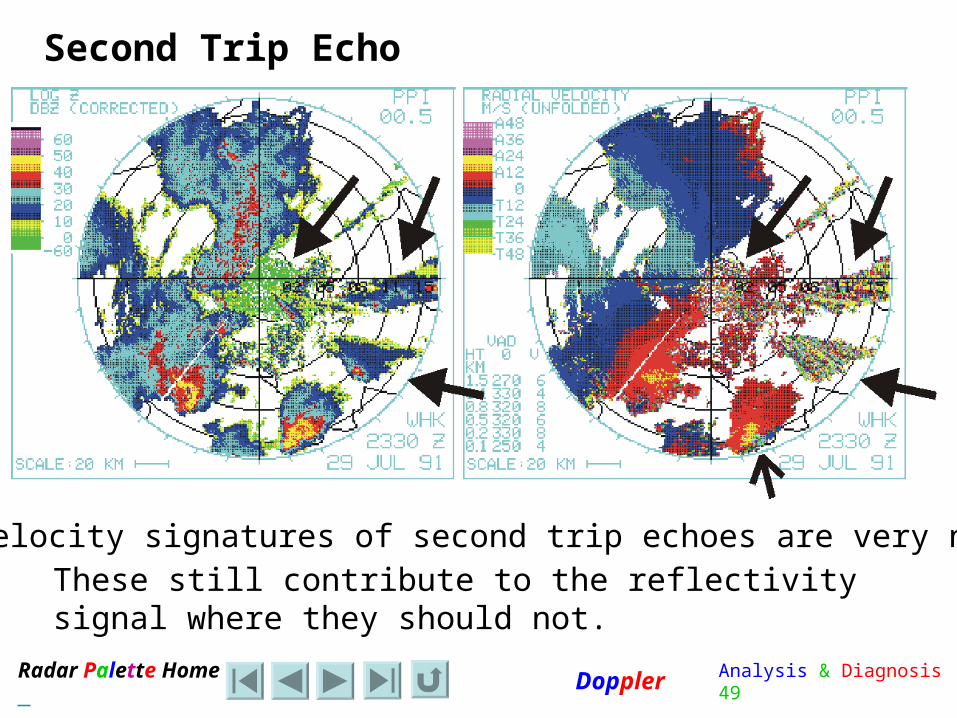
Analysis & Diagnosis 49Radar Palette Home Doppler
Second Trip Echo
The velocity signatures of second trip echoes are very noisy.These still contribute to the reflectivity signal where they should not.
Analysis & Diagnosis 50Radar Palette Home Doppler
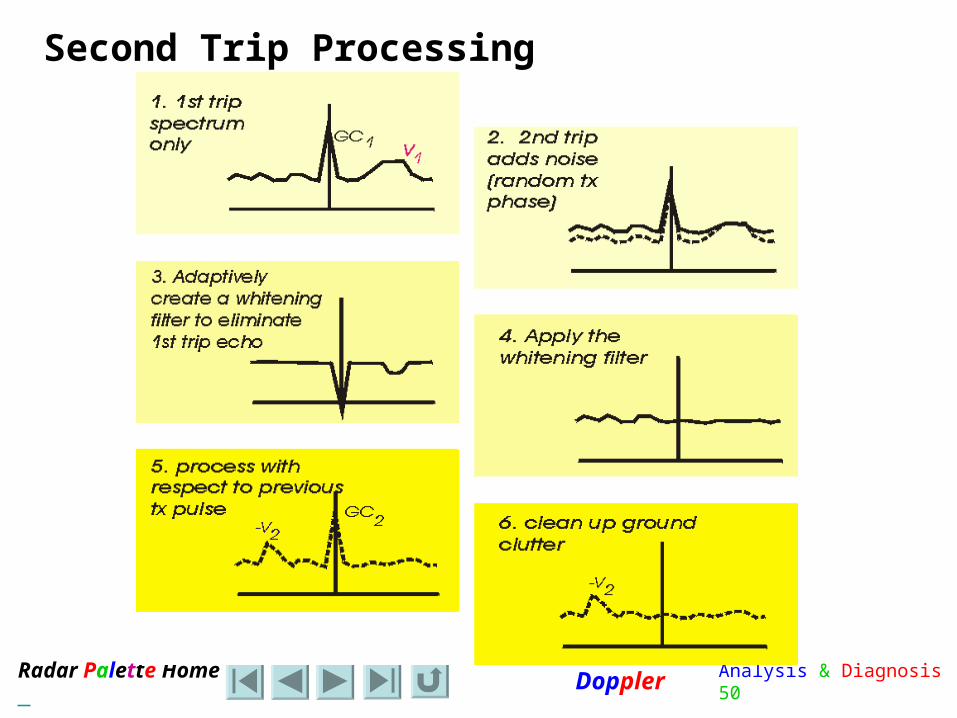
Second Trip Processing

Analysis & Diagnosis 51Radar Palette Home Doppler
Second Trip Processing
Conventional CAPPI
Doppler ReflectivityDoppler Reflectivity with
Second Trip Echoes
Doppler Reflectivity with
Processed Second Trip Echoes

Analysis & Diagnosis 52Radar Palette Home Doppler
Long Range Z
Analysis & Diagnosis 53Radar Palette Home Doppler
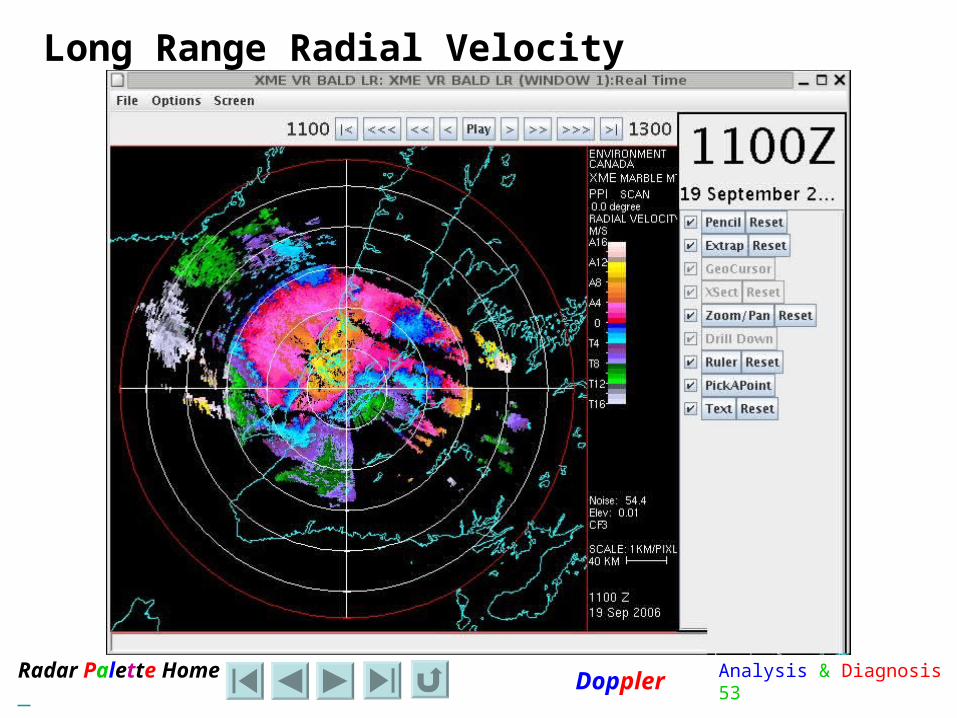
Long Range Radial Velocity

Analysis & Diagnosis 54Radar Palette Home Doppler
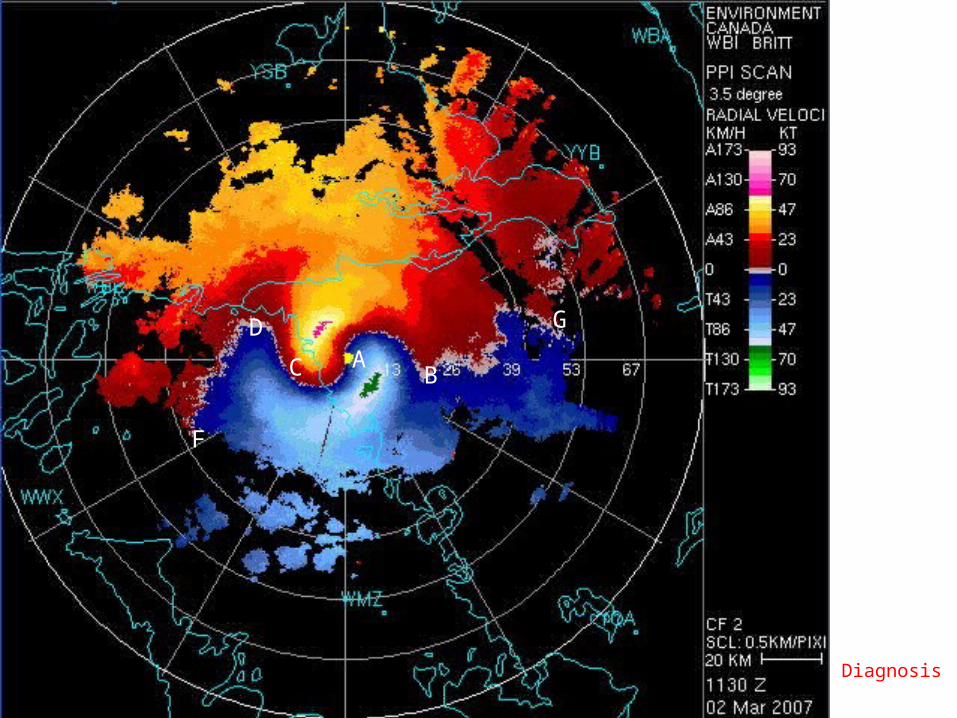
Doppler Wind Shifts
A
B
The angle of viewing is very important and determines whatone sees!

Analysis & Diagnosis 55Radar Palette Home Doppler
Operational Applications

Analysis & Diagnosis 56Radar Palette Home Doppler
Doppler Wind Shift

Analysis & Diagnosis 57Radar Palette Home Doppler
Doppler Wind Shift 30 minutes later
Cold Front

Analysis & Diagnosis 59Radar Palette Home Doppler
• Reflectivity Z is empirically related to rain rate R in the form :
Z = aRb
• In Canada we use Marshall-Palmer (stratiform rain) :
Z = 200RZ = 200R1.61.6
• U.S. NEXRAD :
Z = 300RZ = 300R1.4 1.4
• For snow we use :
Z = 1780SZ = 1780S2.212.21
Rain rate vs. Snow rate
But these are not valid in all situations
Analysis & Diagnosis 60Radar Palette Home Doppler
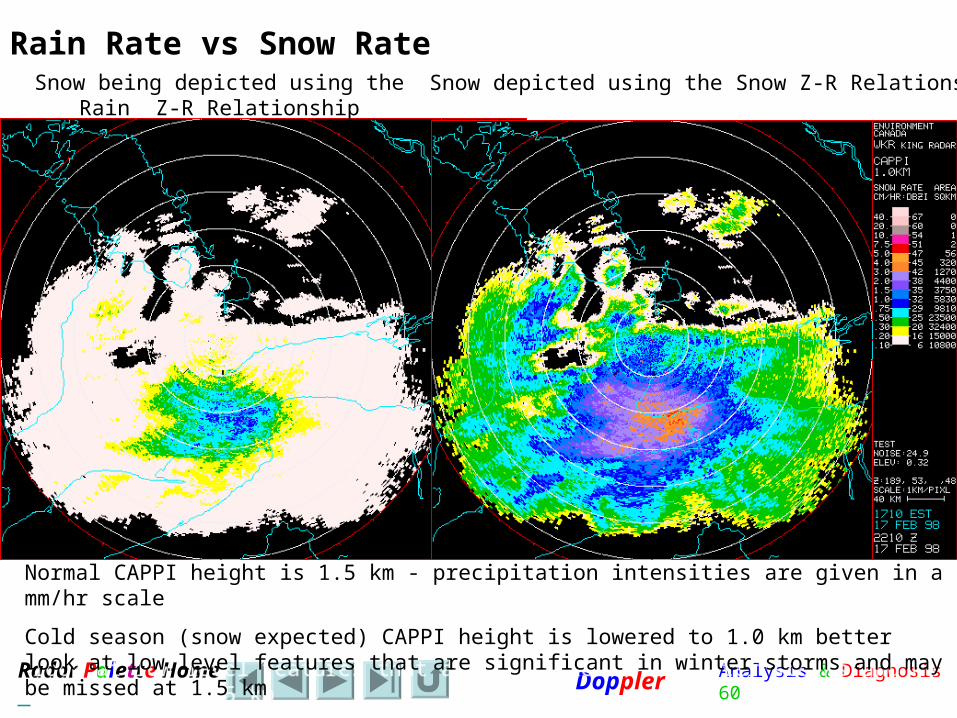
Rain Rate vs Snow RateSnow being depicted using the Rain Z-R
RelationshipSnow depicted using the Snow Z-R Relationship
Normal CAPPI height is 1.5 km - precipitation intensities are given in a mm/hr scale
Cold season (snow expected) CAPPI height is lowered to 1.0 km better look at low level features that are significant in winter storms and may be missed at 1.5 km
Normal CAPPI height is 1.5 km - precipitation intensities are given in a mm/hr scale
Cold season (snow expected) CAPPI height is lowered to 1.0 km better look at low level features that are significant in winter storms and may be missed at 1.5 km

Analysis & Diagnosis 61Radar Palette Home Doppler
Bird Migration and Radar

Analysis & Diagnosis 62Radar Palette Home Doppler
Radar Detection of a Lake Breeze

Analysis & Diagnosis 63Radar Palette Home Doppler
“Clear” Air Radar Returns

Analysis & Diagnosis 64Radar Palette Home Doppler
“Clear” Air Radar Returns and Lake Breeze

Analysis & Diagnosis 65Radar Palette Home Doppler
“Clear” Air Thunderstorm Outflow Gust

Analysis & Diagnosis 67Radar Palette Home Doppler
Severe Weather Signatures on Radar

Analysis & Diagnosis 68Radar Palette Home Doppler
The spikes signature is associated with hail or heavy rain. It results from the radar beam being reflected from the hail or rain in the thunderstorm, then reflecting from the surface then back to the thunderstorm and then back to the radar… a longer path...
Radar Observation of Hail
or
Very Heavy Precipitation

Analysis & Diagnosis 69Radar Palette Home Doppler
”Hail spikes" from the
Carvel Radar near Edmonton

Radar Palette Home Doppler
Hail Spikes & Side Lobe
MAXR Echo Top
Analysis & Diagnosis 71Radar Palette Home Doppler
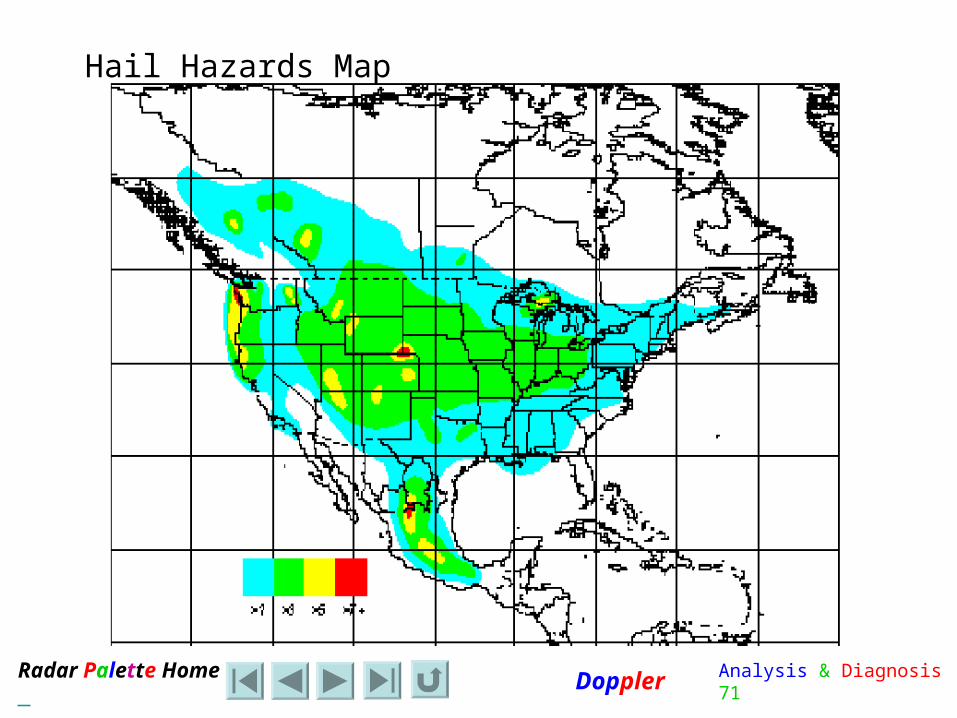
Hail Hazards Map

Analysis & Diagnosis 72Radar Palette Home Doppler

Analysis & Diagnosis 73Radar Palette Home Doppler
0.5 Doppler Velocity 1.5 Doppler Velocity
3.5 Doppler Velocity
1.3km 4km
11kmRotating Downbursts on Descent
Cyclonic rotationCyclonic rotationCyclonic rotationCyclonic rotation

Radar Palette Home Doppler

Radar Palette Home Doppler

Analysis & Diagnosis 76Radar Palette Home Doppler
A December Squall Line with Rear Inflow Jet
Analysis & Diagnosis 77Radar Palette Home Doppler
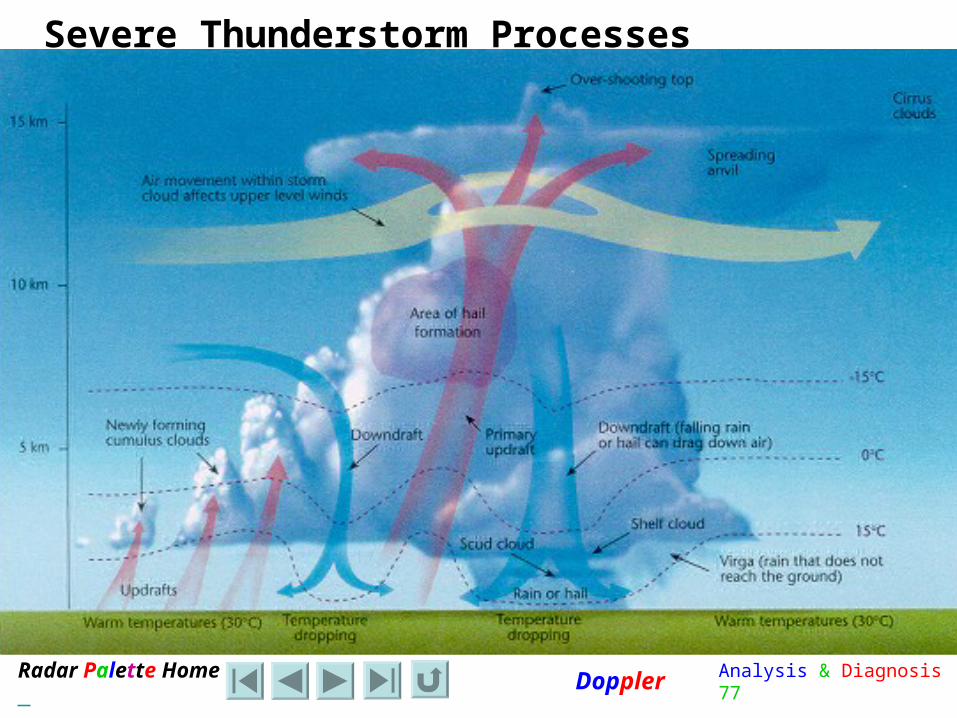
Severe Thunderstorm Processes

Analysis & Diagnosis 78Radar Palette Home Doppler
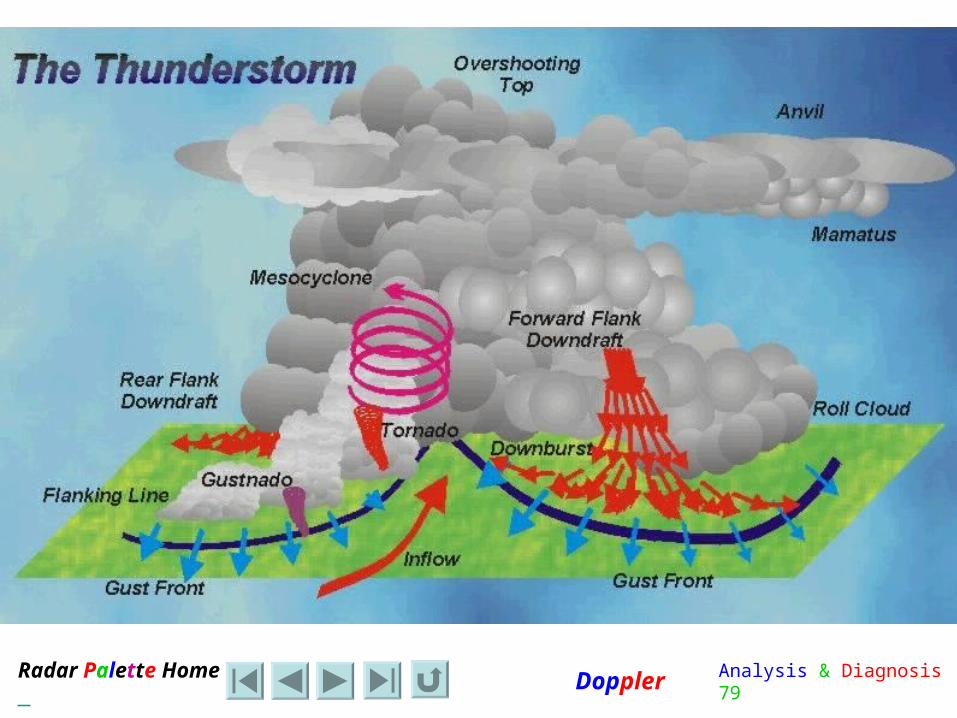
Analysis & Diagnosis 79Radar Palette Home Doppler
Analysis & Diagnosis 80Radar Palette Home Doppler
Mesocyclone on Reflectivity Display0.5 Degree PPI Reflectivity Display
0.5 Degree PPI Doppler Velocity
3.5 Degree PPI Doppler Velocity
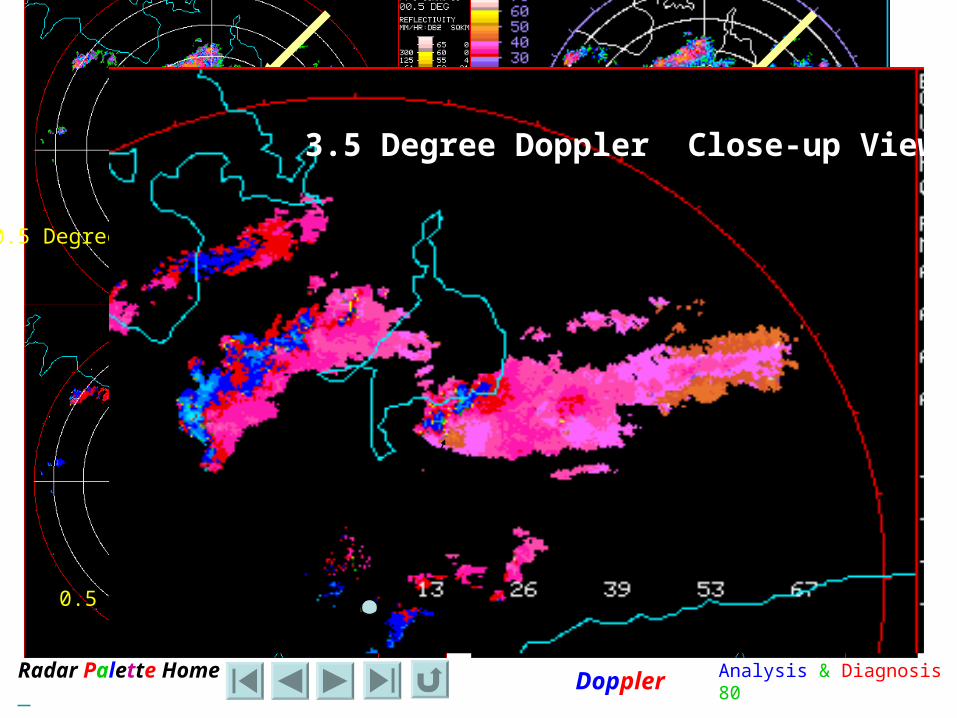
3.5 Degree Doppler Close-up View

Analysis & Diagnosis 81Radar Palette Home Doppler
0.5 and 3.5 Degree PPI Doppler

Analysis & Diagnosis 82Radar Palette Home Doppler
Doppler Analysis and Diagnosis Strategies
An operational guide to getting the most information from Doppler radar:
• Determining the actual wind direction• Determining wind backing and veering• Diagnosing spatial versus vertical wind
variations• The Screaming Eagle and Bird Patterns

Analysis & Diagnosis 83Radar Palette Home Doppler
Diagnosis of the Conveyor Belts
• Wind direction and speed diagnosis should be completed independently in each conveyor belt
• Given the nature of isentropic flow, this is a prudent mode of diagnosis. Isentropic flows stay relatively separate and maintain their distinctive properties.
• The Doppler characteristics depicted in the CCB are separate from those in the WCB. When added, instructive patterns are revealed.
Analysis & Diagnosis 84Radar Palette Home Doppler
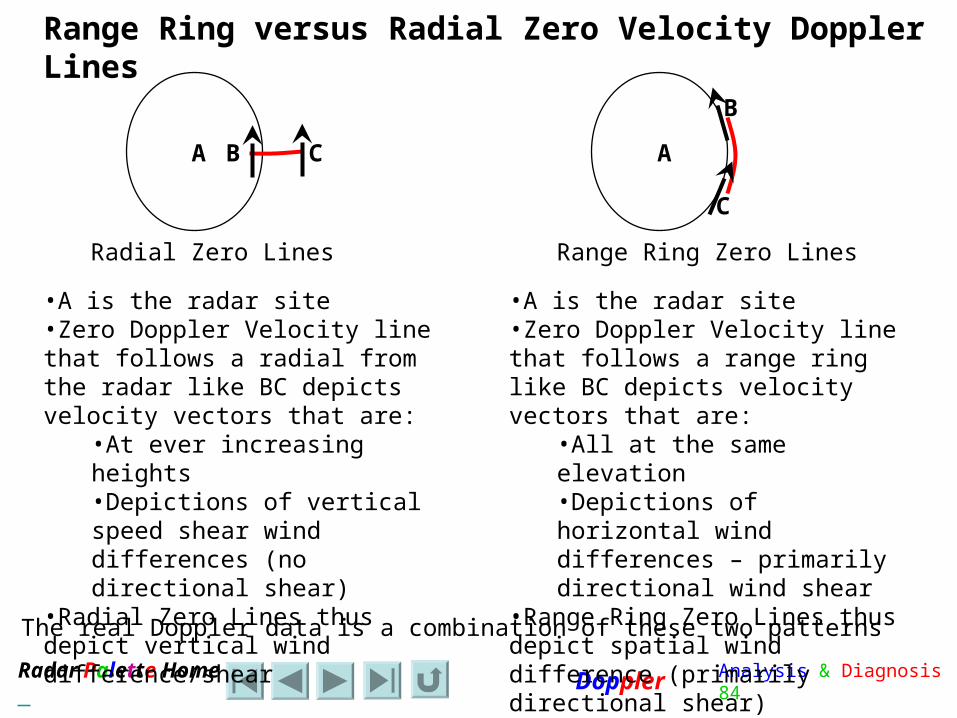
Range Ring versus Radial Zero Velocity Doppler Lines
A
B
C
Range Ring Zero Lines
•A is the radar site•Zero Doppler Velocity line that follows a range ring like BC depicts velocity vectors that are:
•All at the same elevation•Depictions of horizontal wind differences – primarily directional wind shear
•Range Ring Zero Lines thus depict spatial wind difference (primarily directional shear)
A B C
Radial Zero Lines
•A is the radar site•Zero Doppler Velocity line that follows a radial from the radar like BC depicts velocity vectors that are:
•At ever increasing heights•Depictions of vertical speed shear wind differences (no directional shear)
•Radial Zero Lines thus depict vertical wind difference/shear
The real Doppler data is a combination of these two patterns
Analysis & Diagnosis 85Radar Palette Home Doppler
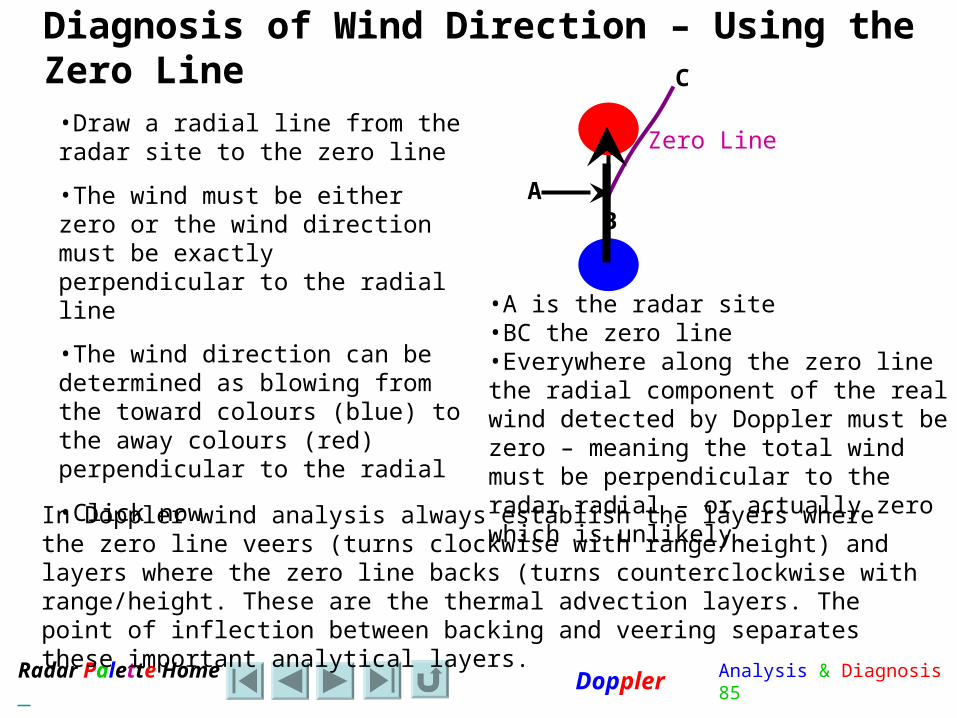
Diagnosis of Wind Direction – Using the Zero Line
A
•A is the radar site•BC the zero line•Everywhere along the zero line the radial component of the real wind detected by Doppler must be zero – meaning the total wind must be perpendicular to the radar radial – or actually zero which is unlikely.
B
C
•Draw a radial line from the radar site to the zero line
•The wind must be either zero or the wind direction must be exactly perpendicular to the radial line
•The wind direction can be determined as blowing from the toward colours (blue) to the away colours (red) perpendicular to the radial
•Click now
Zero Line
In Doppler wind analysis always establish the layers where the zero line veers (turns clockwise with range/height) and layers where the zero line backs (turns counterclockwise with range/height. These are the thermal advection layers. The point of inflection between backing and veering separates these important analytical layers.
Analysis & Diagnosis 86Radar Palette Home Doppler
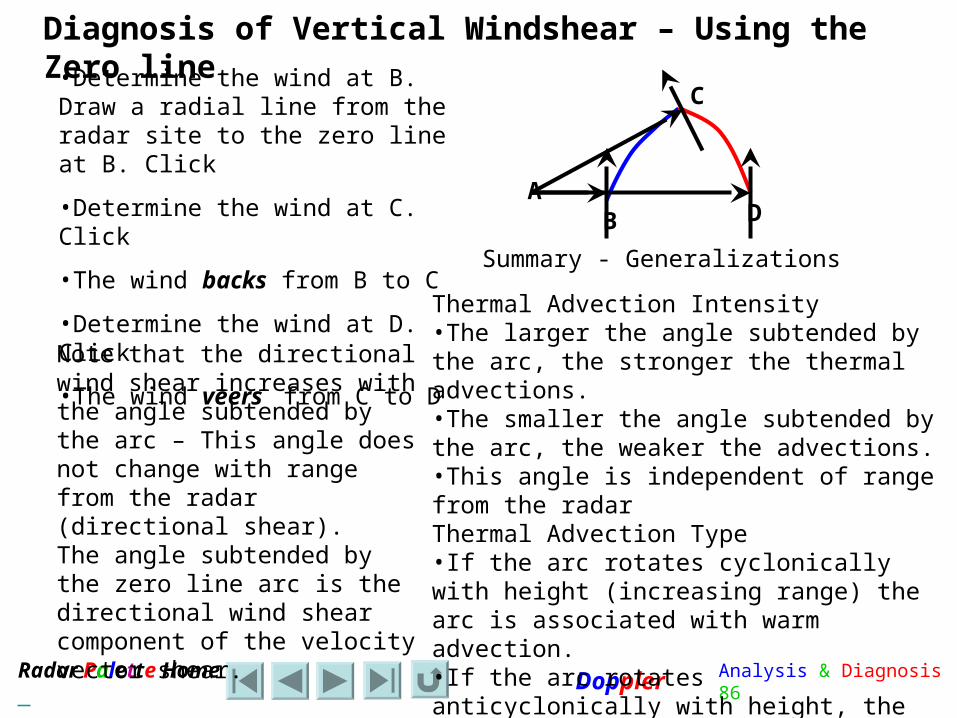
Diagnosis of Vertical Windshear – Using the Zero line
AB
C
D
•Determine the wind at B. Draw a radial line from the radar site to the zero line at B. Click
•Determine the wind at C. Click
•The wind backs from B to C
•Determine the wind at D. Click
•The wind veers from C to D
Summary - Generalizations
Thermal Advection Intensity•The larger the angle subtended by the arc, the stronger the thermal advections.•The smaller the angle subtended by the arc, the weaker the advections.•This angle is independent of range from the radarThermal Advection Type•If the arc rotates cyclonically with height (increasing range) the arc is associated with warm advection.•If the arc rotates anticyclonically with height, the arc is associated with cold advection.
Note that the directional wind shear increases with the angle subtended by the arc – This angle does not change with range from the radar (directional shear).The angle subtended by the zero line arc is the directional wind shear component of the velocity vector shear.

Analysis & Diagnosis 87Radar Palette Home Doppler
Diagnosis of Vertical Windshear – Using the Zero line
AB
C
D
The angle subtended by the counter-clockwise arc BC would be the same regardless of the exact location of C anywhere along the radial AC from the Doppler radar. The amount of backing with height is also independent of the location of C along the radial AC. The amount of wind shear (cold advection) is dependent only on the subtended angle and not the orientation of the arc.
AB
C
D
The angle subtended by the clockwise arc CD would be the same regardless of the exact location of D anywhere along the radial AD from the Doppler radar. The amount of veering with height is also independent of the location of D along the radial AD. The amount of wind shear (warm advection) is dependent only on the subtended angle and not the orientation of the arc. The thermal VWS is thus the angle subtended by the arc divided by the elevation change that this thermal advection occurred over. The following slide illustrates these concepts.

Analysis & Diagnosis 88Radar Palette Home Doppler
Thermal Advections and Vertical Wind Shear
AB
C
AB
C
AB
C
•The angle subtended by the counter-clockwise arc BC is identical in 1, 2 and 3.•In 1, the backing winds occur over a short radial range and thus a short height interval.•The radial range difference increases for case 2 and is even more for case 3. The height interval for the Thermal VWS increases with the length of the radial AC from case 1 to case 3.•The Thermal VWS determined by dividing the direction shear (subtended angle dependent) by the height interval (difference between AC and AB=AD) that it occurs over, is strongest for 1 and weakest for 3. •As detailed, Thermal VWS is a combination of the size of the subtended angle and the radial range (AC-AB=AD) which when combined, is inversely proportional to the area CBD. •This could feasibly be automatically calculated in URP. I sincerely doubt if it is.
1.
2.
3.
D
D
D

Analysis & Diagnosis 89Radar Palette Home Doppler
Thermal Advections and Vertical Wind Shear
•Which has the strongest Thermal VWS?•The smaller the area CBD, the more intense the Thermal VWS and thus the more intense the thermal advections.
AB
C
1.
D
AB
C
2.
D
AB
C
3.
D
For a given subtended angle:•the strongest Thermal VWS occurs with a Doppler Zero Line closely following the range rings•the weakest Thermal VWS occurs with a Doppler Zero Line closely following the radar radial lines
Similarly for a given height interval CD radial:•the strongest Thermal VWS occurs with the largest subtended angle•the weakest Thermal VWS occurs with the smallest subtended angle

Analysis & Diagnosis 90Radar Palette Home Doppler
Diagnosis of Stability Trends
• Stability increases with:• Cold advection decreasing with height:
– Angle of Doppler arc backing counterclockwise decreasing (rate of cooling decreases) with height (range) increasing (Area CBD increasing),
• Warm advection increasing with height:– Angle of Doppler arc veering clockwise increasing
(rate of warming increases) with height (range) decreasing (Area CBD decreasing),
• Warm advection over cold advection:– Doppler arc veering clockwise with height (range)
over Doppler arc backing counterclockwise with height (range).

Analysis & Diagnosis 91Radar Palette Home Doppler
Doppler Examples for Increasing Stability
AB
C1.
D
Stronger cold advection BCLevel C
Weaker cold advection CDStabilization
Level D
Level B
A
B C
2. D
Weaker warm advection BCLevel C
Stronger warm advection CDStabilization
Level D
Level B
AB
C
3. D
(Weak) Cold advection BCLevel C
(Strong) Warm advection CDStabilization
Level D
Level B
Note: Angles kept constant.Changing the Thermal Advection Intensity by changing the depth of the directional wind shear.

Analysis & Diagnosis 92Radar Palette Home Doppler
Diagnosis of Stability Trends
• Stability decreases (Destabilization) with:• Cold advection increasing with height:
– Angle of Doppler arc backing counterclockwise decreasing (rate of cooling increases) with height (range)
• Warm advection decreasing with height:– Doppler arc veering clockwise with height (range)
under Doppler arc backing counterclockwise with height (range).
– Angle of of Doppler zero arc veering clockwise increasing (rate of warming decreases) with height (range),
• Warm advection under cold advection:

Analysis & Diagnosis 93Radar Palette Home Doppler
Doppler Examples for Increasing Instability
AB
C2.
D
Stronger warm advection BCLevel C
Weaker warm advection BCDestabilization
Level D
Level B
A
B C
3.
D
(Strong) Warm advection BCLevel C
(Weak) Cold advection CDDestabilization
Level D
Level BNote: Angles kept constant.Changing the Thermal Advection Intensity by changing the depth of the directional wind shear.
AB
C
1.
D
Weaker cold advection BCLevel C
Stronger cold advection CDDestabilization
Level D
Level B

Analysis & Diagnosis 94Radar Palette Home Doppler
Changing Stability by Changing the Angle of the Vertical Wind Shear
• As the angle subtended by the zero line increases, the amount of directional wind shear also increases.
• The directional wind shear must be divided by the height over which this shear occurs in able to determine the magnitude of the thermal advections.
• Generally, as the angle increases, so does the thermal advections. The angle of the zero line relative to the range rings is essential to use this technique in an operational setting.

Analysis & Diagnosis 95Radar Palette Home Doppler
Doppler Examples for Increasing Stability
Note: VWS Depth kept constant. Changing the Thermal Advection Intensity by changing the subtended angle (amount) of the directional wind shear. Increasing the angle, decreases the enclosed area.
AB
C
1.
D
Stronger cold advection BCLevel C
Weaker cold advection CDStabilization
Level D
Level B
A
B C
2.
D
Weaker warm advection BCLevel C
Stronger warm advection CDStabilization
Level D
Level B
o o
Cold AdvectionDecreasing with Height
Stabilization
Warm AdvectionIncreasing with Height
StabilizationThe angles that the zero line makes with the range rings is the operational approach to employ.
CAA angle increasing with range/height.
WAA angle decreasing with range/height.
Analysis & Diagnosis 96Radar Palette Home Doppler
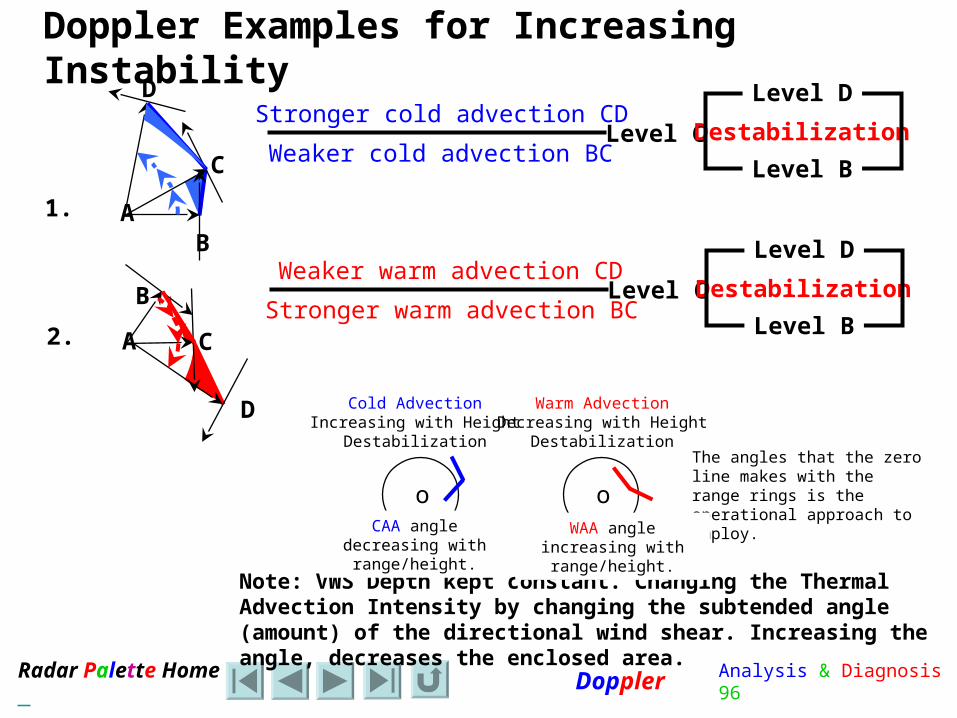
Doppler Examples for Increasing Instability
AB
C
1.
D
Note: VWS Depth kept constant. Changing the Thermal Advection Intensity by changing the subtended angle (amount) of the directional wind shear. Increasing the angle, decreases the enclosed area.
Weaker cold advection BCLevel C
Stronger cold advection CDDestabilization
Level D
Level B
A
B
C2.
D
Stronger warm advection BCLevel C
Weaker warm advection CDDestabilization
Level D
Level B
o o
Cold AdvectionIncreasing with Height
Destabilization
Warm AdvectionDecreasing with Height
DestabilizationThe angles that the zero line makes with the range rings is the operational approach to employ.
CAA angle decreasing with range/height.
WAA angle increasing with range/height.
Analysis & Diagnosis 97Radar Palette Home Doppler
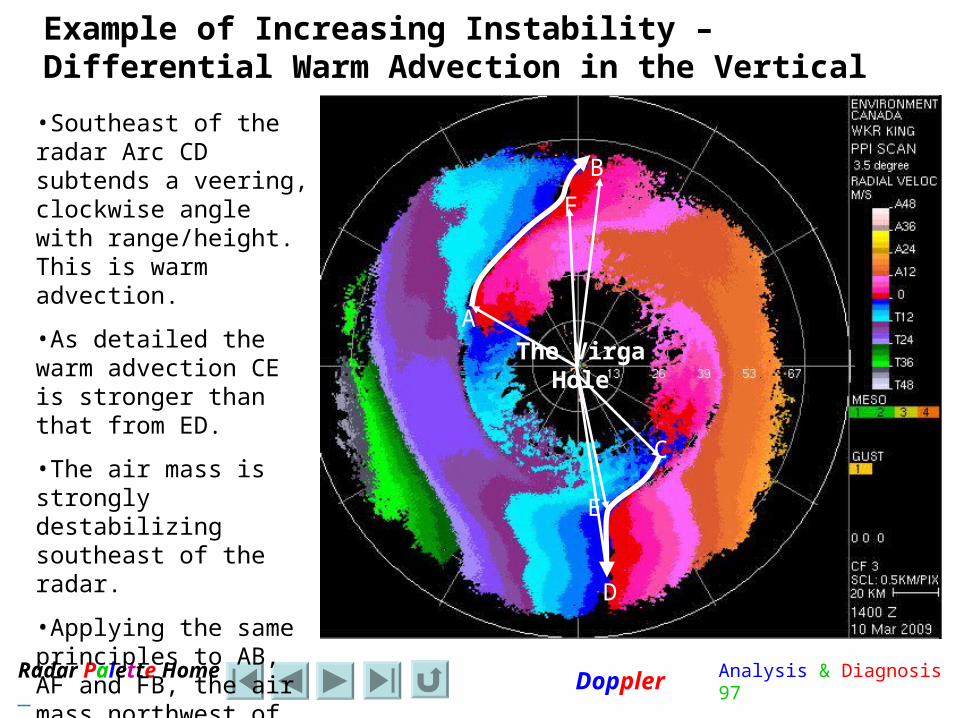
Example of Increasing Instability – Differential Warm Advection in the Vertical
A
B
The VirgaHole
C
D
E
F
•Southeast of the radar Arc CD subtends a veering, clockwise angle with range/height. This is warm advection.
•As detailed the warm advection CE is stronger than that from ED.
•The air mass is strongly destabilizing southeast of the radar.
•Applying the same principles to AB, AF and FB, the air mass northwest of the radar is also destabilizing but not as much.

Analysis & Diagnosis 98Radar Palette Home Doppler
• Consider the angle between the veering or backing arc and the radar range ring.
• If this angle increases (in time) from previous values then the rate of wind shear with height is decreasing, since height is a function of radial range. This must imply that for a given arc, the thermal advections have decreased.
• If this angle decreases (in space) along the arc then the rate of wind shear with height is increasing, since height is a function of radial range. This must imply that for a given arc, the thermal advections have increased.
• Track the angle the arc makes with the radar rings with both time (between scans) and in space along the trace of the arc… if the angle increases, then the associated thermal advections are decreasing.
Doppler Rate of Thermal Advections with Height
o

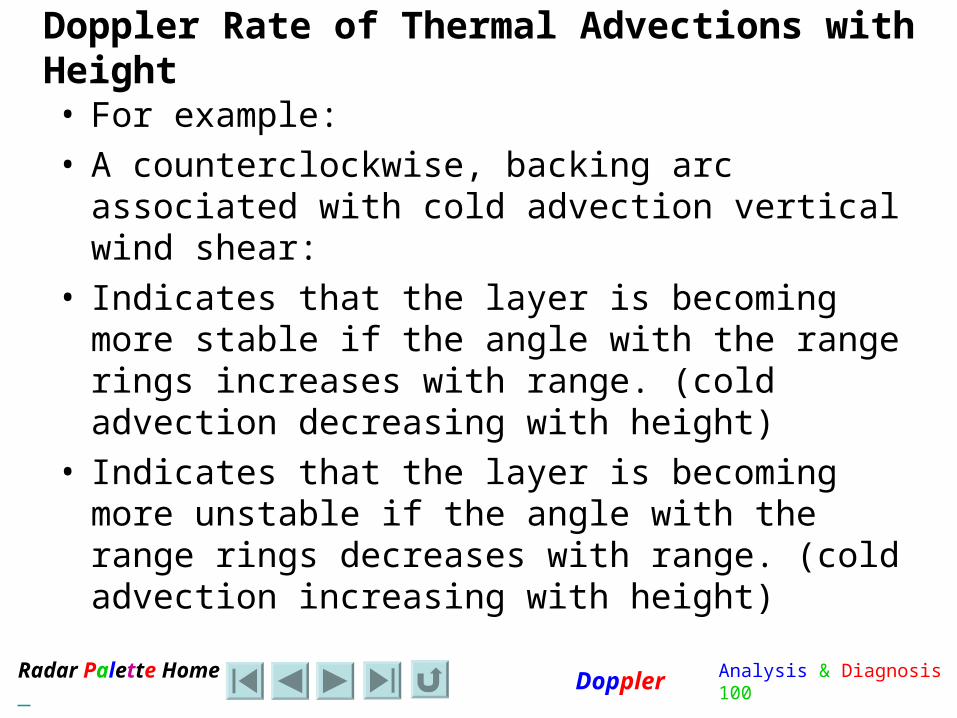
Analysis & Diagnosis 99Radar Palette Home Doppler
Doppler Rate of Thermal Advections with Height
• For example:• A clockwise, veering arc associated with warm
advection vertical wind shear:• Indicates that the layer is becoming more stable
if the angle with the range rings decreases with range. (warm advection increasing with height)
• Indicates that the layer is becoming more unstable if the angle with the range rings increases with range. (warm advection decreasing with height)
Analysis & Diagnosis 100Radar Palette Home Doppler
Doppler Rate of Thermal Advections with Height
• For example:• A counterclockwise, backing arc associated with
cold advection vertical wind shear:• Indicates that the layer is becoming more stable
if the angle with the range rings increases with range. (cold advection decreasing with height)
• Indicates that the layer is becoming more unstable if the angle with the range rings decreases with range. (cold advection increasing with height)

Analysis & Diagnosis 101Radar Palette Home Doppler
The Doppler Twist Signature

Analysis & Diagnosis 102Radar Palette Home Doppler
The Doppler Twist Signature - Example
A
B
The VirgaHole
Veerin
g Lid
Twist
Sign
atur
e
C
D
E
F
•The white vectors match the colours from below the mixing level to above the mixing level.
•The direction of rotation indicates the type of thermal advection associated with the Doppler Twist.
•The length of the vectors indicate the magnitude of the thermal advection.
•This is also an example of the Virga Hole Signature

Analysis & Diagnosis 103Radar Palette Home Doppler
Conveyor Belt Conceptual Models
This information is repeated in links within the Conveyor Belt Conceptual
Model
Analysis & Diagnosis 104Radar Palette Home Doppler
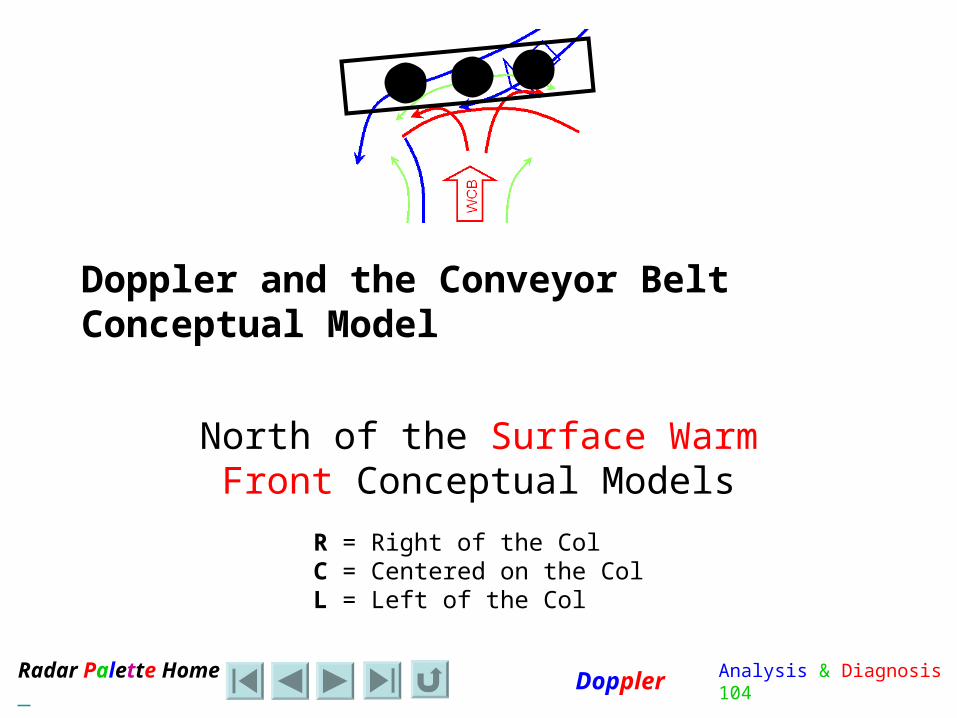
Doppler and the Conveyor Belt Conceptual Model
North of the Surface Warm Front Conceptual Models
RCL
R = Right of the ColC = Centered on the ColL = Left of the Col

Analysis & Diagnosis 105Radar Palette Home Doppler
Vertical Deformation Zone Distribution and the CBMSimplified Summary
C
C
WC
B
DCB
CCB
DCB
C
The WCB overrides the warm frontThe CCB undercuts the warm frontThe frontal surface overlies the mixing layerWind shear in the CCB is variable
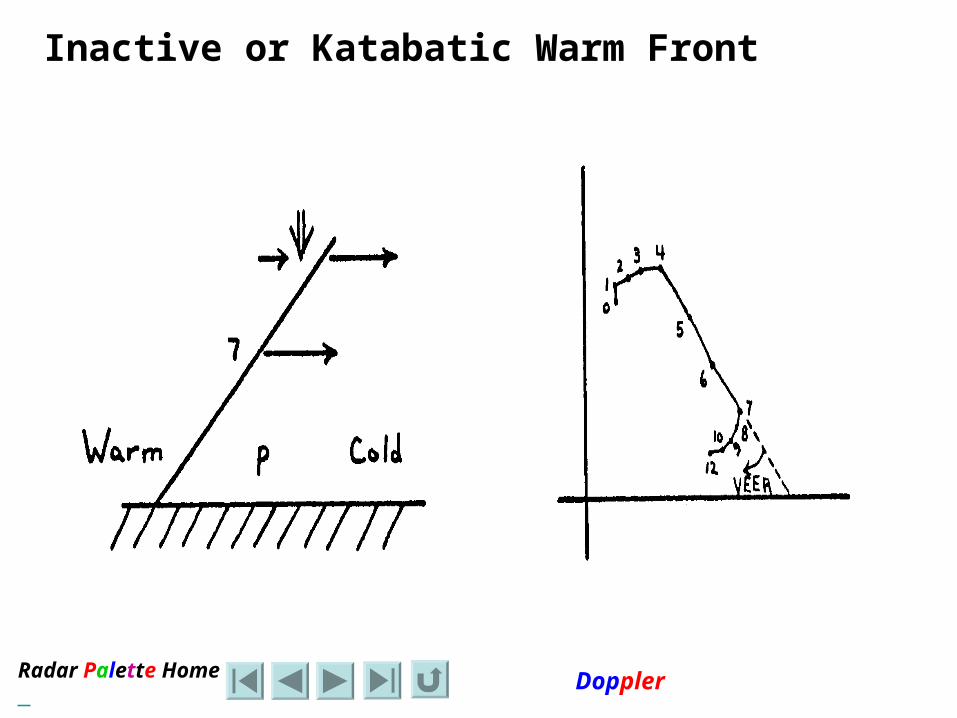
Looking along the WCB flow:•In WCB to the right of the Col expect veering winds with height – Katabatic warm front•In WCB approach to the Col expect maximum divergence – the eagle pattern with ascent and increasing pcpn•In WCB to the left of the Col expect backing winds with height – Anabatic warm front

Analysis & Diagnosis 106Radar Palette Home Doppler
CCB Doppler Diagnosis – CCB Conceptual Models
A
B
C
The Beaked Eagle
•A is the radar site•AB is backing with height indicative of cold advection where really there should be veering as a result of the Ekman Spiral•BC is veering with height indicative of warm advection•B is the front with the mixing layer hidden in the cold advection•This is a strong cold advection•The warm front will be slow moving or stationary
A
B
C
The Headless Eagle
•A is the radar site•ABC is all veering with height indicative of warm advection. Layer AB is apt to be partially the result of the Ekman Spiral•BC is veering with height indicative of warm advection•Where is the front and the mixing layer?•The cold advection is not apparent and the warm front will advance
The CCB Conceptual Model is independent of that in the WCB. Like Mr. Potato Head, one can mix and match conceptual models in the distinctly different conveyor belts.
Analysis & Diagnosis 107Radar Palette Home Doppler
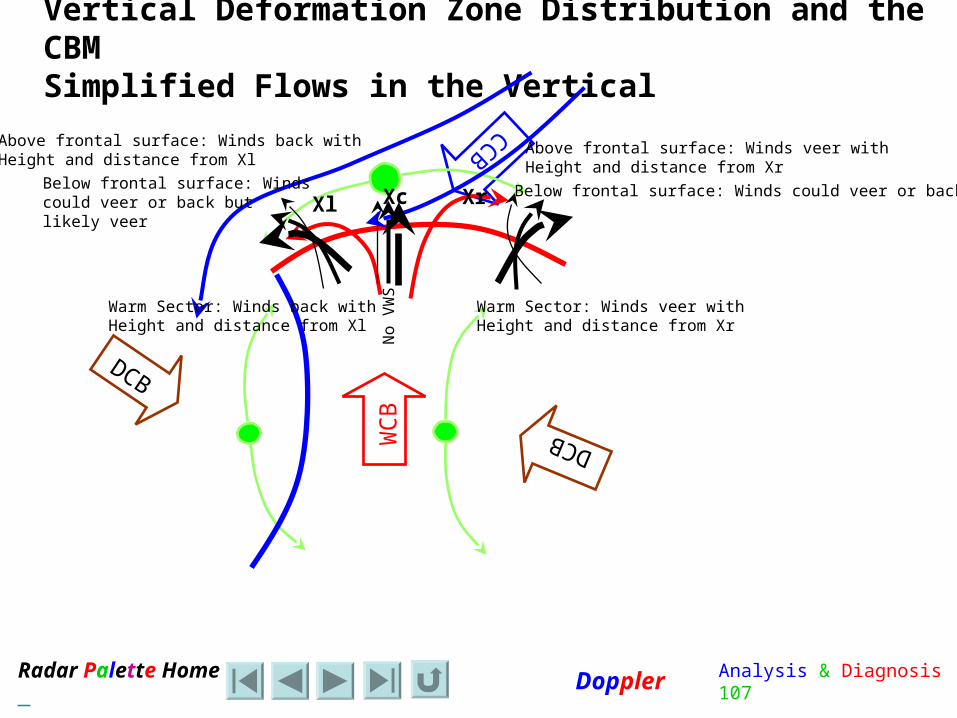
Vertical Deformation Zone Distribution and the CBMSimplified Flows in the Vertical
C
C
WC
B
DCB
CCB
DCB
CXrXcXl
Warm Sector: Winds veer withHeight and distance from Xr
Above frontal surface: Winds veer withHeight and distance from Xr
Below frontal surface: Winds could veer or back
Warm Sector: Winds back withHeight and distance from Xl
Above frontal surface: Winds back withHeight and distance from Xl
Below frontal surface: Winds could veer or back but likely veer
No
VW
S

Analysis & Diagnosis 108Radar Palette Home Doppler
WCB to the Right of the Col
o
C
Warm frontal surface
Mixing layer
Cold CB
Warm CB
Within the WCB:•East of radar veering, warm advection•West of radar nil VWS
Within the CCB:•Probable Ekman spiral nearest surface•Probable cold advection above Ekman spiral
The Warm Right Wing Stoop CM
The eagles right wing is folded in as if it is about to swoop down.The left wing is still fully extended to catch the lift of the WCB.
Right W
ingLe
ft W
ing
Signature ofWarm Frontal surfaceWarm
advection
Radar Palette Home Doppler
Inactive or Katabatic Warm Front

Analysis & Diagnosis 110Radar Palette Home Doppler
WCB Approaching the Col
o
C
Warm frontal surface
Mixing layer
Cold CB
Warm CB
Within the WCB:•East of radar veering, warm advection – katabatic warm front.•West of radar backing, cold advection – anabatic warm front.
Within the CCB:•Probable Ekman spiral nearest surface•Probable cold advection above Ekman spiral
The Warm Screaming Eagle CM
Both wings are fully extended to catch the lift of the WCB. This is a divergent signature.
Right W
ingLe
ft W
ing
Signature ofWarm Frontal surface
discontinuity

Analysis & Diagnosis 111Radar Palette Home Doppler
BCAD
E
F
G
H
Need to emphasizeThe PPI nature of theDoppler scan- The cone
The Warm Screaming Eagle Conceptual Model

Radar Palette Home Doppler
Inactive or Katabatic Warm Front
Active or Anabatic Warm FrontApproaching the Col the Warm Front should have characteristics intermediate between the Anabatic Warm Front to the Left of the Col and the Katabatic Warm Front to the Right of the Col

Analysis & Diagnosis 113Radar Palette Home Doppler
WCB to the Left of the Col
C
Warm frontal surface
Mixing layer
Cold CB
Warm CB
Within the WCB:•West of radar backing, cold advection•East of radar nil VWS
Within the CCB:•Probable Ekman spiral nearest surface•Probable cold advection above Ekman spiral
o
The Warm Left Wing Stoop CM
The eagles left wing is folded in as if it is about to swoop down.The right wing is still fully extended to catch the lift of the WCB.
Right Wing
Le
ft W
ing
Signature ofWarm Frontal surfaceWarm
advection
Signature ofWarm Frontal surface… odd?
Analysis & Diagnosis 114Radar Palette Home Doppler
ABC
D
F
G
Analysis & Diagnosis 115Radar Palette Home Doppler
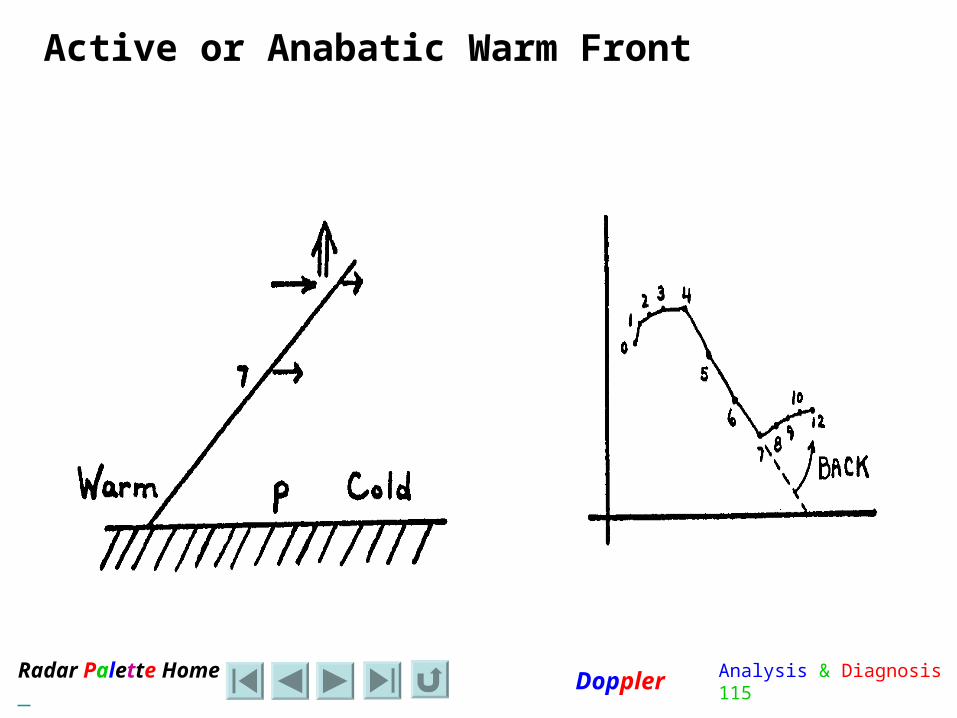
Active or Anabatic Warm Front

Analysis & Diagnosis 116Radar Palette Home Doppler
WCB Doppler Diagnosis – Diagnosis of the Eagle Wing
A
The Right Eagle Wing
•A is the radar site•BC is backing with height indicative of cold advection. •CD is veering with height indicative of warm advection•Larger angles subtended by the arcs BC and CD by the radar site A, are associated with strong thermal advections•A broad wing in the eagle is associated with strong advections
B
C
D B
C
D
A
The Left Eagle Wing
•A is the radar site•BC is veering with height indicative of warm advection. •CD is backing with height indicative of cold advection•Larger angles subtended by the arcs BC and CD by the radar site A, are associated with strong thermal advections•A broad wing in the eagle is associated with strong advections

Analysis & Diagnosis 117Radar Palette Home Doppler
WCB Doppler Diagnosis – Diagnosis on the Gull Wing
A
The Right Eagle Wing
•A is the radar site•BC is backing with height indicative of cold advection. •CD is veering with height indicative of warm advection•Larger angles subtended by the arcs BC and CD by the radar site A, are associated with strong thermal advections•A narrow wing in the gull is associated with weak advections
B
CD B
C
DA
The Left Eagle Wing
•A is the radar site•BC is veering with height indicative of warm advection. •CD is backing with height indicative of cold advection•Larger angles subtended by the arcs BC and CD by the radar site A, are associated with strong thermal advections•A narrow wing in the gull is associated with weak advections
The Gull Conceptual Model - weaker thermal advections
Analysis & Diagnosis 118Radar Palette Home Doppler
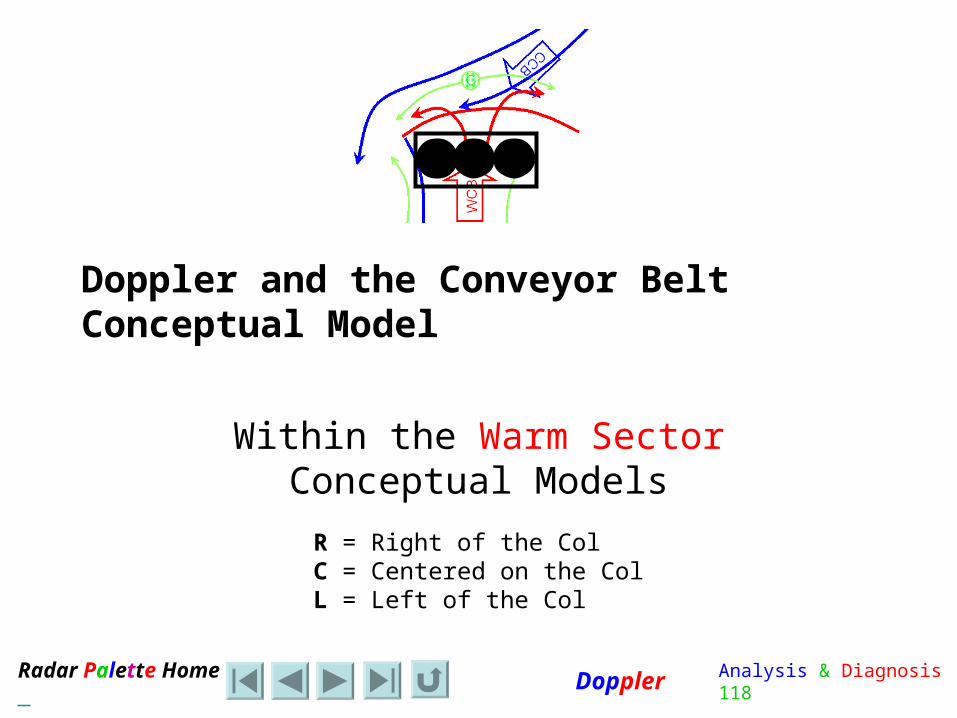
Doppler and the Conveyor Belt Conceptual Model
Within the Warm Sector Conceptual Models
RCL
R = Right of the ColC = Centered on the ColL = Left of the Col

Analysis & Diagnosis 119Radar Palette Home Doppler
Radar Data and the Warm Sector Portion of the Warm Conveyor Belt
• Precipitation returns will be limited in extent if they exist at all
• Radar data will be largely unavailable and unreliable
• This results in a very incomplete display of the Doppler wind field in particular
Analysis & Diagnosis 120Radar Palette Home Doppler
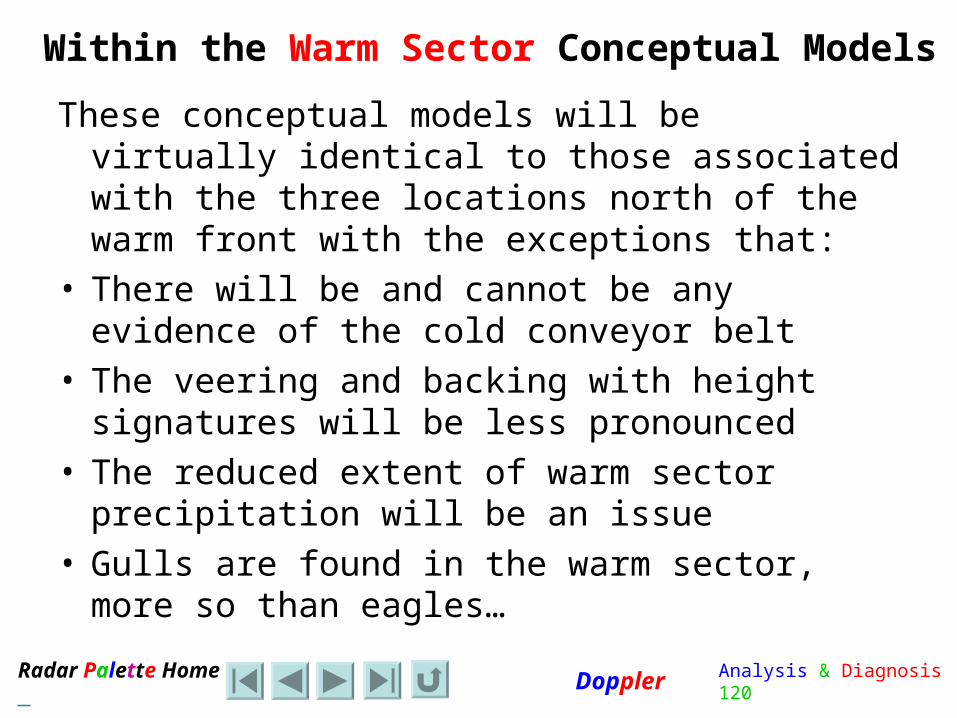
Within the Warm Sector Conceptual Models
These conceptual models will be virtually identical to those associated with the three locations north of the warm front with the exceptions that:
• There will be and cannot be any evidence of the cold conveyor belt
• The veering and backing with height signatures will be less pronounced
• The reduced extent of warm sector precipitation will be an issue
• Gulls are found in the warm sector, more so than eagles…
Analysis & Diagnosis 121Radar Palette Home Doppler
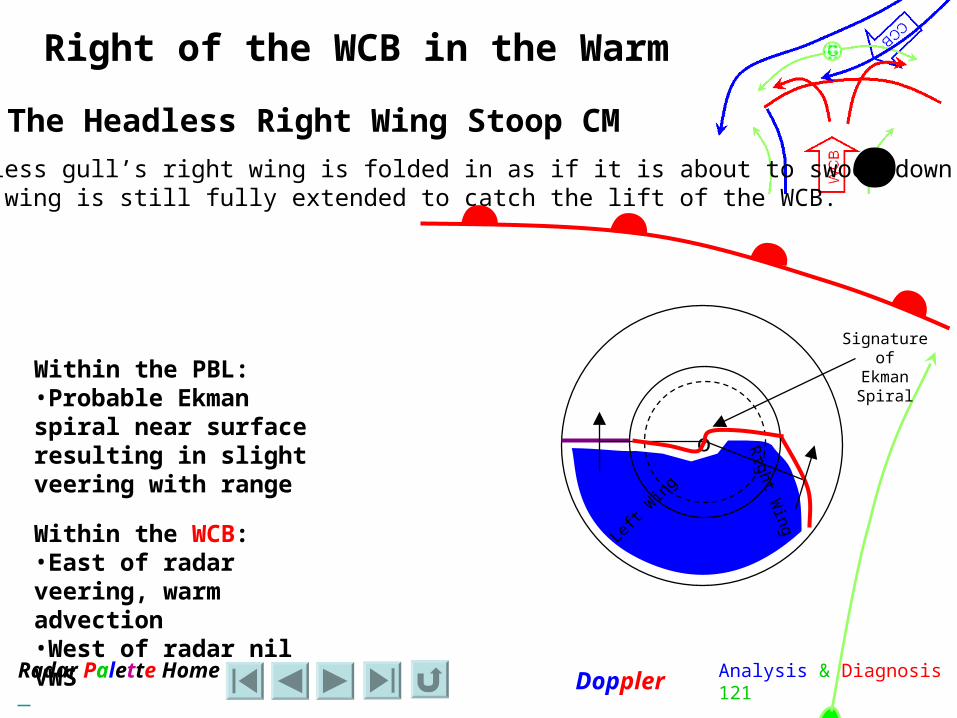
Right of the WCB in the Warm Sector
o
C
Within the WCB:•East of radar veering, warm advection•West of radar nil VWS
Within the PBL:•Probable Ekman spiral near surface resulting in slight veering with range
The Headless Right Wing Stoop CM
The headless gull’s right wing is folded in as if it is about to swoop down.The left wing is still fully extended to catch the lift of the WCB.
Right W
ing
Left
Wing
Signature ofEkman Spiral
Analysis & Diagnosis 122Radar Palette Home Doppler
The Headless Right Wing Stoop CMThis slide is reserved for an actual radar example.
o Right W
ing
Left
Wing

Analysis & Diagnosis 123Radar Palette Home Doppler
Within the WCB:•East of radar veering, weak warm advection – veering winds possible•West of radar backing, cold advection – backing winds possible
Under the WCB in the Warm Sector
o
Within the PBL:•Probable Ekman spiral near surface resulting in slight veering with range
The Headless Gull CM
Both wings are fully extended to catch the lift of the WCB. This is a straight line uniform wind field but could be a slightly divergent signature.
Right WingLeft Wing
Note that headless gulls can’t scream…The advections in the warm sector do not warrant this being called an eagle pattern.

Analysis & Diagnosis 124Radar Palette Home Doppler
The Headless Gull CMThe southwesterly WCB is essentially a straight flow but there are hints of the upper level divergence depicted in the conceptual model. o Right WingLeft W
ing

Analysis & Diagnosis 125Radar Palette Home Doppler
Left of the WCB in the Warm Sector
Within the WCB:•West of radar backing, cold advection•East of radar nil VWS
Within the PBL:•Probable Ekman spiral near surface resulting in slight veering with range o
The Headless Left Wing Stoop CM
The headless gull’s left wing is folded in as if it is about to swoop down.The right wing is still fully extended to catch the lift of the WCB.
Right Wing
Left
Win
g
C
Analysis & Diagnosis 126Radar Palette Home Doppler
The Headless Left Wing Stoop CMThis slide is reserved for an actual radar example. o
Right Wing
Left
Win
g

Analysis & Diagnosis 127Radar Palette Home Doppler
Doppler and the Conveyor Belt Conceptual Model
Behind the Cold Front Conceptual Models
RC
LR = Right of the ColC = Centered on the ColL = Left of the Col
Analysis & Diagnosis 128Radar Palette Home Doppler
Radar Data and the Cold Front
• Precipitation returns will be limited in extent• Precipitation will tend to be very cellular • This results in an incomplete display of the
Doppler wind field in particular
Analysis & Diagnosis 129Radar Palette Home Doppler
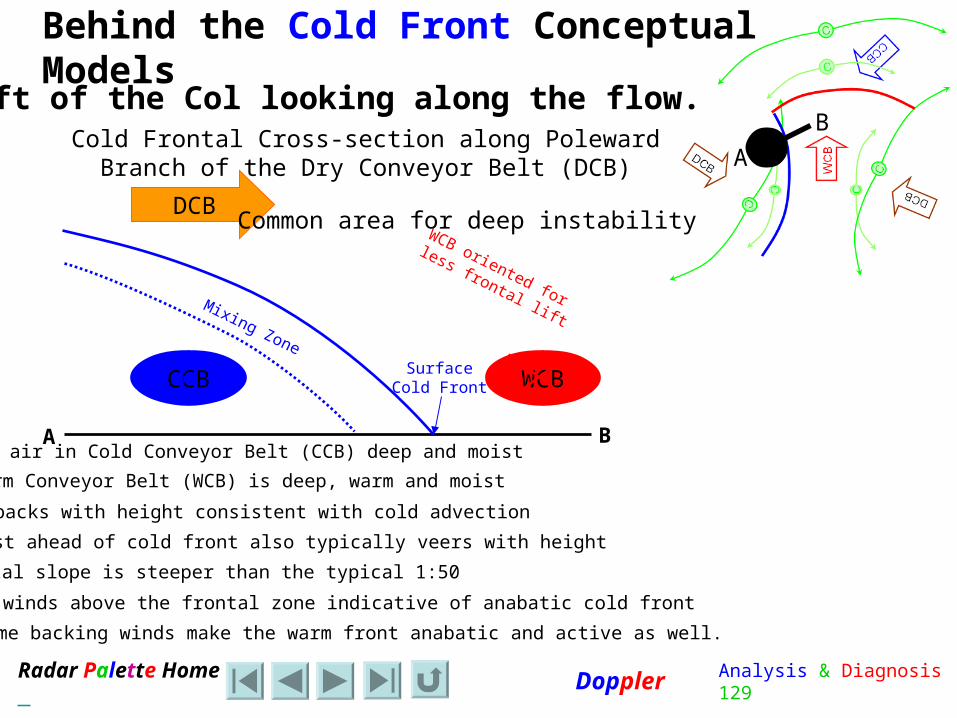
DCB
Cold Frontal Cross-section along Poleward Branch of the Dry Conveyor Belt (DCB)
Cold air in Cold Conveyor Belt (CCB) deep and moist
Warm Conveyor Belt (WCB) is deep, warm and moist
CCB backs with height consistent with cold advection
Mixing Zone
SurfaceCold Front
Frontal slope is steeper than the typical 1:50
WCB oriented for
less frontal lift
Common area for deep instability
A
B
A B
WCB just ahead of cold front also typically veers with height
WCBCCB
Backing winds above the frontal zone indicative of anabatic cold front
Behind the Cold Front Conceptual ModelsLeft of the Col looking along the flow.
The same backing winds make the warm front anabatic and active as well.

Analysis & Diagnosis 130Radar Palette Home Doppler
DCB to the Left of the ColC
Cold frontal surface
Mixing layer
Dry CB
Within the DCB:•West of radar backing, cold advection, Anabatic cold front•East of radar nil VWS or possibly weaker backing
Within the CCB – Cold Advection:•Cold advection probably overpowers the Ekman spiral signature
The Cold Left Wing Climb CM
The eagles left wing is folded backward having just caught more air for a climb.This portion of the DCB in the dry slot is typically ascending.The right wing is still fully extended to catch the lift of the WCB.
oRight Wing
Left
Win
g
The steeper frontal slope of the cold front will be very evident. Notice that the frontal area outlined is an oval skewed to the cold side of the front.

Analysis & Diagnosis 131Radar Palette Home Doppler
The Cold Left Wing Climb CMThis cold front is oriented NE-SW.
Right Wing
Left
Win
g o

Analysis & Diagnosis 132Radar Palette Home Doppler
Cross Section of Active Cold Front

Analysis & Diagnosis 133Radar Palette Home Doppler
Active or Anabatic Cold front

Analysis & Diagnosis 134Radar Palette Home Doppler
DCB
Cold Frontal Cross-section along Poleward Branch of the Dry Conveyor Belt (DCB)
Cold air in Cold Conveyor Belt (CCB) becoming less deep and less moist compared to the left of the flow
Warm Conveyor Belt (WCB) is still probably deep, warm and moist
CCB nearly a straight flow with weakening cold advection
Mixing Zone
SurfaceCold Front
Frontal slope is near the typical 1:50
WCB oriented for
less frontal lift
Common area for deep instability
A
B
A B
WCB just ahead of cold front also typically veers with height
WCBCCB
Winds nearly straight above the frontal zone indicative of a cold front which is neither anabatic or katabatic
Behind the Cold Front Conceptual ModelsCentered on the Col looking along the flow.

Analysis & Diagnosis 135Radar Palette Home Doppler
DCB Centred on the ColC
Cold frontal surface
Mixing layer
Dry CB
Within the DCB:•Nil VWS
Within the CCB – Cold Advection:•Cold advection probably overpowers the Ekman spiral signature
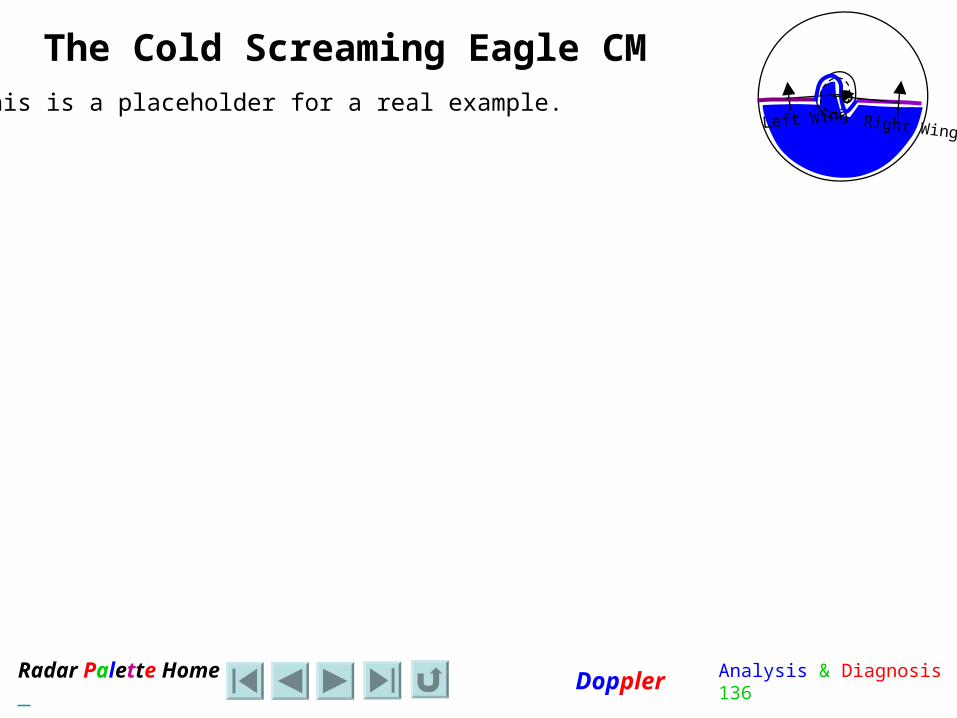
The Cold Screaming Eagle CM
Both of the eagle’s wings are fully extended.
oRight WingLeft Wing
The steeper frontal slope of the cold front will be very evident. Notice that the frontal area outlined is an oval skewed to the cold side of the front.
A B
Analysis & Diagnosis 136Radar Palette Home Doppler
The Cold Screaming Eagle CMThis is a placeholder for a real example. o
Right WingLeft Wing
Analysis & Diagnosis 137Radar Palette Home Doppler
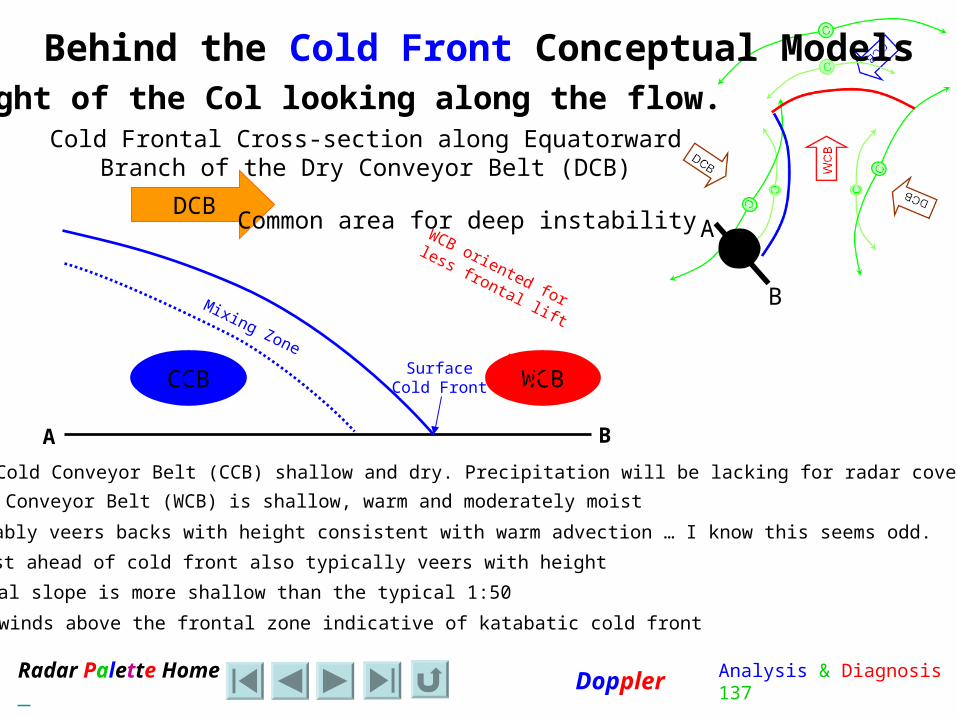
DCB
Cold Frontal Cross-section along Equatorward Branch of the Dry Conveyor Belt (DCB)
Cold air in Cold Conveyor Belt (CCB) shallow and dry. Precipitation will be lacking for radar coverage.
Warm Conveyor Belt (WCB) is shallow, warm and moderately moist
CCB probably veers backs with height consistent with warm advection … I know this seems odd.
Mixing Zone
SurfaceCold Front
Frontal slope is more shallow than the typical 1:50
WCB oriented for
less frontal lift
Common area for deep instability A
B
A B
WCB just ahead of cold front also typically veers with height
WCBCCB
Veering winds above the frontal zone indicative of katabatic cold front
Behind the Cold Front Conceptual ModelsRight of the Col looking along the flow.

Analysis & Diagnosis 138Radar Palette Home Doppler
DCB Centred on the ColC
Cold frontal surface
Mixing layer
Dry CB
Within the DCB:•Winds veer with range/height to the west•Katabatic cold front
Within the CCB – Cold Advection:•Cold advection probably overpowers the Ekman spiral signature
The Cold Left Wing Dive CMThe eagles left wing is folded forward as if it is about to turn to the right and swoop down. That is what this part of the DCB does.The right wing is still fully extended to catch the lift of the WCB.
oRight WingLeft Wing
The steeper frontal slope of the cold front will be very evident. Notice that the frontal area outlined is an oval skewed to the cold side of the front.
AB

Analysis & Diagnosis 139Radar Palette Home Doppler
The Cold Left Wing Dive CMThis is a placeholder for a real example. o
Right WingLeft Wing
Analysis & Diagnosis 140Radar Palette Home Doppler
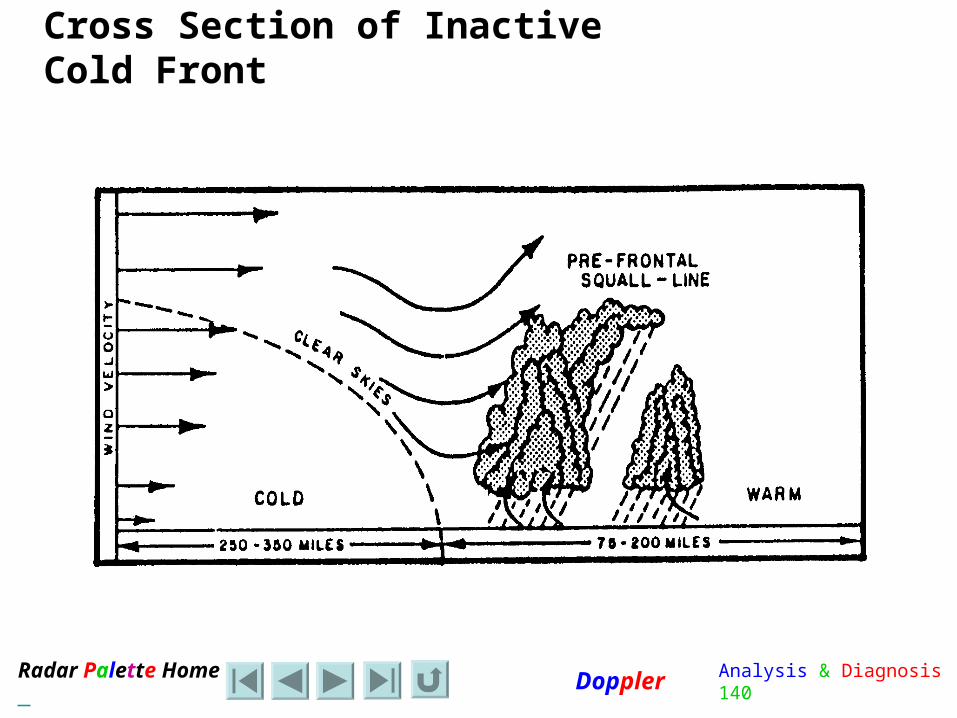
Cross Section of Inactive Cold Front
Analysis & Diagnosis 141Radar Palette Home Doppler
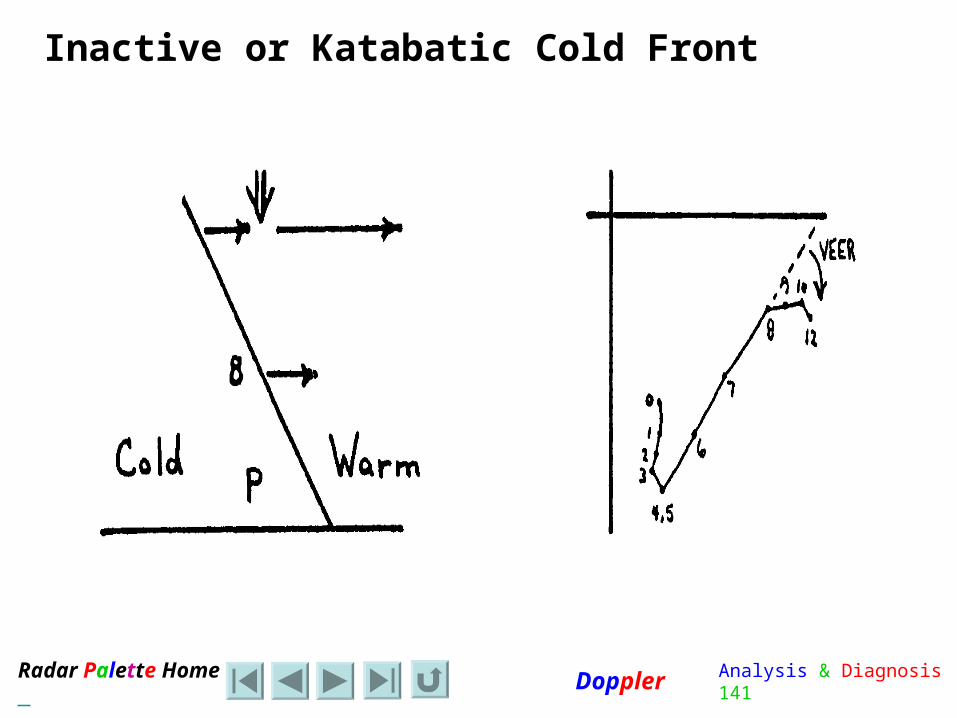
Inactive or Katabatic Cold Front
Analysis & Diagnosis 142Radar Palette Home Doppler
Doppler and the Conveyor Belt Conceptual Model
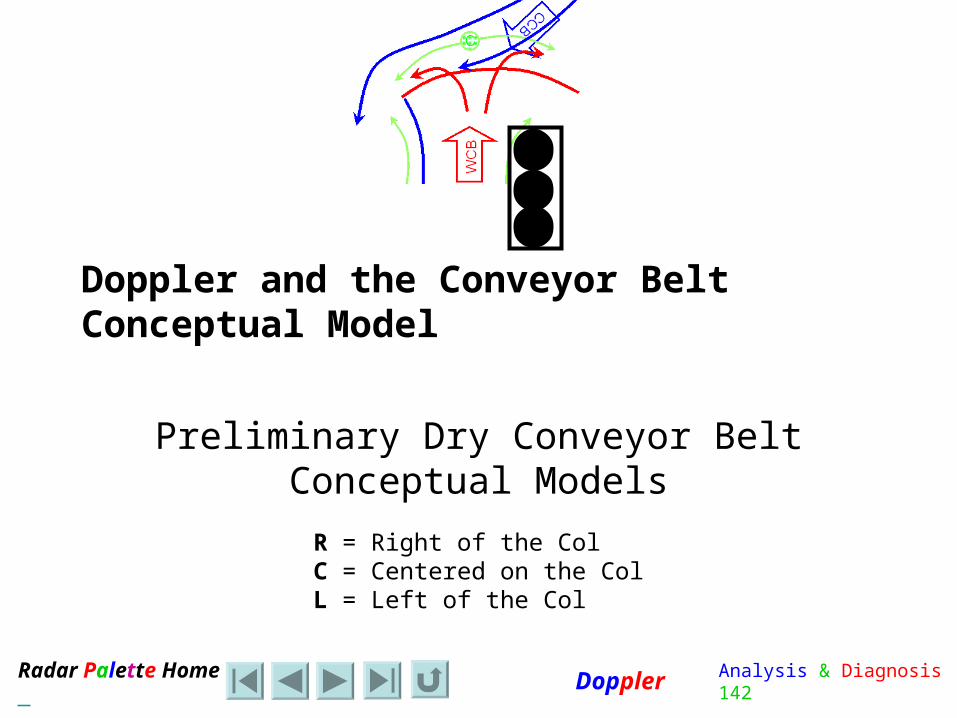
Preliminary Dry Conveyor Belt Conceptual Models
RC
LR = Right of the ColC = Centered on the ColL = Left of the Col
Analysis & Diagnosis 143Radar Palette Home Doppler
Radar Data and the Preliminary Dry Conveyor Belt
• Precipitation returns will be very limited in extent if they exist at all
• Radar data will be largely unavailable and unreliable
• This results in a very incomplete display of the Doppler wind field in particular

Analysis & Diagnosis 144Radar Palette Home Doppler
Within the Preliminary Dry Conveyor Belt Conceptual Models
These conceptual models should be similar to those associated with the dry conveyor belt that trails the cold front. Typically, any frontal zone in this region of the conveyor belt conceptual model will be weak and ill defined and probably not worth finding.
• Further investigation especially using isentropic surfaces is required – very required!

Analysis & Diagnosis 145Radar Palette Home Doppler
Illustrative Cross-section
Analysis & Diagnosis 146Radar Palette Home Doppler
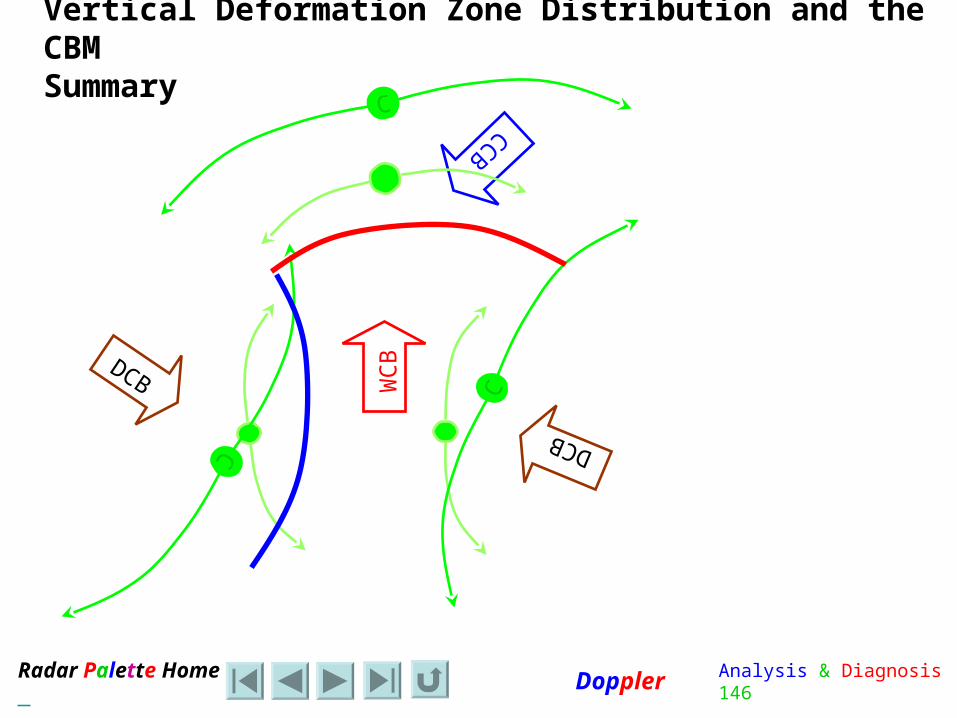
Vertical Deformation Zone Distribution and the CBMSummary
C
C
C
C
C
WC
B
DCB
CCB
DCB
C
Analysis & Diagnosis 147Radar Palette Home Doppler

Analysis & Diagnosis 148Radar Palette Home Doppler
Note to Whom it May Concern
• These conceptual models were constructed largely using the Conveyor Belt Conceptual Model to estimate what the Doppler radar should be seeing.
• This use of Doppler radar and in particular, the increased use of the 3.5 degree scan, are largely unprecedented.
• This is a first attempt at expanding the science and as a result, will likely require further refinements as we learn more.