Don Esping, Denny Parker, Jose Jimenez, Fenghua Yang, Tim ... · Comparison of Three Wet Weather...
40
Comparison of Three Wet Weather Flow Treatment Alternatives to Increase Plant Capacity Don Esping, Denny Parker, Jose Jimenez, Fenghua Yang, Tim Bate, Steve Arant OWEA 2013 June 19| 2013
Transcript of Don Esping, Denny Parker, Jose Jimenez, Fenghua Yang, Tim ... · Comparison of Three Wet Weather...

Comparison of Three Wet Weather Flow Treatment Alternatives to Increase Plant Capacity Don Esping, Denny Parker, Jose Jimenez, Fenghua Yang, Tim Bate, Steve Arant
OWEA 2013
June 19| 2013

• Background/Goals
• Bench Scale Testing
• Demonstration Facilities
• Testing
• Round 1 – Simulated Wet Weather
• Round 2 – Wet Weather
• Summary/Further Testing
Outline

Milwaukee MSD South Shore Water Reclamation Facility
16 Primary Settling Tanks
28 Aeration Basins
24 Final Settling Tanks
Aerated Grit
1” screens

2020 Facilities Plan
Increase capacity
• SSO - 5 year protection
• 300 to 450 mgd
Pilot Tested Ballasted Sedimentation
150 mgd CEPT
300 mgd
secondary
treatment Study Objectives
• Demonstrate other auxiliary treatment technologies

Auxiliary Treatment Options Considered
DRAFT 8/24/2010
Process Testing Comments
Chemical
Chemically Enhanced Primary
Treatment (CEPT)
Yes Full-Scale Testing
Ballasted flocculation – (Actiflo… No Previously tested
CoMag Ballasted flocculation No
Biological
Biological Contact Treatment Yes Pilot-Scale Testing
Bio-Actiflo No Insufficient project budget
Filtration
Deep Bed Filters No
Cloth media No
Compressible Media Yes Pilot-Scale Testing

Treatment Flow Routing
Plant Influent
(450 mgd)
Primary Settling Tanks
(150/300/300 mgd)
Existing Activated Sludge
Process
(300/300/300 mgd)
Compressible Media
Filtration
(150 mgd)
Biological
Contact Treatment
(150 mgd)
Disinfection
(450 mgd)
Flow routing and flow rates
Compressible Media Filtration/Biological Contact /
Chemically Enhanced Sedimentation

Demonstration Study Effluent Goals
Item
Units
NPDES
Permit
Operations
Contract
Demonstration
Study Daily
Goals
cBOD5 mg/L 30a /45b 15a 35
TSS mg/L 30a /45b 15a 35
Total Phosphorus mg P/L 1.0a 1.0a 1
Ammonia-Nitrogen mg N/L Seasonal 5a 5
Fecal Coliformc (no./100 mL) 200 100 --
a. Monthly average b. Weekly average c. Geometric mean

CEPT
Cocktail for wet weather and chemical system sizing
Biological Contact Treatment
Bio-flocculation potential and kinetics ( MLSS and contact time)
Bench-Scale Testing
Simulation of coagulation and/or flocculation processes

CEPT Bench-Scale Testing
170
40
100
27.5 2530
24
0
20
40
60
80
100
120
140
160
180
Control 40 mg/L FeCl3 12.6 mg/L PAX
40 mg/L FeCl3 & 0.46 mg/L
A210P
12.6 mg/L PAX & 0.46 mg/L A210P
40 mg/L FeCl3 & 0.4 mg/L
CE9307
12.6 mg/L PAX &0.4
mg/L CE9307
Su
per
na
tan
t T
SS
, m
g/L
Coagulant Only Coagulant and Flocculant

342
215
182168 166
176 174160
8770 78 87
76 84 84 84
37 34 40 48 4262
4559
0
50
100
150
200
250
300
350
400
Diluted raw
influent
Control 40 mg/L
FeCl3
12.6 mg/L
PAX
40 mg/L
FeCl3 & 0.46
mg/L A210P
12.6 mg/L
PAX & 0.46
mg/L A210P
40 mg/L
FeCl3 & 0.4
mg/L CE9307
12.6 mg/L
PAX &0.4
mg/L CE9307
Su
per
na
tan
t C
OD
, m
g/L
COD SCOD FFCOD
CEPT Bench-Scale Testing
Coagulant Only Coagulant and Flocculant
Demonstration Target 40 mg/L ferric chloride 0.5 mg/L anionic polymer
Biological Contact Treatment
• High rate biological process which relies on biological flocculation
for colloidal & particulate removal
• No chemical addition required
• Effluent meets secondary treatment requirements
RAS WAS

Biological Contact Treatment
• High rate biological process which relies on biological flocculation
for colloidal & particulate removal
• No chemical addition required
• Effluent meets secondary treatment requirements
Combined or
Dedicated Clarifiers
RAS WASRAS WAS
Contact Tank
PE or Raw
Short HRT Contact
Tank
MLSS or RAS

Biological Contact Process Sizing
• Competing Interests • Low MLSS » Low SLR » Less clarifiers
• Low MLSS » Reduced kinetics » Larger contact tank
• Site specific testing required
DRAFT 8/24/2010
0%
20%
40%
60%
80%
100%
0 10 20 30 40 50 60
Contact Time (min)
% A
pp
roa
ch t
o T
SS
Res
idu
al
Co
nce
ntr
ati
on
Plant A Plant B

0
20
40
60
80
100
120
0 5 10 15 20 25 30
Su
pern
ata
nt T
SS
, mg
/L
Flocculation Time, minutes
410
820
1025
1230
1540
1740
Biological Contact Bench –Scale Testing

Biological Contact Bench –Scale Testing
Demonstration Target MLSS 1500 - 2000 mg/L HRT 15 -20 minutes
0%
10%
20%
30%
40%
50%
60%
70%
80%
90%
100%
0 5 10 15 20 25 30
% A
ppro
ach
to R
esid
ual
Par
ticu
late
CO
D
Contact Time (min)
500 mg/L 1,000 mg/L 1,250 mg/L 1,500 mg/L 2,000 mg/L
Particulate COD = TCOD - SCOD(0.45 um filter)

• ¼ existing primary settling tanks
• Wet weather SOR: 1500 gal/sf-d
• 40 mg/L ferric chloride and 0.5 mg/L anionic polymer
CEPT Demonstration – Full Scale
Polymer Feed/ Mixer
Location
CES Primary
Clarifiers 9-12
Influent sampler and
ferric chloride feed
location
Primary effluent sampler

Biological Contact Treatment Demonstration
Tank 4 Primary Influent Head Tank
Return Sludge
Tank 2 Tank 1
• 4000 gallon aerated plug flow reactor
• Bench Scale Settling Tests • MLSS: 1500 - 2000 mg/L
• HRT: 15 -20 minutes
• Bench testing for clarification

• WWETCO Rental
• Filtration rate 5-7.5 gpm/sf
• 2011 - Primary effluent and secondary effluent
• 2012/13 - Primary influent
Compressible Media Filter Demonstration

Simulated Wet Weather – Biological Contact
Item Units 10/12/2011 10/17/2011 10/17/2011
Influent stream Blend of primary influent and secondary effluent
MLSS mg/L 1653 1882 2069
Influent
COD mg/L 190 160 130
TSS mg/L 95 79 66
BOD5 mg/L 68 64 51
TP mg/L 1.8 1.8 1.3
Reactor 3
Contract time minutes 15 22 15
Effluent TSS mg/L 34 15 7
Reactor 4
Contact time minutes 20 29 20
Effluent COD mg/L 110 51 59
Effluent TSS mg/L 25 19 6
Effluent TP mg/L 1.0 0.53 0.36
Demonstration Target MLSS 1500 - 2000 mg/L HRT 15 -20 minutes

60
19
34
22
58
100
26 26 26
15 15 15
3127
138
11
5 710
23
12 10 12
58
0
20
40
60
80
100
1205
.5
5.5
7.5
7.5
80
RA
S 5
.5
13
5 R
AS
7.5
11
Fe
@ 5
.5
21
Fe
@ 5
.5
31
Fe
@ 5
.5
8 F
e @
7.5
8 F
e @
7.5
8 F
e @
7.5
10
Fe
@ 5
7 F
e @
7.5
To
tal
Su
spen
ded
So
lid
s, m
g/L
Diluted Primary Effluent Filtered Effluent
Simulated Wet Weather – Compressible Media

190
51
160
79
71
86
71 71 7165 65 65
77
95
130
50
150
59
68
82
53
70
57 55 5259
71
30
0
20
40
60
80
100
120
140
160
180
200
5.5
5.5
7.5
7.5
80
RA
S 5
.5
13
5 R
AS
7.5
11
Fe
@ 5
.5
21
Fe
@ 5
.5
31
Fe
@ 5
.5
8 F
e @
7.5
8 F
e @
7.5
8 F
e @
7.5
10
Fe
@ 5
7 F
e @
7.5
So
lub
le C
OD
, mg
/L
Diluted Primary Effluent sCOD Filtered sCOD
Simulated Wet Weather – Compressible Media
• RAS addition did not improve soluble COD removal
• Ferric addition not required • Test filtration rates of 5-10 gpm/sf

Wet Weather Testing - May 7, 2012
0
25
50
75
100
125
150
175
200
225
250
275
300
3255
/6/1
2 0
:00
5/6
/12
3:0
0
5/6
/12
6:0
0
5/6
/12
9:0
0
5/6
/12
12
:00
5/6
/12
15
:00
5/6
/12
18
:00
5/6
/12
21
:00
5/7
/12
0:0
0
5/7
/12
3:0
0
5/7
/12
6:0
0
5/7
/12
9:0
0
5/7
/12
12
:00
5/7
/12
15
:00
5/7
/12
18
:00
5/7
/12
21
:00
5/8
/12
0:0
0
Flo
w, m
gd
CES and
BC
CMF Operation

CEPT (CES)
• SOR ≈ 2750 gal/sf-d
• Polymer mixer malfunction
Biological Contact
• MLSS ≈ 1600 mg/L
• HRT = 16 and 22 minutes
CMF
• Filtration rate of 7.5 gpm/sf
May 7, 2012 Test

0
20
40
60
80
100
120
140
160
180
200
220
2406
:00
7:3
0
9:0
0
10:3
0
12:0
0
13:3
0
15:0
0
16:3
0
18:0
0
19:3
0
21:0
0
22:3
0
0:0
0
To
tal
Su
spen
ded
So
lid
s, m
g/L
Time
BC/CES Influent BC (HRT=16 min ) BC (HRT=22 min)
CMF Influent CMF Effluent CES Effluent
May 7, 2012 Wet Weather Testing - TSS

0
10
20
30
40
50
60
706
:00
7:3
0
9:0
0
10:3
0
12:0
0
13:3
0
15:0
0
16:3
0
18:0
0
19:3
0
21:0
0
22:3
0
0:0
0
BO
D5(i
nfl
uen
t) o
r C
BO
D5
(eff
luen
t),
mg
/L
Time
BC (HRT=16 min ) BC (HRT=22 min) CMF Influent CMF Effluent CES Effluent
May 7, 2012 Wet Weather Testing – BOD

May 7, 2012 Wet Weather Testing - Ammonia
0
1
2
3
4
5
6
7
8
9
6:0
0
7:3
0
9:0
0
10
:30
12
:00
13
:30
15
:00
16
:30
18
:00
19
:30
21
:00
22
:30
0:0
0
Am
mo
nia
Nit
rog
en, m
g N
/L
Time
BC/CES Influent BC (HRT=16 min ) BC (HRT=22 min)
CMF Influent CMF Effluent CES Effluent

May 7, 2012 Wet Weather Testing – TP
0.0
0.5
1.0
1.5
2.0
2.5
3.06
:00
7:3
0
9:0
0
10
:30
12
:00
13
:30
15
:00
16
:30
18
:00
19
:30
21
:00
22
:30
0:0
0
To
tal P
ho
sph
oru
s, m
g P
/L
Time
BC/CES Influent BC (HRT=16 min ) BC (HRT=22 min)CMF Influent CMF Effluent CES Effluent

May 7, 2012 Wet Weather Testing – COD
0
20
40
60
80
100
120
140
160
180
2006
:00
7:3
0
9:0
0
10
:30
12
:00
13
:30
15
:00
16
:30
18
:00
19
:30
21
:00
22
:30
0:0
0
Ch
em
ica
l Ox
yg
en
Dem
an
d, m
g/L
Time
BC/CES Influent BC (HRT=16 min ) BC (HRT=22 min)CMF Influent CMF Effluent CES Effluent

May 7, 2012 Wet Weather Testing – Soluble COD
0
10
20
30
40
50
60
70
80
90
100
110
1206
:00
7:3
0
9:0
0
10
:30
12
:00
13
:30
15
:00
16
:30
18
:00
19
:30
21
:00
22
:30
0:0
0
So
lub
le C
hem
ica
l Ox
yg
en D
ema
nd
, mg
/L
Time
BC/CES Influent BC (HRT=16 min ) BC (HRT=22 min)
CMF Influent CMF Effluent CES Effluent

May 7, 2012 Wet Weather Testing – Soluble P
0.0
0.1
0.2
0.3
0.4
0.5
0.6
0.7
0.86
:00
7:3
0
9:0
0
10
:30
12
:00
13
:30
15
:00
16
:30
18
:00
19
:30
21
:00
22
:30
0:0
0
So
lub
le P
ho
sph
oru
s, m
g P
/L
Time
BC/CES Influent BC (HRT=16 min ) BC (HRT=22 min)
CMF Influent CMF Effluent CES Effluent

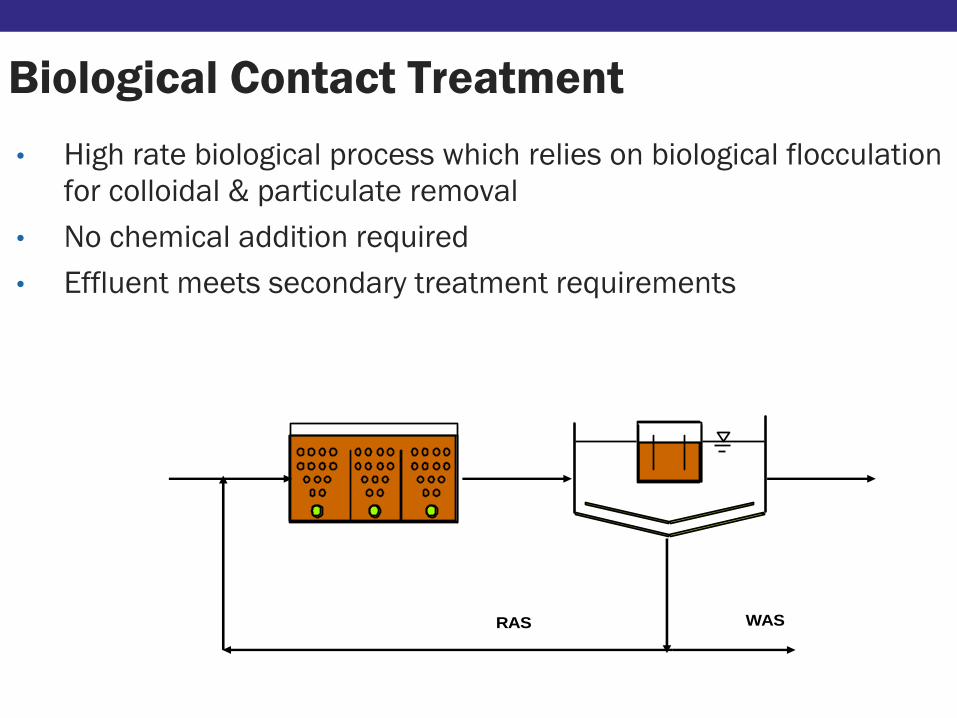
Temperature = 10.5 C
CEPT • SOR ≈ 1900 gal/sf-d
• Ferric chloride – 50 mg/L as FeCl3
• Polymer – 2 mg/L
Biological Contact • MLSS ≈ 1700 mg/L
• HRT = 17 and 23 minutes
CMF • Equipment Malfunction
May 7, 2013 Test
0
20
40
60
80
100
120
1409
:00
10:3
0
12:0
0
13:3
0
15:0
0
16:3
0
18:0
0
To
tal
Su
spen
ded
So
lid
s, m
g/L
Time
BC/CES Influent BC (HRT=17 min ) BC (HRT=23 min) CES Effluent
May 23, 2013 Wet Weather Testing - TSS
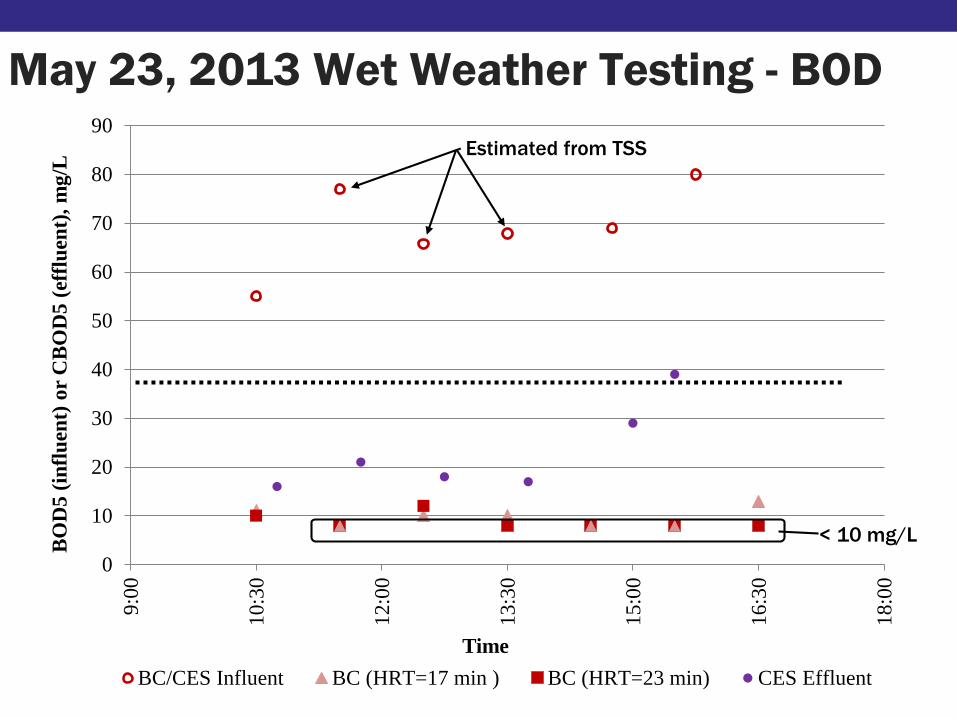
0
10
20
30
40
50
60
70
80
909
:00
10:3
0
12:0
0
13:3
0
15:0
0
16:3
0
18:0
0
BO
D5
(in
flu
ent)
or
CB
OD
5 (
effl
uen
t),
mg
/L
Time
BC/CES Influent BC (HRT=17 min ) BC (HRT=23 min) CES Effluent
< 10 mg/L
Estimated from TSS
May 23, 2013 Wet Weather Testing - BOD

0
1
2
3
4
5
6
7
8
99
:00
10:3
0
12:0
0
13:3
0
15:0
0
16:3
0
18:0
0
Am
mo
nia
Nit
rog
en,
mg
N/L
Time
BC/CES Influent BC (HRT=17 min ) BC (HRT=23 min) CES Effluent
May 23, 2013 Wet Weather Testing - Ammonia

0.0
0.2
0.4
0.6
0.8
1.0
1.2
1.4
1.6
1.8
2.09
:00
10:3
0
12:0
0
13:3
0
15:0
0
16:3
0
18:0
0
To
tal
Ph
osp
ho
rus,
mg
P/L
Time
BC/CES Influent BC (HRT=17 min ) BC (HRT=23 min) CES Effluent
May 23, 2013 Wet Weather Testing - TP
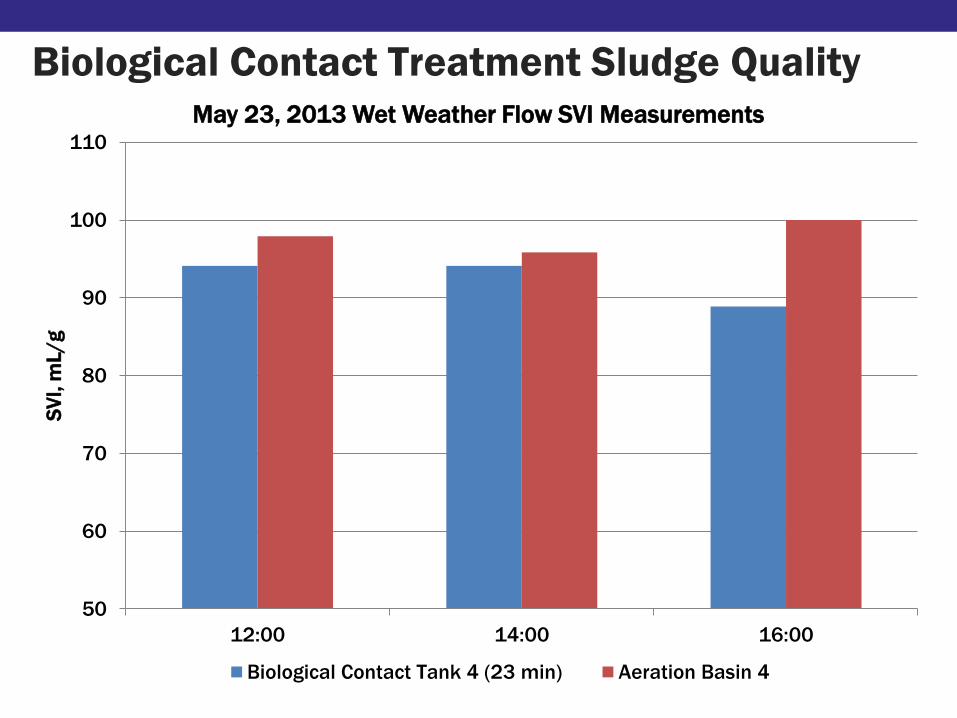
Biological Contact Treatment Sludge Quality
50
60
70
80
90
100
110
12:00 14:00 16:00
SV
I, m
L/g
May 23, 2013 Wet Weather Flow SVI Measurements
Biological Contact Tank 4 (23 min) Aeration Basin 4

Biological Contact Treatment Sludge Quality
0
10
20
30
40
50
60
0 2 4 6 8 10 12 14
So
lid
s L
oa
din
g R
ate
, lb
/sf-
d
MLSS, g/L
Activated Sludge Biological Contact
April 23, 2013 SVI
Activated Sludge = 68 mL/g
Biological Contact = xx mL/g

Wet Weather Testing to Date
Item Chemically Enhanced
Primary Treatment
Biological Contact
Treatment
Compressible
Media Filtration
Events 1 3 1
Effluent Quality
CBOD5 <20 ≈ 10 <20
ESS ≈ 20 <10 <20
NH3-N In = Out 1-2 mg/L reduction In = Out
TP <1 < 1 <1
Comments 50 mg/L FeCl3
Polymer = 2 mg/L
15-20 min HRT
MLSS 1600-1700 mg/L
SVI same as mainstream
7.5 gpm/sf

• Additional auxiliary treatment testing
• June 13, 2013 completed
• 3 additional wet weather events
• Biological contact settling characteristics testing
Disinfection testing
Future Testing

Thank you