Domestic tourism survey (DTS), 2015
26
Domestic Tourism Survey, 2015 Dr Pali Lehohla Statistician-General #StatsSA
-
Upload
statistics-south-africa -
Category
Travel
-
view
29 -
download
0
Transcript of Domestic tourism survey (DTS), 2015

Domestic Tourism Survey,
2015
Dr Pali Lehohla
Statistician-General
#StatsSA

About the surveyCollects information to understand the travel behaviour of people in the country.
Determine the contribution of tourism to the country’s economy.
Focusses on domestic tourism and includes information on day and overnight trips.
1
2
3
4
5
Looks at all private households and residents in workers’ hostels in
all 9 provinces of SA, sampling approximately 32000 households in face to face interviews
Stats SA uses administrative data from Department of Home Affairs(people entering the country and travelling outside) to collect and analyse
data for international tourism

DTS Methodology

Sample
Scope
Measure
18+
15 594 persons
(About 1 300 monthly)
Approximately
32 000 households
All trips Most recent trips
Comparison of Stats SA and SA Tourism
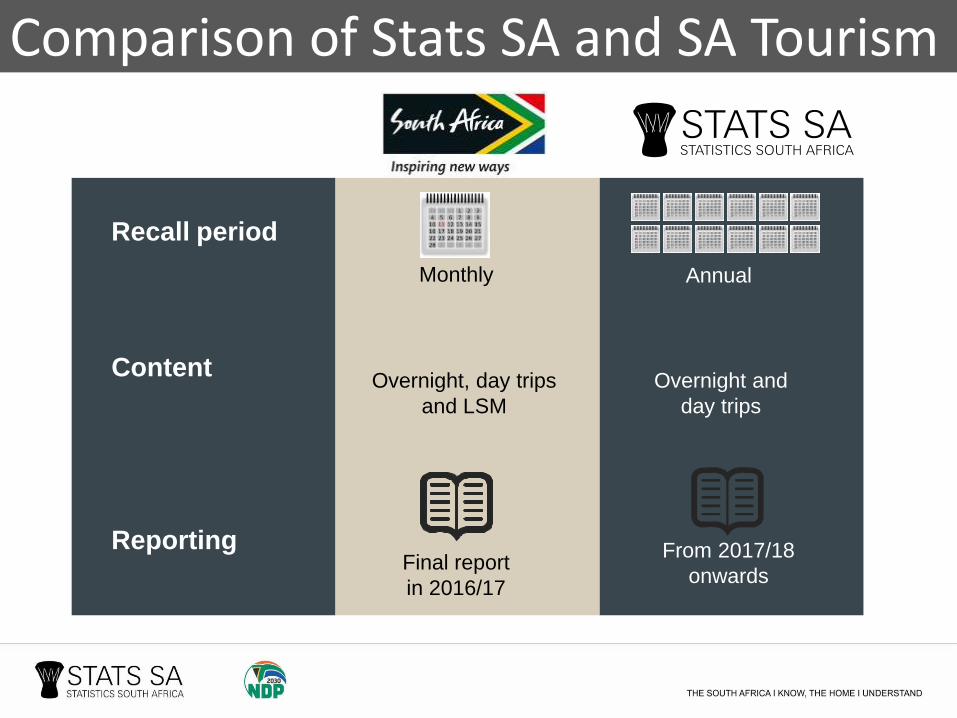
Recall period
Content
Reporting
Annual
From 2017/18
onwardsFinal report
in 2016/17
Overnight, day trips
and LSM
Overnight and
day trips
Monthly
Comparison of Stats SA and SA Tourism

Day trips taken inside South Africa
Demographic information
Main destinations
Reason for travelling
Mode of transport used
Overnight trips taken inside South Africa
Living Standard Measure
Information Gathered

Tourism direct contribution to the GDP
% of GDP2005-2015
Source: Tourism Satellite Account for South Africa, 2015
3,0% of the
GDP in 2015(R118 928 million)
How Large is Tourism?

How much did we spend on leisure related travel 2011-2015?
Source: IES 2010/2011 and LCS 2014/15
8,7
5,8
1,6 0,1
7,3 7,6
2,9
0,2 0,0
1,0
2,0
3,0
4,0
5,0
6,0
7,0
8,0
9,0
10,0
Transport Accommodation Tour packages Cultural services
R b
illio
n
IES2010/11 LCS2014/15
There was an increase in expenditure towards Accommodation and Holiday Tour Packages from 2011 to 2015
Expenditure towards Transport decreased to R7,3bn from R8,7bn in 2011
Findings of the DTS 2015

Day
54,448m
44,3m
Overnight
50,8 47,3m
45,4m
0
10
20
30
40
50
60
2013 2014 2015
Day Overnight
Total number of trips (million), 2013 – 2015
A general pattern of decline in domestic
tourism for both day and overnight tripsis observed from 2013 to 2015
R 104bR 110b
R 87b
R0
R20
R40
R60
R80
R100
R120
2013 2014 2015
Total Expenditure (in Billion rands)
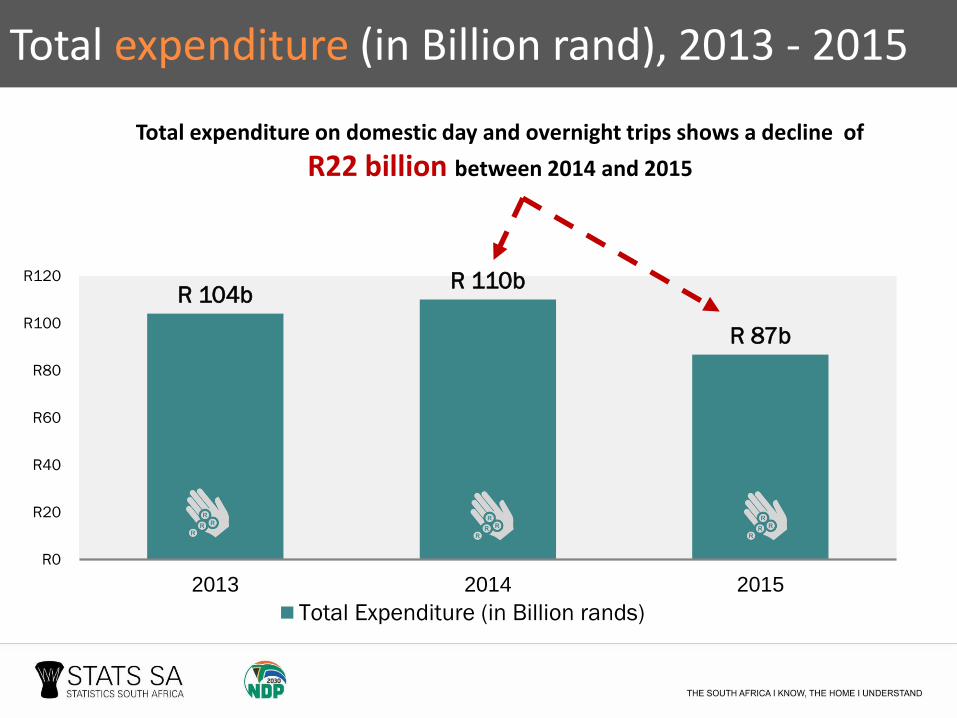
Total expenditure (in Billion rand), 2013 - 2015
Total expenditure on domestic day and overnight trips shows a decline of
R22 billion between 2014 and 2015
Jan Feb Mar Apr May Jun Jul Aug Sept Oct Nov Dec
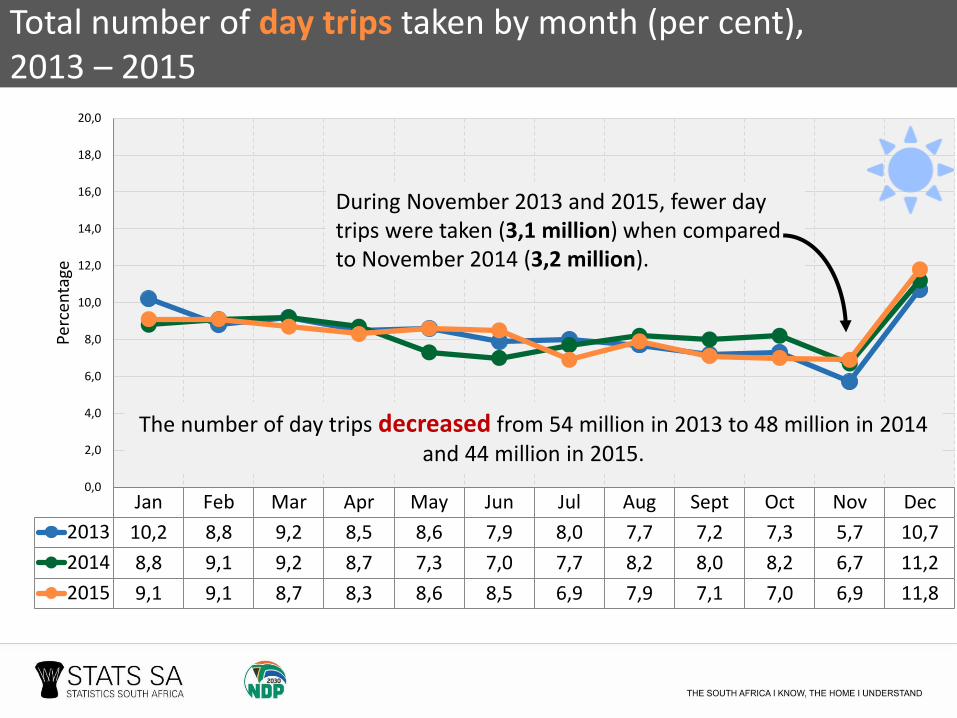
2013 10,2 8,8 9,2 8,5 8,6 7,9 8,0 7,7 7,2 7,3 5,7 10,7
2014 8,8 9,1 9,2 8,7 7,3 7,0 7,7 8,2 8,0 8,2 6,7 11,2
2015 9,1 9,1 8,7 8,3 8,6 8,5 6,9 7,9 7,1 7,0 6,9 11,8
0,0
2,0
4,0
6,0
8,0
10,0
12,0
14,0
16,0
18,0
20,0
Perc
enta
ge
Total number of day trips taken by month (per cent), 2013 – 2015
The number of day trips decreased from 54 million in 2013 to 48 million in 2014 and 44 million in 2015.
During November 2013 and 2015, fewer day trips were taken (3,1 million) when compared to November 2014 (3,2 million).
Jan Feb Mar Apr May Jun Jul Aug Sept Oct Nov Dec
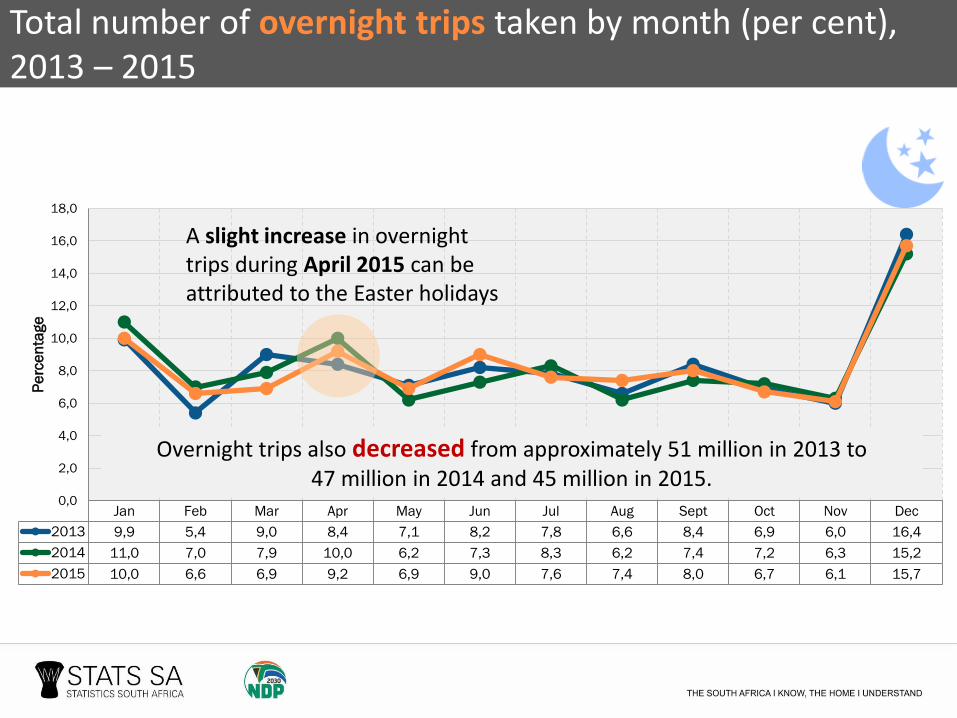
2013 9,9 5,4 9,0 8,4 7,1 8,2 7,8 6,6 8,4 6,9 6,0 16,4
2014 11,0 7,0 7,9 10,0 6,2 7,3 8,3 6,2 7,4 7,2 6,3 15,2
2015 10,0 6,6 6,9 9,2 6,9 9,0 7,6 7,4 8,0 6,7 6,1 15,7
0,0
2,0
4,0
6,0
8,0
10,0
12,0
14,0
16,0
18,0
Pe
rce
nta
ge
Total number of overnight trips taken by month (per cent), 2013 – 2015
Overnight trips also decreased from approximately 51 million in 2013 to 47 million in 2014 and 45 million in 2015.
A slight increase in overnight trips during April 2015 can be attributed to the Easter holidays
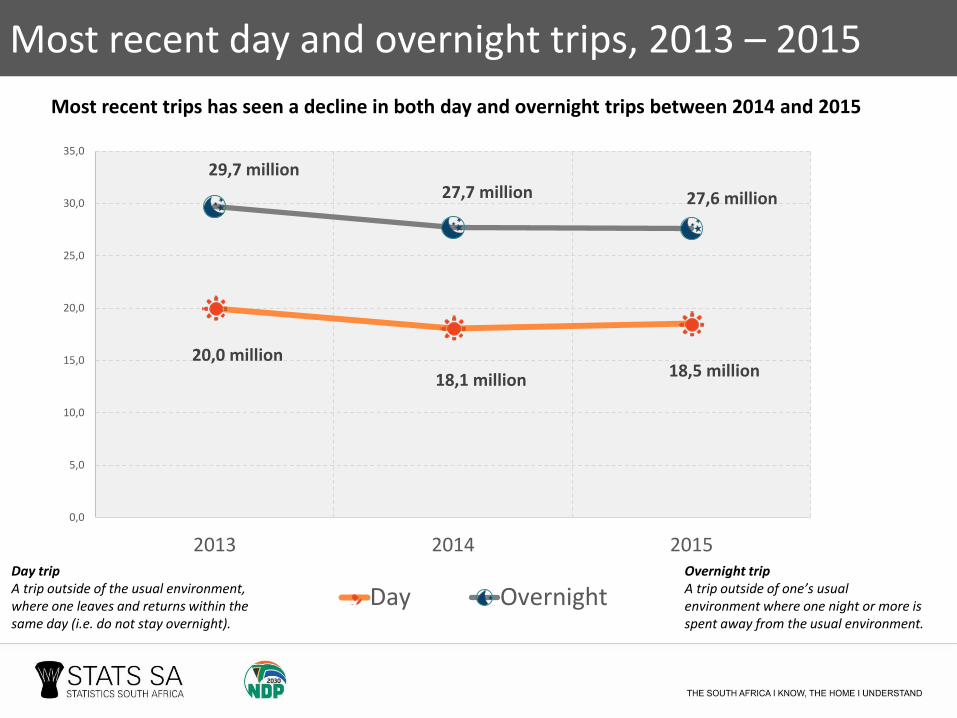
Most recent day and overnight trips, 2013 – 2015
Day tripA trip outside of the usual environment, where one leaves and returns within the same day (i.e. do not stay overnight).
Overnight tripA trip outside of one’s usual environment where one night or more is spent away from the usual environment.
Most recent trips has seen a decline in both day and overnight trips between 2014 and 2015
million
20,0 million
18,1 million 18,5 million
29,7 million27,7 million 27,6 million
0,0
5,0
10,0
15,0
20,0
25,0
30,0
35,0
2013 2014 2015
Day Overnight

MP9,4%
KZN10,3%
EC9,5%
FS3,9%
NW8,0%
NC3,4%
WC12,4%
GP23,1%
Gauteng and Limpopo were the
most popular destinations for day
travellers
LP17,1%
Percentage of most recent day trips by province of destination, 2015
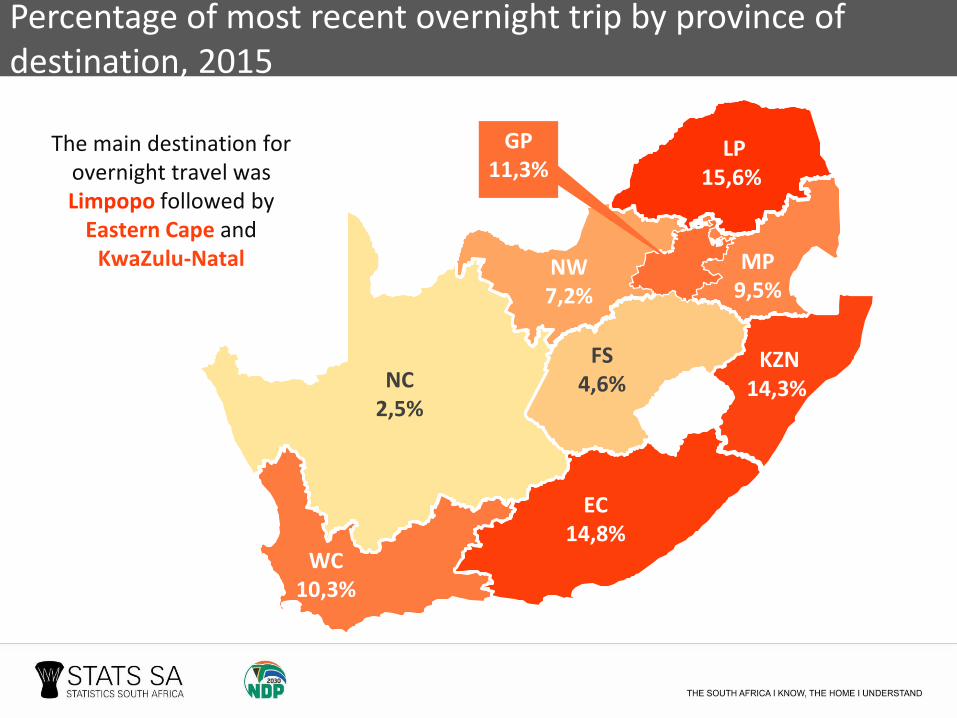
MP9,5%
EC14,8%
FS4,6%
NW7,2%
NC2,5%
WC10,3%
GP11,3%
LP15,6%
KZN14,3%
The main destination for overnight travel was Limpopo followed by
Eastern Cape and KwaZulu-Natal
Percentage of most recent overnight trip by province of destination, 2015

Main purpose of most recent day trips, 2013 – 2015
Shopping VFR Leisure Business Religion Sporting Other Unspecified
2013 24,9 25,6 16,9 4,8 4,2 1,9 21,0 0,7
2014 28,8 26,5 13,5 4,3 5,4 1,7 18,9 0,6
2015 27,4 23,8 16,7 4,3 5,4 2,0 20,1 0,4
0,0
10,0
20,0
30,0
40,0
50,0
60,0
70,0
80,0
90,0
100,0
Per
cen
tage
2013 2014 2015
The main reason reported for undertaking day trips was:
Shopping
Visiting friends and relatives
Leisure

Main purpose of most recent overnight trips, 2013 – 2015
VFR Leisure Religion Business Sporting Shopping Other Unspecified
2013 48,8 18,9 7,7 2,4 0,7 0,7 20,3 0,5
2014 49,5 18,2 7,4 2,4 1,0 0,7 19,4 0,9
2015 48,7 18,5 6,3 2,2 0,8 0,6 0,9 0,6
0,0
10,0
20,0
30,0
40,0
50,0
60,0
70,0
80,0
90,0
100,0
2013 2014 2015
The main reason reported for undertaking overnight trips was:
Visiting friends and relatives
Leisure
ReligionPerc
enta
ge

Mode of Transport
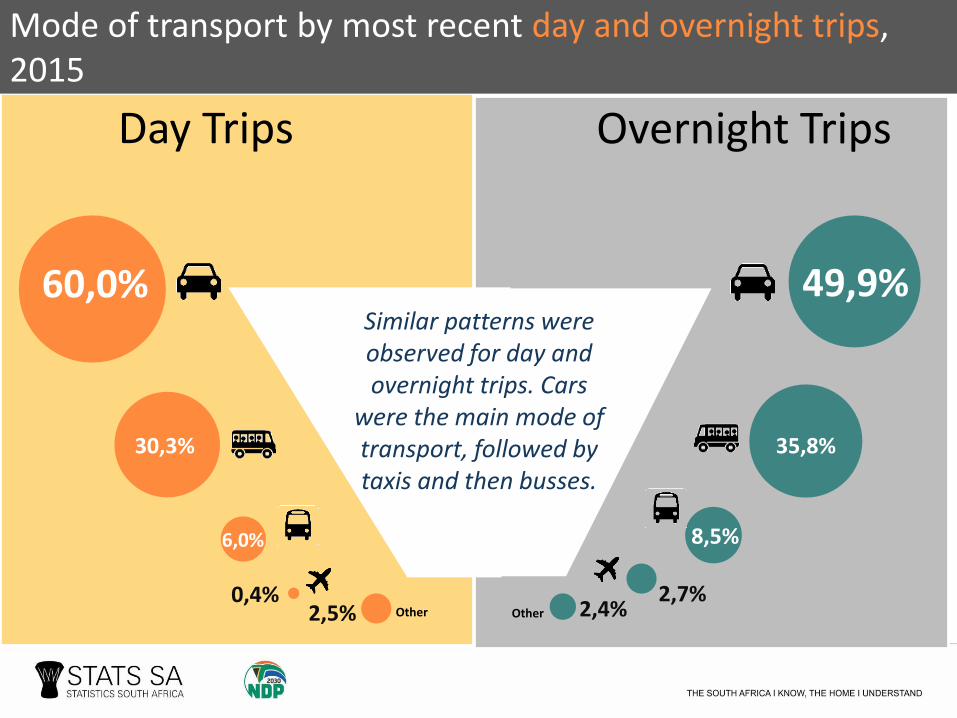
Mode of transport by most recent day and overnight trips, 2015
Day Trips Overnight Trips
60,0% 49,9%
30,3% 35,8%
6,0% 8,5%
0,4% 2,7%Other Other 2,4%2,5%
Similar patterns were observed for day and overnight trips. Cars
were the main mode of transport, followed by taxis and then busses.

9%9% 10%
2015 2014 2013
50% 51% 49%
0%
20%
40%
60%
80%
2015 2014 2013
36% 34% 36%
2015 2014 2013
3% 3% 3%
2015 2014 2013
AIRPLANEBUSCAR TAXI
Mode of transport by most recent overnight trip, 2013 - 2015
Cars remain the main mode of transport used for overnight trips. Taxis were the second most used mode of transport for overnight trips.

Accommodation

Stayed with friends and relatives
Self Catering
Other
Hotel
Caravan Park
Holiday Home
Guest House
Lodge
Bed and Breakfast
Hostel/Back Packers
Accommodation used on most recent overnight trip, 2015
Most tourists made use of
unpaidaccommodation
when undertaking an
overnight trip bystaying with
friends or relatives
74%STAYING WITH FRIENDS
OR RELATIVES
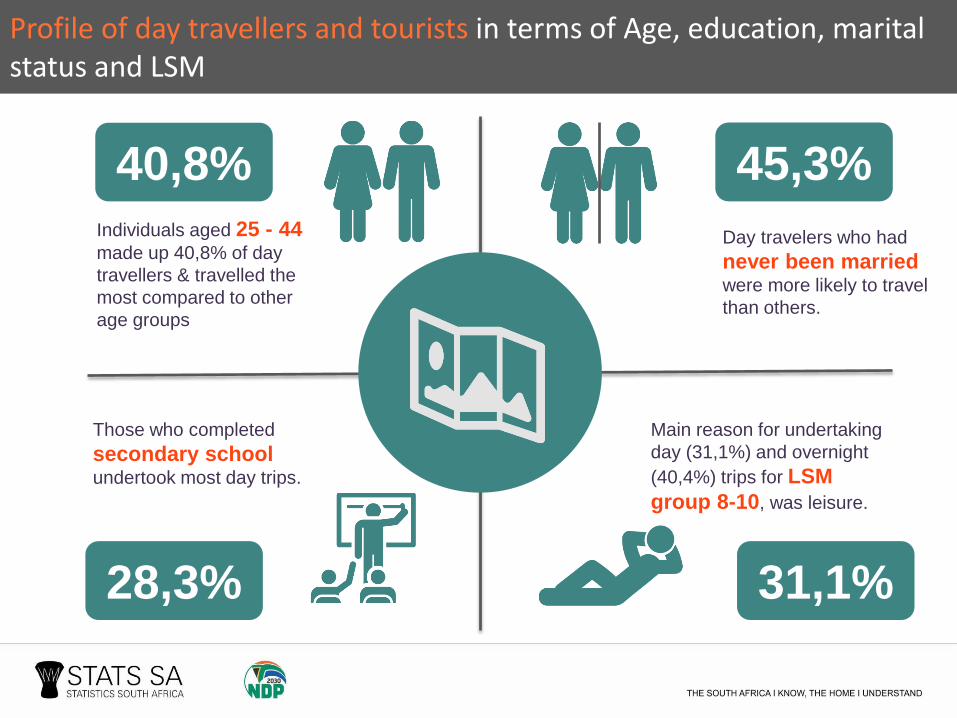
Profile of day travellers and tourists in terms of Age, education, marital status and LSM
Day travelers who had
never been married were more likely to travel
than others.
Individuals aged 25 - 44 made up 40,8% of day
travellers & travelled the
most compared to other
age groups
40,8% 45,3%
28,3%
Those who completed
secondary school undertook most day trips.
31,1%
Main reason for undertaking
day (31,1%) and overnight
(40,4%) trips for LSM
group 8-10, was leisure.

Profile of day travellers and tourists in terms of Age, education, marital status and LSM
LSM group 1-4 are
more likely to take day
trips for shopping.
After LSM group 8-10, the
next highest spending
group was LSM 5-7 who
spent money mostly on
shopping and domestic
transport.
R14bn 49,5%
1 Week
Most tourists spent up to
one week at their
destinations on an overnight
trip, staying mainly with
friends and relatives.
GP, LP, WC
Between 2013-2015, GP, LP
and WC were most popular
destinations for day
travellers, while overnight
travellers mostly preferred LP,
EC and KZN.
Thank you