Domestic Election Observers and Electoral Fraud in Malawi ...
51
Domestic Election Observers and Electoral Fraud in Malawi’s 2014 Elections George Ofosu University of California, Los Angeles Daniel N. Posner University of California, Los Angeles This version: 31 December 2015 We thank Omer Ali, Sarah Brierley, Chad Hazlett, and Mike Thies for their comments and suggestions on an earlier version of the paper. We gratefully acknowledge the collaboration of the Malawi Electoral Support Network (MESN) and the National Democratic Institute, especially MESN board director Steve Duwa. We also thank the Innovation for Poverty Action (IPA)—Malawi office for their support in the recruitment, training, and deployment of research assistants, and our 200 RAs for their help in data collection. We thank Kim Yi Dionne and Boniface Dulani for their support during our fieldwork. Pericles Kalande and Sammar Smesme provided research assistance. This research was made possible with support from the American people through the United States Agency for International Development (USAID). The contents are the sole responsibility of the authors and do not necessarily reflect the views of USAID, the United States Government, or the Democracy Fellows and Grants Program implementer, Institute of International Education (IIE). The research was approved by the UCLA IRB (#14-000553) on May 13, 2014.
Transcript of Domestic Election Observers and Electoral Fraud in Malawi ...

Domestic Election Observers and Electoral Fraud in Malawi’s 2014 Elections
George Ofosu University of California, Los Angeles
Daniel N. Posner University of California, Los Angeles
This version: 31 December 2015
We thank Omer Ali, Sarah Brierley, Chad Hazlett, and Mike Thies for their comments and suggestions on an earlier version of the paper. We gratefully acknowledge the collaboration of the Malawi Electoral Support Network (MESN) and the National Democratic Institute, especially MESN board director Steve Duwa. We also thank the Innovation for Poverty Action (IPA)—Malawi office for their support in the recruitment, training, and deployment of research assistants, and our 200 RAs for their help in data collection. We thank Kim Yi Dionne and Boniface Dulani for their support during our fieldwork. Pericles Kalande and Sammar Smesme provided research assistance. This research was made possible with support from the American people through the United States Agency for International Development (USAID). The contents are the sole responsibility of the authors and do not necessarily reflect the views of USAID, the United States Government, or the Democracy Fellows and Grants Program implementer, Institute of International Education (IIE). The research was approved by the UCLA IRB (#14-000553) on May 13, 2014.
1
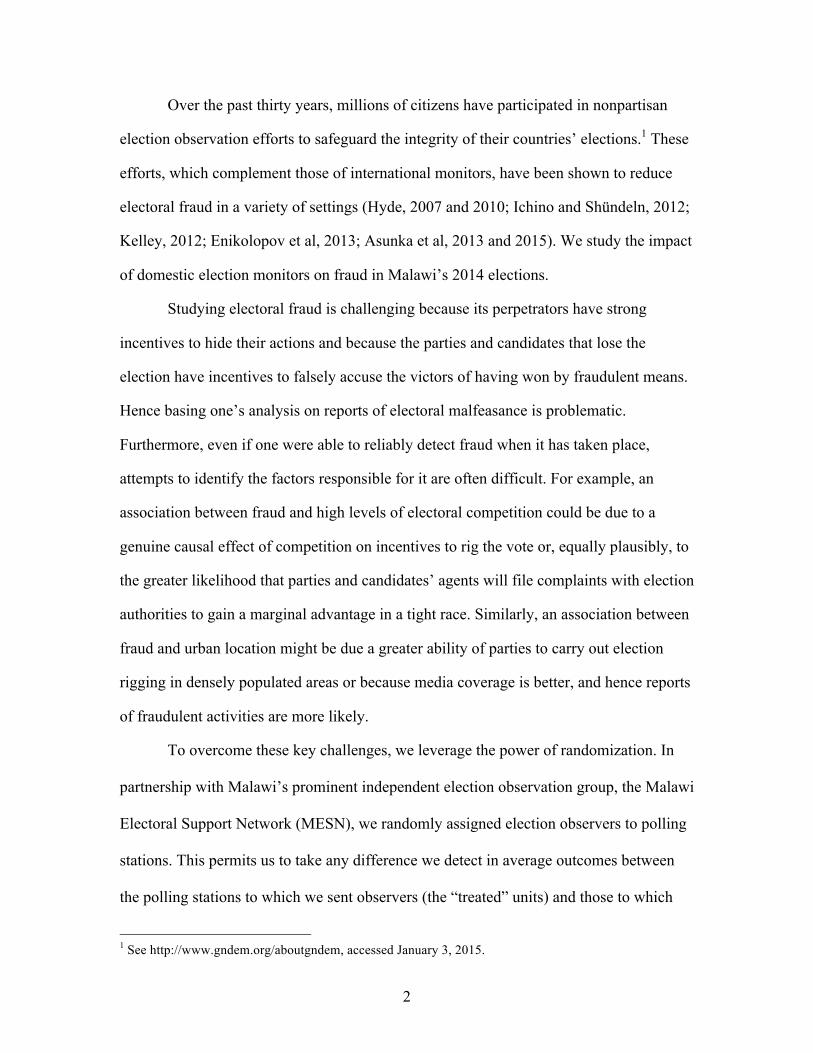
Abstract We present findings from a field experiment that estimates the causal effect of domestic election observers on election day malfeasance and downstream aggregation fraud in Malawi’s 2014 general elections. Our analyses leverage the random assignment of election observers to 1,049 polling stations located in a nationally representative sample of 90 constituencies. Since these polling stations already had observers assigned by other domestic monitoring organizations, our results speak to the marginal impact on electoral fraud of having an additional observer. We find that polling stations to which an additional observer was deployed had systematically lower rates of turnout and overvoting, and fewer votes for the presidential candidate who ultimately won the election—all results consistent with the deterrence of electoral fraud by the presence of the additional observer. We also find that the presence of the additional observer increases the likelihood that election results are not publicly posted, and that the non-posting of results is associated with an increased likelihood of aggregation fraud on behalf of the winning party, which we measure by comparing polling station-level election tallies with the official results reported by the Malawi Electoral Commission. We interpret this finding as suggesting that the presence of the additional observers may have displaced fraud from election day to the aggregation phase, and that the non-posting of the results may have been part of a conscious strategy to mask these efforts.
2
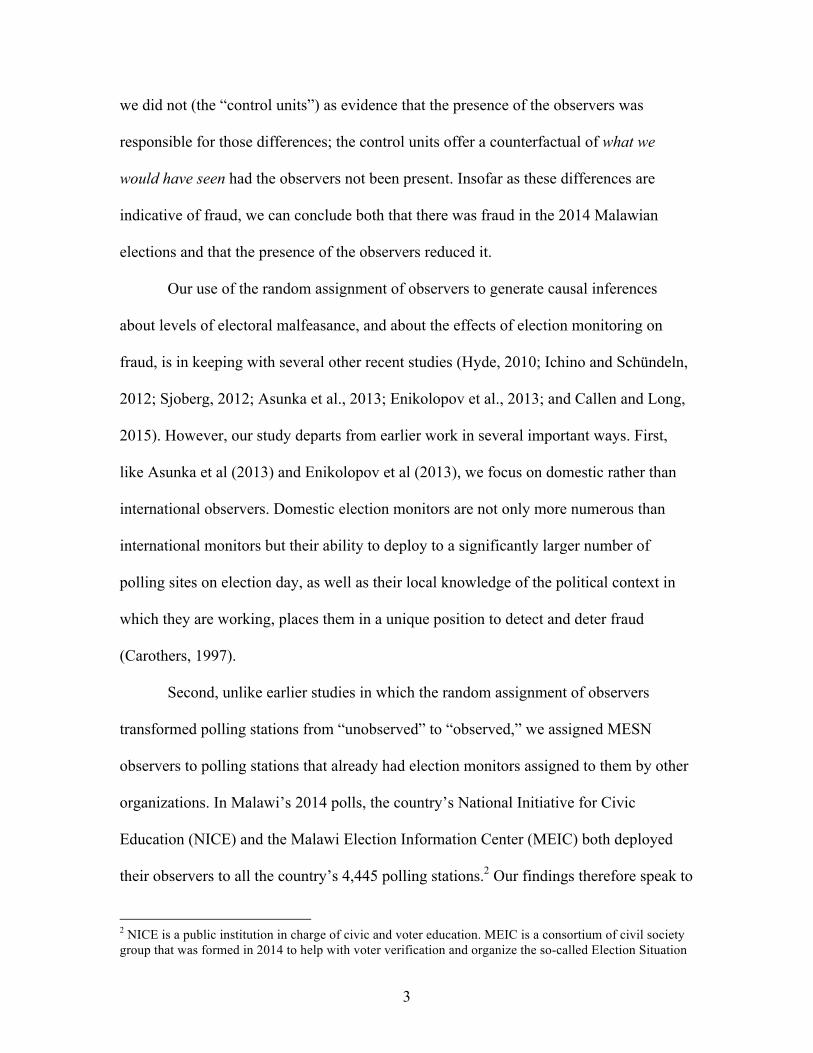
Over the past thirty years, millions of citizens have participated in nonpartisan
election observation efforts to safeguard the integrity of their countries’ elections.1 These
efforts, which complement those of international monitors, have been shown to reduce
electoral fraud in a variety of settings (Hyde, 2007 and 2010; Ichino and Shündeln, 2012;
Kelley, 2012; Enikolopov et al, 2013; Asunka et al, 2013 and 2015). We study the impact
of domestic election monitors on fraud in Malawi’s 2014 elections.
Studying electoral fraud is challenging because its perpetrators have strong
incentives to hide their actions and because the parties and candidates that lose the
election have incentives to falsely accuse the victors of having won by fraudulent means.
Hence basing one’s analysis on reports of electoral malfeasance is problematic.
Furthermore, even if one were able to reliably detect fraud when it has taken place,
attempts to identify the factors responsible for it are often difficult. For example, an
association between fraud and high levels of electoral competition could be due to a
genuine causal effect of competition on incentives to rig the vote or, equally plausibly, to
the greater likelihood that parties and candidates’ agents will file complaints with election
authorities to gain a marginal advantage in a tight race. Similarly, an association between
fraud and urban location might be due a greater ability of parties to carry out election
rigging in densely populated areas or because media coverage is better, and hence reports
of fraudulent activities are more likely.
To overcome these key challenges, we leverage the power of randomization. In
partnership with Malawi’s prominent independent election observation group, the Malawi
Electoral Support Network (MESN), we randomly assigned election observers to polling
stations. This permits us to take any difference we detect in average outcomes between
the polling stations to which we sent observers (the “treated” units) and those to which
1 See http://www.gndem.org/aboutgndem, accessed January 3, 2015.
3
we did not (the “control units”) as evidence that the presence of the observers was
responsible for those differences; the control units offer a counterfactual of what we
would have seen had the observers not been present. Insofar as these differences are
indicative of fraud, we can conclude both that there was fraud in the 2014 Malawian
elections and that the presence of the observers reduced it.
Our use of the random assignment of observers to generate causal inferences
about levels of electoral malfeasance, and about the effects of election monitoring on
fraud, is in keeping with several other recent studies (Hyde, 2010; Ichino and Schündeln,
2012; Sjoberg, 2012; Asunka et al., 2013; Enikolopov et al., 2013; and Callen and Long,
2015). However, our study departs from earlier work in several important ways. First,
like Asunka et al (2013) and Enikolopov et al (2013), we focus on domestic rather than
international observers. Domestic election monitors are not only more numerous than
international monitors but their ability to deploy to a significantly larger number of
polling sites on election day, as well as their local knowledge of the political context in
which they are working, places them in a unique position to detect and deter fraud
(Carothers, 1997).
Second, unlike earlier studies in which the random assignment of observers
transformed polling stations from “unobserved” to “observed,” we assigned MESN
observers to polling stations that already had election monitors assigned to them by other
organizations. In Malawi’s 2014 polls, the country’s National Initiative for Civic
Education (NICE) and the Malawi Election Information Center (MEIC) both deployed
their observers to all the country’s 4,445 polling stations.2 Our findings therefore speak to
2 NICE is a public institution in charge of civic and voter education. MEIC is a consortium of civil society group that was formed in 2014 to help with voter verification and organize the so-called Election Situation

4
the impact on fraud of having an additional election observer. To our knowledge, this is
the first study to examine the marginal effect of an additional election observer on
electoral fraud.
Third, we explore a different kind of spillover than that examined in prior work.
Several recent studies investigate how the effect of an observer at one polling station may
spill over to adjacent polling stations, either by displacing malfeasance from the observed
to the unobserved units (Ichino and Schündeln, 2012) or by creating a sense of
heightened scrutiny that deters fraud in nearby, unobserved polling stations (Enikolopov
et al., 2013; Callen and Long, 2015). By contrast, we study spillover not across polling
stations but over time across different stages of the election process. By combining our
analysis of the effect of an additional observer on election day fraud with an analysis of
irregularities at the aggregation stage—the stage that follows the end of voting when
polling station-level returns are combined at the district and national levels to generate
the final, official tallies—we provide evidence that the presence of an additional election
day observer pushed the fraud from election day to the next phase of the electoral
process. This is a novel finding, and it has implications for how we think about the
equilibrium effect of election monitoring.
We conducted our study in a nationally representative sample of 90 out of
Malawi’s 193 electoral constituencies. Together, these constituencies contained a total of
2,044 polling stations. MESN deployed observers to a random sample of 1,049 of them
(about 51%). We then randomly selected 806 of the remaining 995 polling stations to
serve as our control units, bringing the total number of polling stations in our sample to
1,855. We used a standard instrument to collect both qualitative and quantitative
Room on election day. The objectives of these two groups were to improve citizens’ participation in the election process and to alert the election authority of potential threats to the integrity of the election process.
5
information about the election processes and the vote count in our sample of polling
stations. This checklist was completed by the MESN observers in our treated units and by
trained research assistants, who visited the polling stations and interviewed party agents
and election officials after the close of polls, in our control units. A subset of our research
assistants also visited both treated and control polling stations during the period between
the close of counting and two days after to record whether election officials had publicly
posted the election results at polling centers, as is required under section 93(3) of
Malawi’s Parliamentary and Presidential Elections Act (1998).
We also gained access to the final polling station results submitted to Malawi’s
electoral authority by local election officials. In the absence of manipulation by local
election officials during the transmission of results from polling stations to the national
tally center, these results should match with those collected by our observers and research
assistants at polling stations. Thus, access to these transmitted results allows us to
investigate potential aggregation fraud in the presidential polls, and to explore possible
mechanisms through which fraud occurs.
Our analyses employ three measures of election fraud. The first two measures,
overvoting and turnout, are constructed by adding the number of valid and invalid votes
cast at a polling station and dividing the total by the number of registered voters, as
provided by the Malawi Electoral Commission (MEC) prior to the polls. Turnout is
simply this quotient. High (or low) turnout is, of course, not in itself a measure of
electoral malfeasance. But if turnout is systematically higher in control polling stations
than in treated polling stations then it strongly suggests that the presence of MESN
observers reduced manipulations that took place in untreated units. It is the comparison
of turnout levels across treated and control units, not the level of turnout in any individual
polling station that provides the evidence of fraud. Overvoting is a dummy variable that

6
takes a value of one when the total number of votes cast exceeds the number of registered
voters, and a zero otherwise.3
Our third measure of fraud is the vote share of the Democratic Progressive Party
(DPP) presidential candidate. As explained in further detail below, while the DPP was
not the ruling part at the time of the election, the ruling party, the PP, had been formed
just two years earlier. As the party that had been in power for eight of the prior ten years,
the DPP was the party with the deepest connections to the state’s bureaucratic apparatus,
the strongest grassroots organization, and hence the greatest capacity for vote rigging. It
is therefore sensible to use DPP vote share as an indicator of electoral fraud. As with
turnout, fraud is indicated not by the level of DPP presidential vote share in any
particular constituency but by statistically significant differences between treated and
control units.
In addition to these direct measures of fraud, we also test whether administrative
irregularities occurred with different frequencies at treated and untreated polling stations.
Although we collected information about multiple election day administrative processes,
we focus in our main analyses on a dummy variable that takes a value of one if the
presidential result sheet was publicly posted at the polling station and a zero otherwise.
Unlike our other indicators of administrative irregularities, which were collected in
different ways in treated and control units (by MESN observers in the former and by our
research assistants, arriving a day later and asking retrospective questions of people who
had been present during the polling, in the latter), this measure was collected the same
3 As it is constructed, this measure is highly conservative because it assumes that no fraud has occurred as long as turnout is below 100 percent. As a robustness check, we therefore adopt an alternative measure in which we define overvoting as an instance in which the turnout rate at a polling station is more than two standard deviations higher than the average turnout rate within the constituency. As we show in Appendix Table C.1, our results are robust to the use of this alternative measure.

7
way in all units, and thus can be compared across treated and untreated polling stations
without fear of mistaking a treatment effect for discrepancies stemming from differences
in our measurement strategies.4
Our results are threefold. First, we find that the presence of an additional election
observer is associated with a significant reduction in election day fraud. Polling stations
to which MESN observers were randomly assigned had rates of overvoting that were, on
average, 3 percentage points lower than at other polling stations, turnout rates that were,
on average, 3.6 percentage points lower, and levels of support for the DPP presidential
candidate that were, on average, 2.8 percentage points lower. These are substantively
large effects, and they are all consistent with the interpretation that the presence of the
additional observer reduced fraud.5
Second, we find that the impact of an additional election observer varies across
constituency types, with the greatest impact in polling stations located in urban
constituencies and, for our turnout and overvoting measures, in polling stations located in
constituencies that are dominated by a single political party. This latter finding is
consistent with the interpretation that local dominance by a single party creates greater
opportunities for that party to commit fraud. The impact of observers on DPP presidential
vote share, by contrast, is greatest when local inter-party competitiveness is high. We
speculate that this is because such competitiveness creates incentives for candidates
competing at the parliamentary level to commit fraud, and such malfeasance leaks into
4 A comparison of means between treated and control stations for several of these other measures is provided in the Appendix Table D.1. 5 We note that our research design does not allow us to explicitly estimate or correct for possible spillover effects to unobserved polling stations. If the presence of an observer displaces fraud to adjacent polling stations, then our estimates may be biased upward. On the other hand, if observers deter fraud at adjacent unobserved stations, our estimates may be too low. Since our study measures the impact of an increase in observer presence at polling stations, such spillovers may be of less concern because all stations are observed.
8
the results in the presidential polls, which are held concurrently.
Third, contrary to expectations, we find that the presence of an additional
observer is associated with lower compliance by election officials with administrative
regulations meant to promote electoral transparency. In particular, we find that election
officials are 6 percentage points less likely to post the presidential results sheets at polling
stations to which an additional observer was deployed—a 13 percent decrease from the
baseline rate of 46 percent. We also find that the non-posting of results was more likely
in the DPP’s southern region stronghold and in polling stations in which the MEC’s
official results award the DPP a higher share of the vote.
These somewhat puzzling findings begin to make sense when we examine
discrepancies between the polling station-level tallies for the DPP collected by our
observers and research assistants and the official results released by the government,
which we interpret as evidence of possible aggregation fraud. Although the two sets of
results diverge only roughly 20 percent of the time, most of these divergences result in
higher vote totals for the DPP. Moreover, the divergences are especially likely to occur in
polling stations where the election results were not publicly posted. Taken together, these
patterns suggest that not posting the results may have been part of a strategy to mask the
aggregation fraud, which, in turn, was a response to the presence of the additional MESN
observer at the polling station. The implication is that the presence of the observer may
have displaced the fraud from election day to the next (aggregation) phase of the electoral
process.
The setting
Several aspects of the Malawi case make it a likely environment for electoral
fraud, and hence an advantageous setting for studying the impact of observers on
9
reducing such fraud. First, the country employs a first-past-the-post (FPTP) electoral
system for parliamentary contests, which is associated in the literature with higher levels
of election malfeasance (Birch, 2007). The incentives for manipulation that arise from
such a system at the parliamentary level are reinforced by the competitive nature of the
country’s presidential elections. Although Malawi’s main political parties have
traditionally had regional strongholds in which each party’s dominance is assured, the
closeness of national elections encourages them to do whatever they can—intimidation,
ballot stuffing, multiple voting, etc.—to increase their vote share even in the areas where
they can be assured of victory.
The country's constitution also grants the executive substantial powers that, in the
past, have been used to tilt the electoral playing field in favor of the ruling party (Smiddy
and Young, 2009). Especially important is the executive’s power over the Malawi
Electoral Commission (MEC), whose chairperson and members are appointed by the
president.6 Moreover, the MEC relies on civil servants such as district commissioners and
schoolteachers, also formally under the direct control of the executive, to act as returning
officers and polling station staff. This makes the election processes susceptible to
manipulation (Pastor, 1999).
Malawi is also one of the poorest countries in the world, with a GDP per capita of
$220 in 2013. According to Malawi’s 2010/2011 Integrated Household Survey (IHS),
more that half (50.7%) of the country’s population is poor and more than 80 percent lives
in rural areas. Scholars often find an association between these conditions and election
manipulation tactics such as vote buying (Kitschelt and Wilkinson, 2007; Stokes et al.,
2013). Together, these political, institutional, and socio-economic factors make Malawi a
likely place for electoral malfeasance, and thus a “hard test” for the impact of domestic
6 Cross-national studies show that a lack of independence of electoral bodies from the executive is associated with lower levels of electoral integrity (Hartlyn, McCoy and Mustillo, 2008).
10
election observation.
Malawi’s 2014 general elections
Malawi’s 2014 general election was the country’s fifth following its transition to
multi-party politics in 1994. For the first time, voters simultaneously cast ballots for
president, members of parliament, and local government councilors—hence the election’s
designation as the country’s first tripartite elections.7 Although twelve candidates
contested the 2014 presidential elections, 98 percent of the presidential votes were
divided among the candidates from just four parties: Peter Mutharika of the Democratic
People’s Party (DPP), Joyce Banda of the People’s Party (PP), Lazarus Chakwera of the
Malawi Congress Party (MCP), and Atupele Muluzi of the United Democratic Front
(UDF).8
The elections took place against the backdrop of the death in office, two years
earlier, of President Bingu wa Mutharika of sudden cardiac arrest. Mutharika was
succeeded by his vice president, Joyce Banda, with whom he had publicly feuded over
his attempts to promote his brother, Peter, as his successor. Banda had been briefly
expelled from the party but was reinstated when the constitutional court ruled that her
removal had been illegal. She subsequently started her own political party, the PP and
remained deeply at odds with Mutharika until his death (Dionne and Dulani, 2013). Her
succession as President was strongly (but unsuccessfully) opposed by Mutharika’s
7 Previous general elections were held in 1994, 1999, 2004, and 2009. In these elections only the presidential and parliamentary elections were held on the same day. The only local government elections were held in 1999. The president, who until 2012 held the power to determine when local government elections were held, had postponed these elections several times, citing a lack of funds, the absence of a legal framework to guide the operation of the local government, and allegations of fraud against the national election authorities (Chirwa, 2014). Thus, the 2014 local government elections were the second such contest since 1994. 8 See official results here: http://www.mec.org.mw/Home/tabid/36/Default.aspx, accessed January 25, 2015.
11
supporters.9
The 2014 election offered Banda the chance to retain the presidency through a
popular election on her own party’s ticket. A few months before the polls, however, her
government was faced with a major corruption scandal that weakened her popularity and
forced development partners to withhold their support (Chirwa, 2014; Logan, Bratton and
Dulani, 2014). Combined with her new party’s lack of grassroots organizational capacity,
the scandal undermined many of the advantages that Banda would have enjoyed by virtue
of her incumbency. The race with Chakwera’s MCP and Mutharika’s DPP—which had
been the ruling party for most of the previous decade—was therefore highly competitive.
The elections took place on May 20, 2014. Despite of MEC’s attempts to conduct
clean elections, the 2014 contest was characterized by logistical bottlenecks,
administrative breakdowns, and allegations of fraud.10 For example, although the voters’
list was revised ahead of the polls, it was made available to parties and civil society
groups only a few days prior to the election.11 On election day, there were delays in the
delivery of election materials, late opening of polling stations, and the delivery of wrong
ballots to some polling stations—the latter of which led to violent demonstrations in
Blantyre and Lilongwe and the cancellation of the polls at some polling centers. In his
announcement of the official election results, MEC’s chairperson, Justice Maxon
Mbendera, conceded that there were serious irregularities. Some parties and candidates
even went so far as to seek court rulings to either annul the presidential elections or to
obtain a recount of the ballots.
On May 24, 2014 President Banda issued an order to annul the presidential polls
9 Chapter VIII (83(4)) of Malawi’s 1994 Constitution provides for the vice president to be sworn in as president following the death of the president (i.e., vacancy of the presidency). 10 See, for example: “MEC Suspends (Polling Station) Officials for Alleged Corruption,” Daily Nation, May 18, 2014; “Lilongwe CEO Resigns as Elections Coordinator,” The Daily Times, May 20, 2014. Further details of election-day irregularities are provided in MESN (2014). 11 See “MESN to Deploy 7,000 Monitors on Election Day,” Sunday Times (National), May 18, 2014.

12
alleging “serious irregularities" in the counting and announcement of results. She called
for a fresh vote in which she would not contest.12 MEC opposed the President’s directive
and obtained a High Court order that declared it unconstitutional and allowed MEC to
continue tabulating the poll results. However, other parties and candidates followed with
fresh court petitions. Under Malawi’s law, MEC had eight days after the polls to declare
the results. In a dramatic decision released just 90 minutes prior to the deadline, the High
Court ruled that MEC could declare the presidential results. It did so on May 30. Peter
Mutharika was named the winner with 36.4 percent of the votes, although his party, the
DPP, failed to gain a majority in the national assembly. Lazarus Chakwera (MCP) came
second with 27.8 percent of the votes, while Banda received 20.2 percent of the vote in
the third place.13
Domestic election observers in the 2014 tripartite election
Although a handful of international observers were present during Malawi’s 2014
elections, the vast majority of election monitors were deployed by three different
domestic organizations: NICE, a public institution, MEIC, an initiative by key civil
society organizations and academics, and MESN, with whom we partnered. While NICE
and MEIC deployed observers to monitor activities at every polling station in the country,
MESN deployed observers to just 2,300 of the country’s 4,445 polling station. MEIC also
set up an Election Situation Room at which they collected real-time information on
possible threats to election integrity.
Our study examines the impact of MESN’s deployment of polling station
observers in the subset of constituencies in which we controlled (and randomized) their
12 http://www.voanews.com/content/malawi-president-annuls-election-orders-fresh-vote-in-90-days/1921639.html, accessed May 23, 2014. 13 In the parliamentary race, the DPP won 50 seats, followed by the MCP with 48. The PP won 26 and the UDF won 14. Independent candidates won 52 seats. The remaining 3 went to other smaller parties.

13
placement. Since polling stations that received a MESN observer already had observers
present from NICE and MEIC, our intervention introduced exogenous variation in the
number of observers at each polling station. In our setting, this is important because
polling stations were divided into streams (described further below) and the deployment
of more observers ensured that either all streams were covered or, when a polling station
contained more than three streams, covered a larger share of them, thus further increasing
the chances that fraud was deterred.
Election observers and electoral malfeasance: theoretical expectations
The core premise of election observation—both international and domestic—is
that the presence of observers will promote democracy by detecting and deterring fraud,
thus building citizens’ confidence in the electoral process (Carothers, 1997; Bjornlund,
2004). Election fraud is defined broadly to include all activities aimed at influencing the
outcome of an election (Lehoucq, 2003). These include activities undertaken before the
election (such as the illegal use of government media or other resources during the
campaign; fraud in registration; vote buying; and the creation of other obstacles for
opposition parties to compete freely), on election day (such as multiple voting, ballot
stuffing, the intimidation of voters, and the late opening of polling centers in areas of
opposition strength), and at the aggregation stage (involving the altering of polling
station-level tallies after they have been submitted to the district, regional, or national
counting center). We study the second and third of these stages, as well as the interaction
between the two.
Regarding election-day fraud, scholars and practitioners believe that the physical
presence of observers at polling stations may reduce fraud by decreasing the chances that
party agents and co-opted election officials will openly manipulate the polls (Hyde,

14
2009). Since violations of election day procedures are criminal acts, the presence of
neutral observers at polling sites for the entire duration of polls is likely to increase
compliance with electoral regulations and reduce the level of fraud. Even if prosecution is
unlikely, individuals have been shown to behave differently when being watched,
especially when their actions are illegal or socially objectionable (Gerber, Green, and
Larimer, 2008). Empirical studies—including a growing number, like ours, that employ
the random deployment of observers to generate inferences about the causal effects of
election monitoring—generally support these claims (see Hyde and Pallister 2014 for a
recent review), and, today, domestic groups deploy observers to almost all polling
stations during most national elections, sometimes duplicating efforts within the same
country. As noted, Malawi is one such country where multiple domestic observation
efforts overlap with one another. We therefore investigate whether increasing the
intensity of observation at a polling station by assigning an additional observer further
decreases the incidence of fraud. We also explore whether the presence of the additional
observer makes election officials more likely to comply with election regulations such as
checking voters’ names, inking their fingers, and publicly posting the election results—a
practice designed to reduce the likelihood of rigging at the aggregation stage.
We would not, however, expect the degree of fraud and administrative
irregularities (and thus the deterrent effect of election observers) to be the same at every
polling station. To orchestrate fraud, parties need the complicity of both local party
activists and local election officials. Party activists commit fraud by transporting voters to
multiple polling stations to cast illegal ballots, by co-opting local election officials to
allow illegal voting and/or ballot stuffing, or simply by convincing those officials to
miscount the cast votes. Hence we would expect the degree of fraud to vary across
locations with the success of such activities. This success, in turn, is likely related to the
15
density of the party’s local social network as well as the presence of physical
infrastructure such as road and telecommunication networks that facilitate the flow of
information and the transportation of voters (Ziblatt, 2009; Weidmann and Callen, 2013;
Asunka et al., 2015).
Levels of local political competition and urbanization may also affect the degree
of election day fraud (and hence the effect of observers). On the one hand, more
competitive areas (a consideration that, we note, only makes sense in a system, like
Malawi’s, with low district magnitudes) may generate stronger incentives for parties to
commit fraud, since the marginal value of each additional vote is greater in a closer race.
But this logic is only relevant for parliamentary races. In the presidential contest, where
the winner is determined based on the total number of votes he/she wins across the
country as a whole, a vote at one polling station is equally valuable as a vote in any other,
so the motivation for committing fraud will not vary across constituencies that, at the
parliamentary level, are more or less competitive. However, since less competitive areas
are likely to be party strongholds, the opportunity to commit fraud in support of the
presidential candidate may be greater. Local competitiveness therefore cuts both ways.
Urbanization may also have opposing effects. On the one hand, urban areas will have a
denser road and communications infrastructure and are likely to be more electorally
competitive at the parliamentary level. Both of these characteristics will likely lead to
greater incentives for committing fraud. On the other hand, urban areas are less likely to
be party strongholds, which implies that the opportunity for electoral malfeasance may be
more limited.
Electoral fraud may also occur after election day at the aggregation stage:
between the time that election results are finalized at the polling station-level, in the
presence of independent and party-affiliated observers, and the time they are combined

16
with other polling station-level results at the constituency and national levels to determine
the winners of the parliamentary and presidential races. This type of fraud, which can be
detected by comparing polling station-level tallies with the formal results announced by
MEC, can only be committed by parties and candidates who have close relationships with
electoral officials at the district, regional, or national counting centers. Hence we would
expect aggregation fraud to be most likely to favor candidates running on the ticket of the
party with the closest connections to the electoral bureaucracy.
Spillover
One of the most interesting aspects of the recent literature on the impact of
election observation is the analysis of spillover effects. Drawing on data from Ghana’s
2008 voter registration exercise, Ichino and Schündeln (2012) find evidence that
observers displaced fraud from observed to unobserved polling stations, likely because
party agents intent on committing fraud at one polling station were dissuaded by the
presence of the observer and moved on to a nearby polling station. The implication is that
estimates of the effect of observers based on a comparison of fraud at observed and
unobserved polling stations may be inflated, since the effect of the observation is
simultaneously to drive down the levels of fraud at the observed units and to push up the
levels of fraud, via displacement, at the (nearby) unobserved units.
But evidence for a different kind of spillover exists as well. Studies of electoral
fraud in both the 2010 parliamentary election in Afghanistan (Callen and Long, 2015)
and the 2011 parliamentary election in Russia (Enikolopov et al., 2013) find that the
presence of observers at one polling station deterred fraud in nearby unobserved stations,
likely because party agents or election officials interpreted the presence of the observer at
the nearby station as indicating heightened oversight more generally. Such spillover
17
would lead to an underestimate of observers’ effect on fraud by reducing fraud in both
observed and unobserved units.14
Both our research design (which did not involve varying the saturation of
observers in each constituency) and the setting we study (in which all polling stations had
at least two observers) make it difficult to test directly for spillover effects in our study.15
However, our data do put us in a position to investigate a different—and novel—form of
spillover across phases of the electoral process. Specifically, we test whether aggregation
fraud is more or less likely in polling stations that received an additional MESN observer.
While the presence of the extra observer might deter fraud altogether (leading to an
expectation of a negative association between the presence of a MESN observer and
aggregation fraud), it might also displace the fraud to the next stage of the electoral
process (in which case the association between the presence of the MESN observer and
aggregation fraud would be positive).
Research design
Our study leverages MESN’s random assignment of observers to polling stations
in a nationally representative sample of 90 electoral constituencies. These constituencies
are distributed proportionally across the country’s three regions and were selected so as
to be representative in terms of levels of electoral competition (proxied by the average
vote margins in the 1999 and 2004 legislative polls), population density, literacy,
percentage of rural population, and unemployment rates.16
14 As with the effect of election observers more generally, these spillover effects may vary with local conditions. For example, Asunka et al. (2015) find suggestive (but not statistically significant) evidence that whether observers displace fraud to adjacent units or deter it may depend on factors such as the levels of local political competition and urbanization. 15 Our original project design did call for varying the saturation of MESN observers across constituencies to generate estimates of spillover effects, as in Asunka et al. (2013). But MESN was, in the end, unwilling to adopt this aspect of our design. 16 Tables A.1 and A.2 in the appendix provide descriptive statistics of our sampling frame and sample.

18
The 90 constituencies contain 2,044 of the country’s 4,445 polling stations.
MESN deployed observers to a random sample of 1,049 of the 2,044.17 Each polling
station is divided into streams—individual polling centers nested within stations with a
separate queue, voter registration book, ballot box, and suite of polling station agents. For
example, a primary school serving as a polling station might have a separate streams in
each classroom. The number of streams per polling station in our sample ranges from 1 to
19, with an average of 2.6. MESN observers received formal training and accreditation
from MEC, which they were required to confirm with the head polling station agent upon
arrival at their assigned polling place on election day (the head polling station agent was
provided with the observer’s name in advance). This accreditation gave the observer the
right to access information from election officials and to observe proceedings at the
polling station. In instances where the polling station contained more than one stream,
MESN observers were instructed to select one of the streams and to remain at that stream
from the opening to the close of the polls, when the ballots were publicly counted. At the
close of counting, MESN observers recorded the official presidential results for the entire
polling station, not just the stream they personally observed. MESN observers wore
uniforms that identified their status and affiliation. To measure the impact of their
presence, we randomly selected 806 out of the 995 remaining stations to serve as our
control units. Our final sample is therefore 1,855 polling stations.18
To measure the level of irregularities and fraud at the polling stations they
observed, MESN asked its observers to complete a standardized instrument (i.e.,
17 MESN classified its observers into two main groups: PVT observers and short-term observers (STOs). For monitoring purposes, these two types of observers received the same training and, on election day, stayed at the polling station for the entire duration of the polls. The only difference between the to types is that PVT observers submitted their reports in real time using SMS technology while the STO used pen and paper to submit their reports. In our sample, 368 of the 1,049 observers were PVT observers. 18 Treated and control polling stations are balanced on two key pre-treatment variables: the number registered voters and the number of polling streams. This provides confidence that our randomization worked. See Appendix Table B.1.
19
checklist) at each polling station. The checklist included both qualitative information on
election day processes (for example, whether the polls opened on time, whether a voters’
list was present and whether voters were verified on the list, and the availability of voting
materials such as ballot papers, ballot boxes, ballot box seals, and indelible ink) and
quantitative information such as the number of valid and invalid votes cast and the
number of votes won by each candidate.19 A copy of the checklist is provided in
Appendix D.
A central dilemma in studying the impact of election observers stems from the
fact that the observers play two roles: they are the treatment whose impact is being
investigated and they are the agents who collect the data from which inferences about
their impact can be made. How, then, to collect similar qualitative and quantitative
information at the control stations, where observers are not sent? The approach employed
by most researchers (with notable the exception of Asunka et al. (2015)) is to compare
outcomes in treated and control units using polling station-level data from election
management bodies. A problem with this strategy is that such data are not always
available. More important, even if they are available, they are susceptible to manipulation
between the time votes are tallied at the polling station and when they are recorded in the
official results—a vulnerability that we demonstrate below. Also, such data are far less
rich than the information that can be collected at the polling station itself by agents with a
comprehensive checklist such as the one we employed.
To circumvent this challenge, we trained and deployed 200 research assistants to
our control polling stations.20 The research assistants were each instructed to complete
19 Currently, MESN has only provided us with access to the random set of stations where PVT observers were deployed, and our analyses are based on that sub-sample. However, since polling stations that received PVT observers and STOs were selected at random, our results can be considered to be based on a random sample of treated units. Future versions of this paper will fold in the results from the other polling stations. 20 The research assistants were recruited from IPA-Malawi’s regular pool of enumerators.
20
the MESN checklist in four pre-assigned polling stations by interviewing a minimum of
two political party agents or election officials. To minimize the chance that the research
assistants would be confused for MESN observers, and thus “treat" our control stations,
they were instructed to visit their assigned polling stations only after the polls had closed
and counting had been completed (in some cases, the interviews with party agents and
election officials did not take place until the next morning). In addition, unlike MESN
observers, our research assistants did not wear identifiable T-shirts; they only identified
themselves through their MEC accreditation cards, and only when it was necessary to
secure cooperation to conduct their interviews. Finally, we obtained our research
assistants’ accreditation from the MEC’s national offices in Blantyre and distributed them
through our regional coordinators. This ensured that, unlike MESN observers who
obtained their accreditation on election day at their assigned polling centers, polling
officials did not know our research assistants would visit their polling stations until after
close of counting.
We also trained 60 of our 200 research assistants to visit polling stations after the
polls had closed to note whether the election results had been posted. The research
assistants undertook this task during the three days following the elections and were able
to cover 1,271 polling stations (out of 1,855).
Estimating election day fraud and irregularities
Our research design and data collection protocols allow us to estimate possible
vote manipulation during voting on election day.21 These manipulations may occur
through, for example, multiple voting, ballot stuffing, or the casting of ballots by illegal
voters. As explained earlier, we employ three principal measures to investigate the impact
21 Our data also permit us to examine aggregation fraud that may have taken place during the days that followed the election, but these analyses are non-experimental, and are therefore discussed separately.

21
of observers on such activities: overvoting, turnout, and DPP presidential vote share.22
We estimate the treatment effect of an additional MESN observer by comparing
average outcomes in treated and control polling stations. To improve the precision of our
estimates and to control for chance imbalances, we use a linear probability model and
control for polling station sizes. Polling station size may be important insofar as it is
correlated with the number of streams, and hence the number of ballot boxes that may be
tampered with (and that observers must monitor).23 Accordingly, we define outcomes for
polling station i as Yi. Ti = t, t ∈ {treated = 1, control = 0} is our treatment variable. Thus,
we estimate:
𝑌! = 𝛼 + 𝛽!𝑇! + 𝛽!𝑋! + 𝜀!
where Xi is the number of registered voters for polling station i, and εi is our unobserved
random error term. Later, we also estimate possible heterogeneous effects of adding an
additional observer by disaggregating our analysis by levels of constituency-level
electoral competition and population density (our measure of the level of urbanization).
Results
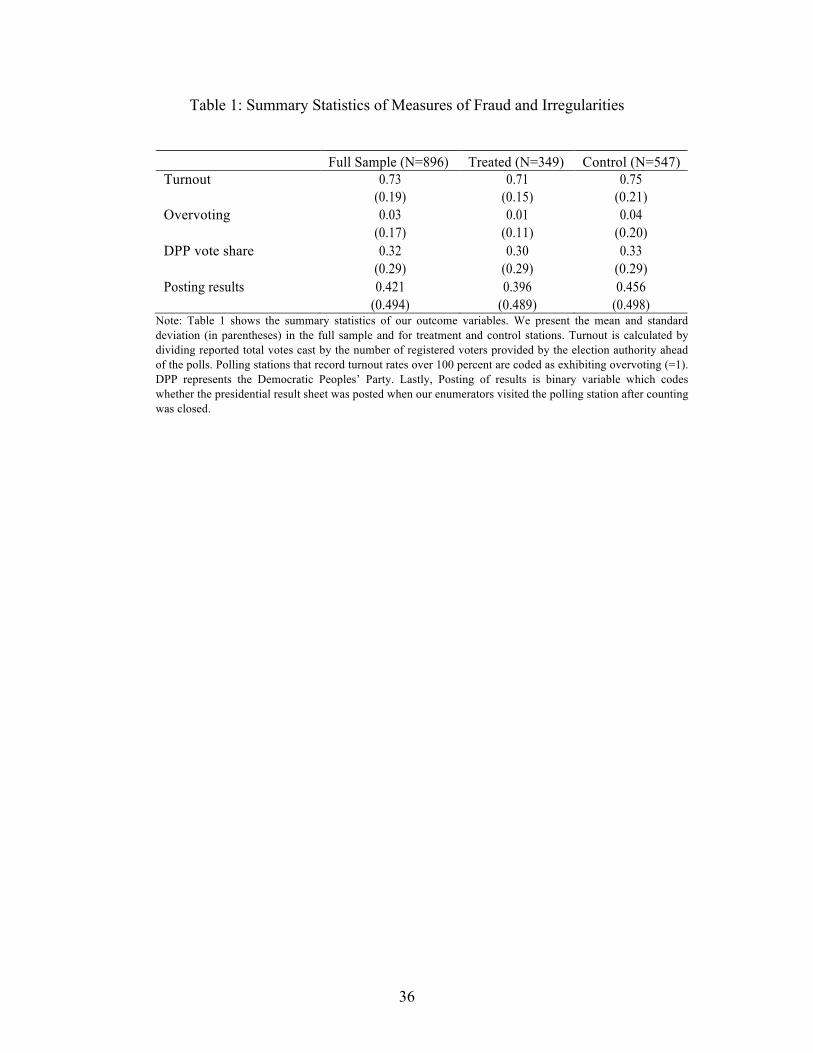
Table 1 shows the summary statistics of our outcome variables at the polling
station level. We estimate the mean of reported turnout rates to be about 73 percent, and
find that 3 percent of polling stations exhibit overvoting. The DPP received 32 percent of
the valid votes cast.
[Table 1 Here]
Comparing outcomes in treatment and control stations, we find that turnout was
four percentage points higher in control stations than in stations where the NICE and
22 Analogous measures are used in other studies of electoral fraud (e.g., Beber and Scacco, 2008; Myagkov, Ordeshook and Shakin, 2009; Herron, 2010; Hyde, 2007; Sjoberg, 2012; Asunka et al., 2013). 23 Our substantive results are unchanged if we drop the control for polling station size, although some of our estimates become less precise.
22
MEIC observers were supplemented by a MESN observer. Similarly, the proportion of
stations recording overvoting was three percentage points lower in polling stations in
which the additional MESN observer was present. The DPP’s vote share was also three
percentage points lower, on average, in polling stations to which MESN observers were
sent. These results provide preliminary evidence that the presence of the MESN
observers reduced the incidence of electoral fraud.
Our measure of administrative irregularities points in the other direction,
however. Although results were posted in 42 percent of the 1,271 polling stations that our
research assistants visited—a somewhat surprising finding given that posting results was
mandatory—they were less likely to be posted in polling stations to which MESN
observers had been sent (40 percent) than in polling stations to which they were not sent
(46 percent).24
Table 2 presents our results on the effect of MESN observers on our three
measures of fraud at polling stations: overvoting, turnout rates, and DPP vote shares. In
our regressions, we control for the number of registered voters (logged) because in our
case the size of the polling station (proxied by the number of voters) shapes the number
of streams at a polling station, and hence may affect both the level of fraud and the
impact of observers.
[Table 2 Here]
The results indicate that the addition of a MESN observer is indeed associated
with a reduction in fraud. In column 1, the coefficient on the treatment variable shows
that an additional observer reduces the rates of overvoting by 3 percentage points, a
fourfold decrease. Similarly, an additional observer reduces reported turnout rates by 3.6
24 The 42 percent baseline rate of posting compares favorably to Uganda, however, where Callen et al (forthcoming) report that 77.5 percent of voting tallies (which, as in Malawi, are required to be posted under local election law) were missing.
23
percentage points (column 2), a nearly 5 percent decrease off the base rate of 75
percent.25 Finally, in column 3, the presence of an additional observer at the polling
station reduces the reported DPP vote share by roughly 3 percentage points, an 8.5
percent decrease.26
Next, in line with our theoretical discussion earlier, we consider whether the
impact of an additional observer varies across different types of polling stations.
Specifically, we test whether there are differences across polling stations in urban and
rural constituencies and in constituencies with different levels of electoral competition.
We proxy for the level of urbanization by using a measure of population density. We
measure electoral competition by average margins of victory in two prior legislative
elections. We divide these variables into terciles to capture any non-linearity in effects.
The upper panel of Table 3 displays the effects of treatment across different levels
of population density. First, we consider the effect of an additional observer on
overvoting. The coefficients on the treatment variable in columns 1, 4 and 7 display these
results. The coefficient in column 7 (6.3 percentage points) is roughly three times larger
than the coefficients in columns 1 (2.5 percentage points) and 4 (1.3 percentage points),
and neither of the latter are statistically different from zero. This suggests that an increase
in the number of observers at a polling station had a much greater impact on reducing
overvoting in more urban compared to more rural constituencies. We find similar effects
with respect to turnout: the coefficients in columns 5 (5.8 percentage points) and 8 (4.7
percentage points) suggest that adding an observer has roughly the same effect on
reducing turnout in medium to high urban constituencies, but lower effects in rural
constituencies (1.1 percentage points, but statistically indistinguishable from zero, in
25 As noted, our results are also robust to analysis using the alternative approaches to coding overvoting, as described above (see Table C.1 in the appendix). 26 This coefficient is significant only at the p<.1 level.

24
column 2). Finally, the impact of observers on DPP vote share across different levels of
urbanization is shown by the treatment coefficients in columns 3, 6 and 9. Again, the
coefficient in column 9 (7.6 percentage points) is more than three times higher than those
in columns 3 (2.1 percentage points) and 6 (0.1 percentage points), and neither of the
latter are statistically different from zero. This suggests, again, that an additional observer
has a greater impact on reducing fraud in more urban constituencies. As suggested
earlier, this tendency may stem from the enhanced ability of parties to carry out fraud in
environments with well developed transport and communications infrastructure.
[Table 3 Here]
Next, we consider the effect of our treatment on markers of fraud across different
levels of electoral competition (lower panel of Table 3). First, we consider the effect of
an additional observer on overvoting and turnout. The coefficients on the treatment
variable in columns 1, 2, 4, 5, 7, and 8 show these results. The estimated size of the
treatment effects where competitiveness is low (columns 7 and 8; 4.0 and 5.8 percentage
points, respectively) are much larger and more statistically significant than those where
competitiveness is high or medium (columns 1, 2, 4 and 5). This suggests that an increase
in observer intensity is more effective in reducing overvoting and turnout in
constituencies with low levels of competition. This pattern is consistent with a tendency
for parties to engage in fraud in areas where they are electorally dominant—and where
they presumably have strong social connections to local officials who serve as election
agents.
Something interesting emerges, however, when we consider the impact of an
additional observer on our third measure of fraud, DPP presidential vote share. Our
estimates show that the presence of observers reduces DPP vote share by 5.6 percentage
points in highly competitive constituencies (column 3) but has no statistically significant
25
effect in constituencies with low or medium levels of political competition (columns 6
and 9). This result, which is the opposite of what we see with respect to turnout and
overvoting, is in keeping with the logic of political competition at the parliamentary
level, where greater competitiveness creates stronger incentives for the dominant party to
commit fraud so as to win the seat and thereby bolster its dominance of the legislature.
The estimates on DPP presidential vote share, then, may be the up-ticket effect of fraud
conducted on behalf of candidates competing in the parliamentary races.
The logic of electoral fraud also has implications for the impact of election
observers on administrative irregularities at the polling station. As noted, our main
measure of administrative irregularities is whether or not election workers publicly
posted the polling station-level results from the presidential election immediately after
the conclusion of the counting. To test whether the assignment of an additional observer
affected the likelihood that the results were posted, we compare posting rates at polling
stations with only NICE and MEIC observers to those at polling stations in which the
NICE and MEIC observers were joined by a randomly assigned election monitor from
MESN. Column 1 in Table 4 displays our results in the full sample. At control stations,
the results were posted 46 percent of the time, whereas at treated polling stations they
were posted just 40 percent of the time. The interpretation is that the presence of the extra
observer systematically, and somewhat puzzlingly, drove down the likelihood that the
election results would be posted.
[Table 4 Here]
Columns 2-4, which break the results by region, reveal additional interesting
patterns that begin to shed light on why the presence of the additional observers would be

26
associated with higher rates of (at least this measure of) administrative irregularity.27
First, they make clear that the general effect of the additional election observer is driven
by the outcomes in the Central and Northern regions, where the presence of the MESN
monitor is associated with 9 percent (column 2) and 11 percent (column 3) reductions in
the public posting of results, respectively. In the Southern region, the presence of the
additional observer is associated with no difference in the likelihood that the results are
posted.
Second, the regional breakdown indicates that rates of posting of results are
systematically lower in the South (36 percent versus 48 percent in the rest of the country).
Since the South is the DPP stronghold, this result suggests that the DPP may have been
behind the strategy of not posting the results. Further evidence for this conjecture comes
from Figure 1, which plots the predicted probability that election officials will post the
results at different levels of DPP candidate’s vote share.28 The results show clearly that
polling stations with higher DPP vote shares were less likely to post their results. But
why would the non-posting of the presidential election results be in the DPP’s interest?
The answer may lie in the patterns of fraud that are evident at the aggregation stage.
[Figure 1 Here]
27 As Appendix table D.1 makes clear, several other measures of administrative irregularities that we do not highlight in tour main analyses for reasons described earlier are also positively associated with the presence of the additional MESN observer. Ofosu (2014) suggests that, when faced with an election observer who makes outright ballot stuffing less feasible, election officials seeking to commit fraud may shift their strategy to seemingly innocuous administrative irregularities that achieve the same ends. For example, to facilitate multiple voting by supporters of a desired party, election officials can neglect to apply ink to a voter’s finger, permit voters with inked fingers to vote again, permit voters to cast ballots even if their name is not in the voting register or if they lack a voter certificate, or even hide the voter register itself. To discourage voting by supporters of an opposing party, officials can force the elderly or people with disabilities to queue, not permit voters present at the close of polls to vote, hide ballots, or configure the polling station so as not to insure ballot secrecy. Such strategies often go undetected because party agents or observers may not immediately know their intent (Hyde, 2009). 28 The results are based on a logistic regression in which we also control for the level of electoral competition and the number of registered voters. We control for electoral competition because it may influence the incidents of fraud. We control for the number of registered voters because one may argue that higher number of register voters will place an undue pressure on election officials at the polling station and may lead them to make genuine administrative errors.
27
Estimating fraud at the aggregation stage
To estimate fraud at the aggregation stage, we compare presidential vote shares
for the DPP collected by observers at polling stations before the results were transmitted
to the district and national tally centers with the official results released by the MEC.29 In
theory, these results should be the same, and in a simple scatterplot the values for each
polling station should line up on a 45-degree line with a perfect correlation of one.
Significant departures from such a pattern therefore suggest potential fraud—especially if
those departures are above the 45-degree line (indicating that the MEC results awarded
the party more votes than the polling station-level count suggests they should have
received).30 As in our earlier analyses, we focus on the DPP, since it was the party with
the strongest connection to the Malawian electoral bureaucracy and thus the party that
possessed the greatest opportunity to orchestrate fraud at the aggregation stage.
As shown in Figure 2, which plots DPP presidential vote share as recorded by our
observers and by the MEC, the vast majority of polling station-level results do appear to
be reflected correctly in the official tallies.31 The overall correlation is 0.94. MEC’s
official results report stronger results for the DPP candidate in 10.9 percent of polling
stations, and weaker results for the DPP candidate in 8.8 percent of polling stations, a
difference that is not statistically significant at conventional levels.32 This said, it is worth
noting that a curiously large number of the polling stations in which the official results
favored the DPP are located right on the x=0 line—that is, in constituencies in which the
observers recorded almost no votes for the DPP (and in which the DPP would
29 This method is analogous to that employed in Callen and Long (2015) and Callen et al (forthcoming). 30 Of course, unintentional errors in the recording of polling station-level tallies or in the aggregation of tallies at the district or regional level may also lead to discrepancies—and the Malawian media did in fact report on some such errors in the aftermath of the election. But if these errors are truly unintentional, then they should be randomly distributed, not skewed in favor of one party. 31 Indeed, the frequency of discrepancies is just one seventh that reported by Callen and Long (2015) in Afghanistan’s 2010 parliamentary elections. 32 All such calculations exclude deviations less than 0.01 percentage points, since these are most likely to be due to inadvertent clerical errors and almost certainly do not constitute fraud.
28
presumably have a strong interest in registering at least some support).
[Figure 2 Here]
When we break down these results into polling stations in which the presidential
election results were publicly posted (Figure 3, top panel) and in which they were not
(Figure 3, bottom panel), we find interesting differences. In the former, the correlation
between the MEC and observer tallies is 0.96 and the share of polling stations in which
the observers’ recording of DPP presidential vote share exceeds the official MEC figure
is actually greater than the share where the reverse is true (10 percent versus 5.6 percent).
But in the polling stations where the results were not publicly posted, the official results
and the observers’ tallies diverge significantly—and overwhelmingly in favor of the DPP.
The overall correlation slips to 0.93, and now the official results give the DPP candidate
an advantage over the observers’ results 15 percent of the time, whereas the MEC results
disadvantage the DPP just 7.8 percent of the time. Here the tendency for the deviations
from the 45-degree line to be located in polling stations in which the observers recorded a
value of zero (or very close to it) is even more apparent. Such polling stations are ones in
which the DPP received no electoral support at all in the presidential election but the
official results nonetheless accorded the DPP candidate a large number of votes.
[Figure 3 Here]
The results thus far suggest that at least some aggregation errors took place during
Malawi’s 2014 presidential elections, that the DPP benefited from the errors, and that the
errors were more likely to take place in polling stations in which, contrary to the law, the
presidential election results were not publicly posted. Taken together, these findings look
suspiciously like fraud perpetrated on behalf of the DPP, facilitated by the non-posting of
the polling station-level election results.
Earlier, we noted that the non-posting of results was more likely to occur at
29
polling stations that had been randomly selected to receive an additional election
observer. It turns out that these polling stations are also more likely to have discrepancies
between the official MEC results and the results collected by our observers. The top
panel in Figure 4 compares the MEC and observer results in polling stations to which
MESN observers were not sent, and the bottom panel reproduces the figure for the
polling stations that received the extra observer. In the former, the correlation is 0.96, and
the share of polling stations whose values lie above the 45-degree line (9.3 percent) is
almost exactly the same as the share whose values lie below it (8.7 percent). In the treated
polling stations, by contrast, the correlation falls to 0.92 and the share of units in which
the MEC tally exceeds the observers’ tally is now significantly higher (13.2 percent
versus 8.8 percent). The presence of the additional observer is associated with a greater
likelihood of “errors” at the aggregation stage that favor the DPP. If we interpret these
“errors” as fraud, then the randomized deployment of the observers permits us to interpret
the association between the presence of the observer and the greater likelihood of fraud as
a causal effect. Combined with the findings summarized earlier regarding the non-posting
of results, the implication would appear to be that the presence of the MESN observers
caused the fraud to be displaced to the aggregation phase. The fact that, once again, the
preponderance of the off-diagonal cases in the bottom panel are all polling stations in
which the observers recorded DPP vote shares of zero is consistent with this account. Not
able to perpetrate fraud on election day due to the presence of the additional observer, the
DPP was forced to compensate by doubling down on fraud at the aggregation stage.
[Figure 4 Here]
Discussion
Our findings corroborate and extend recent empirical work that suggests that
30
domestic election observers can reduce the incidence of fraud at the polling stations to
which they are deployed. Yet our results add a new wrinkle to this literature by
demonstrating an effect of deploying observers in a setting where other domestic
monitors are already present. One would think that the marginal effect of an additional—
in the setting we study, a third—observer would be quite small. Yet we find substantively
significant effects.
One possible explanation for this surprising finding is that the MESN observers
were better trained, more visible, more independent, or perhaps less likely to be recruited
from the local community (and hence less susceptible to local political pressure) than the
observers sent by NICE or MEIC. Although we cannot completely rule out these
possibilities, our investigations into the recruitment, training, and conduct of the
observers deployed by these other domestic monitoring organizations provides little
support for these hypotheses.
An alternative explanation lies instead in the opportunities afforded to would-be
perpetrators of fraud by the fact that many polling stations contained multiple streams
and that observers were each assigned to just one of them. In polling stations with more
than two streams, the presence of NICE and MEIC observers may simply have displaced
the fraud to other, unmonitored streams. In polling stations with two or fewer streams, the
NICE and MEIC observers should have already covered all of them, so the addition of
the MESN observer should have had little effect. In polling stations with three streams,
the additional observer would have completed the coverage and should have led to a large
reduction in fraud. And in polling stations with four or more streams, the addition of the
MESN observer would have increased the level of monitoring but still left at least one
stream unobserved, so we would expect the effect to be somewhere between these two
extremes.
31
We test these expectations in Table 5 and find only weak support for these
conjectures.33 The effect of the additional observer is, in fact, weakest in three-stream
polling stations, where that observer would have completed the coverage, and strongest in
polling stations with one stream or with four of more.
[Table 5 Here]
Conclusion
Our findings suggest that there was indeed fraud in Malawi’s 2014 elections,
though not nearly enough to account for the results of (at least) the presidential contest,
which DPP candidate Peter Mutharika won by more than eight percentage points. Our
results also suggest that the presence of election observers reduces fraud: turnout,
overvoting, and the vote share for Mutharika—the presidential candidate with the closest
ties to the electoral bureaucracy, the most developed grassroots organization and the
greatest capacity for rigging—were all significantly lower in polling stations to which we
randomly assigned a MESN observer. Our study thus joins several others in showing that
election monitors matter and that randomizing their deployment, and then comparing
outcomes in observed and unobserved polling stations, provides a means of estimating
electoral fraud.
Our research also goes beyond existing work in at least three important ways.
First, we show that the effects of deploying election observers hold even in contexts
where polling stations are already being monitored. The MESN observers that we
assigned to polling stations did not transform them from “unobserved” to “observed,” as
in other studies, but rather augmented the observation teams that had already been
deployed by NICE and MEIC. Our study therefore puts us in a position to ascertain
33 Since the number of streams at a polling station is not randomly assigned, these findings can be regarded only as suggestive.
32
whether adding an additional observer to a polling station has a marginal effect of further
reducing incidents of fraud or irregularities. We show unambiguously that it does.
Second, we provide evidence that the presence of the additional observer may
have displaced fraud from election day to the aggregation phase of the electoral process,
and that the non-posting of the presidential election results at the polling station, as
required by law, may have been part of the strategy to make the aggregation fraud more
difficult to detect. This finding suggests that researchers interested in the spillover effects
of election monitoring should be equally attuned to spillovers across time as across space.

33
References
Asunka, Joseph, Sarah Brierley, Eric Kramon and George Ofosu. 2015. “Do Election Observers Reduce Fraud? Evidence from a Field Experiment in Ghana.” Unpublished paper.
Asunka, Joseph, Sarah Brierley, Miriam Golden, Eric Kramon and George Ofosu. 2013.
“Protecting the Polls: The Effect of Observers on Election Fraud.” Unpublished paper.
Beber, Bernd and Alexandra Scacco. 2008. “What the Numbers Say: A Digit-based Test
for Election Fraud Using New Data from Nigeria.” Unpublished paper. Birch, Sarah. 2007. “Electoral Systems and Electoral Misconduct.” Comparative
Political Studies 40(12): 1533–1556. Bjornlund, Eric. 2004. Beyond Free and Fair: Monitoring Elections and Building
Democracy. Washington, DC: Woodrow Wilson Center Press. Callen, Michael and James D. Long. 2015. “Institutional Corruption and Election Fraud:
Evidence from a Field Experiment in Afghanistan.” American Economic Review 105(1): 354-381.
Callen, Michael, Clark C. Gibson, Danielle F. Jung, and James D. Long. Forthcoming.
“Improving Electoral Integrity with Information and Communications Technology.” Journal of Experimental Political Science
Carothers, Thomas. 1997. “The Observers Observed.” Journal of Democracy 8(3): 17–
31. Chirwa, Wiseman Chijere. 2014. Malawi: Democracy and Political Participation.
AfriMAP: Open Society Initiative for Southern Africa. Dionne, Kim Yi and Boniface Dulani. 2013. “Constitutional Provisions and Executive
Succession: Malawi’s 2012 Transition in Comparative Perspective.” African Affairs 112(446): 111–137.
Enikolopov, Ruben, Vasily Korovkin, Maria Petrova, Konstantin Sonin and Alexei
Zakharov. 2013. “Field Experiment Estimate of Electoral Fraud in Russian Parliamentary Elections.” Proceedings of the National Academy of Sciences 110(2): 448–452.
Gerber, Alan S, Donald P Green and Christopher W Larimer. 2008. “Social Pressure and
Voter Turnout: Evidence from a Large-Scale Field Experiment.” American Political Science Review 102(01): 33–48.
34
Hartlyn, Jonathan, Jennifer McCoy and Thomas M. Mustillo. 2008. “Electoral Governance Matters.” Comparative Political Studies 41(1): 73-98.
Herron, Erik S. 2010. “The Effect of Passive Observation Methods on Azerbaijan’s 2008
Presidential Election and 2009 Referendum.” Electoral Studies 29(3): 417–424. Hyde, Susan D. 2007. “The Observer Effect in International Politics: Evidence from a
Natural Experiment.” World Politics 60(1): 37–63. Hyde, Susan D. 2009. “How International Observers Detect and Deter Fraud.” In Michael
Alvarez, Thad E Hall and Susan D Hyde, eds. Election Fraud: Detecting and Deterring Electoral Manipulation. Washington, DC: Brookings Institution Press: 201–215.
Hyde, Susan D. 2010. “Experimenting in Democracy Promotion: International Observers
and the 2004 Presidential Elections in Indonesia.” Perspectives on Politics 8(2): 511–527.
Hyde, Susan D. and Kevin Pallister. 2014. “Election Administration, Election
Observation and Election Quality.” In Jennifer Gandhi and Ruben Ruiz-Rufino, eds. Routledge Handbook of Comparative Institutions. London: Routledge: 241-257.
Ichino, Nahomi and Matthias Schündeln. 2012. “Deterring or displacing electoral
irregularities? Spillover effects of observers in a randomized field experiment in Ghana.” The Journal of Politics 74(01): 292–307.
Kelley, Judith. 2012. Monitoring Democracy: When International Election Observation
Works, and Why it Often Fails. Princeton: Princeton University Press. Kitschelt, Herbert and Steven I. Wilkinson. 2007. Patrons, Clients and Policies: Patterns
of Democratic Accountability and Political Competition. New York: Cambridge University Press.
Lehoucq, Fabrice. 2003. “Electoral Fraud : Causes, Types, and Consequences.” Annual
Review of Political Science 6(1): 233–256. Logan, Corolyn, Michael Bratton and Boniface Dulani. 2014. “Malawi’s 2014 Elections:
Amid Concerns About Fairness, Outcome is Too Close to Call.” Afrobarometer technical report.
MESN. 2014. “Election Report: 20 May, 2014 Tripartite Elections in Malawi.” Technical
report. Myagkov, Mikhail G, Peter C Ordeshook and Dimitri Shakin. 2009. The Forensics of
Election Fraud: Russia and Ukraine. New York: Cambridge University Press.

35
Ofosu, George. 2014. “Electoral Malpractices and Fraud.” Unpublished paper. Pastor, Robert A. 1999. “The Role of Electoral Administration in Democratic
Transitions: Implications for policy and research.” Democratization 6(4): 1–27. Sjoberg, Fredrik. 2012. “Making Voters Count: Evidence from Field Experiments about
the Efficacy of Domestic Election Observation.” Unpublished paper. Smiddy, Kimberly and Daniel J. Young. 2009. “Presidential and Parliamentary Elections
in Malawi, May 2009.” Electoral Studies 28(4): 662–666. Stokes, Susan C., Thad Dunning, Marcelo Nazareno, and Valeria Brusco. 2013. Brokers,
Voters and Clientelism: The Puzzle of Distributive Politics. New York: Cambridge University Press.
Weidmann, Nils B. and Michael Callen. 2013. “Violence and Election Fraud: Evidence
from Afghanistan.” British Journal of Political Science 43(1): 53–75. Ziblatt, Daniel. 2009. “Shaping Democratic Practice and the Causes of Electoral Fraud:
The Case of Nineteenth-Century Germany.” American Political Science Review 103(1): 1–21.
36
Table 1: Summary Statistics of Measures of Fraud and Irregularities
Full Sample (N=896) Treated (N=349) Control (N=547) Turnout 0.73 0.71 0.75
(0.19) (0.15) (0.21) Overvoting 0.03 0.01 0.04
(0.17) (0.11) (0.20) DPP vote share 0.32 0.30 0.33
(0.29) (0.29) (0.29) Posting results 0.421 0.396 0.456
(0.494) (0.489) (0.498) Note: Table 1 shows the summary statistics of our outcome variables. We present the mean and standard deviation (in parentheses) in the full sample and for treatment and control stations. Turnout is calculated by dividing reported total votes cast by the number of registered voters provided by the election authority ahead of the polls. Polling stations that record turnout rates over 100 percent are coded as exhibiting overvoting (=1). DPP represents the Democratic Peoples’ Party. Lastly, Posting of results is binary variable which codes whether the presidential result sheet was posted when our enumerators visited the polling station after counting was closed.
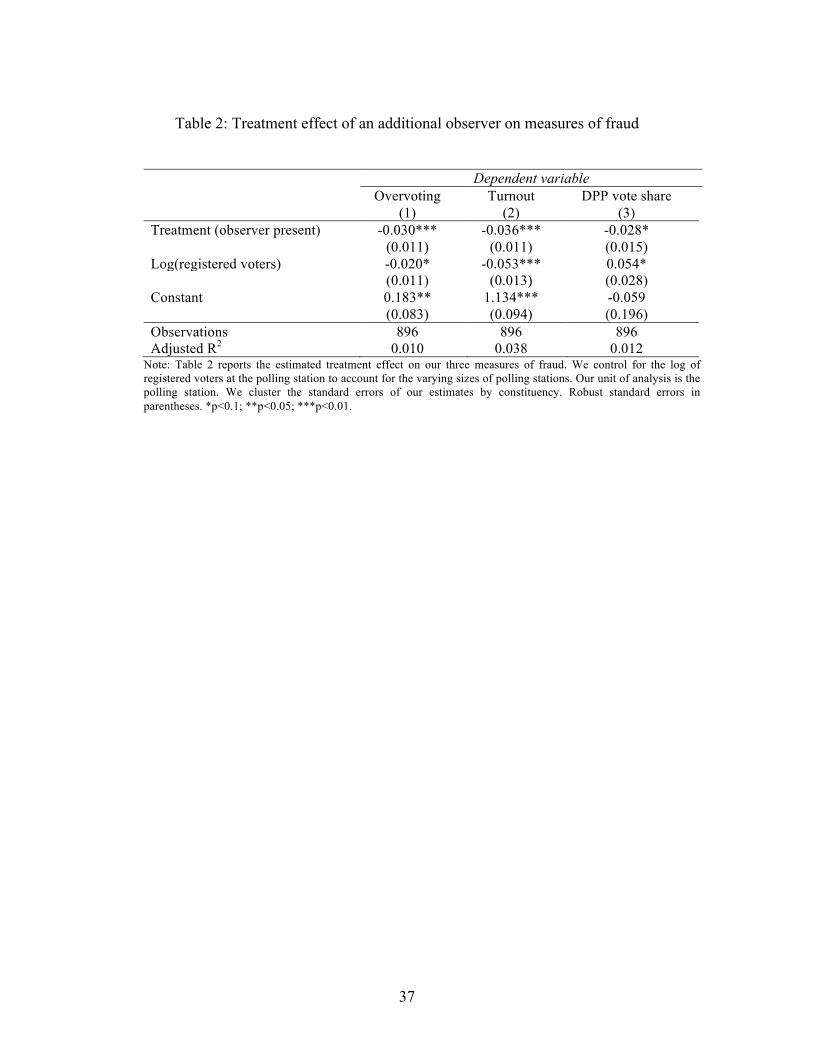
37
Table 2: Treatment effect of an additional observer on measures of fraud
Dependent variable Overvoting
(1) Turnout
(2) DPP vote share
(3) Treatment (observer present) -0.030*** -0.036*** -0.028* (0.011) (0.011) (0.015) Log(registered voters) -0.020* -0.053*** 0.054* (0.011) (0.013) (0.028) Constant 0.183** 1.134*** -0.059 (0.083) (0.094) (0.196) Observations 896 896 896 Adjusted R2 0.010 0.038 0.012
Note: Table 2 reports the estimated treatment effect on our three measures of fraud. We control for the log of registered voters at the polling station to account for the varying sizes of polling stations. Our unit of analysis is the polling station. We cluster the standard errors of our estimates by constituency. Robust standard errors in parentheses. *p<0.1; **p<0.05; ***p<0.01.
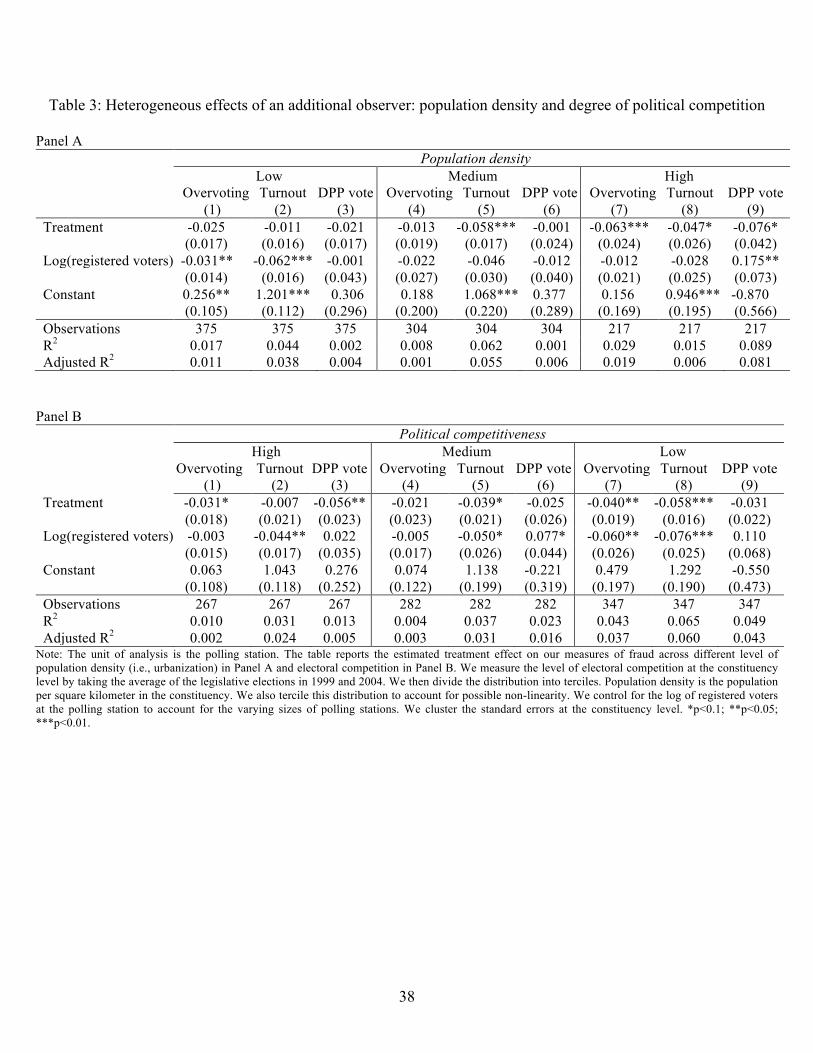
38
Table 3: Heterogeneous effects of an additional observer: population density and degree of political competition
Panel A Population density Low Medium High Overvoting
(1) Turnout
(2) DPP vote
(3) Overvoting
(4) Turnout
(5) DPP vote
(6) Overvoting
(7) Turnout
(8) DPP vote
(9) Treatment -0.025 -0.011 -0.021 -0.013 -0.058*** -0.001 -0.063*** -0.047* -0.076* (0.017) (0.016) (0.017) (0.019) (0.017) (0.024) (0.024) (0.026) (0.042) Log(registered voters) -0.031** -0.062*** -0.001 -0.022 -0.046 -0.012 -0.012 -0.028 0.175** (0.014) (0.016) (0.043) (0.027) (0.030) (0.040) (0.021) (0.025) (0.073) Constant 0.256** 1.201*** 0.306 0.188 1.068*** 0.377 0.156 0.946*** -0.870 (0.105) (0.112) (0.296) (0.200) (0.220) (0.289) (0.169) (0.195) (0.566) Observations 375 375 375 304 304 304 217 217 217 R2 0.017 0.044 0.002 0.008 0.062 0.001 0.029 0.015 0.089 Adjusted R2 0.011 0.038 0.004 0.001 0.055 0.006 0.019 0.006 0.081
Panel B Political competitiveness High Medium Low Overvoting
(1) Turnout
(2) DPP vote
(3) Overvoting
(4) Turnout
(5) DPP vote
(6) Overvoting
(7) Turnout
(8) DPP vote
(9) Treatment -0.031* -0.007 -0.056** -0.021 -0.039* -0.025 -0.040** -0.058*** -0.031 (0.018) (0.021) (0.023) (0.023) (0.021) (0.026) (0.019) (0.016) (0.022) Log(registered voters) -0.003 -0.044** 0.022 -0.005 -0.050* 0.077* -0.060** -0.076*** 0.110 (0.015) (0.017) (0.035) (0.017) (0.026) (0.044) (0.026) (0.025) (0.068) Constant 0.063 1.043 0.276 0.074 1.138 -0.221 0.479 1.292 -0.550 (0.108) (0.118) (0.252) (0.122) (0.199) (0.319) (0.197) (0.190) (0.473) Observations 267 267 267 282 282 282 347 347 347 R2 0.010 0.031 0.013 0.004 0.037 0.023 0.043 0.065 0.049 Adjusted R2 0.002 0.024 0.005 0.003 0.031 0.016 0.037 0.060 0.043
Note: The unit of analysis is the polling station. The table reports the estimated treatment effect on our measures of fraud across different level of population density (i.e., urbanization) in Panel A and electoral competition in Panel B. We measure the level of electoral competition at the constituency level by taking the average of the legislative elections in 1999 and 2004. We then divide the distribution into terciles. Population density is the population per square kilometer in the constituency. We also tercile this distribution to account for possible non-linearity. We control for the log of registered voters at the polling station to account for the varying sizes of polling stations. We cluster the standard errors at the constituency level. *p<0.1; **p<0.05; ***p<0.01.

39
Table 4: Effect of observers on the posting of presidential results, by region
National (1)
Central (2)
Northern (3)
Southern (4)
Treatment (observer present) 0.40 0.42 0.42 0.36 (0.02) (0.03) (0.03) (0.03) Control (no observer) 0.46 0.51 0.54 0.36 (0.02) (0.03) (0.04) (0.03) ATE -0.059 -0.092 -0.111 -0.001 (0.028) (0.047) (0.059) (0.043)
Note: Table 4 shows the mean outcome for the posting of presidential results sheets in treated and control stations in the full sample (national) and by region. Standard errors are reported in parentheses. Table 4 also shows the treatment effect of MESN observers on the posting of results in the full sample and by region.

40
Table 5: Effect of an additional observer on measures of fraud, disaggregated by the number of streams
One stream Two streams Three streams Four or more streams Overvoting Turnout DPP vote Overvoting Turnout DPP vote Overvoting Turnout DPP vote Overvoting Turnout DPP vote (1) (2) (3) (4) (5) (6) (7) (8) (9) (10) (11) (12) Treatment -0.061** -0.053* -0.045 -0.036** -0.035** -0.034* -0.003 -0.016 -0.028 -0.044** -0.057** 0.005 (0.024) (0.030) (0.052) (0.017) (0.018) (0.020) (0.021) (0.025) (0.038) (0.021) (0.028) (0.048) Log(voters) -0.074 -0.075 -0.145** -0.070 -0.113* 0.014 -0.266* -0.200 0.028 -0.001 -0.065* 0.084 (0.086) (0.086) (0.071) (0.068) (0.065) (0.068) (0.154) (0.124) (0.131) (0.017) (0.035) (0.064) Constant 0.529 1.285* 1.229*** 0.541 1.544*** 0.205 2.028* 2.224** 0.102 0.050 1.262*** -0.265 (0.552) (0.538) (0.453) (0.482) (0.459) (0.478) (1.169) (0.940) (0.995) (0.137) (0.289) (0.547) Observations 139 139 139 411 411 411 191 191 191 155 155 155 R2 0.035 0.022 0.040 0.017 0.031 0.004 0.084 0.036 0.002 0.019 0.031 0.007 Adjusted R2 0.02 0.008 0.026 0.012 0.026 -0.001 0.074 0.026 -0.008 0.006 0.018 -0.006
Note: Table 5 reports the estimated treatment effect on our three measures of fraud for polling stations with different numbers of streams. We control for the log of registered voters at the polling station to account for the varying sizes of polling stations. Our unit of analysis is the polling station. We cluster the standard errors of our estimates by constituency. Robust standard errors in parentheses. *p<0.1; **p<0.05; ***p<0.01

41
Figure 1: Relationship between DPP presidential vote share and the public posting of results

42
Figure 2: DPP presidential vote share, as recorded by our observers and officially released by the MEC
0
0.2
0.4
0.6
0.8
1
0 0.2 0.4 0.6 0.8 1
official re
sults provide
d by M
EC
data collected by our observers
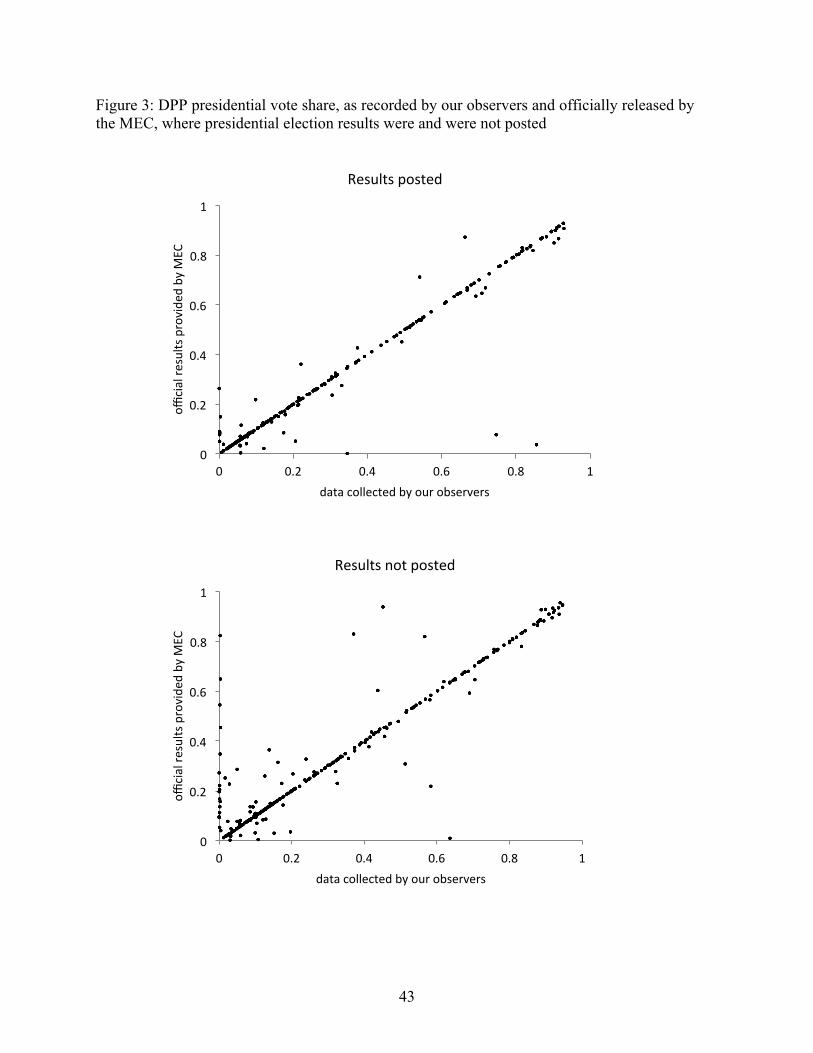
43
Figure 3: DPP presidential vote share, as recorded by our observers and officially released by the MEC, where presidential election results were and were not posted
Results posted
Results not posted
0
0.2
0.4
0.6
0.8
1
0 0.2 0.4 0.6 0.8 1
official re
sults provide
d by M
EC
data collected by our observers
0
0.2
0.4
0.6
0.8
1
0 0.2 0.4 0.6 0.8 1
official re
sults provide
d by M
EC
data collected by our observers

44
Figure 4: DPP presidential vote share, as recorded by our observers and officially released by the MEC, where an additional MESN observer was and was not present
No additional MESN observer present
Additional MESN observer present
0
0.2
0.4
0.6
0.8
1
0 0.2 0.4 0.6 0.8 1
official re
sults provide
d by M
EC
data collected by our observers
0
0.2
0.4
0.6
0.8
1
0 0.2 0.4 0.6 0.8 1
official re
sults provide
d by M
EC
data collected by our observers

Appendix
A Sampling of constituencies
Table A.1: Distribution of constituenciesRegion National (%) Sample (%)
(n) (n)Northern 17 16
(33) (14)Central 38 37
(73) (33)Sourthern 45 48
(87) (43)Total 100 100
(193) (90)Notes: This table shows the distribution of constituencies across Malawi’s three regions and in our sample. It report the proportionof constituencies in each region at the national level and in our sample. There are 193 constituencies across the three regions andwe select 90 as our study sample. To select our constituencies, we stratified on literacy rates, unemployment rates, populationdensity, urbanization, and electoral competition. In our stratified sampling, the probability of inclusion for constituencies is equalto the probability of sampling within each region.
Table A.2: Summary statistics of constituenciesNational Sample
Variable Average SD Average SDRegistered voters 39090.2 17703.2 39050.3 19557.2# Polling stations 23.0 9.3 22.8 9.3#Polling streams 60.2 24.5 60.1 26.7Males with primary education (%) 72.2 7.4 72.2 7.5Pecentage of rural pop. 96.1 3.7 96.1 3.8Male literacy 67.1 7.2 67.1 7.1Female literacy 57.1 9.9 57.0 9.6Population density(pop per 1KM2) 160.2 85.7 160.4 82.9Male unemployment 12.6 8.9 13.1 9.1Female Unemployment 16.4 10.9 16.3 10.9Legislative vote margin (2004) 0.2 0.2 0.2 0.2Legislative vote margin (1999) 0.4 0.2 0.4 0.2Average Vote Margin(99&04) 0.3 0.2 0.3 0.2
Notes: Table shows the summary statistics of constituencies in the population and in our sample. We use electoral data collectedfrom the MEC. Demographic data was obtained from Malawi’s National Statistics Office website (http://www.nsomalawi.mw/).The summary statistic shows we have a representative sample of constituencies.
1

Table A.3: Summary statistics of constituency level variables
Mean SD
CompetitionHigh(competition) 0.139 0.068Medium (competition) 0.334 0.043Low (competitive) 0.525 0.086
Population Density (PD)High(PD) 260.31 61.38Medium (PD) 163.43 29.13Low (PD) 81.41 29.13
Note:The unit of analysis is the constituency. Table shows summary statistics of the levels of competition, population density andobserver intensity that we use in our analysis.
B Balance Table
Table B.1: Verification of randomizationControl Treated Mean difference P-value
Number of Voters 1699.69 1694.30 -5.39 0.928Number of polling streams 2.63 2.63 0.01 0.905
Notes: Table shows the balance balance between treated and control stations on our pre-treatment variables(i.e., number of registered voters and the number of polling streams). Data was collected from the MalawiElectoral Commission.
2

C Effect of election observers our alternative measure of suspicious turnout
Table C.1: Effects of observers on turnout (alternative measure)
Dependent variable:
Suspicious turnout
Treatment −0.029∗∗∗
(0.011)
Log(Reg. Voters) −0.024∗∗
(0.012)
Constant 0.218∗∗
(0.089)
Observations 896Adjusted R2 0.011
Note: ∗p<0.1; ∗∗p<0.05; ∗∗∗p<0.01
Notes: Table C.1 shows the treatment effect of observers on our alternative measure of fraud. We code astation as recording a suspicious turnout if its reported turnout is more than two standard deviation awayfrom the constituency mean turnout. We find that the turnout rates of 3.2% stations to be suspicious usingthis measure in our sample.
3
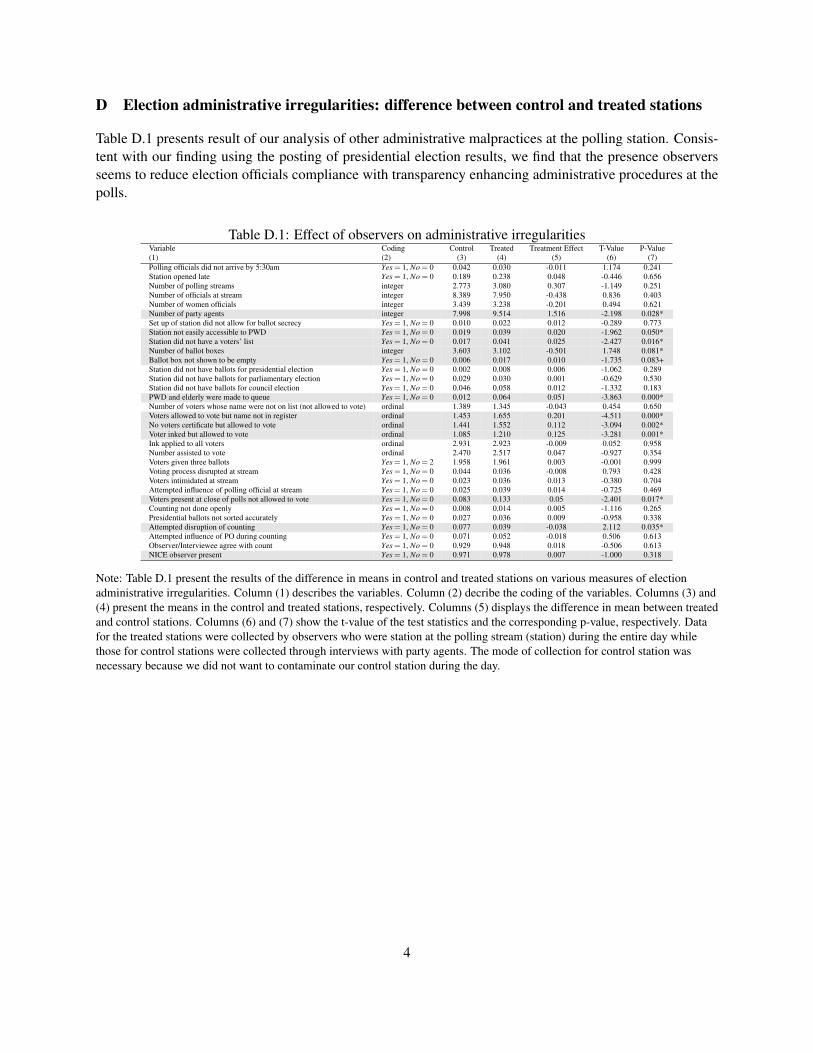
D Election administrative irregularities: difference between control and treated stations
Table D.1 presents result of our analysis of other administrative malpractices at the polling station. Consis-tent with our finding using the posting of presidential election results, we find that the presence observersseems to reduce election officials compliance with transparency enhancing administrative procedures at thepolls.
Table D.1: Effect of observers on administrative irregularitiesVariable Coding Control Treated Treatment Effect T-Value P-Value(1) (2) (3) (4) (5) (6) (7)Polling officials did not arrive by 5:30am Yes = 1, No = 0 0.042 0.030 -0.011 1.174 0.241Station opened late Yes = 1, No = 0 0.189 0.238 0.048 -0.446 0.656Number of polling streams integer 2.773 3.080 0.307 -1.149 0.251Number of officials at stream integer 8.389 7.950 -0.438 0.836 0.403Number of women officials integer 3.439 3.238 -0.201 0.494 0.621Number of party agents integer 7.998 9.514 1.516 -2.198 0.028*Set up of station did not allow for ballot secrecy Yes = 1, No = 0 0.010 0.022 0.012 -0.289 0.773Station not easily accessible to PWD Yes = 1, No = 0 0.019 0.039 0.020 -1.962 0.050*Station did not have a voters’ list Yes = 1, No = 0 0.017 0.041 0.025 -2.427 0.016*Number of ballot boxes integer 3.603 3.102 -0.501 1.748 0.081*Ballot box not shown to be empty Yes = 1, No = 0 0.006 0.017 0.010 -1.735 0.083+Station did not have ballots for presidential election Yes = 1, No = 0 0.002 0.008 0.006 -1.062 0.289Station did not have ballots for parliamentary election Yes = 1, No = 0 0.029 0.030 0.001 -0.629 0.530Station did not have ballots for council election Yes = 1, No = 0 0.046 0.058 0.012 -1.332 0.183PWD and elderly were made to queue Yes = 1, No = 0 0.012 0.064 0.051 -3.863 0.000*Number of voters whose name were not on list (not allowed to vote) ordinal 1.389 1.345 -0.043 0.454 0.650Voters allowed to vote but name not in register ordinal 1.453 1.655 0.201 -4.511 0.000*No voters certificate but allowed to vote ordinal 1.441 1.552 0.112 -3.094 0.002*Voter inked but allowed to vote ordinal 1.085 1.210 0.125 -3.281 0.001*Ink applied to all voters ordinal 2.931 2.923 -0.009 0.052 0.958Number assisted to vote ordinal 2.470 2.517 0.047 -0.927 0.354Voters given three ballots Yes = 1, No = 2 1.958 1.961 0.003 -0.001 0.999Voting process disrupted at stream Yes = 1, No = 0 0.044 0.036 -0.008 0.793 0.428Voters intimidated at stream Yes = 1, No = 0 0.023 0.036 0.013 -0.380 0.704Attempted influence of polling official at stream Yes = 1, No = 0 0.025 0.039 0.014 -0.725 0.469Voters present at close of polls not allowed to vote Yes = 1, No = 0 0.083 0.133 0.05 -2.401 0.017*Counting not done openly Yes = 1, No = 0 0.008 0.014 0.005 -1.116 0.265Presidential ballots not sorted accurately Yes = 1, No = 0 0.027 0.036 0.009 -0.958 0.338Attempted disruption of counting Yes = 1, No = 0 0.077 0.039 -0.038 2.112 0.035*Attempted influence of PO during counting Yes = 1, No = 0 0.071 0.052 -0.018 0.506 0.613Observer/Interviewee agree with count Yes = 1, No = 0 0.929 0.948 0.018 -0.506 0.613NICE observer present Yes = 1, No = 0 0.971 0.978 0.007 -1.000 0.318
Note: Table D.1 present the results of the difference in means in control and treated stations on various measures of electionadministrative irregularities. Column (1) describes the variables. Column (2) decribe the coding of the variables. Columns (3) and(4) present the means in the control and treated stations, respectively. Columns (5) displays the difference in mean between treatedand control stations. Columns (6) and (7) show the t-value of the test statistics and the corresponding p-value, respectively. Datafor the treated stations were collected by observers who were station at the polling stream (station) during the entire day whilethose for control stations were collected through interviews with party agents. The mode of collection for control station wasnecessary because we did not want to contaminate our control station during the day.
4
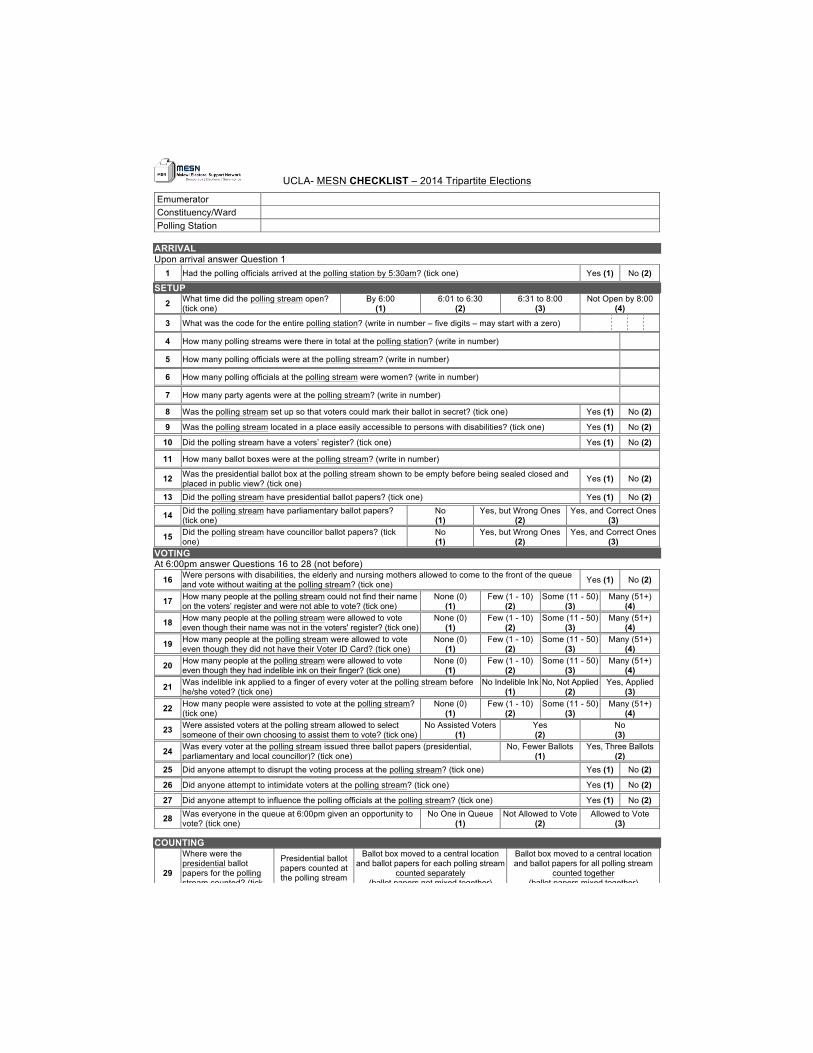
UCLA- MESN CHECKLIST – 2014 Tripartite Elections
Emumerator Constituency/Ward Polling Station
ARRIVAL Upon arrival answer Question 1
1 Had the polling officials arrived at the polling station by 5:30am? (tick one) Yes (1) No (2)
SETUP 2 What time did the polling stream open?
(tick one) By 6:00
(1) 6:01 to 6:30
(2) 6:31 to 8:00
(3) Not Open by 8:00
(4)
3 What was the code for the entire polling station? (write in number – five digits – may start with a zero)
4 How many polling streams were there in total at the polling station? (write in number)
5 How many polling officials were at the polling stream? (write in number)
6 How many polling officials at the polling stream were women? (write in number)
7 How many party agents were at the polling stream? (write in number)
8 Was the polling stream set up so that voters could mark their ballot in secret? (tick one) Yes (1) No (2)
9 Was the polling stream located in a place easily accessible to persons with disabilities? (tick one) Yes (1) No (2)
10 Did the polling stream have a voters’ register? (tick one) Yes (1) No (2)
11 How many ballot boxes were at the polling stream? (write in number)
12 Was the presidential ballot box at the polling stream shown to be empty before being sealed closed and placed in public view? (tick one) Yes (1) No (2)
13 Did the polling stream have presidential ballot papers? (tick one) Yes (1) No (2)
14 Did the polling stream have parliamentary ballot papers? (tick one)
No (1)
Yes, but Wrong Ones (2)
Yes, and Correct Ones (3)
15 Did the polling stream have councillor ballot papers? (tick one)
No (1)
Yes, but Wrong Ones (2)
Yes, and Correct Ones (3)
VOTING At 6:00pm answer Questions 16 to 28 (not before)
16 Were persons with disabilities, the elderly and nursing mothers allowed to come to the front of the queue and vote without waiting at the polling stream? (tick one) Yes (1) No (2)
17 How many people at the polling stream could not find their name on the voters’ register and were not able to vote? (tick one)
None (0) (1)
Few (1 - 10) (2)
Some (11 - 50) (3)
Many (51+) (4)
18 How many people at the polling stream were allowed to vote even though their name was not in the voters' register? (tick one)
None (0) (1)
Few (1 - 10) (2)
Some (11 - 50) (3)
Many (51+) (4)
19 How many people at the polling stream were allowed to vote even though they did not have their Voter ID Card? (tick one)
None (0) (1)
Few (1 - 10) (2)
Some (11 - 50) (3)
Many (51+) (4)
20 How many people at the polling stream were allowed to vote even though they had indelible ink on their finger? (tick one)
None (0) (1)
Few (1 - 10) (2)
Some (11 - 50) (3)
Many (51+) (4)
21 Was indelible ink applied to a finger of every voter at the polling stream before he/she voted? (tick one)
No Indelible Ink (1)
No, Not Applied (2)
Yes, Applied (3)
22 How many people were assisted to vote at the polling stream? (tick one)
None (0) (1)
Few (1 - 10) (2)
Some (11 - 50) (3)
Many (51+) (4)
23 Were assisted voters at the polling stream allowed to select someone of their own choosing to assist them to vote? (tick one)
No Assisted Voters (1)
Yes (2)
No (3)
24 Was every voter at the polling stream issued three ballot papers (presidential, parliamentary and local councillor)? (tick one)
No, Fewer Ballots (1)
Yes, Three Ballots (2)
25 Did anyone attempt to disrupt the voting process at the polling stream? (tick one) Yes (1) No (2)
26 Did anyone attempt to intimidate voters at the polling stream? (tick one) Yes (1) No (2)
27 Did anyone attempt to influence the polling officials at the polling stream? (tick one) Yes (1) No (2)
28 Was everyone in the queue at 6:00pm given an opportunity to vote? (tick one)
No One in Queue (1)
Not Allowed to Vote (2)
Allowed to Vote (3)
COUNTING
29
Where were the presidential ballot papers for the polling stream counted? (tick one)
Presidential ballot papers counted at the polling stream
(1)
Ballot box moved to a central location and ballot papers for each polling stream
counted separately (ballot papers not mixed together)
(2)
Ballot box moved to a central location and ballot papers for all polling stream
counted together (ballot papers mixed together)
(3)

30 Did the polling official count the presidential ballot papers so that any polling agents and observers present could see how each ballot paper was marked? (tick one) Yes (1) No (2)
31 Were the presidential ballots correctly sorted into different piles by candidate? (tick one) Yes (1) No (2)
32 Did anyone attempt to disrupt the counting of the presidential ballots? (tick one) Yes (1) No (2)
33 Did anyone attempt to influence the polling officials during the counting of the presidential ballots? (tick one) Yes (1) No (2)
34 Did you agree with the announced results for the presidential election? (tick one) Yes (1) No (2) PRESIDENTIAL ELECTION RESULTS FOR ENTIRE POLLING STATION – These are the official posted results. Record the official presidential election results FOR THE ENTIRE POLLING STATION (not for a single polling stream) as announced by the Presiding Officer. Answers Questions 35 to 60.
35 Polling Station Code? (write in number – five digits – may start with a zero)
36 Votes for Dr. Joyce Hilda BANDA (PP)? (write in number)
37 Votes for Dr. Lazarus McCarthy CHAKWERA (MCP)? (write in number)
38 Votes for Kamuzu Walter CHIBAMBO (PETRA)? (write in number)
39 Votes for Prof. John CHISI (UP)? (write in number)
40 Votes for Friday Anderson JUMBE (NLP)? (write in number)
41 Votes for Aaron Davies Chester KATSONGA (CCP)? (write in number)
42 Votes for Mark KATSONGA PHIRI (PPM)? (write in number)
43 Votes for Atupele MULUZI (UDF)? (write in number)
44 Votes for Prof. Peter MUTHARIKA (DPP)? (write in number)
45 Votes for George NNESA (MAFUNDE)? (write in number)
46 Votes for James Mbowe NYONDO (NASAF)? (write in number)
47 Votes for Abusa Helen SINGH (UIP)? (write in number)
48 Total Valid Votes? (write in number)
49 Null and Void Ballots? (write in number)
50 Total Votes? (write in number)
51 Total number of Register Voters for the polling station? (write in number)
52 Did a DPP Agent sign the official results form for the presidential count for the polling station? (tick one)
No DPP Agent Present
(1)
DPP Agent Present, but did not Sign Form
(2)
DPP Agent Present and Signed Form
(3)
53 Did a MCP Agent sign the official results form for the presidential count for the polling station? (tick one)
No MCP Agent Present
(1)
MCP Agent Present, but did not Sign Form
(2)
MCP Agent Present and Signed Form
(3)
54 Did a PP Agent sign the official results form for the presidential count for the polling station? (tick one)
No PP Agent Present
(1)
PP Agent Present, but did not Sign Form
(2)
PP Agent Present and Signed Form
(3)
55 Did a UDF Agent sign the official results form for the presidential count for the polling station? (tick one)
No UDF Agent Present
(1)
UDF Agent Present, but did not Sign Form
(2)
UDF Agent Present and Signed Form
(3)
56 Do you believe the announced presidential results for the polling station were accurate? (tick one) Yes (1) No (2)
57 Were there any other MESN observers present at the polling station? (tick one) Yes (1) No (2)
58 Was there a NICE observer present at the polling station? (tick one) Yes (1) No (2)
59 Were there any other observers (not from MESN or NICE) present at the polling station? (tick one) Yes (1) No (2)
60 What gender was the Presiding Officer for the entire polling station? (tick one) Male (1)
Female (2)
61 Which political party do you represent? DPP MCP PP UDF INDP
62 How long were you at the polling stream?
Only for openning
Only for voting
Only for Counting
All Day